Embed Size (px)
Citation preview
BIS 360 – Lecture Nine
Ch. 13: Designing Forms and Reports
Designing Forms and Reports
• Form
A business document that contains some predefined data and it may include some areas where additional data are to be filled in.
Often, an instance of form contains results of one database table or several relevant tables.
Designing Forms and Reports
• Report
A business document that contains only predefined data; it is a passive document used only for reading and viewing.
A report typically contains data from many database records and transactions.
Questions when Designing F&R
• Who will use the form or report?
• What is the purpose of the form or report?
• When is the form or report needed and used?
• Where does the form or report need to be delivered and used?
• How many people need to use or view the form or report?
Characteristics to Consider
• User– experience, skill, motivation, education, etc.
• Task– time pressure, cost of errors, etc.
• System– platform, operating system, devices, etc.
• Environment– Social issues and environmental concerns, e.g.,
lighting, sound, interruptions, etc.
Types of Information
• Internal Use– collected, generated, or consumed within an
organization
• External Use– collected from or created for individuals and
groups external to an organization
• Turnaround Document– delivered to an external customer as an output
that can return to provide input to a system
Types of Processing
1. Online ProcessingAn immediate processing of the most recently
available data.It is needed when...
– access to data occurs randomly– results of information are not predictable– data is continuously updated -- need most
current info– users are networked
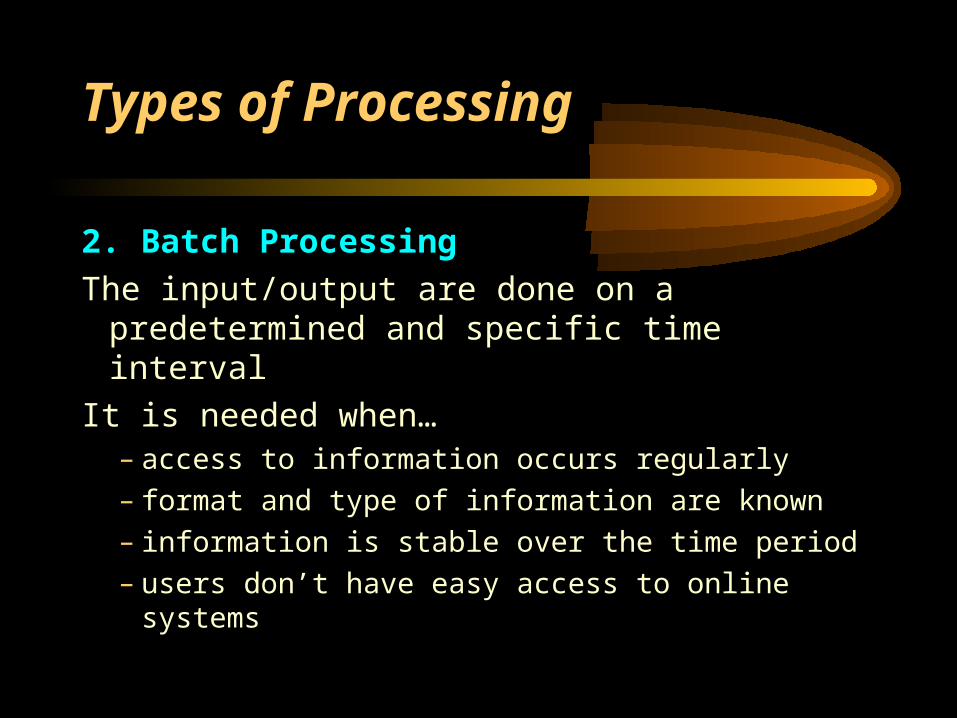
Types of Processing
2. Batch Processing
The input/output are done on a predetermined and specific time interval
It is needed when…– access to information occurs regularly– format and type of information are known– information is stable over the time period– users don’t have easy access to online systems
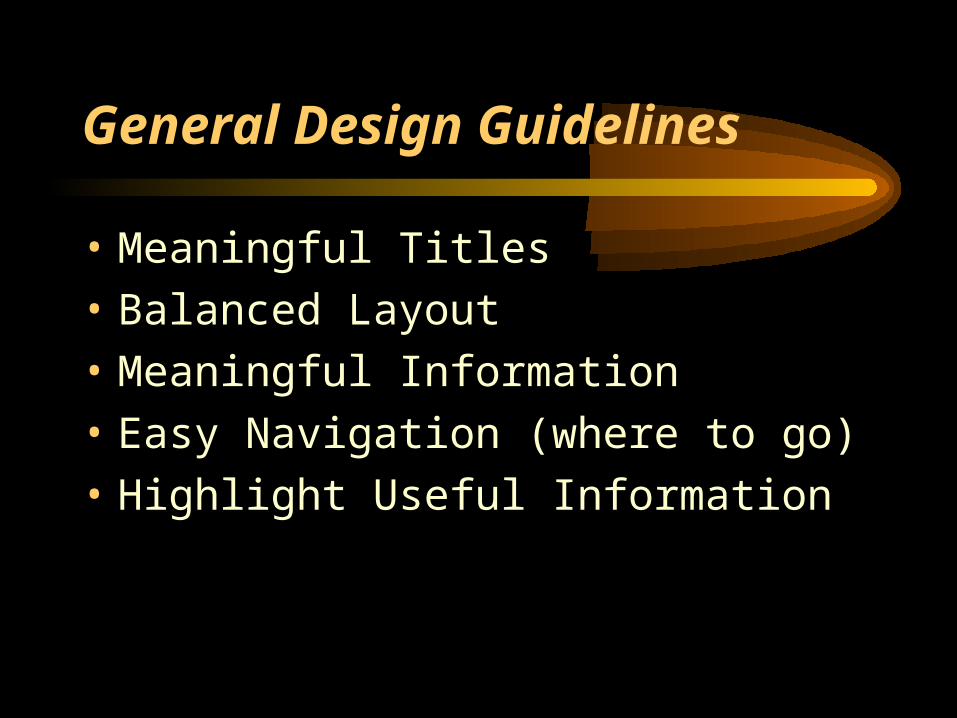
• Meaningful Titles
• Balanced Layout
• Meaningful Information
• Easy Navigation (where to go)
• Highlight Useful Information
General Design Guidelines
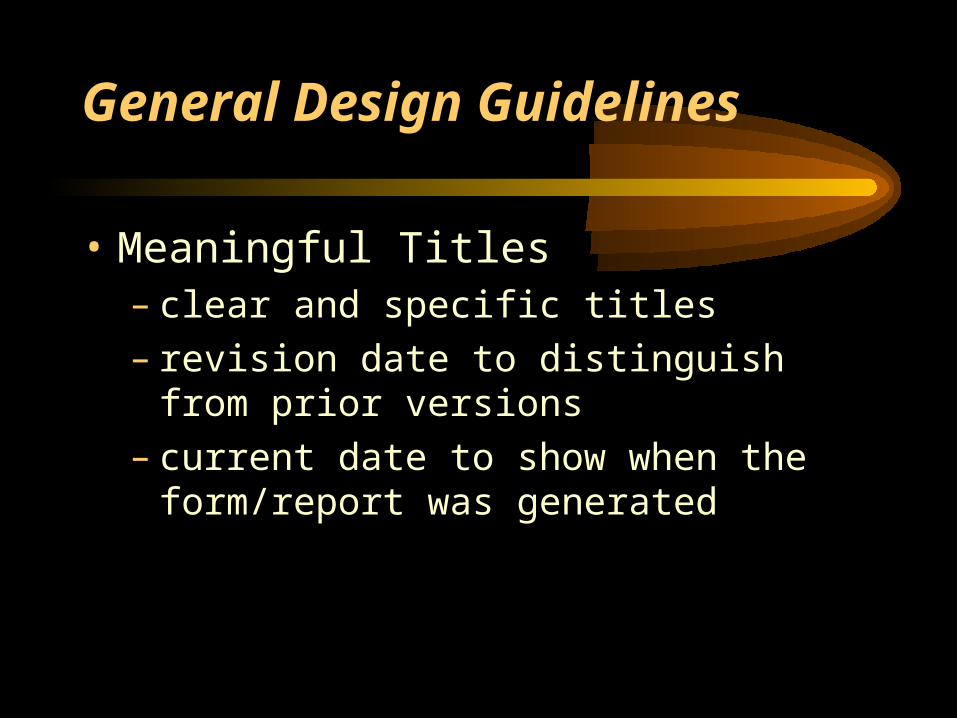
General Design Guidelines
• Meaningful Titles– clear and specific titles– revision date to distinguish from prior versions– current date to show when the form/report was
generated
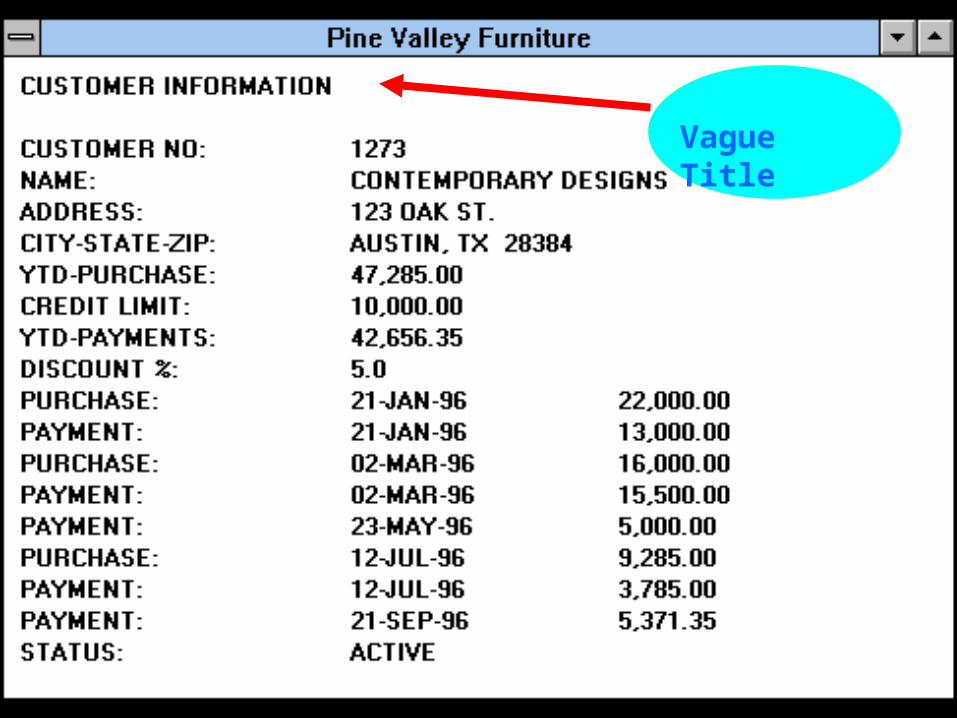
Vague Title
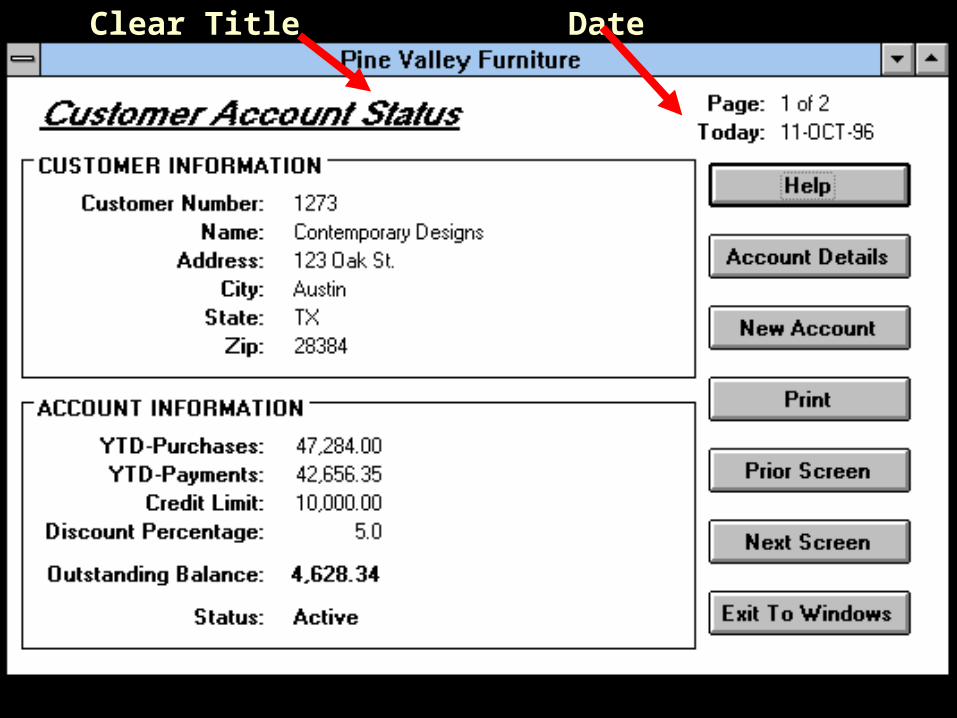
Clear Title Date
General Design Guidelines
• Balanced Layout– balanced on screen or on page– adequate spacing and margins– all data and entry fields should be clearly
labeled
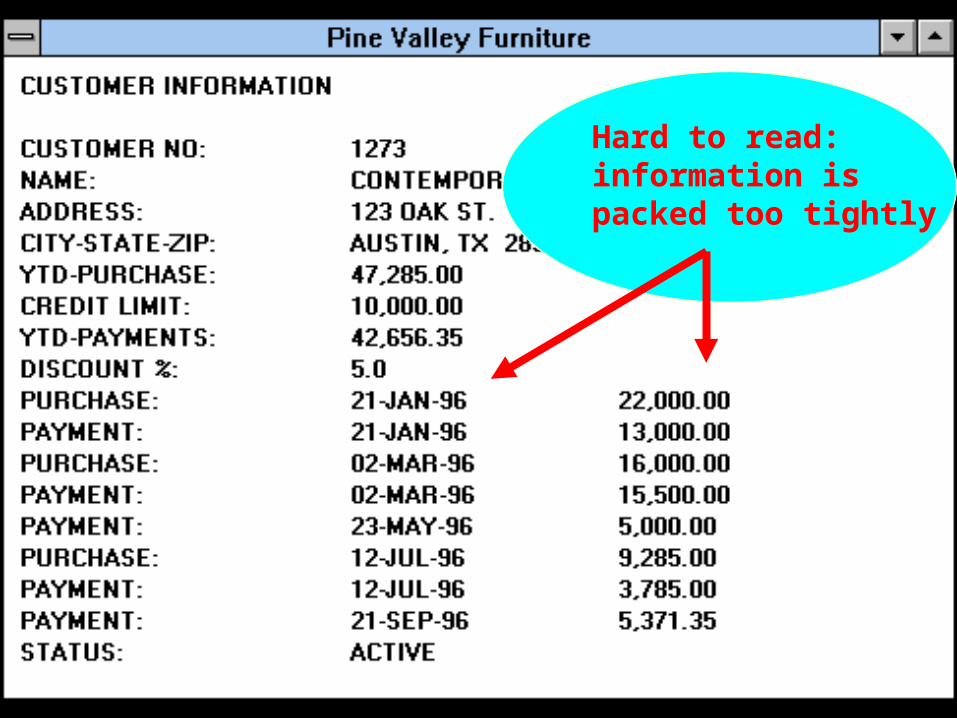
Hard to read:information ispacked too tightly
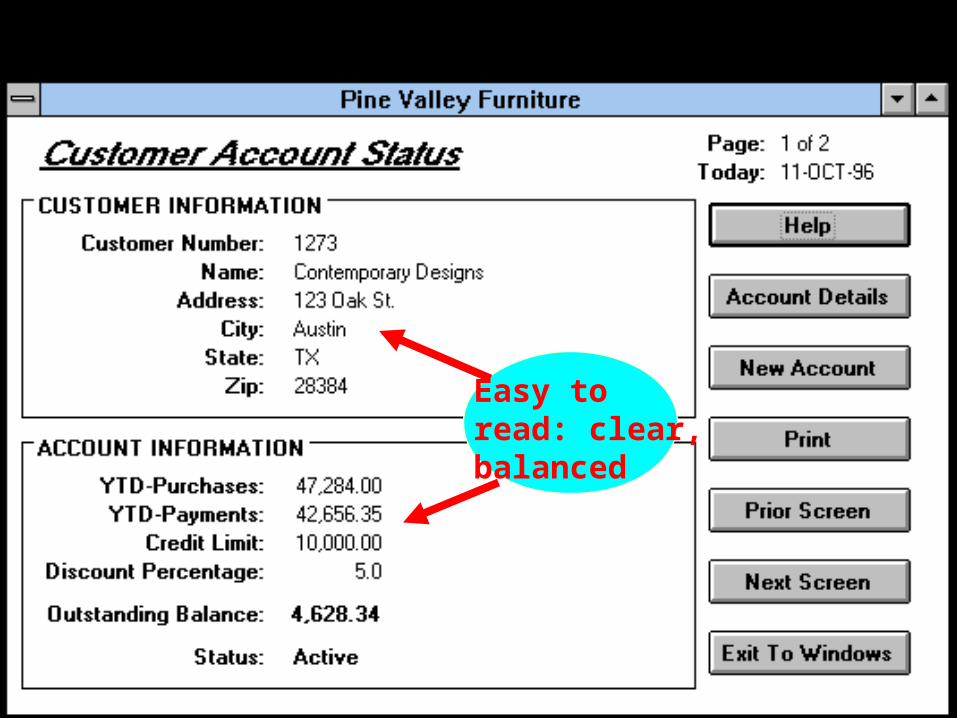
Easy to read: clear,balanced
General Design Guidelines
• Meaningful Information– only needed information should be displayed– information should be provided in a manner
that is usable without modification
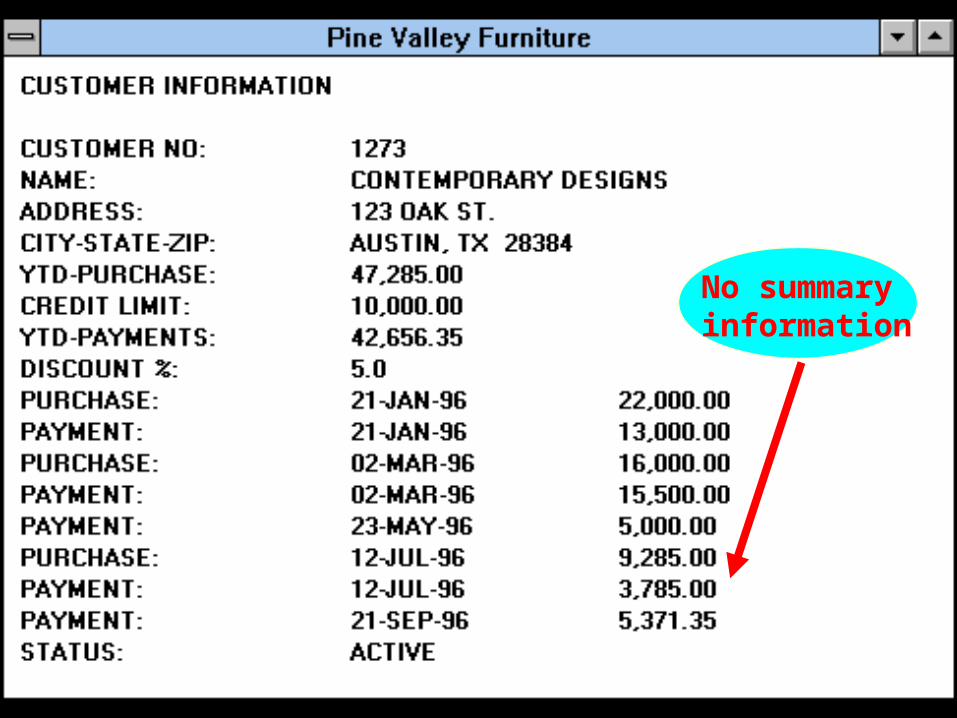
No summaryinformation
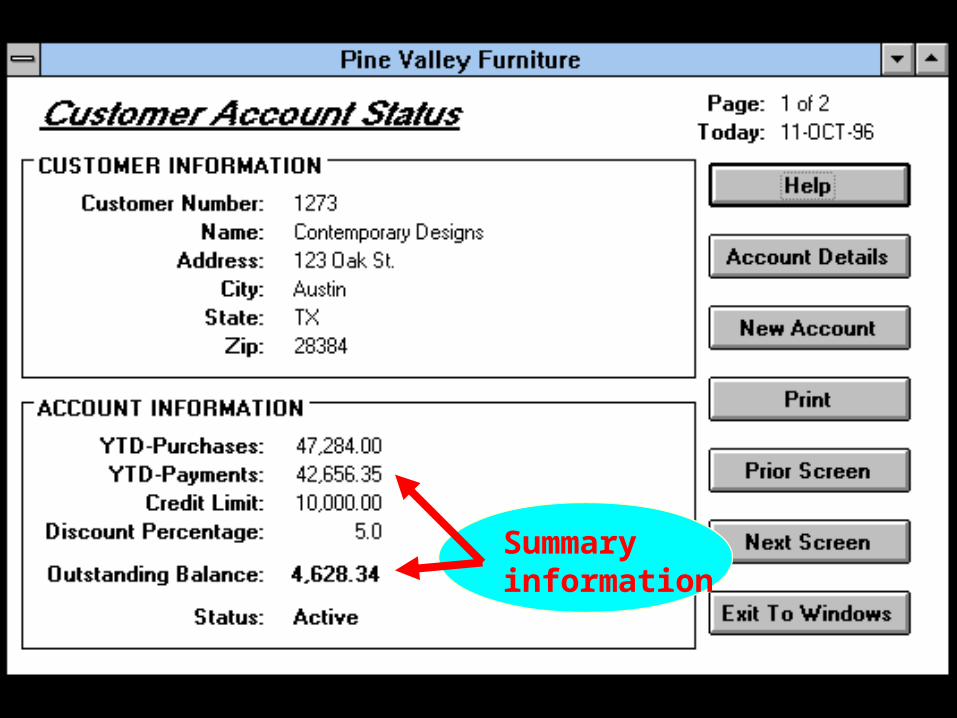
Summaryinformation
General Design Guidelines
• Easy Navigation– show how to move forward and backward– show where you are
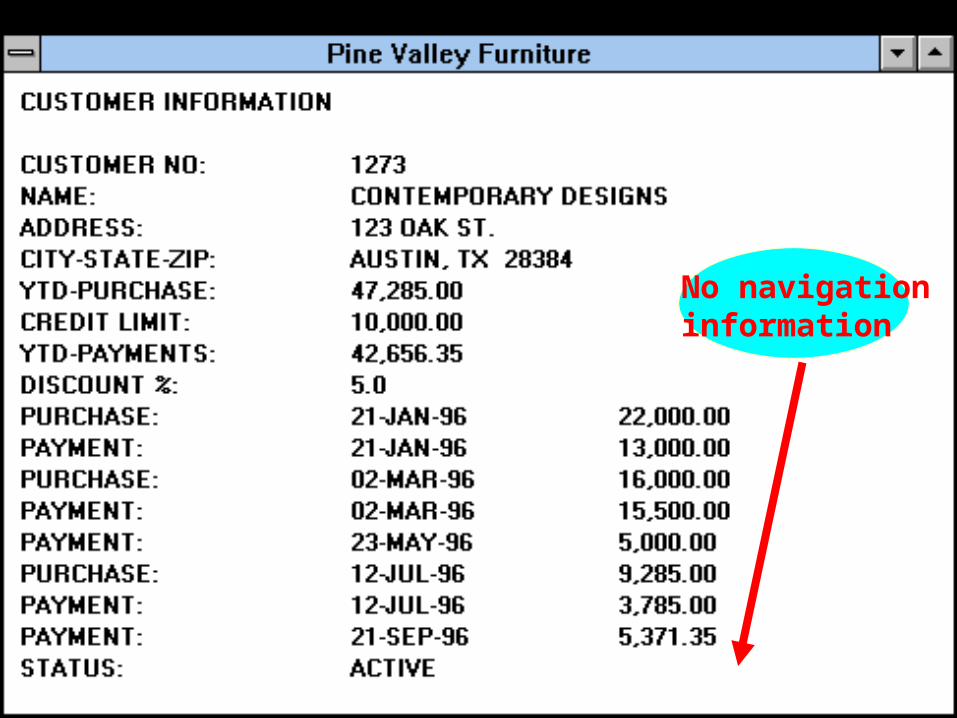
No navigationinformation
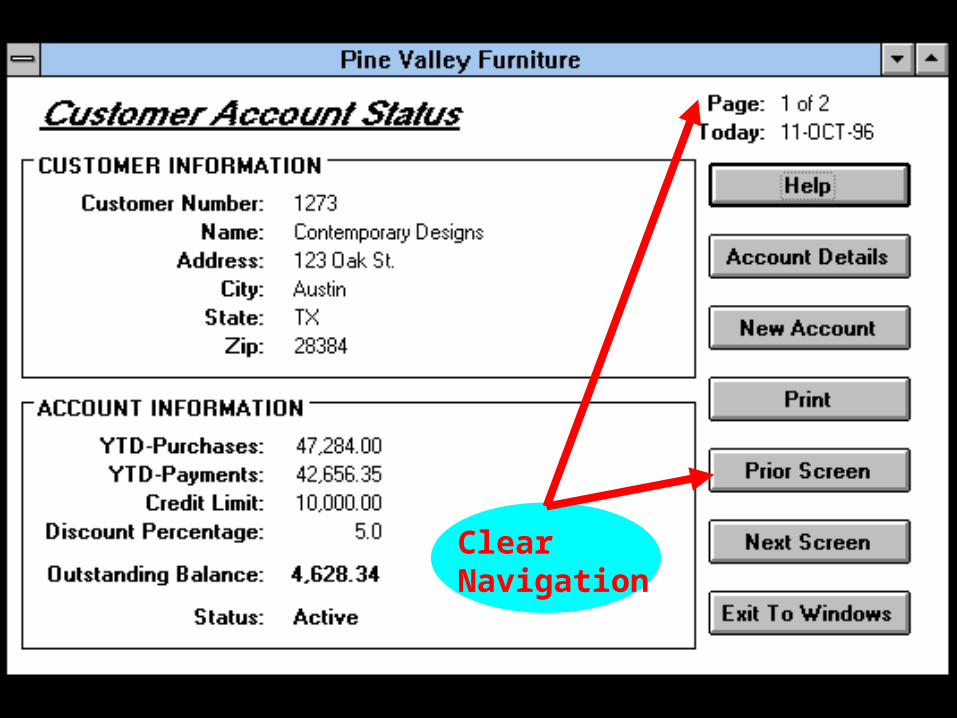
Clear Navigation
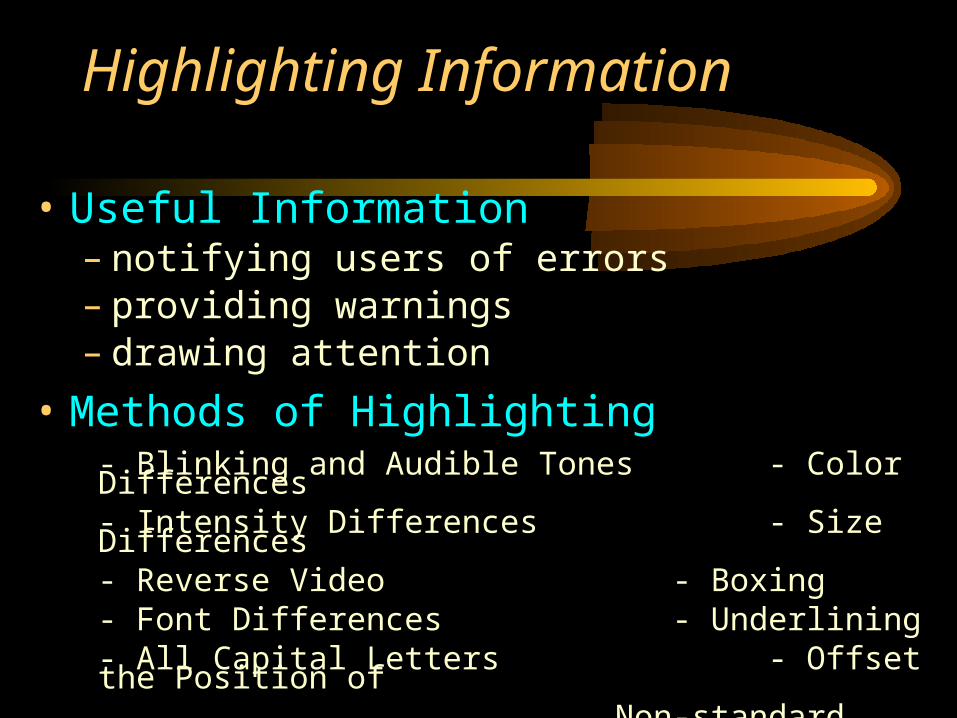
Highlighting Information
• Useful Information– notifying users of errors– providing warnings– drawing attention
• Methods of Highlighting- Blinking and Audible Tones - Color Differences- Intensity Differences - Size Differences- Reverse Video - Boxing- Font Differences - Underlining- All Capital Letters - Offset the Position of
Non-standard Information
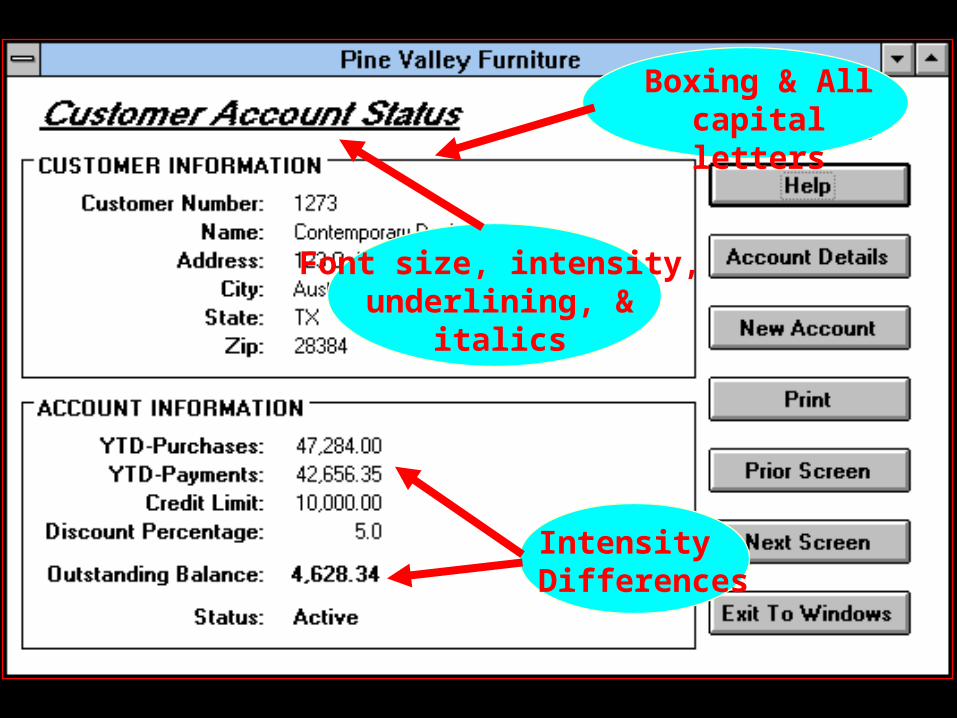
Intensity Differences
Boxing & All capital letters
Font size, intensity,underlining, &
italics
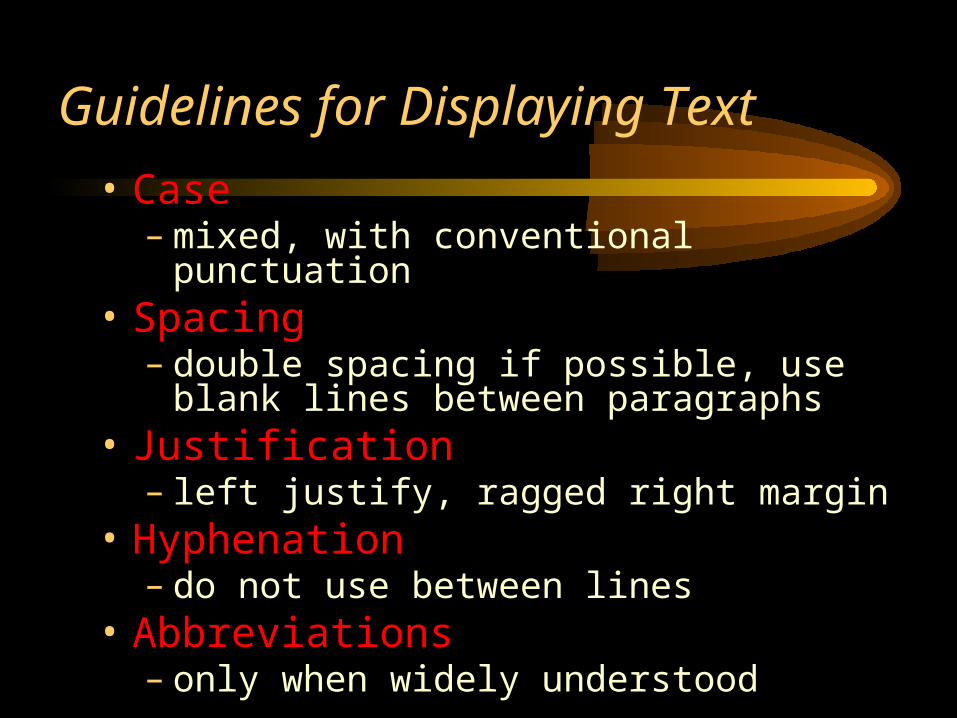
Guidelines for Displaying Text
• Case– mixed, with conventional punctuation
• Spacing– double spacing if possible, use blank lines
between paragraphs• Justification
– left justify, ragged right margin• Hyphenation
– do not use between lines• Abbreviations
– only when widely understood
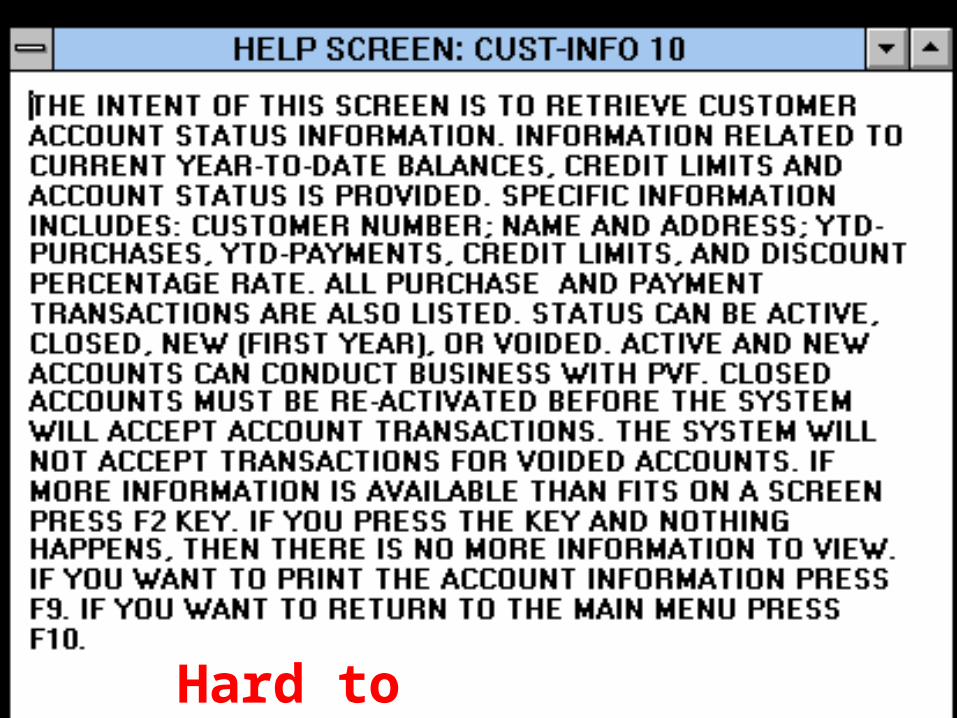
Hard to understand!!
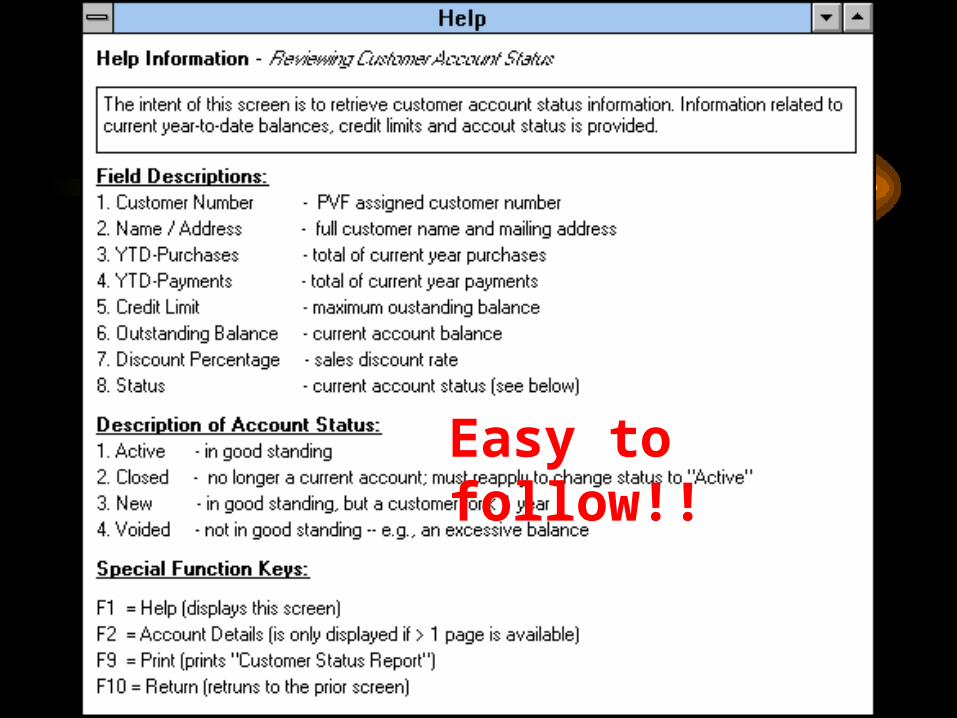
Easy to follow!!
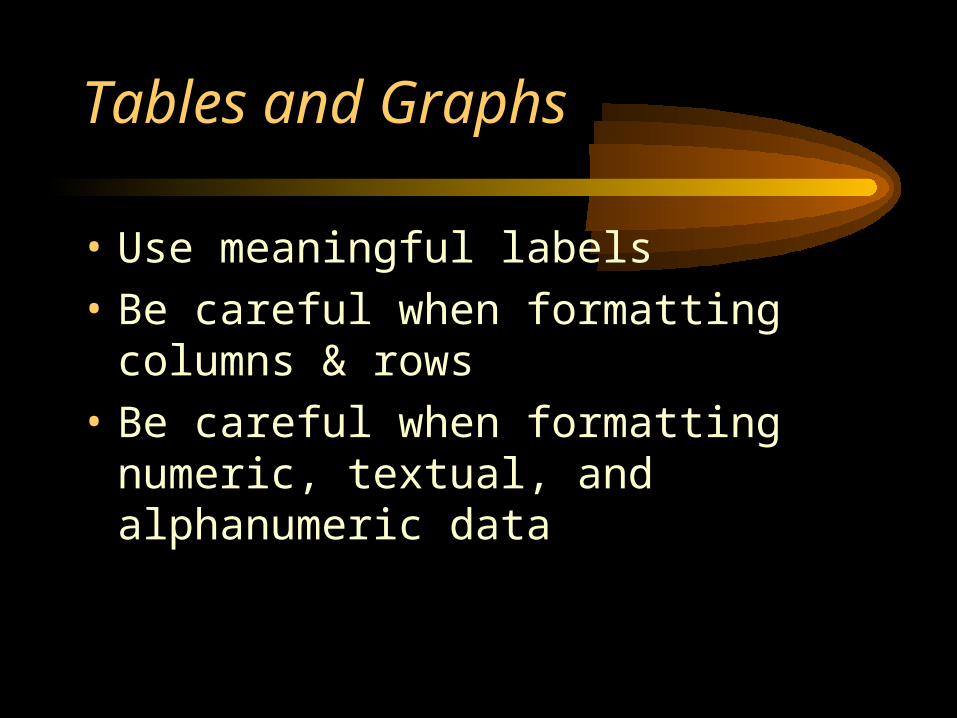
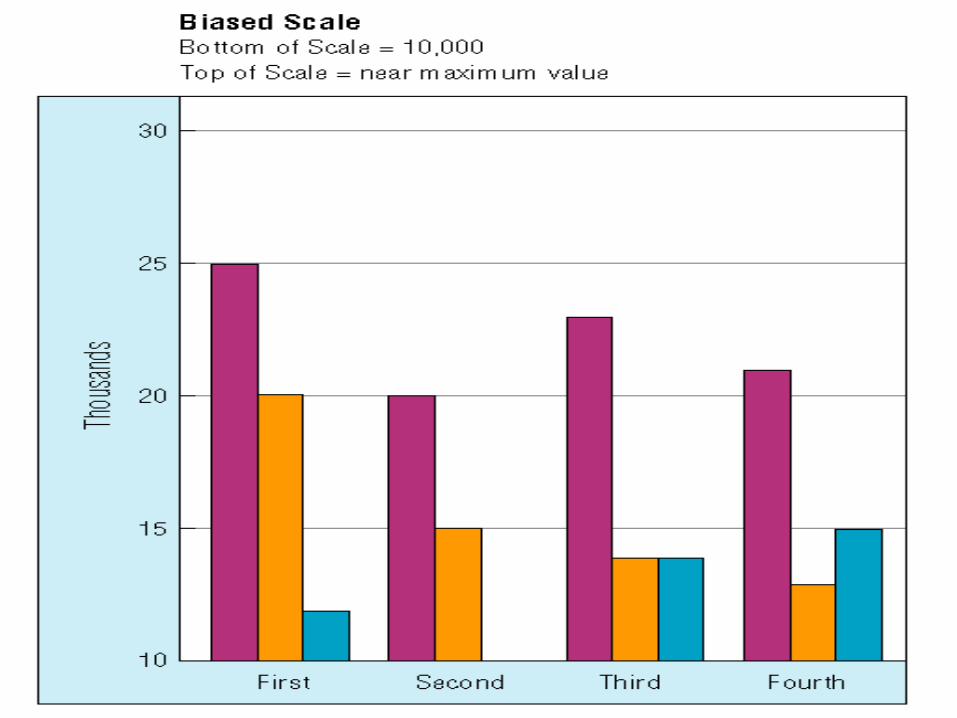
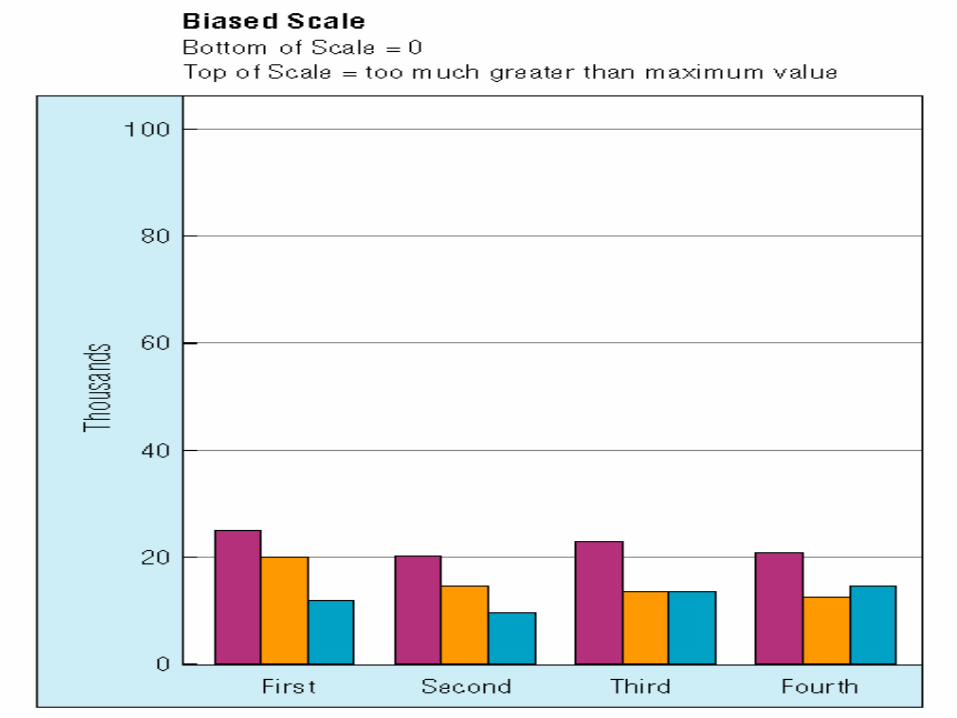
Tables and Graphs
• Use meaningful labels
• Be careful when formatting columns & rows
• Be careful when formatting numeric, textual, and alphanumeric data
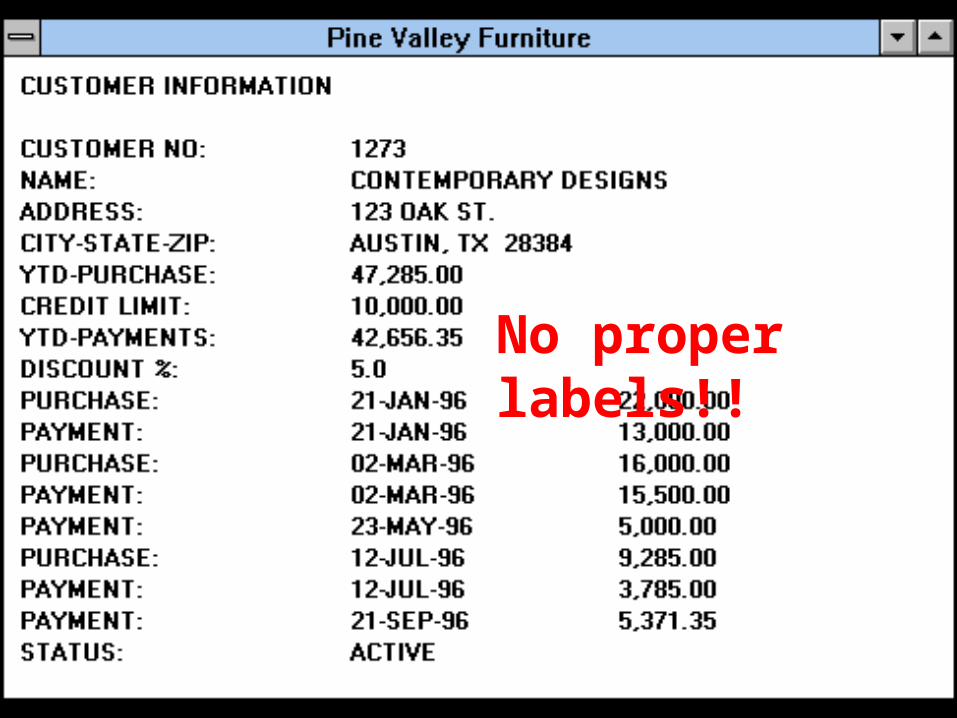
No proper labels!!
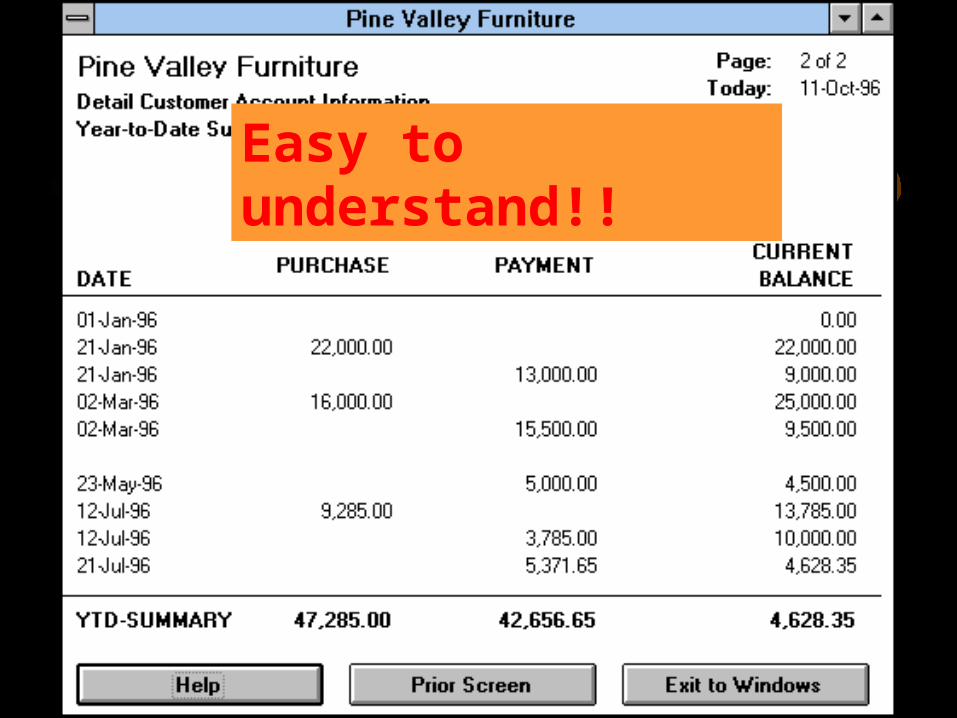
Easy to understand!!
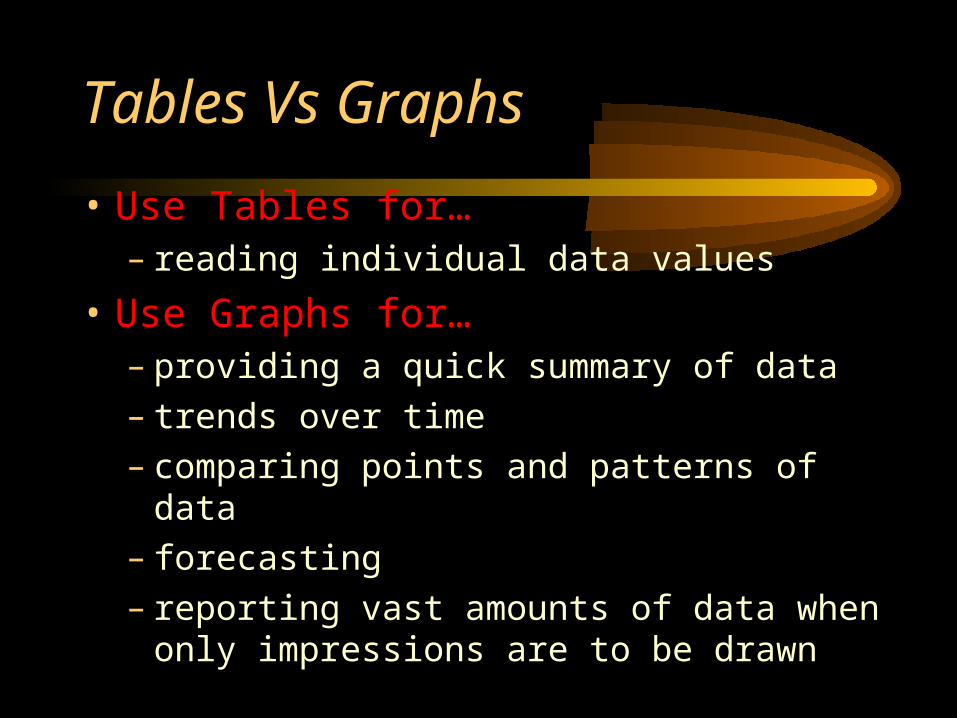
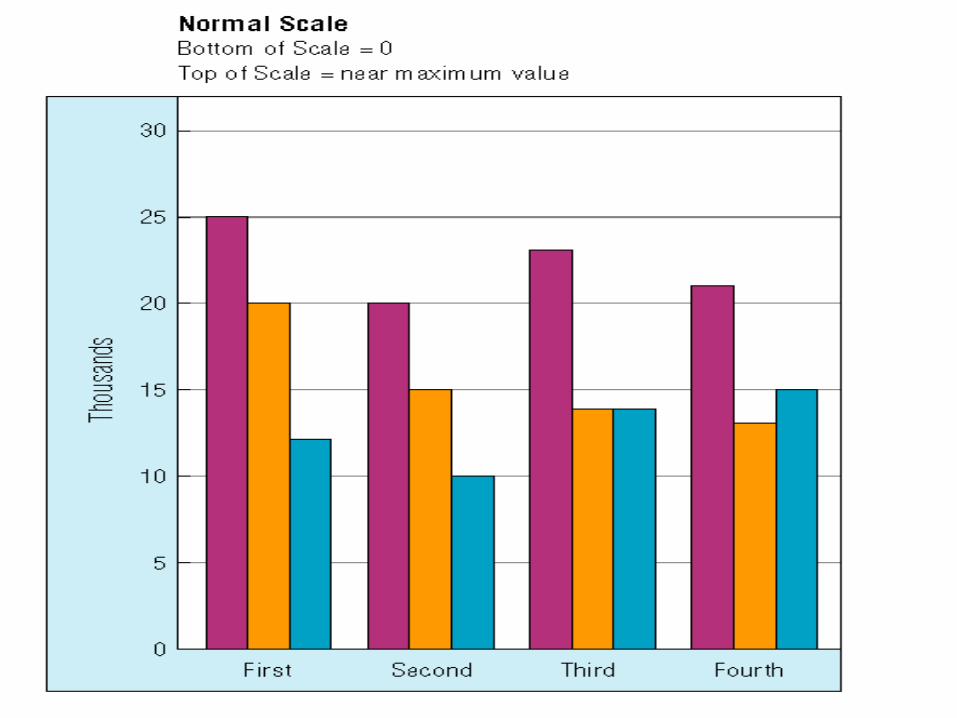
Tables Vs Graphs
• Use Tables for…– reading individual data values
• Use Graphs for…– providing a quick summary of data– trends over time– comparing points and patterns of data– forecasting– reporting vast amounts of data when only
impressions are to be drawn
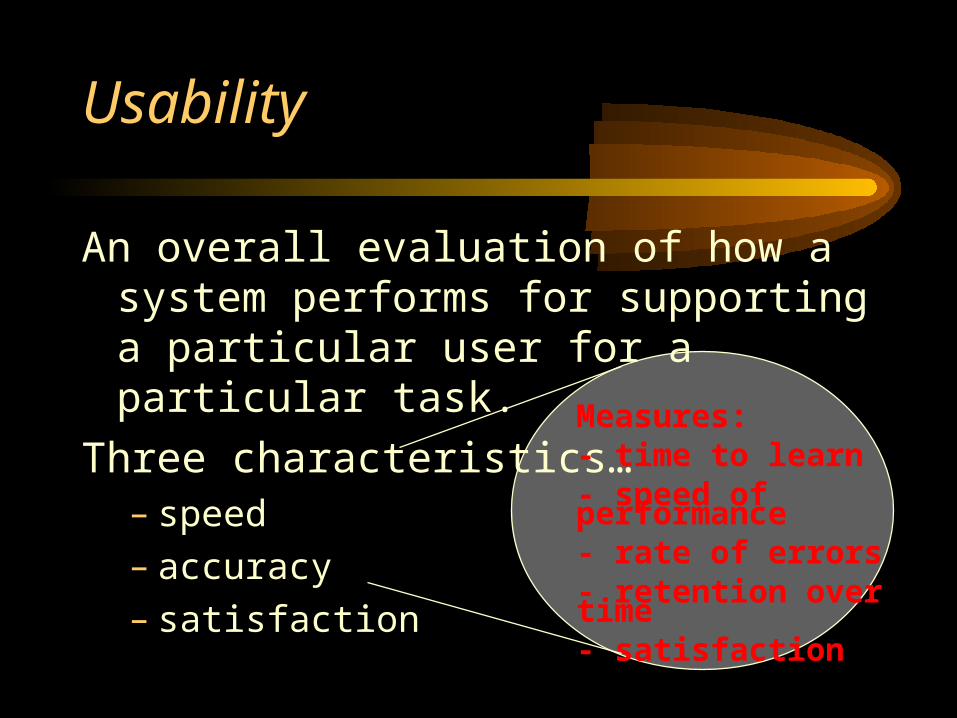
Usability
An overall evaluation of how a system performs for supporting a particular user for a particular task.
Three characteristics…– speed– accuracy– satisfaction
Measures:- time to learn- speed of performance- rate of errors- retention over time- satisfaction