Embed Size (px)
Citation preview

Bitumen-Bearing Deposits of the United States
'
U.S. GEOLOGICAL StJRVEY BULLETIN 1784 '


Bitumen-Bearing Deposits of the United States
By Bonnie L. Crysdale and Christopher J. Schenk
A summary of the locations, resources, and petrophysical properties of bitumen-bearing rocks in the United States
U.S. GEOLOGICAL SURVEY BULLETIN 1784

DEPARTMENT OF THE INTERIOR
DONALD PAUL HODEL, Secretary
U.S. GEOLOGICAL SURVEY
Dallas L. Peck, Director
UNITED STATES GOVERNMENT PRINTING OFFICE: 1988
For sale by the Books and Open-File Reports Section, U.S. Geological Survey, Federal Center, Box 25425, Denver, CO 80225
Library of Congress Cataloging in Publication Data
Crysdale, Bonnie L. Bitumen-bearing deposits of the United States.
(U.S. Geological Survey bulletin; 1784) Bibliography: p. 1. Bitumen-United States. 2. Bitumen-Testing. I. Schenk, Christopher
J. II. Title. Ill. Series. QE75.B9 no. 1784 557.3 s 87-600085 [TN850] [553.2'7]

CONTENTS
Abstract 1 Introduction 1 References 2
PLATES
[Plates in pocket]
1. Map showing locations of bitumen-bearing deposits in the conterminous Umted States
2. Map showing locations of bitumen-bearing deposits in Alaska
TABLES
1-17. Summary of bitumen deposits by State: 1. Alabama 6 2. Alaska 8 3. Arizona 10 4. Arkansas 12 5. California 14 6. Colorado 24 7. Kentucky 24 8. Michigan 26 9. Mississippi 26
10. Montana 26 11. New Mexico 28 12. New York 28 13. Ohio 28 14. Oklahoma 30 15. Texas 32 16. Utah 34 17. Wyoming 42
Contents Ill


Bitumen-Bearing Deposits of the United States By Bonnie L. Crysdale and Christopher J. Schenk
Abstract
Tar sands, or bitumen-bearing rocks, represent a significant source of hydrocarbons in the United States. This report is a summary, by State, of the locations, resources, and petrophysical data of known bitumen-bearing deposits. Bitumen accumulations are located primarily in Alabama, California, Kentucky, Texas, and Utah. Utah contains the largest resource, with an estimated 28 billion barrels of bitumen, followed by California with 9 billion barrels, and Alabama, with approximately 6 billion barrels. The locations of most bitumen accumulations are well known, although the resources of only the larger deposits have been estimated. Much of the petrophysical, chemical, and mineralogical data are unknown, even for the larger deposits.
INTRODUCTION
The purpose of this report is to summarize the locations and resources of known tar sand deposits in the United States (pis. 1, 2). Tar sand is a generic term for a sedimentary rock or sand containing a heavy asphaltic substance called bitumen (Schramm, 1979), which in its natural state is not mobile at reservoir conditions and cannot be extracted by conventional petroleum recovery methods. Tar, or bitumen, is defined as any hydrocarbon deposit with a gas-free viscosity greater than 10,000 centipoises ( cp) measured at original reservoir conditions (Danyluk and others, 1984 ), and density greater than 1,000 kglm3 ((10° API gravity) at 15.6°C ( 60°F) at atmospheric pressure. Viscosity data for many of the deposits generally are not available, so bitumen as used in this report is defined by the API gravity cutoff of less than 10°. Bitumen-bearing rocks are known by several other names, such as natural asphalt, tarry oil, bituminous rock, tar sands, oil sands, and rock asphalt. All appear to be used interchangeably. We will use the term bitumen-bearing to describe these accumulations. Host lithologies of the various bitumen-bearing rocks include sandstone, limestone, dolomite, conglomerate, siltstone, and unconsolidated sands. Most of the bitumen-bearing rocks are located on the margins of sedimentary basins, and have outcrop or surface exposures, although they do extend into the subsurface.
Bitumen-bearing rocks have been recognized in the United States since the late 1800's; Ball Associates (1965) listed over 500 occurrences, most of them small, isolated outcrops. Lewin and Associates (1984) reassessed the bitumen resource, estimating the total at 54 billion barrels, with 25 major (greater than 100 million barrels) and 19 minor (10 to 100 million barrels) occurrences. Lewin and Associates (1984) categorized slightly less than half of this amount (22 billion barrels) as reserves and considered the remainder to be speculative resource. Deposits occur primarily in Alabama, California, Kentucky, Texas, and Utah. Utah contains the largest deposits in terms of resource, size, and number, with an estimated 28 billion barrels of bitumen on more than 700,000 acres of land. Accumulations in the tristate area of Missouri, Kansas, and Oklahoma (shown on pl. 1, but not numbered) are estimated to contain approximately 3 billion barrels of petroleum (Lewin and Associates, 1984); however, they are not listed in this report as most of these accumulations appear to consist of heavy oil (Ebanks and Weber, 1984). Crude oils with densities from 934 to 1,000 kg!m3 (API gravities of 20° to 10°) inclusive are classified as heavy oils (Martinez, 1984). Similarly, the giant Kuparuk deposit on the Alaska North Slope is now known to consist mainly of heavy oil, not bitumen (Werner, 1984), with a resource estimated as high as 40 billion barrels. Lewin and Associates considered 10 billion barrels of the Kuparuk deposit to be bitumen; consequently, their total bitumen resource estimate of 54 billion barrels should be adjusted downward to 44 billion barrels.
Bitumen-bearing rocks were quarried extensively for road-paving material in the United States from the late 1800's through the 1940's, until it became uneconomic to continue mining operations. Bitumenbearing rocks have been recognized for many years as potential energy sources (Schramm, 1979); however, interest has remained marginal due to (1) unfavorable economic conditions for extracting the bitumen from the rock, (2) limited knowledge of the character of bitumenbearing deposits, and (3) large, readily available reserves
Introduction

of conventional petroleum. Recent interest has centered on developing methods of in-situ recovery of the bitumen.
The bitumen deposits summarized in tables 1 through 17 are listed by State and generally coincide with field outlines of major deposits described by Lewin and Associates (1984) and minor deposits characterized by Ball Associates (1965). All map location numbers in the tables refer to plate 1, except the table for Alaska, which refers to plate 2. Descriptions in the tables include the following information: (1) map number located on the plates by State (where numbered 1A, 1B, and so on, the numbers indicate separate occurrences within one outlined area); (2) name of the deposit and its location; (3) geologic formation containing the bitumen, age of the formation, and lithology of the host rock; ( 4) depth to pay, and pay thickness; (5) number of acres the deposit covers, either measured (by well control and core analysis) or speculative (by tar shows and geologic interpretations); (G) API gravity and viscosity of the bitumen; (7) porosity and permeability of the host rock; (8) water saturation (in percent) and bitumen saturation (either percent or weight percent) of the host rock; (9) sulfur content of the bitumen (bitumens generally contain 3 weight percent or more of sulfur (Danyluk and others, 1984)); and (10) amount of bitumen resource in place, both measured and speculative. Plates 1 and 2 also illustrate the outlines of sedimentary basins in the conterminous United States and ~-\Iaska. Basin outlines for the conterminous United States are from Terra Graphics (1977), and basin outlines for Alaska are from Ehm (1983). Data presented here are based on the most reliable published and unpublished information available from various Federal, State and local agencies, private sources, and original field investigations.
REFERENCES
Adams, E. W., and Beatty, \V. B., 1962, Bituminous rocks in California: Division of Mines and Geology, Mineral Information Service, v. 15, no. 4, p. 1-11.
Ball Associates, Ltd., 1965, Surface and shallow oil impregnated rocks and shallow oil fields in the United States: U.S. Bureau of Mines, Monograph 12, 375 p
Blasko, P. P., 1976a, Oil and gas seeps in Alaska; north-central Gulf of Alaska: Bureau of Mines Report of Investigations RI-8136, p. 102-105.
___ 197Gb, Oil and gas seeps in Alaska, Alaska Peninsula; western Gulf of Alaska: Bureau of Mines Report of Investigations RI-8122, 78 p.
Britton, M. W., 1984, Problems frequently encountered in evaluating tar sand resources-example: the south Texas San Miguel deposit: American Association of Petroleum Geologists Research Conference, Exploration for Heavy Cmde Oil and Bitumen, Santa Maria, Calif., Preprint, 24 p.
2 Bitumen-Bearing Deposits of the United States
California Division of Oil and Gas, 1974, California oil and gas fields, volume 2, South, central coastal, and offshore California: Report no. TR12. [unnumbered pages].
Campbell, J. A., and Ritzma, H. R., 1979, Geology and petroleum resources of the major oil-impregnated sandstone deposits of Utah: Utah Geological and Mineral Survey Special Studies 50, 24 p.
Clardy, B. F., 1983, unpublished memorandum to N. F. Williams, Arkansas Geological Commission, Little Rock, Arkansas.
Danyluk, M. D., Galbraith, B. E., and Omana, R. A., 1984, Toward definitions for heavy crude oils and tar sands, in Meyer, R. F., Wynn, J. C., and Olson, J. C., eds., The future of heavy cmde and tar sands: UNITAR Second International Conference, p. 1xvii-h..'Viii.
deChadenedes, Francois, 1~84, Surface and tar sand deposits in California: American Association of Petroleum Geologists Research Conference, Exploration for Heavy Cmde Oil and Bitumen, Santa Maria, Calif., v. 1, 14 p.
Ebanks, W. J., and Weber, J. F., 1984, Shallow heavy-oil deposit in a Pennsylvanian fluvial sandstone reservoir, Eastburn Field, Missouri, U.S.A.: American Association of Petroleum Geologists Research Conference, Exploration for Heavy Cmde Oil and Bitumen, Santa Maria, Calif., V. 1, 35 p.
Ehm, Arlen, 1983, Oil and gas basins map of Alaska: Alaska Department of Natural Resources, 1:2,500,000, 1 sheet.
Evans, T. J., 1975, Native bituminous materials in Texas: Texas Bureau of Economic Geology, Mineral Resources Circular no. 57, p. 1-11.
Harrison, W. E., and Burchfield, M. R., 1984, Resource evaluation of selected tar-sand deposits in southern Oklahoma: American Association of Petroleum Geologists Research Conference, Exploration for Heavy Cmde Oil and Bitumen, Santa Maria, Calif., v. 1, 41 p.
Harrison, W. E., Mankin, C. J., \Veber, S. J., and Curiale, J. A., 1981, Oil-sand and heavey-oil potential of Oklahoma, in Meyer, R. F., and Steele, C. T., eds., The future of heavy crude oils and tar sands: UNIT AR First International Conference, p. 83-89.
Jennings, C. W., 1957, Asphalt and bitutminous rock: ~lineral Commodities of California, California Division of Mines Bulletin 176.
Lewin and Associates, Inc., 1984, Major tar sand and heavy oil deposits of the United States: Interstate Oil Compact Commission, 272 p.
Martinez, A. R., 1984, Report of working group on definitions, in Meyer, R. F., Wynn, J. C., and Olson, J. C., eds., The future of heavy cmde and tar sands: UNIT AR Second International Conference, p. lxvii-lxviii.
McGrain, Preston, 1976, Tar sands (rock asphalt) of Kentuck)'-a review: Kentucky Geological Survey, ser. 10, Report of Investigations 19, 16 p.
Molenaar, C. M., 1977, The Pinedale oil seep-an exhumed stratigraphic trap in the southwestern San Juan basin: New Mexico Geological Society Guidebook, 28th Field Conference, San Juan Basin III, p. 243-246.
Nager, M. C., 1984, Tar-sand exploration in Kentucky Kentuck)' Geological Survey, Lexington, 51 p.

Peterson, P. R., and Ritzma, H. R., 1974, Informational core drilling in Utah's oil-imprc·gnated sandstone deposits, southeastern Uinta Basin, Uintah County, Utah: Utah Geological And Mineralogical Survey, Report of Investigation no. 88, p. 9-10.
Ritzma, H. R., 1968, Preliminary location map of oilimpregnated rock deposits of Utah: Utah Geological and Mineralogical Survey, Map no. 25.
___ 1979, Oil-impregnated rock deposits of Utah: Utah Geological and Mineralogical Survey, Map 47, 2 sheets, 1:1,000,000.
Schramm, L. W., 1979, U.S. tar sand oil forecasts (1985-1995): U.S. Department of Energy Technical Report, 44 p.
Terra Graphics, 1977, Oil and gas production map of the United States. 1:3,168,000.
Werner, M. R., 1984, Shallow heavy oil deposits of the Kuparuk River unit: American Association of Petroleum Geologists Research Conference, Exploration for Heavy Crude Oil and Bitumen, Santa Maria, Calif., v. 2, 31 p.
Williams, D. A., 1982, Structural and geochemical study of the South Sulphur asphalt deposits, Murray County, Oklahoma: University of Oklahoma, M.S. thesis, 123 p.
Wilson, Gary V., 1984, Bitumen deposits of northwest Alabama: American Association of Petroleum Geologists Research Conference, Exploration for Heavy Crude Oil and Bitumen, Santa Maria, Calif., v. 2, 10 p.
References 3

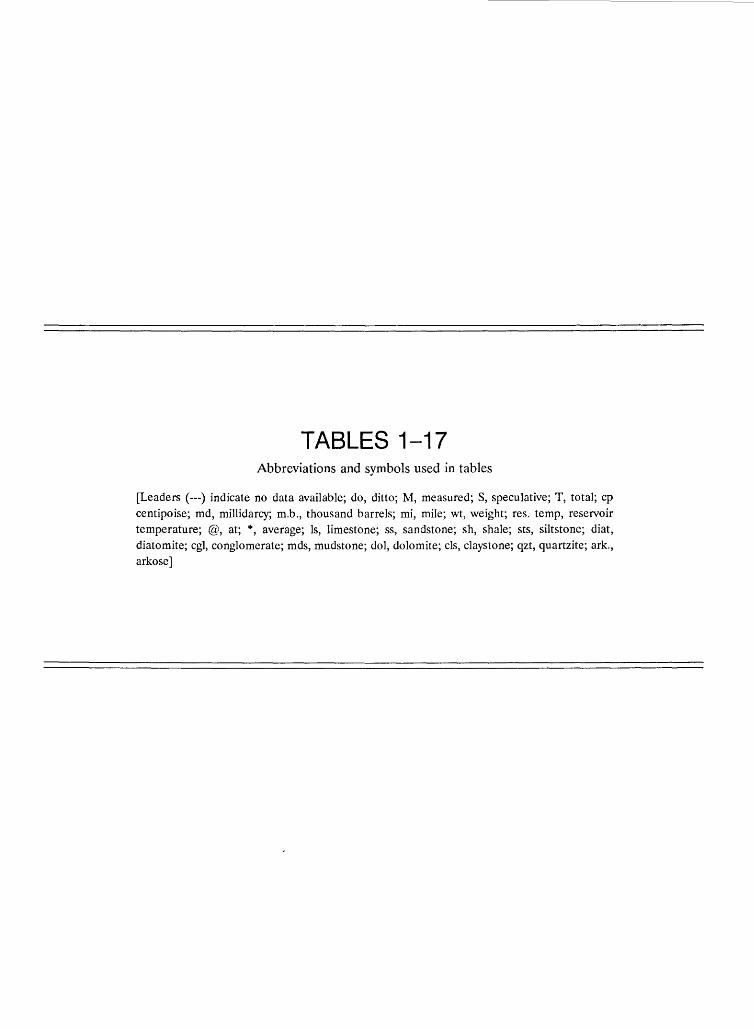
TABLES 1-17 Abbreviations and symbols used in tables
[Leaders (---) indicate no data available; do, ditto; M, measured; S, speculative; T, total; cp centipoise; md, millidarcy; m.b., thousand barrels; mi, mile; wt, weight; res. temp, reservoir temperature; @, at; *, average; Is, limestone; ss, sandstone; sh, shale; sts, siltstone; diat, diatomite; cgl, conglomerate; mds, mudstone; dol, dolomite; cis, claystone; qzt, quartzite; ark., arkose]

Table 1. Summary of bitumen deposits in Alabama
Pay Map Deposit name County Townships Formation Age Lith- Depth thickness
number and Ranges ology (f t) (ft)
lA 2Bangor Franklin, lr. 7, 8 s.' Bangor Mississippian ls outcrop Lawrence, R. 3, 5, 9 w. Limestone Morgan
lB 2Hartselle Colbert, T. 5-13 s.' Hartselle ---do--- ss 0-1,000 5-54 Franklin, R. 4-15 w. Sandstone Lawrence, Morgan, Marion, Winston, Walker, Cullman
2A 1colbert Colbert T. 3 s.' Girkin ---do--- ls outcrop Creek R. 14 w.
2B 1cherokee ---do--- T. 4 s.' ---do--- ---do--- 3-12 R. 13-14 w. Bethel
Sandstone
2C 1Margerum ---do--- T. 3-5 s.' Girkin ---do--- ls <1-25 R. 14-15 w.
2D 2Pride ---do--- Pride ---do--- 3sh, 20-30 12* Mountain Mountain ls, mi
ss, outcrop sts
1Ball Associates, 1965. 2Lewin and Associates, 1984. 3wilson, 1984.
6 Bitumen-Bearing Deposits of the United States
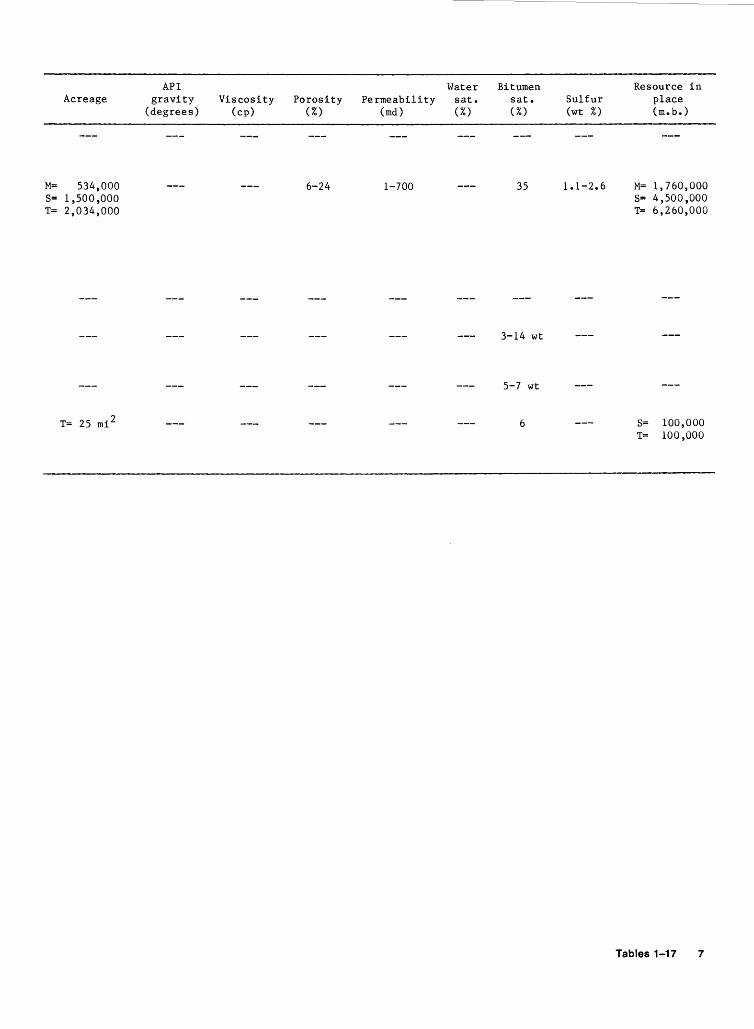
Acreage
M= 534,000 S= 1 ,500,000 T= 2,034,000
T= 25 mi 2
API gravity
(degrees) Viscosity
(cp) Porosity
(%)
6-24
Water Permeability sat.
(md) (%)
1-700
Bitumen sat. (%)
35
3-14 wt
5-7 wt
6
Sulfur (wt %)
1.1-2.6
Resource in place ( m. b.)
M= 1,760,000 S= 4,500,000 T= 6,260,000
S= 100,000 T= 100,000
Tables 1-17 7

Table 2.
Map number
2
3
4
5
6
7
8
9
10
11
12
13
14
Summary of bitumen deposits in Alaska
Deposit name
1Lituya Bay
1cape Kekur-noi (Cold Bay)
1chignik Lagoon
1Nation River
1Tiglukpuk Creek
1Fortress Mountain
1Lisburne Ridge
1utukok River
1carbon Cr.
1omicron Hill
1Kokolik River
2oily Lake
3011 Creek
1Humphrey
Location Townships and Ranges
110 mi west of Juneau
West shore of Shelikof Strait
On east side of Alaskan Penin-sula
On Yukon River, 20 mi. west of Canadian border
On east side of Tiglukpuk Creek, 50 mi. south of Umiat oilfield
Between Ayiyak River and Okak Creek, 65 mi. south of Umiat oilfield
Between Etivluk and Kiligwa River in west Arctic foothills Near Utukok River on Carbon Cr. anticline
6 mi. west of Carbon Cr.
42 mi. from river mouth
Mt. St. Elias quad.
Karluk quad.
Un-goon Pt. , on Arctic coast
lat 68° 21'24"N long 160° 04'30"W
lat 68° 22'54"N long 159° 59'30"W
lat 69° 29'30"N long 160° 30'30"W
T. 21 s.' R. 28 E.' Nl/2 sec. 6
T. 29 S., R. 40 W., SEl/4 sec. 10
1Ball Associates, 1965. 2Blasko, 1976a. 3Blasko, 197 6b.
8 Bitumen-Bearing Deposits of the United States
Pay Formation Age Lith- Depth thickness
ology (ft) (ft)
Tertiary ss
Late ls outcrop Triassic
Chignik Cretaceous ss, 120 ss, cgl cgl 200 marine
ss and cgl
Mississ- ls outcrop ippian
Okpikruak, Cretaceous asphalt --do---Toruk in (?)
Toruk Early cgl, ---do---Cretaceous ss?
Okpikruak, Early Cretaceous ss, Shublik, Triassic ls, Kiruktagial Miss iss- cherty
ippian asphalt
Kukpowruk Early ss outcrop Cretaceous
Kukpowruk Early ss outcrop Cretaceous
---do--- Early ss outcrop Cretaceous
Corwin ---do--- ss 7
imp reg. surface deposits
---do---
ss 4
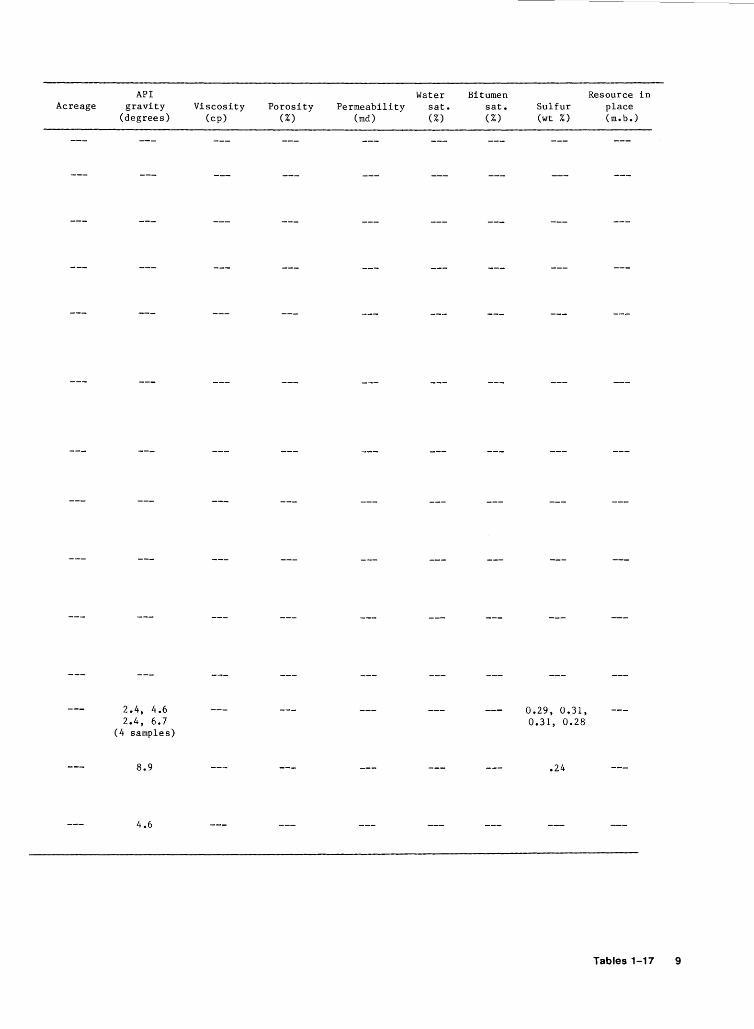
Acreage API
gravity (degrees)
2.4, 4.6 2.4, 6.7
( 4 samples)
8.9
4.6
Viscosity (cp)
Porosity (%)
Permeability (md)
Water sat. (%)
Bitumen sat. (%)
Sulfur (wt %)
0.29, 0.31, 0.31, 0.28
.24
Resource in place (m.b.)
Tables 1-17 9

Table 3. Summary of bitumen deposits in Arizona
Pay Map Deposit name County Townships Formation Age Lith- Depth thickness
number and Ranges ology (£ t) (ft)
lA 1Black Rock Mohave T. 40 N., Kaibab Permian ls Canyon R. 13 w.,
sees. 3, 10; T. 41 N., R. 13 w., sees. 11, 14, 23, 26, 35
lB 1southwest ---do--- T. 40 N., Moenkopi Triassic ss(?) Black Rock R. 13 w., Canyon sees. 17, l8
2 1sedona Coconino, T. 17 N., Fort Apache Permian outcrop 135 mi Vernon Navajo, R. 6 E., Member of long
Apache to T. 10 N., Supai R. 25 E.
3 1st. Johns Apache T. 13 N., Coconino ---do--- ss ---do---R. 28 E.
4 1Payson Gila T. 11 N., Martin Devonian ls ---do---R. 10 E., Limestone sec. 17
5 1Dragoon Cochise ---do--- ---do--- ls ---do---Mts. -Tombstone
1Ball Associates, 1965.
10 Bitumen-Bearing Deposits of the United States
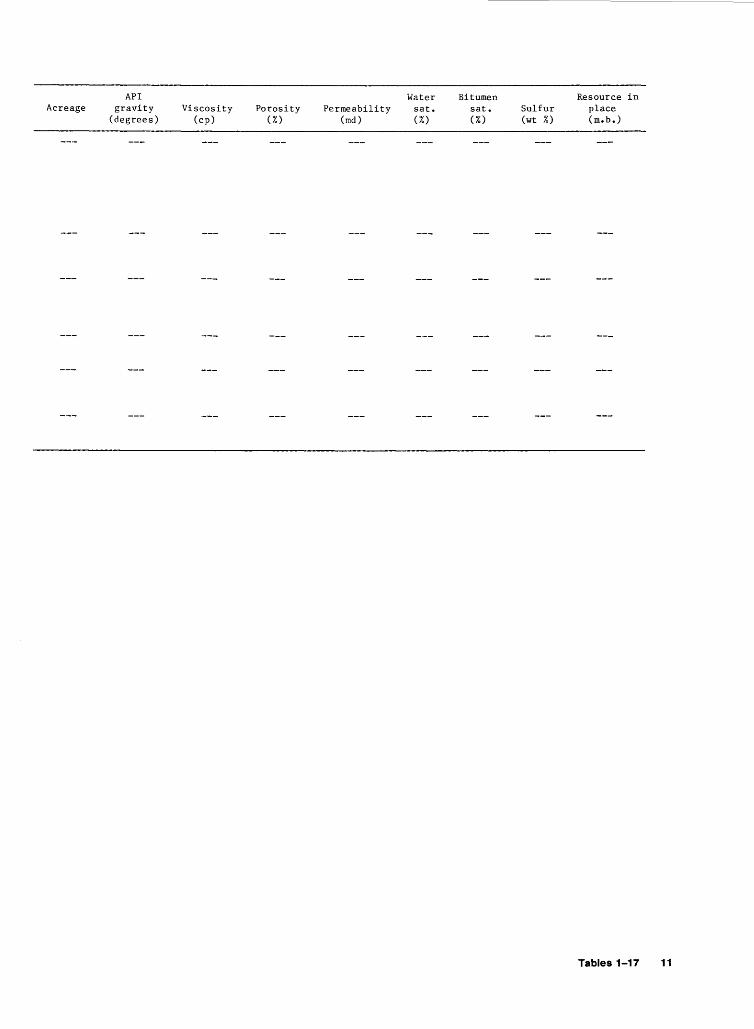
Acreage API
gravity (degrees)
Viscosity (cp)
Porosity (%)
Permeability (md)
Water sat. (%)
Bitumen sat. (%)
Sulfur (wt %)
Resource in place (m.b.)
Tables 1-17 11

Table 4. Summary of bitumen deposits in Arkansas
Pay Map Deposit name County Townships Formation Age Lith- Depth thickness
number and Ranges ology (ft) (ft)
lA 1Delight Pike T. 8 s., Trinity Early ss 3-5 R. 24 w. Cretaceous
lB 1Pike ---do--- T. 7 s., ---do--- ---do--- ss outcrop 24-12 R. 24 w.
lC 1Murfreesboro ---do--- T. 8 s., ---do--- ---do--- ss, ---do---R. 25 w. gravel
2 1Lebanon Sevier T. 8 s., ---do--- ---do--- ss ---do--- 0.16-1.0 R. 30 w., sees. 1, 11, 8· , T. 8 s., R. 29 w., sec. 4
3A 1Floss Washington T. 13 N., Hale Pennsyl- ss ---do---R. 32 w. vanian
3B 1cane Hill ---do--- T. 14 N., ---do--- ---do--- ss ---do---R. 32 w.
4A 1Huntsville Madison T. 16, 17 N. ---do--- ---do--- ss ---do---R. 26 w., sec. 9
4B 1southwest ---do--- T. 16 N., Atoka ---do--- ss ---do---Huntsville R. 26 w.
NEl/L..<;Wl/4, sec. 17
5 1Deer Newton T. 14 N., Hale ---do--- ss ---do---R. 21 w.
6 1Batesville Indepen- T. 13 N., Batesville Mississ- S5 ---do---dence R. 6 w. Sands one ippian
7 1Fourche Scott T. 1 N., Jack Fork Pennsyl- ss, ---do---Mountain R. 31 w. Sandstone vanian sh
1Ball Associates, 1965. 2clardy, 1983.
12 Bitumen-Bearing Deposits of the United States
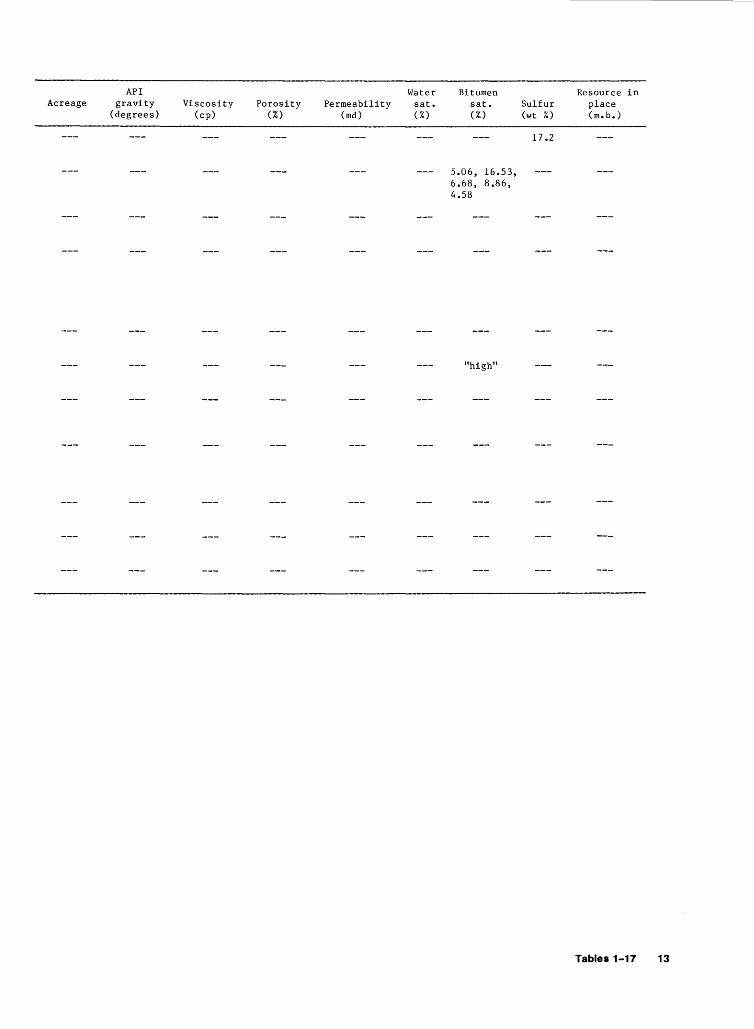
Acreage API
gravity (degrees)
Viscosity (cp)
Porosity (%)
Permeability (md)
Water sat. ( %)
Bitumen sat. (%)
5.06, 16.53, 6.68, 8.86, 4.58
"high"
Sulfur (wt %)
17.2
Resource in place (m. b.)
Tables 1-17 13
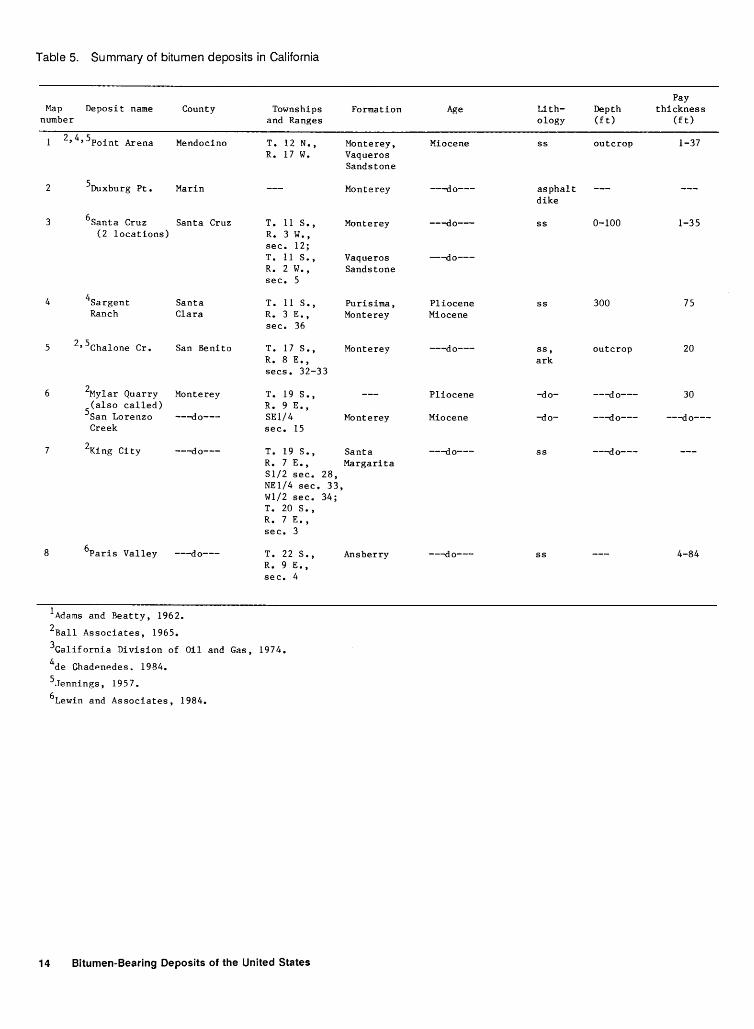
Table 5. Summary of bitumen deposits in California
Pay Map Deposit name County Townships Formation Age Lith- Depth thickness
number and Ranges ology (f t) (ft)
2• 4• 5Point Arena Mendocino T. 12 N., Monterey, Miocene ss outcrop 1-37 R. 17 w. Vaqueros
Sandstone
2 5Duxburg Pt. Marin Monterey ---do--- asphalt dike
3 6santa Cruz Santa Cruz T. 11 s.' Monterey ---do--- ss 0-100 1-35 (2 locations) R. 3 w.'
sec. 12; T. 11 s., Vaqueros ---do---R. 2 w., Sandstone sec. 5
4 4sargent Santa T. 11 s.' Purisima, Pliocene ss 300 75 Ranch Clara R. 3 E.' Monterey Miocene
sec. 36
5 2•5chalone Cr. San Benito T. 17 s.' Monterey ---do--- ss' outcrop 20 R. 8 E., ark sees. 32-33
6 2Mylar Quarry Monterey T. 19 s.' Pliocene -do- ---do--- 30
5~:~s~o~:~;~d) R. 9 E., ---do--- SE1/4 Monterey Miocene -do- ---do--- ---do---
Creek sec. 15
7 2King City ---do--- T. 19 s.' Santa ---do--- ss ---do---R. 7 E., Margarita S1/2 sec. 28, NE1/4 sec. 33, W1/2 sec. 34; T. 20 s., R. 7 E.' sec. 3
8 6Paris Valley ---do--- T. 22 s.' Ansberry ---do--- ss 4-84 R. 9 E., sec. 4
1Adams and Beatty, 1962. 2Ball Associates, 1965. 3california Division of Oil and Gas, 1974. 4de GhadPnedes. 1984. 5Jennings, 1957. 6Lewin and Associates, 1984.
14 Bitumen-Bearing Deposits of the United States

Acreage
M= 70 T= 70
1,500' long 100' wide
API gravity
(degrees)
10
Viscosity (cp)
227,000, 23,000 @ 87°F (2 lobes)
Water Porosity Permeability sat.
(%) (md) (%)
2 4
6.5 wt 6-13 wt
32 3,700
Bitumen sat. Sulfur (%) (wt %)
10-12
5.7-13.4 wt
8.6-14.4 wt
64 1.5
Resource in place (m. b.)
2M= 1.2 4M= 100
M= minor deposit
6S= T=
5S= T=
T=
S= T=
10 10
20 20
400
70* 70*
Tables 1-17 15
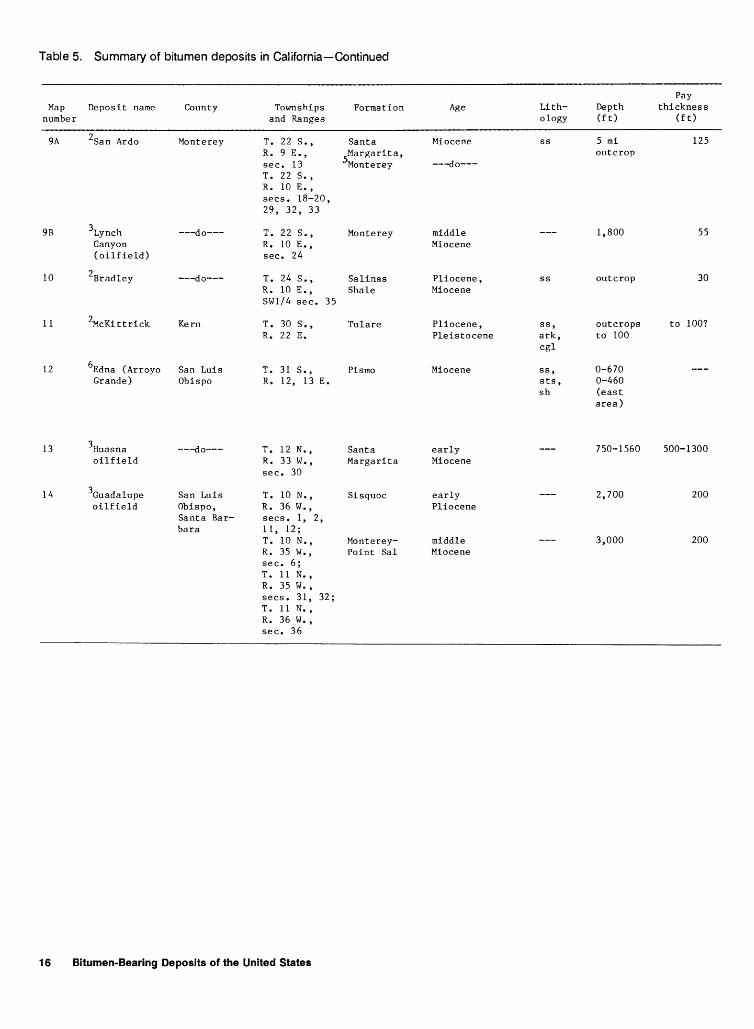
Table 5. Summary of bitumen deposits in California-Continued
Pay Map Deposit name County Townships Formation Age Lith- Depth thickness
number and Ranges ology (f t) (f t)
9A 2san Ardo Monterey T. 22 s., Santa Miocene ss 5 mi 125 R. 9 E.,
5Margarita, outcrop
sec. 13 Monterey ---do---T. 22 s., R. 10 E., sees. 18-20, 29, 32, 33
9B 3Lynch ---do--- T. 22 s., Monterey middle 1,800 55 Canyon R. 10 E., Miocene (oilfield) sec. 24
10 2Bradley ---do--- T. 24 s., Salinas Pliocene, ss outcrop 30 R. 10 E., Shale Miocene SW1/4 sec. 35
11 2McKittrick Kern T. 30 s., Tulare Pliocene, ss, outcrops to 100? R. 22 E. Pleistocene ark, to 100
cgl
12 6Edna (Arroyo San Luis T. 31 s., Pismo Miocene ss, 0-670 Grande) Obispo R. 12, 13 E. sts, 0-460
sh (east area)
13 3Huasna ---do--- T. 12 N., Santa early 750-1560 500-1300 oilfield R. 33 w., Margarita Miocene
sec. 30
14 3Guadalupe San Luis T. 10 N., Sisquoc early 2, 700 200 oilfield Obispo, R. 36 w., Pliocene
Santa Bar- sees. 1, 2, bar a 11, 12;
T. 10 N., Monterey- middle 3,000 200 R. 35 w., Point Sal Miocene sec. 6; T. 11 N., R. 35 I.J., sees. 31, 32; T. 11 N., R. 36 w., sec. 36
16 Bitumen-Bearing Deposits of the United States

API Water Bitumen Resource in Acreage gravity Viscosity Porosity Permeability sat. sat. Sulfur place
(degrees) (cp) (%) (md) (%) (%) (wt %) (m. b.)
310 3.6, 8.9 wt
M= 140 10
13-15 wt 1M= 4,850,000 S= 4,150,000 T= 9,000,000
Indian Knob M= 1,450 8* 15,000 38* 700 38* 3-5 M= 230 T= 1,450 @ 100°C T= 230 East area M= 2,140 ---do--- ---do--- 38 35* --do-- M= 310 T= 2,140 T= 310
M= 40 9 T= 40
M= 1,840 8-14 T= 1,840
12
Tables 1-17 17
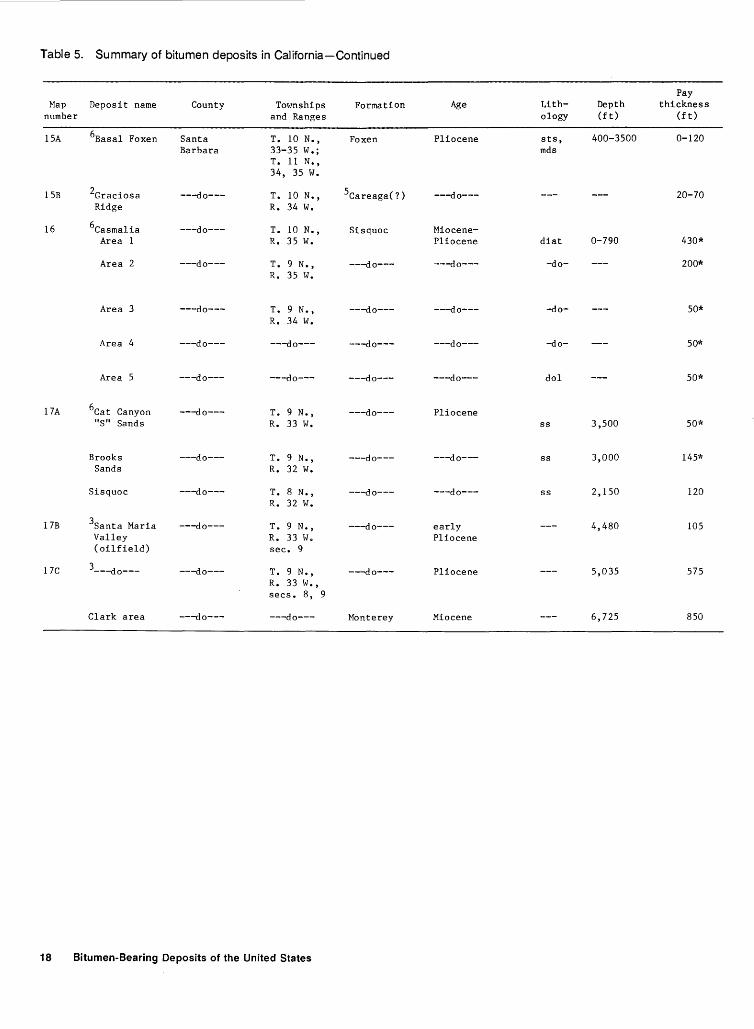
Table 5. Summary of bitumen deposits in California-Continued
Pay Map Deposit name County Townships Formation Age Lith- Depth thickness
number and Ranges ology (ft) (ft)
15A 6Basal Foxen Santa T. 10 N., Foxen Pliocene sts, 400-3500 0-120 Barbara 33-35 w.; mds
T. 11 N., 34, 35 w.
15B 2Graciosa ---do--- T. 10 N., 5careaga(?) ---do--- 20-70 Ridge R. 34 w.
16 6casmalia ---do--- T. 10 N., Sisquoc Miocene-Area 1 R. 35 w. Pliocene diat 0-790 430*
Area 2 ---do--- T. 9 N., ---do--- ---do--- -do- 200* R. 35 w.
Area 3 ---do--- T. 9 N., ---do--- ---do--- -do- 50* R. 34 w.
Area 4 ---do--- ---do--- ---do--- ---do--- -do- 50*
Area 5 ---do--- ---do--- ---do--- ---do--- dol 50*
17A 6cat Canyon ---do--- T. 9 N., ---do--- Pliocene "S" Sands R. 33 w. ss 3,500 50*
Brooks ---do--- T. 9 N., ---do--- ---do--- ss 3,000 145* Sands R. 32 w.
Sisquoc ---do--- T. 8 N., ---do--- ---do--- ss 2,150 120 R. 32 w.
17B 3santa Maria ---do--- T. 9 N., ---do--- early 4,480 105 Valley R. 33 w. Pliocene (oilfield) sec. 9
17C 3 ---do--- ---do--- T. 9 N., ---do--- Pliocene 5,035 575 R. 33 w.' sees. 8, 9
Clark area ---do--- ---do--- Monterey Miocene 6,725 850
18 Bitumen-Bearing Deposits of the United States

API Water Bitumen Resource in Acreage gravity Viscosity Porosity Permeability sat. sat. Sulfur place
(degrees) (cp) (%) (md) (%) (%) (wt %) (m. b.)
S= 25,000 9-17 47,000 25* 300* 55* 4-5 S= 1,900 T= 25,000 9.5* @ 80°F T= 1,900
M= 91 48 <l 31* M= 50 T= 91 T= 50
M= 115 50 <1 44 M= 40 S= 115 S= 40 T= 230 T= 80
S= 500 S= 30 T= 500 T= 30
S= 700 S= 40 T= 700 T= 40
S= 1,000 S= 60 T= 1,000 T= 60
M= 6,000 6* 12,000- 32 1, 400-5,000 52 M= 610 T= 6,000 1,000,000 T= 610
@ res. temp.
M= 740 15,000 37 3,450 85 M= 220 T= 740 @ res. temp. T= 220
S= 1,200 31 400-1,700 75 S= 280 T= 1,200 T= 280
M= 120 9 T= 120
M= 160 8 T= 160
9
Tables 1-17 19

Table 5. Summary of bitumen deposits in California-Continued
Pay Map Deposit name County Townships Formation Age Lith- Depth thickness
number and Ranges ology (ft) (ft)
17D 6zaca-Sisquoc; Santa T. 8 N., Sisquoc- Barbara R. 31 w., Careaga Pliocene ss 10-340 100* Laguna sees. 2, 3, Sandstone Ranch 13
Zaca oil ---do--- T. 8 N., Monterey Miocene fract. field R. 31 w.' diat
Recs. 29-36
La Brea ---do--- T. 9 N., R. 31 w.' sec. 18
18 2sunset- Kern T. 11 N., Miocene ss outcrop <200-300 Maricopa a. 23 w.'
sees. 18-20; T. 11 N.' R. 24 w.' sees. 13, 14
19 2Gaviota Santa T. 5 N., 5sisquoc, Miocene- cgl, outcrop 25 (coastal) Barbara R. 32 w. Monterey Pliocene ss
20 2Goleta; ---do--- T. 4 N., Monterey Miocene sh 12 La Paterna R. 28 w. Mine
More's ---do--- ---do--- Post- ss 60-100 Landing Pliocene cliffs
21A 3summerland ---do--- T. 4 N., Casitas Pleisto- 140 100 (oilfield) R. 26 w.' cene onshore area sees. 15,
16, 21' 22
21B 3 ---do--- ---do--- T. 4 N., ---do--- ---do--- 220 100 offshore R. 26 w.' area sec. 21
22 2carpenteria; ---do--- T. 4 N •' Monterey Miocene sand 10-25 10-15 Los Conchas R. 25 w. Quarry, Higgins Mine
23A 2Punta Gorda Ventura T. 3 N., ---do--- ---do--- sh 0-100 0.3 veins R. 25 w.' sec. 1
23B 2ventura; Ventura T. 3 N., Monterey(?) Miocene(?) cls, 0.60-1.3 La Brea Mine R. 24 w. sh veins Canon Del Diablo
20 Bitumen-Bearing Deposits of the United States

Acreage
M= 620 T= 620
M= 580 T= 580
M= 110 T= 110
M= 58 T= 58
M= 200 T= 200
API gravity Viscosity Porosity Permeability
(degrees) (cp) (%) (md)
35*
4-6
7
7
Water sat. (%)
Bitumen sat. (%)
40*
516-19 gal/ton
16 wt
19* wt
28 asphalt
40, 15-22
Sulfur (wt %)
Resource in place (m. b.)
M= 90 T= 90
M= 90 T= 90
S= 50 T= 50
Tables 1-17 21

Table 5. Summary of bitumen deposits in California-Continued
Pay Map Deposit name County Townships Formation ~e Lith- Depth thickness
number and Ranges ology (ft) (ft)
24 2sulfur Mtn. Ventura T. 4 N., Fernando Pleistocene cgl, outcrop R. 21 w. ss
25A 6Loma Verde Los Angeles T. 5 N., Radovich Pliocene ss 500- 200 R. 17 w., Sandstone 2,000 sees. 25, 26, 35, 36
25B 3"Golden" ---do--- T. 5 N., Saugus Pleistocene 4,000 40 R. 17 w., sec. 35
26 2Newhall ---do--- T. 3 N •, Repetto, Pliocene ss outcrop R. 15 w., Pi co sees. 7, 18, 19
27 6oxnard Ventura T. 1 N., Pi co ---do---Vaca Tar R. 20-22 w. ss 1,800- 210* sand 2,500
Lower Tar ---do--- T. 2 N., ---do--- ---do--- ss 50* sand R. 22 w.
28 2Rancho La Los Angeles T. 1 s., late alluv. outcrop Brea and R. 14 w. Pleistocene terrace L.A. City
29 3Gaffey ---do--- T. 4 s., Repetto Pliocene ss 1,500 100 (oilfield) R. 14 w.'
sec. 35
30 2Point Ferman ---do--- T. 5 s., Franciscan Jurassic ss outcrop 75 R. 14 w. Sandstone
31 2Chino San T. 2 s., Overlying ss 20 Bernardino R. 8 w. Miocene
32 Richfield Orange T. 3 s.' Repetto Pliocene ss 2,500- 80* R. 9 w., 3,200 sec. 28, 32
33A Newport Bay ---do--- T. 6 s.' sand outcrop R. 10 w.
33B Newport Orange T. 6 s., Puent a early 1,500 300 (oilfield) R. 10 w. Miocene
sec. 28
22 Bitumen-Bearing Deposits of the United States

S= T=
M= T=
S= T=
M= T=
M=
Acreage
600 600
1, 765 1,765
1,900 1,900
20 20
25
API gravity
(dPgrees)
9
5
5
10
9
Viscosity (c )
500,000 @ 100°F
Porosity (%)
30
35
Water Bitumen Permeability sat. sat.
(md) (%) {%)
1,000 45
6,000 75
Sulfur (wt %)
6-7
Resource in place
(m. b.)
S= 90 T= 90
M= 500 T= 500
S= 160 T= 160
S= 40 T= 40
Tables 1-17 23
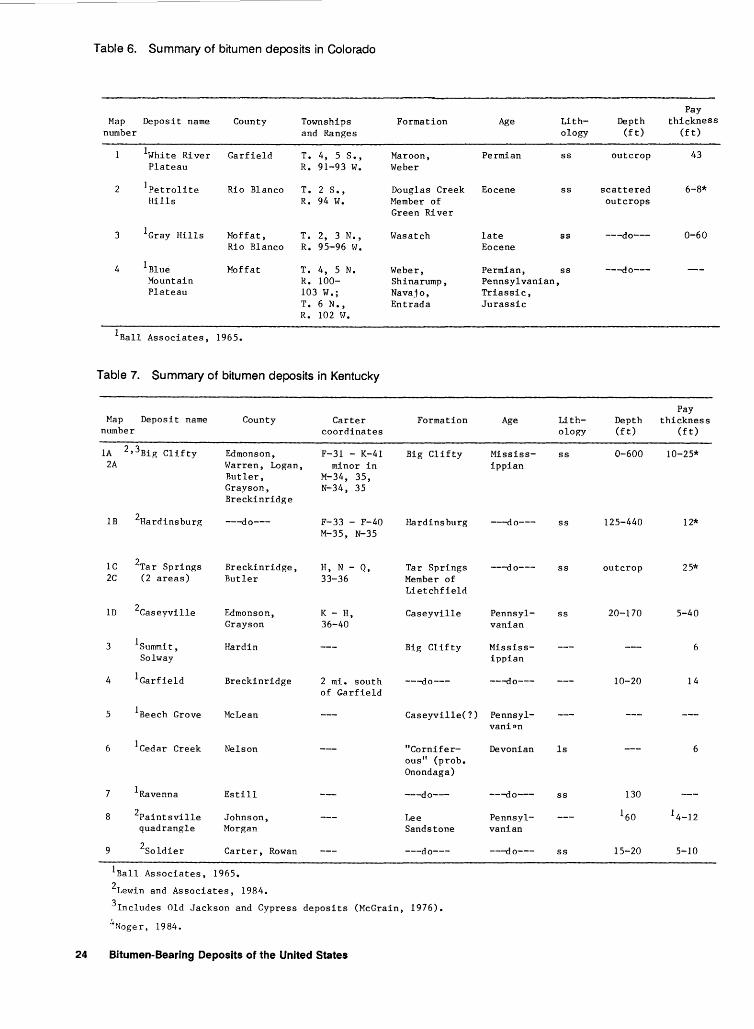
Table 6. Summary of bitumen deposits in Colorado
Map Deposit name number
2
3
4
1whi te River Plateau
1Petrolite Hills
1Gray Hills
1Blue Mountain Plateau
County
Garfield
Rio Blanco
Moffat, Rio Blanco
Moffat
Townships and Ranges
T. 4, 5 S., R. 91-93 W.
T. 2 S., R. 94 W.
T. 2, 3 N., R. 95-96 W.
T. 4, 5 N. R. 100-103 w.; T. 6 N., R. 102 W.
1Ball Associates, 1965.
Table 7. Summary of bitumen deposits in Kentucky
Map Deposit name number
lA 2 •3Big Clifty 2A
lB 2Hardinsburg
lC 2C
lD
3
4
5
6
7
8
9
2Ta r Springs (2 areas)
2caseyville
1summit, Solway
1Garfield
1Beech Grove
1cedar Creek
1Ravenna
2Paintsville quadrangle
2soldier
County
Edmonson, Warren, Logan, Butler, Grayson, Breckinridge
---do---
Breckinridge, Butler
Edmonson, Grayson
Hardin
Breckinridge
McLean
Nelson
Estill
Johnson, Morgan
Carter, Rowan
1Ball Associates, 1965. 2Lewin and Associates, 1984.
Carter coordinates
F-31 - K-41 minor in
M-34, 35, N-34, 35
F-33 - F-40 M-35, N-35
H, N - Q, 33-36
K - H, 36-40
2 mi. south of Garfield
Formation
Maroon, Weber
Douglas Creek Member of Green River
Wasatch
Weber, Shinarump, Navajo, Entrada
Formation
Big Clifty
Hardinsburg
Tar Springs Member of Lietchfield
Caseyville
Big Clifty
---do---
Age
Permian
Eocene
late Eocene
Lithology
ss
ss
ss
Permian, ss Pennsylvanian, Triassic, Jurassic
Age
Mississippian
---do---
---do---
Pennsylvanian
Mississippian
---do---
Lithology
ss
ss
ss
ss
Caseyville(?) Pennsylvani"n
"Corniferous" (prob. Onondaga)
---do---
Lee Sandstone
---do---
Devonian
---do---
Pennsylvanian
---do---
ls
ss
ss
3rncludes Old Jackson and Cypress deposits (McGrain, 1976).
!+N"oger, 1984.
24 Bitumen-Bearing Deposits of the United States
Depth (ft)
outcrop
scattered outcrops
---do---
---do---
Depth (ft)
0-600
125-440
outcrop
20-170
10-20
15-20
Pay thickness
(ft)
43
6-8*
0-60
Pay thickness
(ft)
10-25*
12*
25*
5-40
6
14
6
5-10

Acreage
Acreage
M= 150,000 S= 200,000 T= 350,000
4M= 66,000 S= 88,000 T= 154,000
S= 34,000 T= 34,000
M= 35,000 S= 44,000 T= 79,000
3T= <3 mi dia.
API gravity
(degrees)
API gravity
(degrees)
10
410
Viscosity (cp)
Viscosity (cp)
Porosity ( %)
Porosity (%)
15
14
20
319.2*
322.7*
Water Permeability sat.
(md) (%)
Water Permeability sat.
(md) (%)
100
10-400
10-100
)100
3160
Bitumen sat. (%)
"low"
Bitumen sat. (%)
45 16-7
40*
21*
0-60
341*
7-8 wt 339*
4-8 wt
25 vol.
4-10 wt
Sulfur (wt %)
Sulfur (wt %)
Resource in place (m.b.)
Resource in place (m. b.)
M= 1,190,000 S= 910,000 T= 2,100,000
4M= 250,000 S= 180,000 T= 430,000
S= 340,000 T= 340,000
M= 300,000 S= 250,000 T= 550,000
Tables 1-17 25
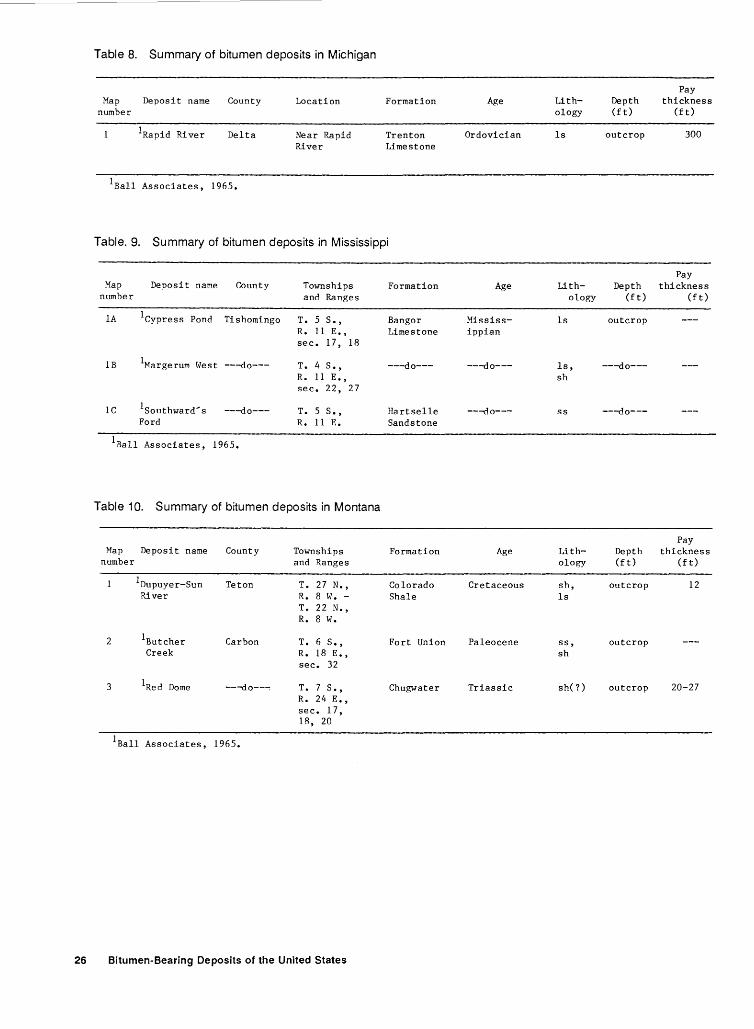
Table 8. Summary of bitumen deposits in Michigan
Pay Map Deposit name County Location Formation Age Lith- Depth thickness
number ology (ft) (ft)
1Rapid River Delta Near Rapid Trenton Ordovician ls outcrop 300 River Limestone
1Ball Associates, 1965.
Table. 9. Summary of bitumen deposits in Mississippi
Pay Map Deposit name County Townships Formation Age Lith- Depth thickness
number and Ranges ology (£ t) (ft)
lA 1cypress Pond Tishomingo T. 5 s., Bangor Mississ- ls outcrop R. 11 E., Limestone ippian sec. 17, 18
lB 1Margerum West ---do--- T. 4 s., ---do--- ---do--- ls, ---do---R. 11 E., sh sec. 22, 27
lC 1southward's ---do--- T. 5 s., Hartselle ---do--- ss ---do---Ford R. 11 E. Sandstone
1Ba11 Associates, 1965.
Table 10. Summary of bitumen deposits in Montana
Pay Map Deposit name County Townships Formation Age Lith- Depth thickness
number and Ranges ology (ft) (f t)
1Dupuyer-Sun Teton T. 27 N., Colorado Cretaceous sh, outcrop 12 River R. 8 w. - Shale ls
T. 22 N., R. 8 w.
2 1Butcher Carbon T. 6 s., Fort Union Paleocene ss, outcrop Creek R. 18 E., sh
sec. 32
3 1Red Dome ---do---: T. 7 s., Chugwater Triassic sh(?) outcrop 20-27 R. 24 E., sec. 17, 18, 20
1Ball Associates, 1965.
26 Bitumen-Bearing Deposits of the United States

Acreage
Acreage
Acreage
API gravity
(degrees)
API gravity
(degrees)
API gravity
(degrees)
Viscosity (cp)
Viscosity (cp)
Viscosity (cp)
Porosity (%)
Porosity (%)
Porosity (%)
Permeability (md)
Permeability (md)
Permeability (md)
Water sat. ( %)
Water sat. (%)
Water sat. (%)
Bitumen sat. (%)
Bitumen sat. ( %)
Bitumen sat. (%)
2.45-6.60
Sulfur (wt %)
Sulfur (wt %)
Sulfur (wt. %)
Resource in place (m. b.)
Resource in place (m.b.)
Resource in place (m. b.)
Tables 1-17 27

Table 11. Summary of bitumen deposits in New Mexico
Map Deposit name County number
2
2santa Rosa
1Gallup
3 (Pinedale)
Guadalupe
McKinley
1Ball Associates, 1965. 2Lewin and Associates, 1984. 3Molenaar, 1977.
Townships and Ranges
T. 9, 10 N., R. 21, 22 E.
T. 16N., R. 16 W., sec. 11
Formation
Santa Rosa
Gallup
3Member of Torrivio Sandstone
Age
Triassic
Cretaceous
Table 12. Summaray of bitumen deposits in New York
Map Deposit name number
1Rochester
2 1Rockville
3
County
Monroe
Allegany
Chautauqua
1Ball Associates, 1965.
Townships and Ranges
Western N.Y.
Rockville
2 mi. SE. of Fredonia
Table 13. Summary of bitumen deposits in Ohio
Map Deposit name number
lA 1Fallsville
lB 1Hillsboro
lC
2A
2B
3
1Brick School
1Locust Grove
1sinking Spring
1Buckland
County
Highland
---do---
---do---
Adams
Highland
Auglaize
1Ball Associates, 1965.
Townships and Ranges
I 1J2 mi. s. of Careytown
2.5 mi. NW of Hillsboro
5 mi. NW of Hillsboro
1/4 mi. SE Locust Grove
1.5 mi. N of Sinking Spring
T 4 S., R. 5 E.
28 Bitumen-Bearing Deposits of the United States
Formation Age
Niagra Group Silurian
Chemung Group Devonian
Portage Group
Late Devonian
Formation
Pebbles Member Niagra Series
Lilly Member Niagra Series
---do---
Pebbles Member Niagra Series
---do---
Water lime or Helderburg
Age
Late Silurian
Silurian
---do---
Late Silurian
---do---
Devonian
Lithology
ss
ss
Lithology
ls
ss
ss
Lithology
dol
dol
dol
dol
dol
ls
Depth (ft)
outcrop to 170
20*
outcrop
Depth (ft)
outcrop
---do---
---do---
Depth (ft)
exposed in quarry
---do---
Pay thickness
(ft)
38*
Pay thickness
(ft)
5
Pay thickness
(ft)
10
20
15 '"Mod. thick'"
exposed in quarry
---do---
outcrop
22
3

Acreage
M= 6,100 S= 12,000 T= 18,100
Acreage
Acreage
API gravity
(degrees)
12
API gravity
(degrees)
API gravity
(degrees)
Viscosity (cp)
30,000 @ 60°F
Viscosity (cp)
Viscosity (cp)
Porosity (%)
10*
Porosity (%)
Porosity (%)
Water Permeability sat.
(md) ( %)
150
Water Permeability sat.
(md) (%)
Water Permeability sat.
(md) (%)
Bitumen sat. (%)
5*
Bitumen sat. (%)
"high"
)2
Bitumen sat. (%)
<2
1. 5
2.5
Sulfur (wt %)
2.2
Sulfur (wt %)
Sulfur (wt %)
Resource in place
( m. b.)
M= 130,000 S= 220,000 T= 350,000
Resource in place ( m. b.)
Resource in place (m. b.)
Tables 1-17 29

Table 14. Summary of bitumen deposits in Oklahoma
Pay Map Deposit name County Townships Formation Age Lith- Depth thickness
number and Ranges ology (f t) (f t)
1Trinity McCurtain Trinity Cretaceous ss, outcrop 1-15 Group Johnston, ls, to (?) (several loc.) Marshall, cgl
Atoka, Love
2 1Glenn Carter T. 3-6 s.' Glenn Pennsyl- ss outcrop(?) 10-75 Group R. 1' 2 E., vanian (several loc.) 1, 2, w.
3 1ordovician Murray T. 1 N., Simpson, Ordovician ss, outcrop(?) 10-20 Group R. 4 E., Viola ls (3 occur.) T. 1, 2 s., Limestone
R. 1, 2, E.
4 1Permian Comanche, Redbed, Permian ss outcrop(?) 2-30 Group Stevens, Wichita (several loc.) Jefferson,
Kiowa, Garvin, Carter
5 3sulphur Murray T. 1 s., Oil Creek Ordvician ss, 60* R. 3 E., Sandstone, ls sec. 15, Viola 21, 22 Limestone
6 3Dougherty ---do--- T. 1 s., Viola ---do--- ls outcrop )100 R. 2 E.' Limestone to (?) sec. 25, T. 1 s., R. 3 E. sec. 30
7 2south Carter T. 3 s., Otterville, Pennsyl- ss ---do--- 145 Woodford R. 1 w., Primrose, vanian
\Newport) R. 1 E. Lake Ardmore, 445-100 Overbrook, Miss iss-
Rod Club ippian
8 ;overbrook ---do--- T. 5 s., Pontotoc, Permian, ss 20 30 (Hewitt) R. 1 E. Morrow Pennsyl-
vanian
9 3Ardmore ---do--- T. 4 s., Des Moines Pennsyl- 10-25 R. 1 E. vanian
1Ball Associates, 1965. 2Harrison and Burchfield, 1984. zLewin and Associates, 1984. Harrison, et al, 1981.
5williams, 1982.
30 Bitumen-Bearing Deposits of the United States
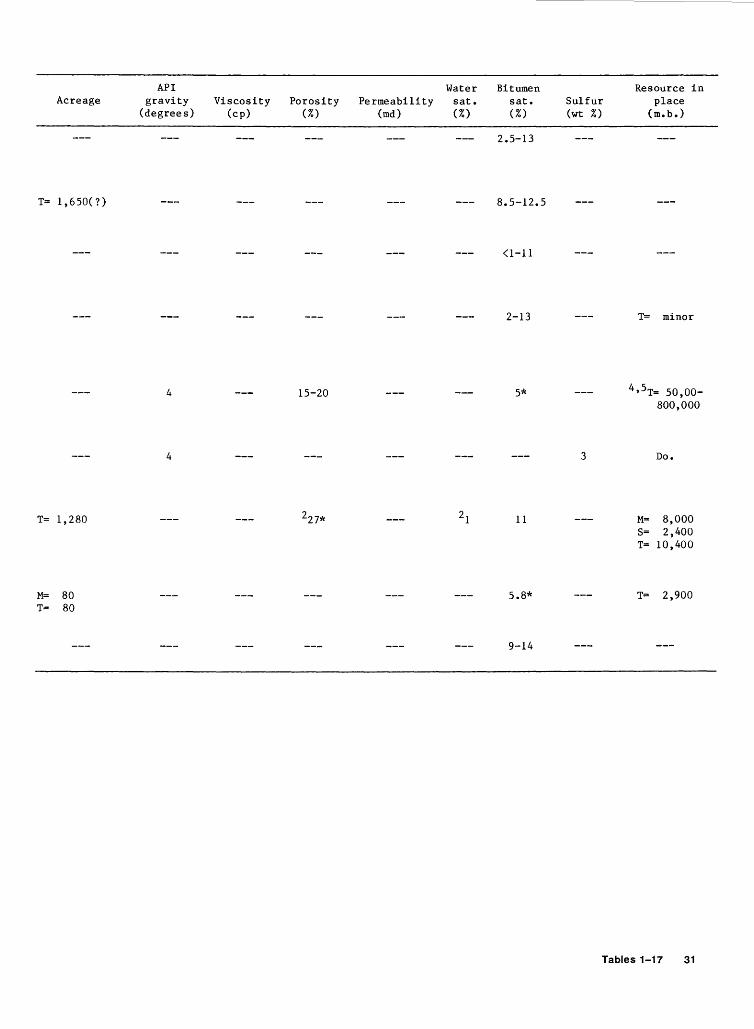
Acreage
T= 1 ,650(?)
T= 1,280
M= 80 T= 80
API gravity
(degrees)
4
4
Viscosity (cp)
Porosity (%)
15-20
227*
Water Permeability sat.
(md) (%)
21
Bitumen sat. (%)
2.5-13
8.5-12.5
<1-11
2-13
5*
11
5.8*
9-14
Sulfur (wt %)
3
Resource in place
( m. b.)
T= minor
4 ' 5T= 50,00-800,000
Do.
M= 8,000 S= 2,400 T= 10,400
T= 2,900
Tables 1-17 31
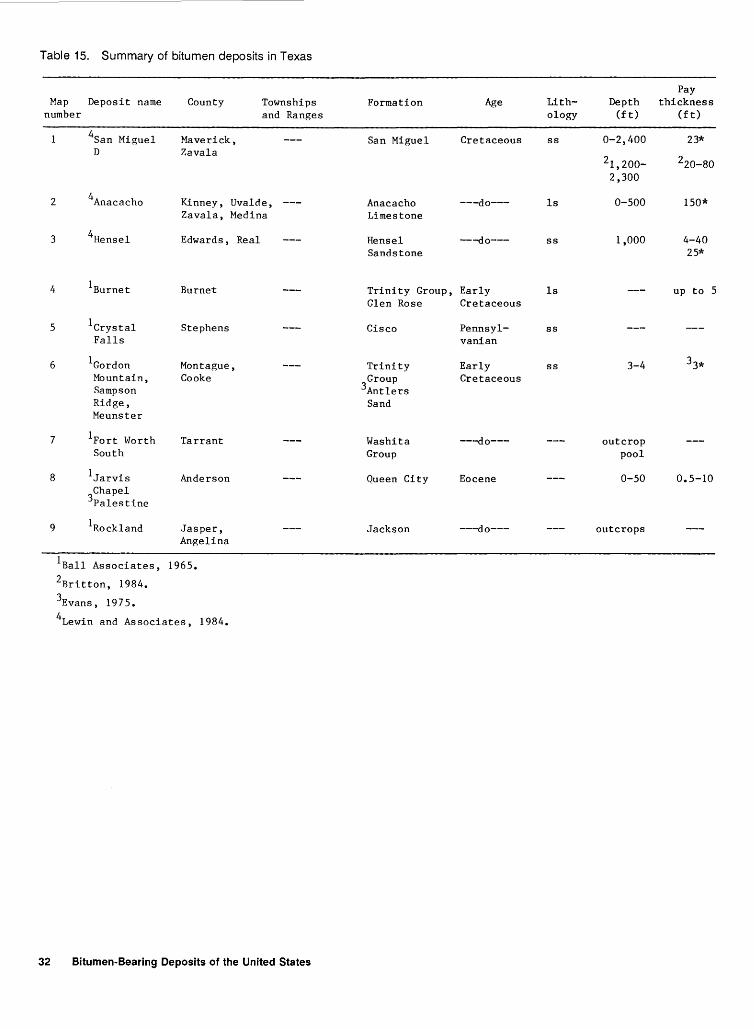
Table 15. Summary of bitumen deposits in Texas
Map Deposit name number
County Townships and Ranges
2
3
4
5
6
7
8
9
4san Miguel D
4Anacacho
4Hensel
1Burnet
1crystal Falls
1Gordon Mountain, Sampson Ridge, Meunster
1Fort Worth South
1Jarvis Chapel
3Palestine
1Rockland
Maverick, Zavala
Kinney, Uvalde, Zavala, Medina
Edwards, Real
Burnet
Stephens
Montague, Cooke
Tarrant
Anderson
Jasper, Angelina
1Ball Associates, 1965. 2Britton, 1984. 3Evans, 19 7 5. 4Lewin and Associates, 1984.
32 Bitumen-Bearing Deposits of the United States
Formation
San Miguel
Anacacho Limestone
Hensel Sandstone
Trinity Group, Glen Rose
Cisco
Trinity Group
3Antlers Sand
Washita Group
Queen City
Jackson
Pay Age Lith- Depth thickness
ology (ft) (ft)
Cretaceous ss 0-2,400 23*
21,200- 220-80 2,300
---do--- ls 0-500 150*
---do--- ss 1,000 4-40 25*
Early ls up to 5 Cretaceous
Pennsyl- ss vanian
Early ss 3-4 33* Cretaceous
---do--- outcrop pool
Eocene 0-50 0.5-10
---do--- outcrops

API Acreage gravity Viscosity Porosity
(degrees) (cp) (%)
M= 115,000 (-2)-10 20,000 - 26-30 S= 49,000 20,000,000 T= 164,000 @ res. temp.
M= 8,400 235,000 @ 25 S= 20,000 70°F T= 28,400 200 @ 150°F
M= 8,100 7 450 @ 210°F 29 T= 8,100 7 5 @ 277°F
3 deposits M= 198 T= 198
Water Permeability sat.
(md) (%)
50-100+
2zso-1 ,ooo
0.2-7,000
8,400
Bitumen sat. (%)
40*
so
52
34.4 wt
10 wt
trace to full
Resource in Sulfur place (wt %) (m.b.)
10 M= 3,200,000 S= 610,000 T= 3,810,000
3 M= 550,000 S= 400,000 T= 950,000
5 M= 120,000 M= 120,000
3T= 11
550
Tables 1-17 33
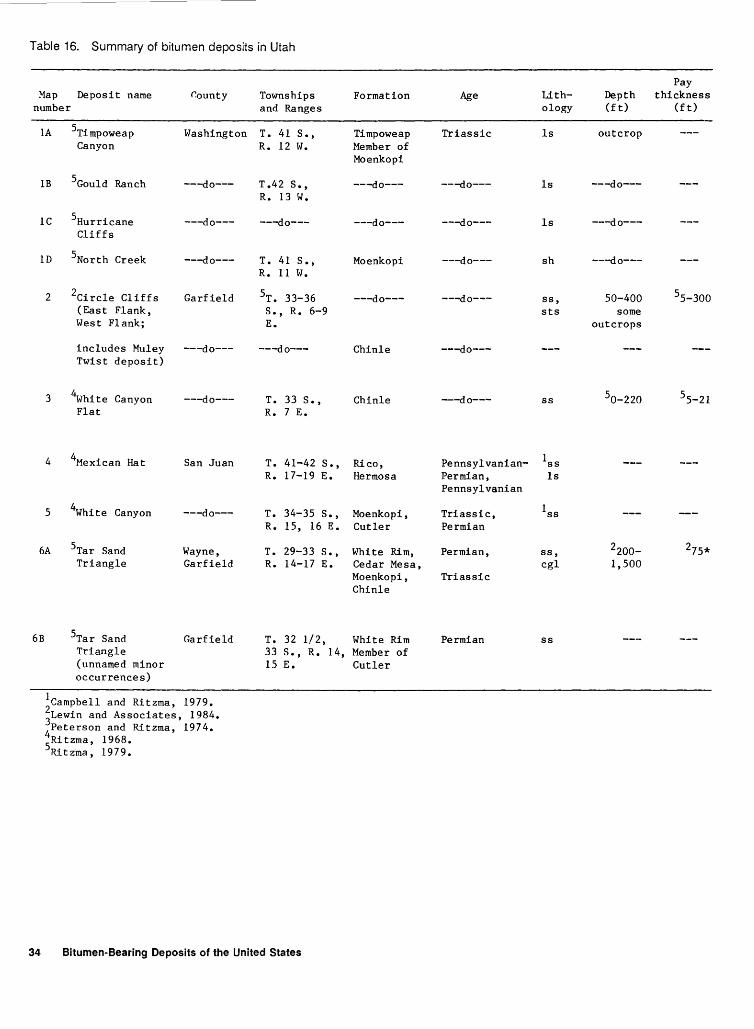
Table 16. Summary of bitumen deposits in Utah
Pay Map Deposit name r.ounty Townships Formation Age Lith- Depth thickness
number and Ranges ology (ft) (ft)
1A STimpoweap Washington T. 41 s., Timpoweap Triassic ls outcrop Canyon R. 12 w. Member of
Moenkopi
1B SGould Ranch ---do--- T.42 S., ---do--- ---do--- ls ---do---R. 13 w.
1C SHurricane ---do--- ---do--- ---do--- ---do--- ls ---do---Cliffs
1D SNorth Creek ---do--- T. 41 s., Moenkopi ---do--- sh ---do---R. 11 w.
2 2circle Cliffs Garfield sT. 33-36 ---do--- ---do--- ss, S0-400 Ss-300 (East Flank, s., R. 6-9 sts some West Flank; E. outcrops
includes Muley ---do--- ---do--- Chinle ---do---Twist deposit)
3 4white Canyon ---do--- T. 33 s., Chinle --do--- ss S0-220 SS-21 Flat R. 7 E.
4 4Mexican Hat San Juan T. 41-42 s., Rico, Pennsylvanian- 1ss R. 17-19 E. Hermosa Permian, ls
Pennsylvanian
s 4White Canyon ---do--- T. 34-3S s., Moenkopi, Triassic, 1ss R. 1S, 16 E. Cutler Permian
6A STar Sand Wayne, T. 29-33 s., White Rim, Permian, ss, 2200- 27S* Triangle Garfield R. 14-17 E. Cedar Mesa, cgl 1,SOO
Moenkopi, Triassic Chinle
6B STar Sand Garfield T. 32 1/2, White Rim Permian ss Triangle 33 s., R. 14, Member of (unnamed minor 1S E. Cutler occurrences)
1campbell and Ritzma, 1979. ~Lewin and Associates, 1984.
4Peterson and Ritzma, 1974.
SRi tzma, 1968. Ri t zma , 1 9 7 9 •
34 Bitumen-Bearing Deposits of the United States

Acreage
M= 6,400 S= 14,000 T= 20,400
2M= 93,000 S= 55,000 T=148,000
API gravity
(degrees)
14.3*
Viscosity (cp)
Porosity (%)
13-17
222* White Rim
17* Moenkopi
Water Permeability sat.
(md) (%)
80
268* 14.7
Bitumen sat. (%)
240
Sulfur (wt %)
Resource in place ( m. b.)
T= 500-1 ,000
13.6 M= S=
53.96 T=
53.5 5M= S= T=
T=
52.7 5T=
13.8* M= S=
T=
M= S= T=
560,000 1,140,000 1,700,000
1,800 1,000 2,800
400-500
12,000-15,000
2,300,000 10,200,000-13,700,000 12,500,000-16,000,000
500 2,500 3,000
Tables 1-17 35

Table 16. Summary of bitumen deposits in Utah-Continued
Pay Map Deposit name County Townships Formation Age Lith- Depth thickness
number and Ranges ology (ft) (ft)
6C 5Poison Spring Garfield T. 31 s., Moenkopi Triassic ss 0-500+ 5-24 Canyon (near R. 13,14 E. Tar Sand Tri-angle)
7 4Teasdale Wayne T. 29, 30 s. Kaibab, Permian, ls, 1capitol Reef R. 6, 7, E. Moenkopi Triassic ss (several loc.)
8 5Thousand Lake ---do--- T. 28 s., Navajo Jurassic ss Mountain R. 4 E. Sandstone
9A 4sweetwater Emery, T. 26 s., Entrada, ---do--- ss dome Wayne R. 14 E. Curtis
9B 2Nequoia Arch ---do--- T. 25-28 s., White Rim, Permian, ss 35* R. 13-16 E. Moenkopi Triassic
10 2 ' 5San Rafael Emery T. 20-26 s., Moenkopi, Triassic ss 0-500 14* Swell R. 9-14 E. Moss Back (10 occur.) Member of Chinle
11 1Ten Mile Wash Grand T. 23, 24 s., Entrada Jurassic ss 50-500+ 55-30 (near Salt R. 18, 19 E. Wash)
12 1salt Wash ---do--- 5T • 22, 23 s., Salt Wash Jurassic 50-500+ 55-30 R. 16, 17 E. Member of
Morrison
13 2P.R. Spring Grand, T. 12-17 s., Green River Eocene 5 ss, 0-300 39* Uintah sts
14 2Hill Creek Uintah T. 13-15 ·s., ---do--- ---do--- 5ss, 0-400 25* R. 19-21 E. sts
15A 2sunnyside Carbon T. 12-14S., Green River, ---do--- 5ss, 0-500 230* R. 13-15 E. Colton sts
15B 2cottonwood- Carbon, sT. 11-13S., Green River ---do--- 5ss, Jacks Canyon Duchesne R. 14-17 E. sts
36 Bitumen-Bearing Deposits of the United States

M= S= T=
T= S= T=
M= S= T=
M= S= T=
M= S= T=
Acreage
63,000 39,000
102,000
26,000 26,000 52,000
60,000 125,000 185,000
10,000 77,000 87,000
35,000 44,000 79,000
API gravity
(degrees)
9
39.5
3g
8
Viscosity (cp)
400,000 (at 140°) 1,000,000 (at 77°)
100,000 (at res. temp.)
Porosity (%)
18-30
21-30
10-28
Water Permeability sat.
(md) (%)
700 114
100-1,000 317
800-1,000 121
Bitumen sat. (%)
52*
38
50*
Sulfur (wt %)
4.5
3.6
12.6
54.2
52.2
3o.4
0.4
0.7
Resource in place
( m. b.)
T= 1,000-1,200
ST= 100-120
M= 730,000 S= 160,000 T= 890,000
M= 300,000 S= 250,000 T= 550,000
5M= 1,500 S= 4,500 T= 6,000
5T= 200-250
M= 2,100,000 S= 2,200,000 T= 4,300,000
M= 300,000 S= 600,000 T= 900,000
5r= 1,200,000
M= 4,400,000 S= 1,700,000 T= 6,100,000
T= 20,000-25,000
Tables 1-17 37
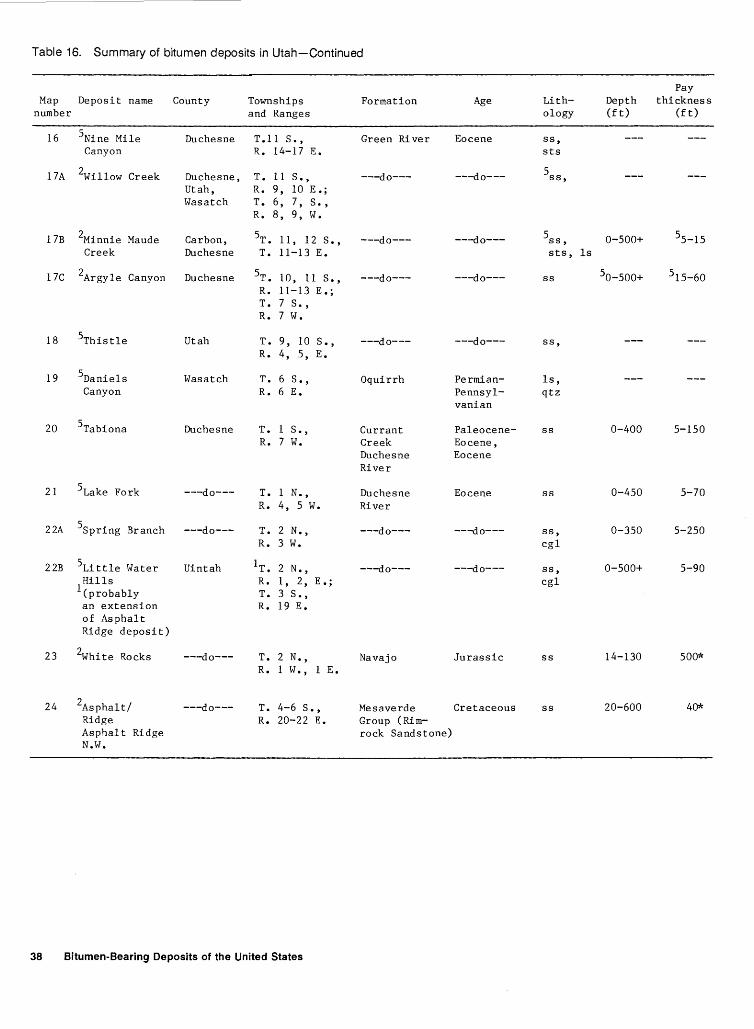
Table 16. Summary of bitumen deposits in Utah-Continued
Pay Map Deposit name County Townships Formation Age Lith- Depth thickness
number and Ranges ology (ft) (f t)
16 SNine Mile Duchesne T .11 s., Green River Eocene ss, Canyon R. 14-17 E. sts
17A 2Willow Creek Duchesne, T. 11 s., ---do--- ---do--- s ss, Utah, R. 9, 10 E.; Wasatch T. 6, 7' s. '
R. 8, 9, w.
17B 2Minnie Maude Carbon, ST • 11, 12 s.' ---do--- ---do--- sss' 0-SOO+ SS-1S Creek Duchesne T. 11-13 E. sts, ls
17C 2Argyle Canyon Duchesne sT. 10, 11 s., ---do--- ---do--- ss So-SOO+ s1S-60 R. 11-13 E •; T. 7 s.' R. 7 w.
18 SThistle Utah T. 9, 10 s.' ---do--- ---do--- ss, R. 4, s, E.
19 SDaniels Wasatch T. 6 s.' Oquirrh Permian- ls, Canyon R. 6 E. Pennsyl- qtz
vanian
20 STabiona Duchesne T. 1 s.' Currant Paleocene- ss 0-400 S-1SO R. 7 w. Creek Eocene,
Duchesne Eocene River
21 SLake Fork ---do--- T. 1 N •' Duchesne Eocene ss 0-4SO S-70 R. 4, s w. River
22A SSp ring Branch ---do--- T. 2 N., ---do--- ---do--- ss, 0-3SO S-2SO R. 3 w. cgl
22B SLittle Water Uintah 1T. 2 N •' ---do--- ---do--- ss, 0-SOO+ S-90
1 ~~~~~ably R. 1' 2, E •; cgl T. 3 s.,
an extension R. 19 E. of Asphalt Ridge deposit)
23 2white Rocks ---do--- T. 2 N •' Navajo Jurassic ss 14-130 SOO* R. 1 w.' 1 E.
24 2Asphalt/ ---do--- T. 4-6 s.' Mesaverde Cretaceous ss 20-600 40* Ridge R. 20-22 E. Group (Rim-Asphalt Ridge rock Sandstone) N.W.
38 Bitumen-Bearing Deposits of the United States
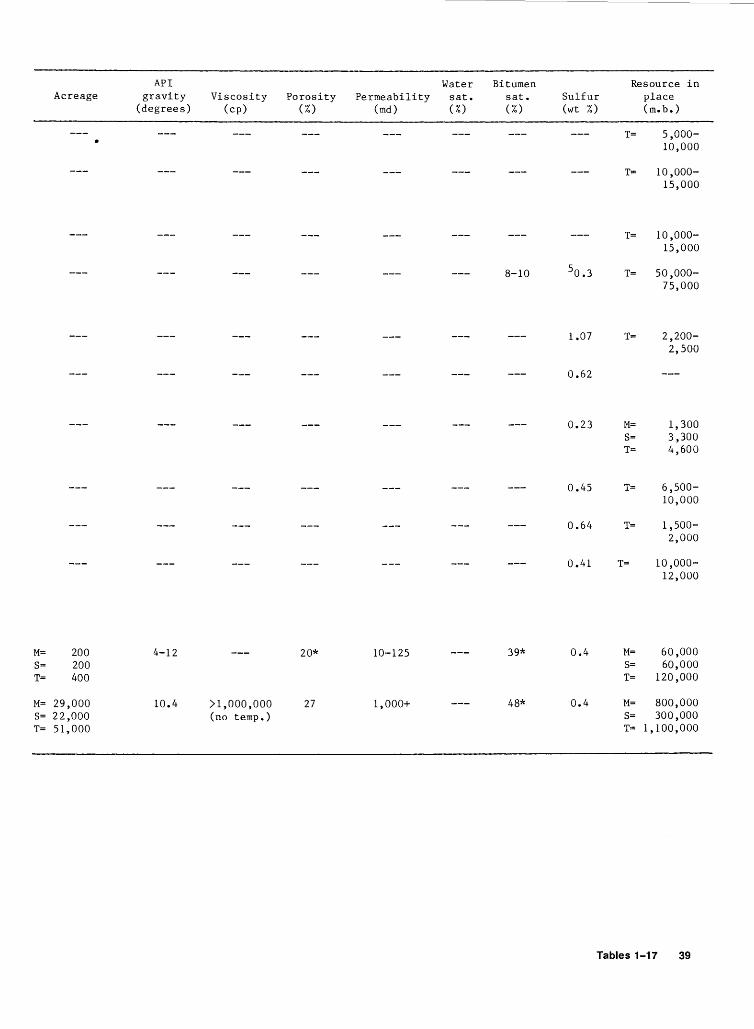
API Water Bitumen Acreage gravity Viscosity Porosity Permeability sat. sat.
(degrees) (cp) (%) (md) (%) (%)
8-10
M= 200 4-12 20* 10-125 39* S= 200 T= 400
M= 29,000 10.4 >1,000,000 27 1,000+ 48* S= 22,000 (no temp.) T= 51,000
Sulfur (wt %)
50.3
1.07
0.62
0.23
0.45
0.64
0.41
0.4
0.4
Resource in
T=
T=
T=
T=
T=
M= S= T=
T=
T=
T=
M= S= T=
M= S= T=
place ( m. b.)
5,000-10,000
10,000-15,000
10,000-15,000
50,000-75,000
2,200-2,500
1,300 3,300 4,600
6,500-10,000
1,500-2,000
10,000-12,000
60,000 60,000
120,000
800,000 300,000
1,100,000
Tables 1-17 39

Table 16. Summary of bitumen deposits in Utah-Continued
Pay Map Deposit name County Townships Formation Age Lith- Depth thickness
number and Ranges ology (ft) (ft)
25 5split Uintah T. 4 s., Park City Permian ls Mountain R. 23, 24 E.
26A 2Raven Ridge ---do--- T. 6, 7, s., Green River Eocene 5ss, 50-500+ 10 R. 24, 25 E. sts 55-48
26B 2Rim Rock ---do--- 4T. 6 s., Wasatch, ---do--- ss 50-500+ 55-95 (NW. Raven R. 24 E. Green River Ridge)
26C 5cow Wash ---do--- T. 6 s., Green River ---do--- ss, 0-200 5-25 R. 24 E. cgl
26D 4upper Kane ---do--- T. 6 s., ---do--- ---do--- 5ss Hollow R. 23 E.
26E 5spring ---do--- T. 6 s., Duchesne ---do--- ss Hollow R. 23 E. River
27 5chapita ---do--- T. 8, 9 s., Uinta ---do--- 1ss 0-300 5-30 Wells R. 22, 23 E.
28 2Pariette Duchesne, sr. 4 s., ---do--- ---do--- 5ss, 50-300 55-32 Uintah R. 2 w. and sts
1, 2 E.; T. 3 s.' R. 19 E.
40 Bitumen-Bearing Deposits of the United States

Acreage
T= 16,000
API gravity
(degrees)
36.6
Viscosity (cp)
Porosity (%)
27
Water Permeability sat.
(md) (%)
Bitumen sat. (%)
30
Sulfur (wt %)
2.9
50.22* 0.35
50.39 3o.37
0.39
50.32
0.76
0.6
50.30
Resource in place (m.b.)
5T= 75,000-100,00
T= 25,000-30,000
T= 1,000-1,200
T= 7,500-8,000
T= 12,000-15,000
Tables 1-17 41

Table 17. Summary of bitumen deposits in Wyoming
Pay Map Deposit name County Townships Formation Age Lith- Depth thickness
number and Ranges ology (f t) (f t)
2Burnt Hollow Crook T. 54, 55 N., Minnelusa Permian ss 600- 35-45* (2 areas) R. 63, 64 w. 1,000
2 1Rocky Ford, ---do--- T. 52 N., ---do--- Pennsylvanian ss 100 Beulah R. 60, 61 w.
3 1oil Butte, ---do--- T. 51' 52 N. t Muddy Cretaceous ss, outcrop Moorcroft R. 67 w. Sandstone, sh
Mowry Shale, Dakota Sandstone
4 1Thornton Weston T. 48 N., Turner Sandy ---do--- ss R. 66 w. Member of
Carlisle Shale
5 1Newcastle ---do--- T. 44, 45 N., Newcastle ---do--- ss R. 61' 62 w.
6 1salt Creek Natrona T. 40 N., Shannon ---do--- ss 8 R. 79 w.
7 1Tisdale Johnson, T. 41 N., Morrison, Jurassic ss 6-7 anticline Natrona R. 81 w. Sundance,
Cloverly Cretaceous
8 1sheep Mtn. Big Horn T. 54 N., Madison Mississippian ls Canyon R. 94 w.
9A 1Red Gulch ---do--- T. 52 N., Tensleep, Pennsylvanian- ss 10 to 10 R. 90 w. Phosphoria Permian outcrop
9B 1Battle ---do--- T. 52 N., Tensleep Pennsyl- ss 6 Creek R. 89 w. vanian
10 1Ekay Creek Natrona T. 38 N., Frontier Cretaceous ss R. 87 w.
llA 1cedar Ridge Fremont T. 39 N., Overturned Cretaceous and tuff R. 90, 91 w. beds along Eocene
a fault
1Ball Associates, 1965. 2Lewin and Associates, 1984.
42 Bitumen-Bearing Deposits of the United States

API Water Bitumen Resource in Acreage gravity Viscosity Porosity Permeability sat. sat. Sulfur place
(degrees) (cp) (%) (md) (%) (%) (wt %) (m.b.)
M= 3,500 5-9 1,000,000 25 1,000-2,000 51 N. area 06 M= 120,000 S= 1,000 @ 53°F 34 s. area S= 25,000 T= 4,500 10 @ 345°F T= 145,000
Tables 1-17 43
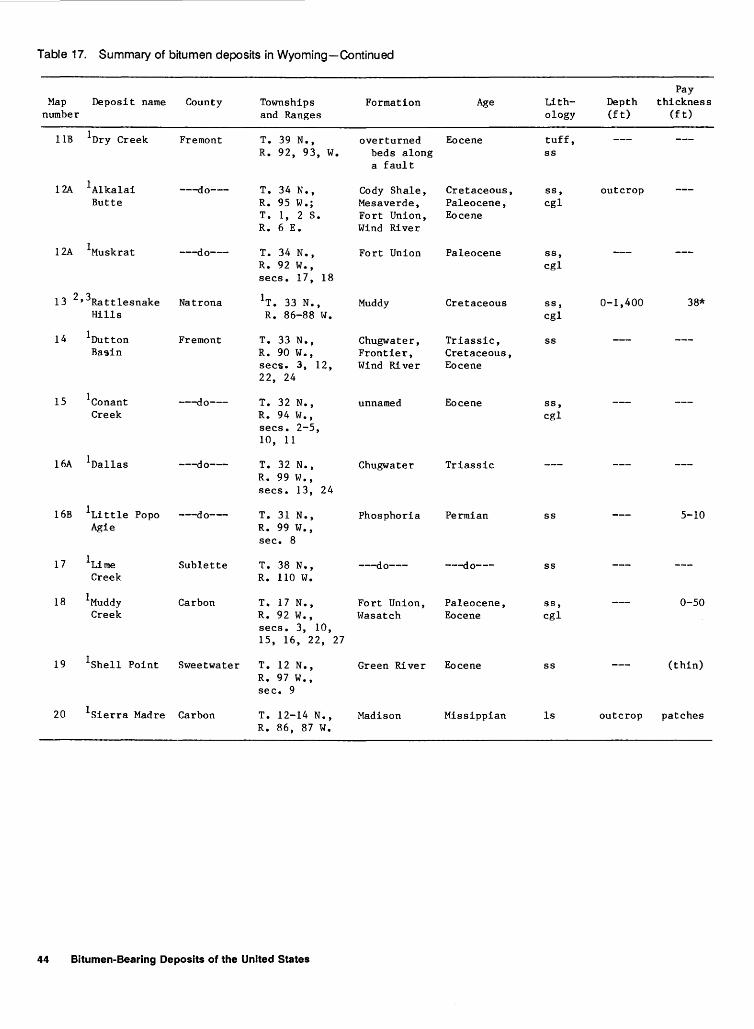
Table 17. Summary of bitumen deposits in Wyoming-Continued
Pay Map Deposit name County Townships Formation Age Lith- Depth thickness
number and Ranges ology (ft) (ft)
liB 1Dry Creek Fremont T. 39 N., overturned Eocene tuff, R. 92, 93, w. beds along ss
a fault
12A 1Alkalai ---do--- T. 34 N., Cody Shale, Cretaceous, ss, outcrop Butte R. 95 w .; Mesaverde, Paleocene, cgl
T. 1' 2 s. Fort Union, Eocene R. 6 E. Wind River
12A 1Muskrat ---do--- T. 34 N., Fort Union Paleocene ss, R. 92 w.' cgl sees. 17, 18
13 2 ' 3Rattlesnake Natrona IT. 33 N., Muddy Cretaceous ss, 0-1,400 38* Hills R. 86-88 w. cgl
14 1Dutton Fremont T. 33 N., Chugwater, Triassic, ss Basin R. 90 W., Frontier, Cretaceous,
sees. 3, 12, Wind River Eocene 22, 24
15 1conant ---do--- T. 32 N., unnamed Eocene ss, Creek R. 94 w.' cgl
sees. 2-5, 10, 11
16A 1Dallas ---do--- T. 32 N., Chugwater Triassic R. 99 w.' sees. 13, 24
16B 1Little Popo ---do--- T. 31 N •' Phosphoria Permian ss 5-10 Agie R. 99 w.'
sec. 8
17 1Lime Sublette T~ 38 N., ---do--- ---do--- ss Creek R. 110 w.
18 1Muddy Carbon T. 17 N., Fort Union, Paleocene, ss, 0-50 Creek R. 92 w.' Wasatch Eocene cgl
sees. 3, 10, 15, 16, 22, 27
19 1shell Point Sweetwater T. 12 N., Green River Eocene ss (thin) R. 97 W., sec. 9
20 1sierra Madre Carbon T. 12-14 N., Madison Missippian ls outcrop patches R. 86, 87 w.
44 Bitumen-Bearing Deposits of the United States
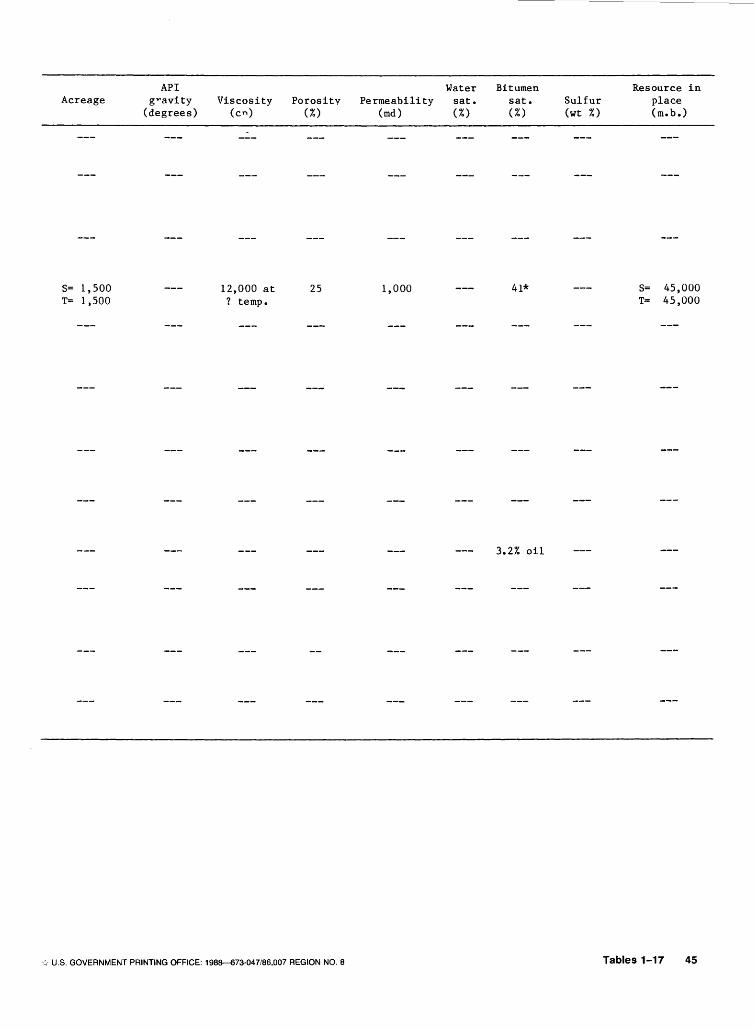
Acreage
S= 1,500 T= 1,500
API g,..avity
(degrees) Viscosity
(en)
12,000 at ? temp.
Porosity (%)
25
{,U.S. GOVERNMENT PRINTING OFFICE: 198~73-047/86,007 REGION NO.8
Permeability (md)
1,000
Water sat. (%)
Bitumen sat. (%)
41*
3.2% oil
Sulfur (wt %)
Resource in place (m. b.)
S= 45,000 T= 45,000
Tables 1-17 45