Embed Size (px)
Citation preview

BJ’S RESTAURANTS, INC.2 014 A N N UA L RE P O RT

PA G E 01

PA G E 01
QUALITY is essential to what makes BJ’s Restaurants GREAT.

A central tenet of Project Q is that every one of our team members is part of the process and encouraged to contribute their ideas for continuous improvement. To date, our restaurant operators have provided over 800 Project Q ideas, of which more than 300 have already been implemented. Our success with Project Q includes the ongoing elimination of unnecessary kitchen complexity, expanded kitchen capacity for further menu enhancements, a reduction in food waste, better labor ef ficiencies, and shorter overall peak cooking times. Each of these improvements is an important part of making our guests’ time at BJ’s an even more positive experience. A little more than one year into the implementation of Project Q, we know that it provides a new standard for how we operate behind the scenes.
While our menu and kitchen efficiency programs are delivering results, we remain commit ted to driving improvements in our operating and occupancy costs. Our fiscal 2014 results clearly demonstrate that rigorous cost containment initiatives can reduce expenses in the middle of our income statement without impacting food quality or the overall guest experience. This past year, we reduced our operating and occupancy costs (excluding marketing spend) by approximately $1,400 per operating week from fiscal 2013. This amounts to an annualized savings of over $10 million and is a key reason restaurant-level margins improved to 17.9% in fiscal 2014 from 17.5% in fiscal 2013 despite minimum wage increases and continued commodity cost inflation. As we head into fiscal 2015, we have already identified additional cost management initiatives that we believe will extend our success with these efforts.
Probably the most exciting aspect of BJ’s is the amount of growth still ahead of us. We finished fiscal 2014 with only 156 open restaurants and continue to believe that we are significantly underpenetrated compared with many of our casual dining restaurant peers. In fact, we believe there is an opportunity for at least 425 BJ’s restaurants nationwide, which means we are only a little over a third of the way there. That said, our goal has always been to get better, not just bigger, and we will continue to balance our expansion opportunities with our steadfast focus on maximizing return on invested capital as we build long-term shareholder value. Central to this goal is our new restaurant prototype. This new restaurant prototype is slightly smaller, costs $1 million less than our previous restaurant design, and we believe is more comfortable and approachable for our guests. This is truly a case of where spending less is delivering a better product, as these new restaurants have
been met with very favorable reviews from our guests and equal enthusiasm from our operating teams as the new layout allows them to deliver a consistently higher level of service.
We expect to open at least 15 new restaurants this year and continue to target an approximate 10% annual increase in operating weeks over the next several years. Our first new restaurant opening of 2015 was in Nanuet, New York, our first location in the Northeast, and is part of our continued national expansion. Overall, our new restaurant pipeline for 2015 is in excellent shape and includes several new locations on the East Coast including sites in Florida, Virginia and Maryland, as well as continued development in the Ohio Valley, including our first restaurant in the Pittsburgh market.
With our initiatives to improve top line sales and restaurant level cash flow delivering continued benefits, lower overall capital expenditure requirements as a result of our new restaurant prototype, and a solid balance sheet that provides ample financial flexibility, our Board of Directors authorized a $100 million share repurchase plan in April 2014 and expanded it by $50 million in August 2014. We returned $100 million to shareholders during the course of the year through the repurchase and retirement of 2.8 million shares of our common stock and entered 2015 with $50 million remaining under this share repurchase authorization. We’ll continue looking to opportunistically return capital to shareholders in 2015 as another means to enhance shareholder value.
In closing, we would like to thank our more than 18,000 Team Members for their ongoing commitment to execute our key operating initiatives and for the success they have achieved. From the first BJ’s Chicago Pizzeria that opened in Southern California in 1978 to our 156 restaurants operating at the end of last year, our commitment to attentive and quality tableside service and hospitality has always been a hallmark of the BJ’s value proposition, and we strive each day to exceed our guests’ expectations. We would also like to thank our guests, shareholders and supplier partners for their ongoing support. We look forward to continued success in 2015 and beyond.
Sincerely,
BJ’s Leadership TeamApril 3, 2015
guests with great taste and great value while providing kitchen and other operating efficiencies that benefit our financial results.
Our menu pipeline for this year is equally exciting, and we expect it to help drive further comparable sales growth. We recently introduced our Tavern Cut Pizza which is offered in six bold flavors and features a thin, crispy crust that is uniquely square cut. Keeping with our efforts to reduce kitchen complexity, this offering is also much simpler and faster to prepare than the hand tossed product it replaced. In addition to the new Tavern Cut Pizza, we introduced three new limited time only flavors for our renowned deep-dish pizza category—Spicy Hawaiian Chicken, Cajun Andouille Sausage and The Prime Veggie. If any restaurant operator knows how to make award-winning deep-dish pizza, it’s BJ’s, and we’re excited to bring these innovative new tastes to a classic dish. Later this year we plan to expand our successful EnLIGHTened Entrees® menu with new Quinoa Bowls and some “better for you” center of the plate entrees. These will be followed in the second half of the year with new, more indulgent items, including new and upgraded recipes in our burger and pasta categories.
We continue to complement our evolving menu with an expanding array of technology offerings that are helping us better engage with our guests and improve core per formance metrics such as guest throughput and frequency of visits. Introduced in June 2014, the BJ’s Mobile App is a terrific option for guests who want to control the pace of their dining experience. The App’s easy-to-use features allow our guests to put their name on the waitlist, order their meals before they are seated, pay using their smartphones and receive loyalty rewards through our BJ’s Premier Rewards Loyalty program. We also introduced a “Net Promoter Score” Guest Survey system this past year whereby over 500 guests per day rate their dining experience in our restaurants. These are just two examples of the new ways we are engaging with our guests to both improve the dining experience at BJ’s and drive positive comparable restaurant sales going forward.
We have also increased our focus on improving the efficiencies and productivity in our restaurants. Central to this has been our Project Quality (“Project Q”) initiative which we rolled out towards the end of fiscal 2013. Project Q targets the reduction of complexity and costs in our operations while helping us deliver improved quality and consistency of food and beverage options for our guests.
Last year we articulated a strategic plan aimed at enhancing our position as a growth company with an emphasis on building a foundation to drive top and bottom line growth while generating higher returns on our invested capital. Our plan focused on reigniting comparable restaurant sales, optimizing our cost structure and improving our unit economics by introducing a more approachable, higher returning new restaurant prototype, as well as a smaller, more efficient menu. We began implementing this plan late in fiscal 2013 as we sought to proactively address the increasing level of competition and innovation in the restaurant industry and our slowing comparable restaurant sales after many years of industry outperformance. Through the continued successful execution of these strategic priorities, we completed fiscal 2014 favorably positioned to return to consistent and sustainable success for many years to come.
During this past fiscal year, total sales increased by over 9% to a record $846 million. We successfully opened 11 new restaurants and expanded our presence in our new “hub” in the mid-Atlantic with three new restaurant openings. While our comparable restaurant sales finished down 0.8% for the year, momentum from our sales building initiatives began to take hold in the second half of the year as we finished with positive comparable restaurant sales of +0.3% and +1.2% in the third and fourth quarters, respectively. Our focus on managing costs while continuing our national expansion, coupled with our improved comparable restaurant sales, allowed us to leverage the increase in revenues to expand our restaurant-level and operating income margins over the prior year. This resulted in net income of $27.4 million and net income per diluted share of $0.97, an increase over the prior year by 30% and 33%, respectively.
Our efforts to reignite comparable restaurant sales began in February with the introduction of our new menu which highlights BJ’s commitment to be a category leader both in terms of value and bold taste. The new menu included 15 new or revised offerings providing more on-trend choices for our guests such as our Kale and Roasted Brussels Sprouts Salad, Mediterranean Chicken Pita Tacos and Cherry Chipotle Salmon, which have proven to be very popular. These items and many others were instrumental in driving comparable restaurant sales for the first time since early 2013. Simultaneously with the introduction of these new menu items, we reduced the overall complexity of our menu by eliminating nearly 12% of the total items and upgrading and enhancing many recipes. Together, these menu changes delivered on our heritage of providing
B J ’ S R E S TA U R A N T S , I N C .
PA G E 0 2
2 014 A N N U A L R E P O R T
PA G E 0 3
to our SHAREHOLDERS:

B J ’ S R E S TA U R A N T S , I N C .
PA G E 0 4
2 014 A N N U A L R E P O R T
PA G E 0 5
This past year, our total sales increased by over 9% TO A RECORD $846 MILLION and we SUCCESSFULLY OPENED 11 NEW RESTAURANTS. Our initiatives to reignite comparable restaurant sales, optimize our cost structure and improve our unit economics RESULTED IN AN INCREASE in Net Income and Net Income Per Diluted Share of 30% and 33%, respectively, and POSITIONED US FOR SUCCESS FOR MANY YEARS TO COME.
Certain statements in this Annual Report and all other statements that are not purely historical constitute “forward-looking” statements for purposes of the Securities Act of 1933 and the Securities and Exchange Act of 1934, as amended, and are intended to be covered by the safe harbors created thereby. Such statements include, but are not limited to, those regarding expected comparable restaurant sales and margin growth in future periods, total potential domestic capacity, the success of various sales-building and productivity initiatives, future guest traffic trends and the number and timing of new restaurants expected to be opened in future periods. These “forward-looking” statements involve known and unknown risks, uncertainties and other factors which may cause actual results to be materially different from those projected or anticipated. Factors that might cause such differences are discussed in the Company’s filings with the Securities and Exchange Commission, including its recent reports on Forms 10-K, 10-Q and 8-K. The “forward-looking” statements contained in this Annual Report are based on current assumptions and expectations and BJ’s Restaurants, Inc. undertakes no obligation to update or alter its “forward-looking” statements whether as a result of new information, future events or otherwise.
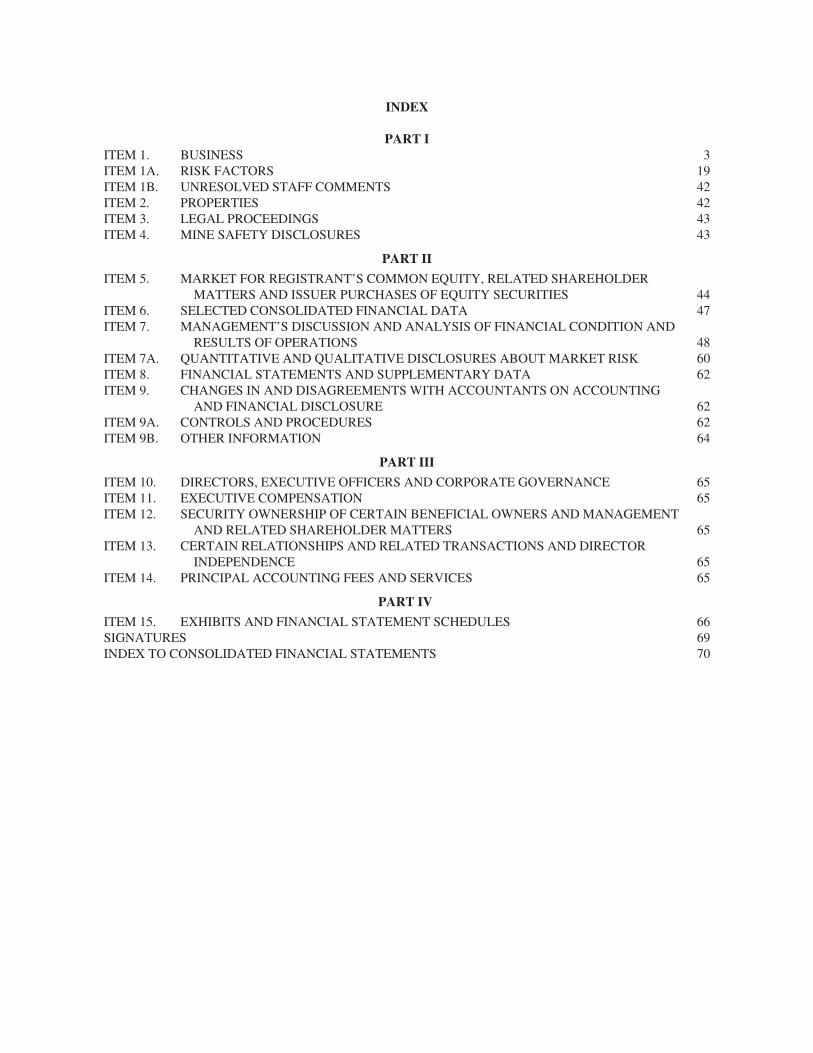
S E L EC T E D F I N A N C I A L H I G H L I G H T S ( d o l l a r s i n t h o u s a n d s , e x c e p t p e r s h a r e a m o u n t s ) 2014 2013 2012 2011 2010
Revenues $ 845,569 $ 775,125 $ 708,325 $ 620,943 $ 513,860
Net Income $ 27,397 $ 21,022 $ 31,409 $ 31,570 $ 23,162
Net Income Per Share:
Basic $ 0.99 $ 0.75 $ 1.12 $ 1.14 $ 0.86
Diluted $ 0.97 $ 0.73 $ 1.09 $ 1.08 $ 0.82
Total Assets $ 647,083 $ 610,879 $ 559,521 $ 502,079 $ 430,085
Shareholders’ Equity $ 348,689 $ 401,436 $ 371,834 $ 332,449 $ 287,826
Number of Restaurants at Year End 156 146 130 115 102
Comparable Restaurant Sales Increase (Decrease) (0.8)% (1.1)% 3.2% 6.6% 5.6%
4
3
5
563
1
2
1
1
1
1
3219
3
2
6
4
3
2
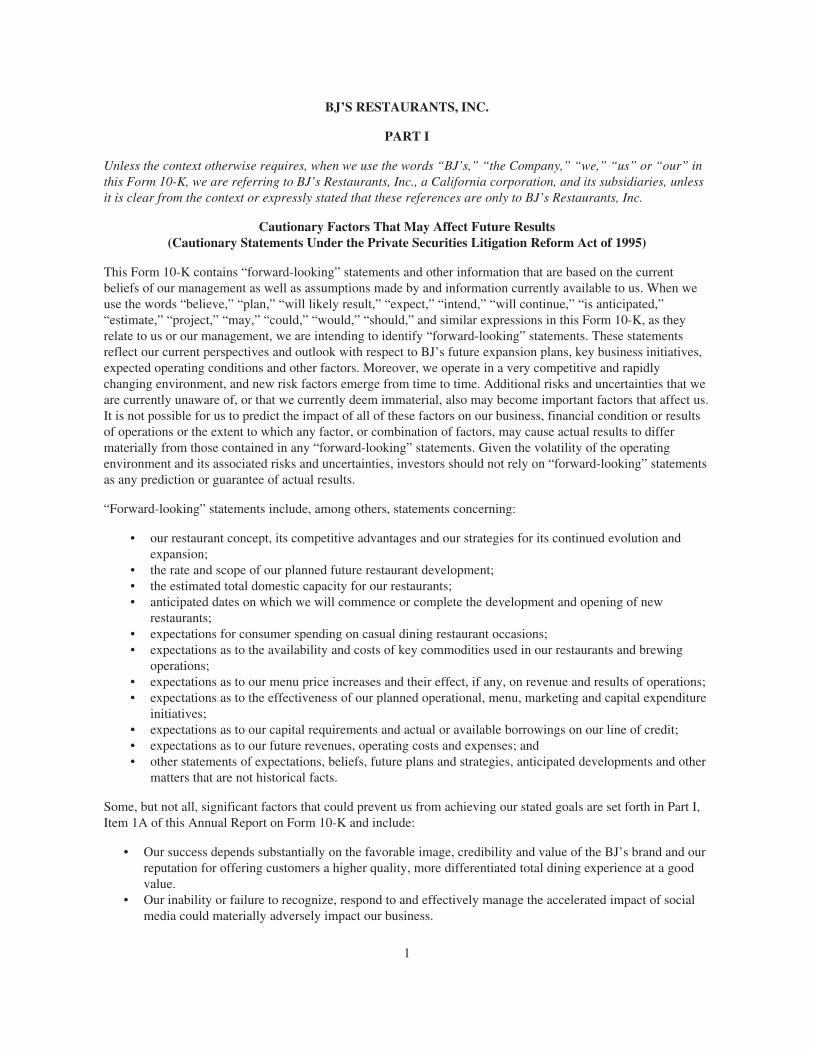
158 RESTAURANTS19 STATES
A S O F A P RI L 3 , 2 015

At BJ’s, our WONDERFUL and INNOVATIVE food is prepared to take your taste buds for a spin.
PA G E 0 6 PA G E 0 7
B J ’ S R E S TA U R A N T S , I N C . 2 014 A N N U A L R E P O R T

PA G E 0 8PA G E 0 8
At our 2014 General Manager Gold Standard Conference we assembled a group of almost 400 volunteers comprised of our restaurant general managers, operations leadership teams and vendor partners to support Operation Gratitude, an organization that annually sends more than 150,000 care packages to New Recruits, Veterans, First Responders, Wounded Warriors, Care Givers and individually named U.S. Service Members deployed overseas. We assembled care packages with personal letters of appreciation, made paracord bracelets for in-field usage by service personnel and we stuffed Battalion Buddy teddy bears for the young children of deployed troops.
Giving back to the communities is as
IMPORTANT as anything we do.
®
B J ’ S R E S TA U R A N T S , I N C .

UNITED STATESSECURITIES AND EXCHANGE COMMISSION
Washington, D.C. 20549
FORM 10-K(Mark one)
È ANNUAL REPORT PURSUANT TO SECTION 13 OR 15(d) OF THE SECURITIES EXCHANGE ACT OF 1934
For the fiscal year ended December 30, 2014
OR‘ TRANSITION REPORT PURSUANT TO SECTION 13 OR 15(d) OF THE SECURITIES EXCHANGE ACT OF 1934
For the transition period from to
Commission file number 0-21423
BJ’S RESTAURANTS, INC.(Exact name of registrant as specified in its charter)
California 33-0485615(State or other jurisdiction ofincorporation or organization)
(I.R.S. EmployerIdentification Number)
7755 Center Avenue, Suite 300Huntington Beach, California 92647
(714) 500-2400
(Address, including zip code, and telephone number, includingarea code, of registrant’s principal executive offices)
Securities registered pursuant to Section 12(b) of the Act:
Title of Each Class Name of each Exchange on Which Registered
Common Stock, No Par Value NASDAQ Global Select Market
Securities registered pursuant to Section 12(g) of the Act:None
Indicate by check mark whether the registrant is a well-known seasoned issuer, as defined in Rule 405 of the Securities Act. YES È NO ‘
Indicate by check mark if the registrant is not required to file reports pursuant to Section 13 or Section 15(d) of the Act. YES ‘ NO È
Indicate by check mark whether the Registrant (1) has filed all reports required to be filed by Section 13 or 15(d) of the Securities Exchange Act of1934 during the preceding 12 months (or for such shorter period that the Registrant was required to file such reports), and (2) has been subject tosuch filing requirements for the past 90 days. YES È NO ‘
Indicate by check mark whether the registrant has submitted electronically and posted on its corporate Website, if any, every Interactive Data Filerequired to be submitted and posted pursuant to Rule 405 of Regulation S-T (Section 232.405 of this chapter) during the preceding 12 months (or forsuch shorter period that the registrant was required to submit and post such files). YES È NO ‘
Indicate by check mark if disclosure of delinquent filers pursuant to Item 405 of Regulation S-K is not contained herein, and will not be contained, tothe best of Registrant’s knowledge, in definitive proxy or information statements incorporated by reference in Part III of this Form 10-K or anyamendment to this Form 10-K. ‘
Indicate by check mark whether the registrant is a large accelerated filer, an accelerated filer, a non-accelerated filer or a smaller reporting company.See definition of “accelerated filer,” “large accelerated filer” and “smaller reporting company” in Rule 12b-2 of the Exchange Act. (Check one):
Large accelerated filer È Accelerated filer ‘
Non-accelerated filer ‘ (do not check if smaller reporting company) Smaller reporting company ‘
Indicate by check mark whether the registrant is a shell company (as defined in Rule 12b-2 of the Act). YES ‘ NO È
The aggregate market value of the common stock of the Registrant (“Common Stock”) held by non-affiliates as of the last business day of the secondfiscal quarter, July 1, 2014, was $853,931,304, calculated based on the closing price of our common stock as reported by the NASDAQ Global SelectMarket on such date.
As of February 25, 2015, 26,266,206 shares of the common stock of the Registrant were outstanding.
DOCUMENTS INCORPORATED BY REFERENCE
Certain portions of the following documents are incorporated by reference into Part III of this Form 10-K: The Registrant’s Proxy Statement for theAnnual Meeting of Shareholders.
INDEX
PART IITEM 1. BUSINESS 3ITEM 1A. RISK FACTORS 19ITEM 1B. UNRESOLVED STAFF COMMENTS 42ITEM 2. PROPERTIES 42ITEM 3. LEGAL PROCEEDINGS 43ITEM 4. MINE SAFETY DISCLOSURES 43
PART II
ITEM 5. MARKET FOR REGISTRANT’S COMMON EQUITY, RELATED SHAREHOLDERMATTERS AND ISSUER PURCHASES OF EQUITY SECURITIES 44
ITEM 6. SELECTED CONSOLIDATED FINANCIAL DATA 47ITEM 7. MANAGEMENT’S DISCUSSION AND ANALYSIS OF FINANCIAL CONDITION AND
RESULTS OF OPERATIONS 48ITEM 7A. QUANTITATIVE AND QUALITATIVE DISCLOSURES ABOUT MARKET RISK 60ITEM 8. FINANCIAL STATEMENTS AND SUPPLEMENTARY DATA 62ITEM 9. CHANGES IN AND DISAGREEMENTS WITH ACCOUNTANTS ON ACCOUNTING
AND FINANCIAL DISCLOSURE 62ITEM 9A. CONTROLS AND PROCEDURES 62ITEM 9B. OTHER INFORMATION 64
PART III
ITEM 10. DIRECTORS, EXECUTIVE OFFICERS AND CORPORATE GOVERNANCE 65ITEM 11. EXECUTIVE COMPENSATION 65ITEM 12. SECURITY OWNERSHIP OF CERTAIN BENEFICIAL OWNERS AND MANAGEMENT
AND RELATED SHAREHOLDER MATTERS 65ITEM 13. CERTAIN RELATIONSHIPS AND RELATED TRANSACTIONS AND DIRECTOR
INDEPENDENCE 65ITEM 14. PRINCIPAL ACCOUNTING FEES AND SERVICES 65
PART IV
ITEM 15. EXHIBITS AND FINANCIAL STATEMENT SCHEDULES 66SIGNATURES 69INDEX TO CONSOLIDATED FINANCIAL STATEMENTS 70
BJ’S RESTAURANTS, INC.
PART I
Unless the context otherwise requires, when we use the words “BJ’s,” “the Company,” “we,” “us” or “our” inthis Form 10-K, we are referring to BJ’s Restaurants, Inc., a California corporation, and its subsidiaries, unlessit is clear from the context or expressly stated that these references are only to BJ’s Restaurants, Inc.
Cautionary Factors That May Affect Future Results(Cautionary Statements Under the Private Securities Litigation Reform Act of 1995)
This Form 10-K contains “forward-looking” statements and other information that are based on the currentbeliefs of our management as well as assumptions made by and information currently available to us. When weuse the words “believe,” “plan,” “will likely result,” “expect,” “intend,” “will continue,” “is anticipated,”“estimate,” “project,” “may,” “could,” “would,” “should,” and similar expressions in this Form 10-K, as theyrelate to us or our management, we are intending to identify “forward-looking” statements. These statementsreflect our current perspectives and outlook with respect to BJ’s future expansion plans, key business initiatives,expected operating conditions and other factors. Moreover, we operate in a very competitive and rapidlychanging environment, and new risk factors emerge from time to time. Additional risks and uncertainties that weare currently unaware of, or that we currently deem immaterial, also may become important factors that affect us.It is not possible for us to predict the impact of all of these factors on our business, financial condition or resultsof operations or the extent to which any factor, or combination of factors, may cause actual results to differmaterially from those contained in any “forward-looking” statements. Given the volatility of the operatingenvironment and its associated risks and uncertainties, investors should not rely on “forward-looking” statementsas any prediction or guarantee of actual results.
“Forward-looking” statements include, among others, statements concerning:
• our restaurant concept, its competitive advantages and our strategies for its continued evolution andexpansion;
• the rate and scope of our planned future restaurant development;• the estimated total domestic capacity for our restaurants;• anticipated dates on which we will commence or complete the development and opening of new
restaurants;• expectations for consumer spending on casual dining restaurant occasions;• expectations as to the availability and costs of key commodities used in our restaurants and brewing
operations;• expectations as to our menu price increases and their effect, if any, on revenue and results of operations;• expectations as to the effectiveness of our planned operational, menu, marketing and capital expenditure
initiatives;• expectations as to our capital requirements and actual or available borrowings on our line of credit;• expectations as to our future revenues, operating costs and expenses; and• other statements of expectations, beliefs, future plans and strategies, anticipated developments and other
matters that are not historical facts.
Some, but not all, significant factors that could prevent us from achieving our stated goals are set forth in Part I,Item 1A of this Annual Report on Form 10-K and include:
• Our success depends substantially on the favorable image, credibility and value of the BJ’s brand and ourreputation for offering customers a higher quality, more differentiated total dining experience at a goodvalue.
• Our inability or failure to recognize, respond to and effectively manage the accelerated impact of socialmedia could materially adversely impact our business.
1

• Any deterioration in general economic conditions may affect consumer spending and may adverselyaffect our revenues, operating results and liquidity.
• Any deterioration in general economic conditions could also have a material adverse impact on ourlandlords or on businesses neighboring our locations, which could adversely affect our revenues andresults of operations.
• If we do not successfully expand our restaurant operations, our growth rate and results of operationswould be adversely affected.
• Our ability to open new restaurants on schedule in accordance with our targeted capacity growth rate maybe adversely affected by delays or problems associated with securing suitable restaurant locations, leasesand licenses, recruiting and training qualified managers and hourly employees to correctly operate ournew restaurants and by other factors, some of which are beyond our control and the timing of which isdifficult to forecast accurately.
• Access to sources of capital and our ability to raise capital in the future may be limited, which couldadversely affect our business and our expansion plans.
• Any failure of our existing or new restaurants to achieve expected results could have a negative impact onour consolidated revenues and financial results, including a potential impairment of the long-lived assetsof certain restaurants.
• Our growth may strain our infrastructure and resources, which could slow our development of newrestaurants and adversely affect our ability to manage our existing restaurants.
• Any decision to either reduce or accelerate the pace of openings may positively or adversely affect ourcomparative financial performance.
• Our costs to construct new restaurants are susceptible to both material and labor cost fluctuations whichcould adversely affect our return on investment results for new restaurants.
• Our future operating results may fluctuate significantly due to the expenses required opening newrestaurants.
• A significant number of our restaurants are concentrated in California, Texas and Florida, which makes usparticularly sensitive to economic, regulatory, weather and other risk factors and conditions that are moreprevalent in those states.
• Our operations are susceptible to changes in our food, labor and related employee benefits (including, butnot limited to, group health insurance coverage for our employees), brewery and energy supplies whichcould adversely affect our profitability.
• Our dependence on independent third party brewers and manufacturers for some of our beer and sodacould have an adverse effect on our operations if they cease to supply us with our proprietary craft beerand sodas.
• Our internal brewing, independent third party brewing and beer distribution arrangements are subject toperiodic reviews and audits by various federal, state and local governmental and regulatory agencies andcould be adversely affected by different interpretations of the laws and regulations that govern sucharrangements or by new laws and regulations.
• Government laws and regulations affecting the operation of our restaurants, including but not limited tothose that apply to the acquisition and maintenance of our brewing and retail liquor licenses, minimumwages, consumer health and safety, health insurance coverage, nutritional disclosures, and employmenteligibility-related documentation requirements could increase our operating costs, cause unexpecteddisruptions to our operations and restrict our growth.
• We are heavily dependent on information technology in our operations as well as with respect to ourcustomer loyalty and employee engagement programs. Any material failure of such technology, includingbut not limited to cyber-attacks, could materially adversely affect our revenues and impair our ability toefficiently operate our business.
• Unsolicited takeover proposals, governance change proposals, proxy contests and certain proposals/actions by activist investors may create additional risks and uncertainties with respect to the Company’sfinancial position, operations, strategies and management, and may adversely affect our ability to attractand retain key employees. Any perceived uncertainties as to our future direction also could affect themarket price and volatility of our securities.
2

• Any failure to complete stock repurchases under our previously announced repurchase program maynegatively impact investor perceptions of us and could therefore affect the market price and volatility ofour stock.
These cautionary statements are to be used as a reference in connection with any “forward-looking” statements.The factors, risks and uncertainties identified in these cautionary statements are in addition to those contained inany other cautionary statements, written or oral, which may be made or otherwise addressed in connection with a“forward-looking” statement or contained in any of our filings with the U.S. Securities and ExchangeCommission (“SEC”). Because of these factors, risks and uncertainties, we caution against placing unduereliance on “forward-looking” statements.
The risks described in this Form 10-K are not the only risks we face. New risks and uncertainties arise from timeto time, and we cannot predict those events or how they may affect us. There may be other risks and uncertaintiesthat are not currently known by us or that are currently deemed by us to be immaterial. However, they mayultimately manifest themselves and thereby have a material adverse effect on our business, financial conditionand/or operating results. Although we believe that the assumptions underlying “forward-looking” statements arereasonable on the dates they are made, any of the assumptions could be incorrect, and there can be no guaranteeor assurance that “forward-looking” statements will ultimately prove to be accurate. “Forward-looking”statements speak only as of the date on which they are made. We do not undertake any obligation to modify orrevise any “forward-looking” statement to take into account or otherwise reflect subsequent events orcircumstances arising after the date that the “forward-looking” statement was made. For further informationregarding the risks and uncertainties that may affect our future results, please review the information set forthbelow under “Item 1A. Risk Factors.”
FISCAL PERIODS USED IN THIS FORM 10-K
Throughout this Form 10-K, our fiscal years ended December 30, 2014, December 31, 2013, January 1,2013, January 3, 2012, and December 28, 2010, are referred to as fiscal years 2014, 2013, 2012, 2011, and 2010,respectively. Our fiscal year consists of 52 or 53 weeks and ends on the Tuesday closest to December 31 forfinancial reporting purposes. All fiscal years presented in this Form 10-K, with the exception of fiscal year 2011,consisted of 52 weeks. Additionally, all quarters, with the exception of the fourth quarter in fiscal year 2011,consisted of 13 weeks. Fiscal year 2011 consisted of 53 weeks with a 14-week fourth quarter; therefore, allfinancial references to fiscal year 2011 assume 53 weeks of operations, unless noted otherwise. We haveincluded in this Form 10-K certain discussions of financial information for fiscal 2011 on an adjusted 52-weekcomparative basis to assist readers in making comparisons to our current and prior fiscal years.
ITEM 1. BUSINESS
GENERAL
As of February 26, 2015, we owned and operated 158 restaurants located in the 19 states of Arizona, Arkansas,California, Colorado, Florida, Indiana, Kansas, Kentucky, Louisiana, Maryland, Nevada, New Mexico,New York, Ohio, Oklahoma, Oregon, Texas, Virginia and Washington. Our restaurants operate under the BJ’sRestaurant & Brewery®, BJ’s Restaurant & Brewhouse®, BJ’s Pizza & Grill®, or BJ’s Grill® names. Our menufeatures BJ’s award-winning, signature deep-dish pizza, our proprietary craft beers and other beers, as well as awide selection of appetizers, entrées, pastas, sandwiches, specialty salads and desserts, including our Pizookie®
dessert. Our proprietary craft beer is produced at several of our BJ’s Restaurant & Brewery® locations as well asby independent third party brewers using our proprietary recipes. Our four BJ’s Pizza & Grill® restaurants are asmaller format, full-service restaurant than our large format BJ’s Restaurant & Brewhouse® and BJ’sRestaurant & Brewery® locations and reflect the original format of the BJ’s restaurant concept that was firstintroduced in 1978. Our BJ’s Restaurant & Brewhouse® format currently represents our primary expansionvehicle. BJ’s Grill® is a smaller footprint restaurant that is currently intended to serve as a live research anddevelopment restaurant, where certain food, beverage, facility, technological and operational enhancements aretested for potential application to our larger restaurants.
3
The first BJ’s restaurant opened in 1978 in Orange County, California, featuring Chicago style deep-dish pizzawith a California twist on the unique flavors of deep-dish pizza. Over the years we expanded the BJ’s conceptfrom its beginnings as a small pizzeria to a full service, high energy casual dining restaurant with a broad menuincluding our BJ’s award-winning, signature deep-dish pizza, as well as appetizers, entrées, pastas, burgers andsandwiches, specialty salads and desserts, including our made to order, warm pizza cookie dessert, the Pizookie®.
In 1996, we introduced our proprietary craft beers when we opened our first BJ’s Restaurant & Brewery® inBrea, California. Today all of our restaurants feature our award-winning, proprietary craft beers, which webelieve differentiates us from many other restaurant concepts, and showcases the quality and care of theingredients we use at BJ’s. Our differentiated, high-quality, craft beers further distinguish BJ’s from many otherrestaurant concepts and complement our signature deep-dish pizza and other menu items. Our beers have earnedover 150 medals at different beer festivals and events, including 30 medals at the Great American Beer Festival.We also offer as many as 30 “guest” domestic and imported craft beers on tap, in addition to a selection ofbottled beers in the majority of our restaurants. Our wide and unique beer offerings are intended to enhance BJ’scompetitive positioning as a leading retailer of beer in the casual dining segment of the restaurant industry.
We compete in the casual dining segment of the restaurant industry, which is a large, highly fragmented segmentwith estimated annual sales in the $100+ billion range. The casual dining segment of the restaurant industry hasbecome a fairly mature segment of the restaurant industry. According to some industry analysts and observers,the annual rate of sales growth for the segment has been gradually decreasing as a result of increased competitionfrom more innovative quick-service and “fast casual” restaurant concepts and other food-away-from-homeretailers, a leveling off of certain favorable demographic trends (the number of two wage-earner households,etc.), stagnant wage growth since 2009; and a perceived over-supply of casual dining restaurants compared todemand. We believe that, in addition to these factors, the segment has suffered from low levels of innovation anda general reduction in the overall quality and differentiation of many of the larger, more mature “mass market”casual dining chains that collectively operate several thousand “commoditized” restaurants.
In contrast to our “mass market” casual competitors, we believe that the BJ’s restaurant concept offers consumersa higher quality, more contemporary and approachable “casual plus” (or “premium casual” or “polished casual”)dining experience. The term “casual plus” typically refers to a competitive positioning that has greater qualityand differentiation when compared to the more mature, “mass market” casual dining concepts with averagecustomer checks of $11.00 to $17.00, but not necessarily as extensive as the “upscale casual” concepts thattypically have average customer checks well in excess of $17.00. Accordingly, our primary business objective isto continue our national expansion program as a “casual plus” restaurant company and attempt to captureadditional market share in the segment over time. Additionally, we continue to evolve our existing restaurantbase by introducing a series of initiatives to drive profitable sales and traffic growth and continuously improvingthe customer dining experience and operating margins.
Our Internet address is http://www.bjsrestaurants.com. Electronic copies of our Annual Report on Form 10-K,quarterly reports on Form 10-Q and current reports on Form 8-K are available, free of charge, by visiting the“Investor Relations” section of our website at http://www.bjsrestaurants.com. These reports are posted as soon asreasonably practicable after they are electronically filed with the SEC. We caution that the information on ourwebsite is not part of this or any other report we file with, or furnish to, the SEC.
THE BJ’s RESTAURANT CONCEPT AND MENU
Our primary growth objective is to expand the BJ’s “casual plus” restaurant concept nationwide and toconsistently deliver the BJ’s dining experience at the “BJ’s Gold Standard of Operational Excellence” byproviding a genuine commitment to passionately connect with every customer, on every visit, through theflawless and relentless execution of every detail during every shift — to create and keep fanatical fans of BJ’sconcept and brand. We believe that by delivering upon this commitment to our customers, we should have thebest opportunity to generate significant repeat business and capture additional market share in the casual diningsegment of the restaurant industry. To achieve these objectives, we plan to focus primarily on the opening of
4
additional BJ’s Restaurant & Brewhouse® format restaurants in new and existing markets in a carefullycontrolled manner.
Our signature menu offering is our deep-dish pizza, which was introduced in 1978. Our unique version of deep-dish pizza is unusually light, with a crispy, flavorful, bakery-type crust. Our pizza is topped with high-qualitymeats, fresh vegetables and a blend of five cheeses. In fiscal 2014, total pizza sales represented approximately13% of our total restaurant sales.
In addition to pizza, we have a broad menu featuring appetizers, specialty salads, soups, pastas, sandwiches,entrées and desserts. All of our menu items are prepared to order using high-quality ingredients. This broadmenu, which we continually evolve, is an important factor in our differentiation from many other casual diningcompetitors. Over the last several years we have continued to evolve and differentiate our menu offerings,including a “Snacks and Small Bites” menu category, featuring small plate appetizers and salads and a lowercalorie and “better for you” menu category called Enlightened Entrées®. In fiscal 2014, we introduced over20 new menu items including such customer favorites as our Kale and Roasted Brussels Sprout Salad, our CherryChipotle Salmon, our Mediterranean Chicken Pita Tacos and our Peanut Butter S’mores Pizookie®. Our menuentrées generally range in price from $7.25 to $24.50. We estimate that our average per-customer check in fiscal2014, including beverages, was approximately $14.50. Our extensive menu and moderate pricing allow us toappeal to a variety of customers and dining occasions, including everyday lunch and dinner, special occasions,and late night business.
Our large, flexible kitchens and bars allow us to adapt to changing consumer tastes and trends regarding food andbeverages. Generally, we evaluate our menu offerings and prices two to three times a year, and we may add,delete or modify certain menu offerings at those times. Substantially all prospective menu and beverage offeringsare initially evaluated by our internal menu development team and then tested in selected restaurants before anycompany-wide rollout.
In addition to adding new menu items, we consistently evaluate our current operating procedures to improve thequality of our offerings. Over this last year we have streamlined many of our operating procedures to enhance ouroperations in order to provide a higher quality product at a faster pace. We have also been gradually reducingsome of our menu items in order to provide additional future menu capacity, innovation in our restaurants andspeed of service. We believe that reducing unnecessary complexity will improve the consistency and speed ofservice in our restaurants which in return will enhance profitability and customer service. In fiscal 2014 we alsolaunched our BJ’s mobile application in both the iTunes store and the Android store. The BJ’s mobile applicationallows our customers to add their name to our wait list before they reach the restaurant, order ahead for bothdine-in and take-out and pay at the table or manage their loyalty account, among other things, from theirsmartphone. We believe BJ’s mobile application is just another way to help our customers enjoy BJ’s restaurantswhile improving the speed of service.
All of our restaurants feature our award-winning, proprietary craft beers, which we believe not only differentiatesus from many other restaurant concepts, but also enhances our desire to provide greater quality and uniqueness toour customers. Approximately 9% of our total restaurant sales in fiscal 2014 consisted of our proprietary craftbeers, which are freshly brewed and are not pasteurized. We also offer as many as 30 “guest” domestic andimported craft beers on tap, in addition to a selection of bottled beers in the majority of our restaurants. Our wideand unique beer offerings are intended to enhance BJ’s competitive positioning as a leading retailer of craft beerin the casual dining segment of the restaurant industry. We use qualified independent third party brewers tosupply us with a portion of our proprietary craft beer. During fiscal 2014, approximately 25% of our proprietarycraft beer was produced at several of our BJ’s Restaurant and Brewery® restaurants and then distributed to ourother restaurants in a “hub and spoke” fashion. The remaining 75% of our proprietary craft beer was produced byother qualified independent third party brewers using our proprietary recipes. During fiscal 2014, our in-housebreweries produced approximately 16,000 barrels of beer, and independent third party brewers producedapproximately 50,000 barrels of beer. We expect independent third party brewers will continue producing themajority of our beers going forward. We also offer a selection of popular wines and spirits for sale in our
5

restaurants. Alcoholic beverages, including our craft beers, represented approximately 22% of our total restaurantsales in fiscal 2014.
RESTAURANT OPERATIONS
Based on internal and publicly available data, we believe that our larger format brewery and brewhouserestaurants, on average, generate relatively high customer traffic per square foot compared to many other casualdining concepts. Therefore, we have implemented operational systems and procedures to support our desire torun our restaurants “quality fast,” particularly at peak dining periods, in order to effectively and efficientlyprocess every customer transaction. The typical management team for a BJ’s restaurant consists of a GeneralManager, an Executive Kitchen Manager and three to five other managers depending on the sales volume foreach restaurant. The General Manager is responsible for the day-to-day operations of their restaurant, includinghiring, training, and the development of personnel, as well as for sales and operating profit. The ExecutiveKitchen Manager is responsible for managing food quality and preparation, purchasing, inventories and kitchenlabor costs. All of our restaurants prepare detailed monthly operating budgets, and compare their actual results totheir budgets. We also measure the productivity and efficiency of our restaurant operations using a variety ofqualitative and quantitative statistical indicators such as kitchen ticket times, actual versus theoretical food waste,items produced or sold per labor hour, controllable operating costs per customer served and other activitymeasures.
New restaurant managers are required to successfully complete an 11-week comprehensive advancedmanagement training program dedicated to all aspects of the operation of our restaurants including bothrestaurateuring and restaurant business-related topics. Our restaurant management training program is directed byour Senior Vice President of Operations Talent Development and is closely monitored by our field supervisionteam. We continuously review our training curriculum for our hourly employees, new managers and our existingrestaurant managers.
The General Manager of each restaurant reports to a Director of Operations or an Area Vice President, whoreports to a Regional Vice President or a Senior Regional Vice President. Additionally, we have Directors ofKitchen Operations who oversee the food quality, kitchen efficiency and consistency in our restaurants and helpeducate, coach and develop our kitchen managers. Our Directors of Kitchen Operations report to the Senior VicePresident of Culinary and Kitchen Innovation. Our Regional and Senior Regional Vice Presidents report to ourChief Restaurant Operations Officer who oversees all aspects of restaurant operations including kitchen and baroperations, restaurant facility management, new restaurant openings and the roll-out of key operationalinitiatives.
In order to serve our relatively large number of customers, we carefully select, train and supervise our restaurant-level employees (“employees”). Additionally, each restaurant typically employs an average of approximately150 hourly employees, many of whom are paid at the statutory minimum wage level and work part-time. Ourgoal is to staff our restaurants with qualified, trained and enthusiastic employees who desire to be an integral partof BJ’s fun, premium casual atmosphere and, at the same time, have the passion, intensity, work ethic and abilityto execute our concept correctly and consistently on every shift. Prior experience in the restaurant industry isonly one of the qualities management looks for in our restaurant employees. Enthusiasm, motivation,dependability, integrity, and the ability to interact well and connect with our customers and correctly execute ourconcept are some of the key qualities of BJ’s management and employees.
In order to maintain our high standards, all new restaurant hourly employees undergo formal training fromcertified Employee Instructors at each restaurant. Our Employee Instructors oversee the training by position foreach new hourly employee and are also utilized to support our new restaurant openings. Our hourly team goesthrough a series of in-depth interactive and automated training for their respective positions. Our future growthand success are highly dependent upon our ability to attract, develop and retain qualified restaurant managementand hourly employees. We attempt to accomplish this by providing our employees with opportunities forincreased responsibilities and advancement as well as performance-driven incentives based on both financial and
6
customer satisfaction metrics. We also support our employees by offering what we believe to be competitivewages and, for eligible employees, competitive fringe benefits (including a 401(k) plan with a company match,medical insurance and dining discounts). Additionally, our General Managers, Executive Kitchen Managers,Directors of Kitchen Operations, Directors of Operations and certain brewery operations employees are eligibleto be selected to participate in our Gold Standard Stock Ownership Program that operates under the authority ofour 2005 Equity Incentive Plan (“the Plan”). This program is intended to be a long-term wealth building programbased on awards of restricted stock units or other equity-based awards and is dependent on the participant’sextended service with us in their respective positions and their achievement of certain agreed upon performanceobjectives during that service period (generally five years).
Excluding our BJ’s Pizza & Grill® restaurants, our typical restaurant hours of operations are generally from11:00 a.m. to 12:00 a.m. Sunday through Thursday and 11:00 a.m. to 1:00 a.m. Friday and Saturday. Ourrestaurants are typically open every day of the year except for Thanksgiving and Christmas. Most of ourrestaurants currently offer either in-house and/or third party delivery service. Additionally, all restaurants offercall-ahead seating, on-line ordering for customer pick-up and reservations for large parties.
RESTAURANT SITE SELECTION AND EXPANSION OBJECTIVES
Our BJ’s Restaurant & Brewhouse® format is currently expected to represent the vast majority of our plannednew restaurant growth for the foreseeable future. We may also open new BJ’s Restaurant & Brewery® formats ifoperating an on-site brewery is the only legally permissible way to offer our proprietary craft beer in certainhighly-desirable locations. Our BJ’s Grill® is a smaller footprint restaurant that is currently intended to serve as alive research and development restaurant, where certain food, beverage, facility, technological and operationalenhancements are tested for potential application to our larger restaurants.
We desire to obtain high-quality, high-profile locations for our “casual plus” restaurants, which we believe havethe ability to draw customers from a larger area than most “mass market” casual dining chain restaurants. Thesizes of our restaurant trade areas vary from location to location, depending on a number of factors such aspopulation density, retail traffic generators and geography. We believe the locations of our restaurants are criticalto our long-term success. Accordingly, we devote significant time and resources to analyzing each prospectivesite. Since BJ’s has proven that it can be successful in a variety of locations (urban or suburban shopping malls,retail strip centers, lifestyle centers, and entertainment centers – either freestanding or in-line) and in a variety ofincome demographics, we can be highly selective and flexible in choosing suitable locations. In general, wecurrently prefer to open our restaurants at high-profile sites in mature trade areas with dense populations.Additionally, we target geographic regions that allow us to build multiple restaurants in those areas. This“clustering” approach can provide specific economic benefits including lower supply and distribution costs,improved marketing efficiencies, management supervision leverage and increased brand awareness. It is not ourcurrent intention to open new restaurants in locations that compete for significant numbers of customers with ourexisting restaurants. However, as with most growing retail and restaurant chain operations, there can be noassurance that sales transfers or “cannibalization” among our locations will not inadvertently occur or becomemore significant in the future as we gradually increase our presence in existing markets to maximize ourcompetitive position and financial performance in each market.
During fiscal 2014, we opened 11 new restaurants and closed an existing, smaller format “Pizza & Grill”restaurant in Belmont Shore, California when its lease expired. As a result, we successfully achieved our statedgoal to increase our total restaurant operating weeks by approximately 11% during the year. During fiscal 2015,we plan to open at least 15 new restaurants. Based on information currently available, we expect to open eightrestaurants during the first half of fiscal 2015 and as many as seven restaurants in the second half of theyear. However, there are a number of risks associated with opening new restaurants and entering new markets,and it is difficult for us to precisely predict the timing of our new restaurant openings due to many factors that areoutside of our control, including those identified under “Risk Factors” in Part I, Item 1A of this Annual Report onForm 10-K.
7

We have signed leases, land purchase agreements or letters of intent for all of our potential restaurant openingsfor fiscal 2015. As of February 26, 2015, the following table sets forth information with respect to futurerestaurant locations that we expect to open in fiscal 2015 and beyond for which leases or land purchaseagreements have been executed:
Future Restaurants with Signed Leases
Huntsville, AlabamaLittle Rock, ArkansasMelbourne, FloridaAvon, IndianaBaltimore, MarylandAlbuquerque, New MexicoColumbus, OhioPittsburgh, PennsylvaniaMurfreesboro, TennesseeSouthlake, TexasNewport News, Virginia
We are currently negotiating additional leases and/or real estate purchases for potential future locations for fiscal2015 and 2016. From time to time, we evaluate opportunities to acquire and convert other restaurant locations orentire restaurant chains to the BJ’s Restaurant concept. However, we currently have no binding commitments(other than the signed leases or land purchase agreements set forth in the table above) or agreements to acquire orconvert any other restaurant locations or chains to our concepts.
We typically enter into leases for our locations for primary periods of 15 to 20 years. We also negotiate for andobtain lease extension options in most instances. Our restaurants can either be freestanding or in-line, and wemay utilize both ground leases and build-to-suit leases. Our rent structures vary from lease to lease, but generallyprovide for the payment of both minimum base rent and contingent (percentage) rent based on restaurant sales.We generally are also responsible for our proportionate share of common area maintenance (“CAM”), insurance,property tax and other occupancy-related expenses under our leases. We expend cash for leasehold improvementsand furnishings, fixtures and equipment to build out our leased premises. We may also expend cash forpermanent structural additions that we make to leased premises.
At times, we may have some of our costs to open a restaurant effectively reimbursed to us by our landlords in theform of tenant improvement allowance incentives pursuant to agreed-upon terms in our leases. If obtained, theseallowances usually take the form of up-front cash, full or partial credits against minimum or percentage rentsotherwise payable by us, or a combination thereof. We typically seek tenant improvement allowances ofapproximately $100 per square foot; however, not every location we develop into a restaurant will have suchallowances available. During fiscal 2014, we opened 11 new restaurants, of which only four restaurants receivedtenant improvement allowances. For these four restaurants, our average tenant improvement allowance wasapproximately $70 per square foot. However, there can be no assurance that such allowances will be available forevery potential location that we seek to develop into a new restaurant. Generally, a landlord will charge usadditional rent for any allowances provided to us in this regard. We may also purchase the land underlyingcertain restaurant locations if it becomes available. However, it is not our current strategy to own a large numberof land parcels that underlie our restaurants. In many cases, we subsequently enter into sale-leasebackarrangements for land parcels that we purchase.
TARGETED NEW RESTAURANT ECONOMICS
Commencing in the second half of fiscal 2014, we began building the vast majority of our new freestandingrestaurants utilizing a new prototype design that costs approximately 20% less than our prior prototype. This newprototype is approximately 7,400 square feet with seating for as many as 225 customers with a targeted grossconstruction cost of approximately $4.0 million (before tenant improvement allowances, if any). However, our
8

investment costs for new restaurants may vary significantly depending on a number of factors including, but notlimited to their absolute sizes, layouts (custom or prototype), type of construction labor (union or non-union),local permitting requirements, the scope of any required site work, the cost of liquor and other licenses and hook-up fees, geographical location and facility type (brewery compared to brewhouse).
In selecting sites for our restaurants, an important objective is to earn a suitable rate of return on our investment.However, this return often cannot be meaningfully measured until our restaurants reach their mature run-ratelevels of sales and profitability. Maturation periods vary from restaurant to restaurant, but generally range fromtwo to five years. As a result of our new prototype, we currently target a blended 30% return on our net cashinvested to build a new restaurant, and a blended 25% return on total capital invested, which includes our netcash invested and a factor for the landlord’s invested capital (based on a capitalized value of minimum rents to bepaid to the landlord) for each group of new restaurants to be opened each year, measured once the restaurantsreach their mature level of operations. Our targeted returns on invested capital in new restaurants may change inthe future, depending upon competitive conditions in the casual dining segment, real estate market conditions,construction and operating cost trends and other factors both within and outside of our control.
The aforementioned return-on-investment targets for our restaurant operations do not consider any allocations ofopening costs, field supervision and corporate support expense, exclude non-cash items such as depreciation,amortization and equity-related compensation expense, exclude income taxes, and do not represent a targetedreturn on an investment in our common stock. Additionally, the actual performance of any new restaurantlocation will usually differ from its originally targeted performance due to a variety of factors, many of which areoutside of our control, and such differences may be material. There can be no assurance that any new restaurantopened will have similar operating results to those of established restaurants. See “Risk Factors” in Part I,Item 1A of this Annual Report on Form 10-K for a discussion of certain risks relating to the development andoperation of our restaurants.
We generally target our new restaurants to achieve average annual sales at maturity of $5.0 million to$6.0 million, and we generally target an average “four wall” estimated operating cash flow margin in the range of18% to 20% at maturity, after all occupancy expenses. Not all new restaurants are expected to achieve ouraverage return-on-investment targets. Some may be targeted to achieve higher returns and some may be targetedto achieve lower returns, based on factors specific to each restaurant location. These factors include, among otherthings, the level of overall consumer and market awareness for our brand in the location’s general trade area; thespecific occupancy structure and capital expenditure requirement for the location; the availability and amount oftenant improvement allowances; and the expected operating cost structure in the trade area (i.e., minimum hourlywages, local costs for fresh commodities such as produce, etc.).
It is common in the casual dining industry for many new locations to initially open with sales volumes well inexcess of their sustainable run-rate levels. This initial “honeymoon” sales period usually results from the energyand excitement generated by restaurant openings in new or remodeled lifestyle centers or retail projects thatgenerate unusually high consumer traffic during grand openings. During the several months following theopening of new restaurants, consumer traffic and sales volumes gradually adjust downward to their expected,more predictable and sustainable run-rate levels. In fact, it may take up to 24 months for a new restaurant’s salesto eventually settle at a more predictable and sustainable run-rate level. Every restaurant has its own individualopening sales pattern, and this pattern is difficult to predict.
Additionally, all of our new restaurants usually require several months after opening, if not longer, to reach theirtargeted restaurant-level operating margin due to cost of sales and labor inefficiencies commonly associated withmore complex casual dining restaurants. How quickly new restaurants achieve their targeted operating margindepends on many factors, including the level of consumer familiarity with our brand when we enter new markets,as well as the availability of experienced managers and employees, and the time required to negotiate and obtainfavorable costs for certain fresh food items and other supplies from local suppliers. As a result, a significantnumber of restaurant openings in any single fiscal quarter, along with their associated opening expenses, couldhave a significant impact on our consolidated results of operations for that period. Therefore, our results of
9

operations for any single fiscal quarter are not necessarily indicative of results expected for any other fiscalquarter nor for a full fiscal year.
RESTAURANT OPENING EXPENSES
Restaurant opening expenses (also referred to as “preopening” expenses) include incremental out-of-pocket coststhat are directly related to the openings of new restaurants that may not be otherwise capitalized. As a result ofthe more complex operational nature of our “casual plus” restaurant concept compared to that of a typical casualdining chain restaurant, the preopening process for our new restaurants is more extensive, time consuming andcostly. The preopening expense for one of our restaurants usually includes costs to compensate an average of sixto eight restaurant management employees prior to opening; costs to recruit and train an average of 150 hourlyrestaurant employees; wages, travel and lodging costs for our opening training team and other supportemployees; costs for practice service activities; and straight-line minimum base rent during the construction andin-restaurant training period. Preopening expenses vary from location to location depending on a number offactors, including the proximity of our existing restaurants; the amount of rent expensed during the constructionand in-restaurant training periods; the size and physical layout of each location; the number of management andhourly employees required to operate each restaurant; the relative difficulty of the restaurant staffing process; thecost of travel and lodging for different metropolitan areas; the timing of the restaurant opening; and the extent ofunexpected delays, if any, in obtaining necessary licenses and permits to open the restaurant. The acquisition ofour necessary operating licenses and permits may also be dependent on our landlords obtaining their licenses andpermits, as well as fully completing their construction activities for the retail projects in which our leasedpremises are located.
Our preopening expense for a prototypical BJ’s Restaurant & Brewhouse® location averaged approximately$0.4 million in fiscal 2014. Preopening expenses are typically higher for non-prototypical, “custom footprint”restaurants and for a restaurant’s initial entry into a new market. During fiscal 2015, we plan to open our firstrestaurant in the states of Alabama, New York, Pennsylvania and Tennessee, where we expect to incur initiallyhigher preopening costs. We usually incur the most significant portion of direct preopening costs within the two-month period immediately preceding and the month of a restaurant’s opening. Preopening costs can fluctuatesignificantly from period to period, based on the number and timing of restaurant openings and the specificpreopening costs incurred for each restaurant. We expense preopening costs as incurred in accordancewith U.S. Generally Accepted Accounting Principles (“U.S. GAAP”).
BREWERY OPERATIONS
Sales of our proprietary craft beers represented approximately 9% of our total restaurant sales during fiscal 2014.In substantially all of our restaurants we also offer a wide selection of other popular craft beers on tap.Accordingly, total sales of beer represented approximately 12% of our total restaurant sales during fiscal 2014.
On average, each of our larger format restaurants utilized approximately 500 barrels of our proprietary craft beerduring fiscal 2014. Our internal brewery operations originated in 1996 with the opening of the first large formatBJ’s Restaurant & Brewery® location in Brea, California, which included our first on-site brewery. The BreaBJ’s Restaurant & Brewery® serviced not only that restaurant, but also several other California restaurants, usinga “hub and spoke” production and distribution model that is legally permitted in California with certainlimitations and restrictions. We currently utilize qualified independent third party brewers to produce themajority of our beer, using our proprietary recipes. In fiscal 2014, our internal breweries produced approximately16,000 barrels of BJ’s branded beer, and independent third party brewers produced approximately 50,000 barrelsof BJ’s branded beer. Our on-site breweries are typically staffed with a head brewer and an assistant brewer, whoreport to a brewing director. Production planning and quality control are monitored by our corporate breweryoperations department which is led by our Senior Vice President of Brewing Operations. Additionally, our on-site and independent third party breweries periodically send out samples of each batch of BJ’s branded beer to anindependent laboratory for quality control testing purposes.
10

The continued growth of our restaurant locations has resulted in a commensurate increase in our requirement forour proprietary craft beer. As a result of that growing requirement, and also in light of the constraints imposed byvarious state “tied-house” laws which regulate how alcoholic beverages are manufactured, distributed andmarketed, we use larger-scale independent third party brewers with greater economies of scale and qualitycontrol capabilities to augment our own internal brewing capabilities. We currently believe that a combination ofinternal brewing and larger-scale independent third party brewing under our indirect supervision represents theoptimal production method for our craft beers as we continue the expansion of our restaurants nationally. Thisapproach allows us to get the benefits provided by brewing beer in larger batches, yet also provides us theflexibility to allow our brewery operation to focus on specialty, seasonal and research and development beers.We will continue to evaluate the benefits of internal brewing versus independent third party brewing andconsider factors such as availability of adequate production capacity, brewery quality control procedures, federaland state laws, consistency of corporate and brand strategy, and the operating and capital costs associated withindependent third party brewing versus the costs of brewery ownership. We estimate our total proprietary craftbeer requirement to be approximately 75,000 barrels for fiscal 2015, with approximately 72% of that requirementexpected to be produced by independent third party brewers. Independent third party manufacturers will alsocontinue to produce substantially all of our craft sodas and cider products.
After utilizing independent third party brewers and distributors to satisfy the vast majority of our proprietary craftbeer requirements for our Texas restaurant operations since their inception in 2002, the Texas AlcoholicBeverage Commission took the position in 2013 that our historical brewing arrangement with respect to thesupply of proprietary craft beer for our Texas restaurants was not in compliance with the provisions of the TexasAlcoholic Beverage Code and related rules and regulations. In January 2014, our subsidiary, Chicago PizzaHospitality Holding, Inc., entered into a Settlement Agreement and Waiver with the Texas Alcoholic BeverageCommission pursuant to which we agreed to terminate the use of independent third party brewers to supplyproprietary craft beer for our Texas restaurants and to transition to production and supply of proprietary craftbeer for our Texas restaurants through licensed brewpubs to be built, owned and operated by us on or beforeJune 30, 2015, at which time all of our proprietary craft beer will be supplied by BJ’s owned and operatedbrewpubs in Texas. Brewpubs, as statutorily defined in Texas, are comparable to breweries as commonlyunderstood elsewhere. As a result of a change in Texas law on September 1, 2013, brewpubs in Texas are nowpermitted to produce up to 10,000 barrels of beer per year and distribute that beer outside of the brewpub to otherlicensed establishments within the state of Texas. We expect that the supply of proprietary craft beer in our Texasrestaurants will be met through the construction and operation of two licensed brewpubs. We do not believe thatthe settlement with the Texas Alcoholic Beverage Commission and the related transition to BJ’s owned andoperated brewpubs in Texas will have a materially adverse effect on our business or results of operations and,except as described above, we have not encountered any material problems relating to alcoholic beveragelicenses or permits to date.
Our proprietary root beer soda has been offered to customers in our restaurants for several years and is one of ourmost popular non-alcoholic beverages. We also offer our proprietary craft sodas product line, including creamsoda, orange and black cherry. Due to the increasing popularity and sales of these products, we outsource themajority of our soda production to an independent third party manufacturer that possesses greater capacity andproduction economies of scale than we do.
MARKETING AND ADVERTISING
We believe that the most effective method, over the long run, to protect and enhance our customer visitfrequency is to spend our marketing dollars on the plate and provide better food quality, service and facilities forour customers. However, due to the sluggish economy and the maturation of the casual dining segment of therestaurant industry, we have been prudently increasing our marketing expenditures to improve our awareness andbrand equity in the markets that we operate. As part of this gradual increase in our marketing spend, we expandedour television testing in select markets in fiscal 2014, as well as used a variety of other media channels includingprint, radio, digital and social media programs. We also utilize our loyalty program, BJ’s Premier Rewards®, toengage with our customers and monitor their frequency and purchasing behavior.
11

Our marketing related expenditures were approximately 2.3%, 2.2%, and 1.5% of revenues for fiscal 2014, 2013and 2012, respectively. We expect our marketing expenditures in 2015 to continue to be between 2% to 3% ofour revenues. However, depending on the current operating conditions for casual dining restaurants, we maydecide to increase or decrease our marketing expenditures beyond our current expectations.
CHARITABLE ACTIVITIES
The BJ’s Restaurants Foundation (the “Foundation”), a 501(c)(3) qualified non-profit charitable organization, isprincipally dedicated to supporting charities that benefit children’s healthcare and education, with a primaryfocus on the Cystic Fibrosis Foundation (“CFF”). Our Chairman of the Board of Directors and two of our currentexecutive officers currently serve on the Foundation’s five-person Board of Directors. We also focus on thesupport of other local community and charitable causes, providing food and other resources for many worthwhilecharitable events. Our commitment to supporting humanitarian causes is exemplified by our “Cookies for Kids”program, which supports CFF by donating a portion of our Pizookie® sales to CFF. In addition, we arrange forthe collection and donation of other funds to CFF through our restaurant preopening training programs. As acollective result of these programs combined with programs administered by the Foundation, we donated$0.4 million, $0.4 million, and $0.5 million to CFF during fiscal 2014, 2013, and 2012, respectively.
The Foundation’s Team Action to Support Communities (“TASC Force”) program recognizes and rewards thevolunteer efforts of our restaurant employees across the country as they help to give back to the communities inwhich our restaurants do business. The TASC Force program received the prestigious Restaurant NeighborAward in the large business category for 2009 from the National Restaurant Association. The TASC Force teamshave helped fulfill the wishes of special needs kids, placed flags in a national cemetery by the graves of fallensoldiers, painted over unsightly graffiti and helped clean up beaches, parks and school grounds. In addition, theTASC Force teams have hosted blood drives, worked with Special Olympics, painted houses for elderly citizens,supported Habitat for Humanity, re-built playgrounds, worked at food banks, participated in fundraising runs andwalkathons and delivered food to families in need.
INFORMATION SYSTEMS
We believe it is extremely important to provide our operators with state of the art technology so that they canbetter serve our customers and our employees in a more productive and efficient manner. These technologiesinclude an automated kitchen display system (“KDS”) and bar display system (“BDS”), a web-based laborscheduling and productivity analyzer system, a theoretical food cost system and an automated front desk tablemanagement system. Each of these systems is integrated into our Point of Sale (“POS”) system which is used torecord sales transactions, send menu orders to our kitchen, batch and transmit credit card transactions, recordemployee time clock information and produce a variety of management reports. Our KDS is an automatedrouting and cooking station balancing system which improves cooking station productivity, synchronizes ordercompletion, provides valuable ticket time and cooking time data, and allows for more efficient levels of laborwithout sacrificing quality. Our BDS is an automated routing and beverage station balancing system whichimproves beverage station productivity by further leveraging our automation capability. Additionally, our web-based labor scheduling and productivity analyzer automates the labor scheduling for the managers and employeesand produces a number of real-time key performance indicators and productivity reports for our managementteam, including controls and alerts to assist in complying with federal, state and local labor laws. Our theoreticalfood cost system and automated food prep system allow us to better measure our product yields and waste in ourkitchens and help reduce kitchen errors and eliminate excessive waste. Our automated front desk tablemanagement system helps us to better optimize the overall seating efficiencies and “table turns” in ourrestaurants. We also utilize a centralized accounting and human resources system that collects data from ourrestaurants in order to produce operational reports and scorecard reporting as well as a data center technologyservices with cloud based technologies to provide scalability and bursting capabilities which support growth andenable rapid technology deployments. In fiscal 2014, we launched our BJ’s application which allowed ourcustomers to order ahead, add their name to our waitlist, pay at the table and manage their loyalty account,among other things, from their smartphone.
12
We will continue to develop restaurant and support technologies that help improve financial management, costcontrol, the customer experience and employee effectiveness. During fiscal 2015, we plan to implement severalmobile management tools for our restaurant operators for performing tasks such as ordering, inventory taking,and quality assurance auditing.
SUPPLY CHAIN MANAGEMENT
Our supply chain department, working together with our culinary research and development team, is responsiblefor the selection and procurement of all of our food ingredients, beverages, products and supplies for ourrestaurants and brewery operations. Additionally, the supply chain department also manages procurementagreements in the areas of energy, transportation and general corporate services. We seek to obtain the highestquality menu ingredients, products and supplies from reliable, approved sources at competitive prices. Wecontinually research and evaluate various food ingredients, products and supplies for consistency and quality andcompare them to our detailed specifications. Ingredient specifications are mandated by the supply chaindepartment in order to consistently maintain the highest quality ingredients and operational materials. In order tomaximize operating efficiencies between purchase and usage, each restaurant’s Executive Kitchen Managerdetermines daily usage requirements for food ingredients, products and supplies for their restaurant and places allorders with vendors approved by our supply chain department. Our Executive Kitchen Managers also inspect ourdeliveries to ensure that the items received meet our quality specifications and negotiated prices. For many of ourmenu ingredients, we have arranged for acceptable alternative manufacturers, vendors, growers and shippersavailable in order to reduce risk in our supply chain.
Where economically feasible and possible, we attempt to negotiate both short-term and long-term contracts forkey commodities used in the preparation of our food and beverage offerings, based on our expected requirementsfor each fiscal year. If our attempts are successful, most of our contracts typically range in duration from three totwelve months, and are generally set to expire at the end of calendar quarters (if quarterly in duration) or at theend of our fiscal year (if annual in duration). We attempt to contract for the majority of our more significantcommodities (chicken, beef and wheat-based products) for various periods of time with the objective ofstabilizing our costs and ensuring product availability. However, there is no assurance that we will be able tocontinue to do so in light of the continuing volatility in the supplies and costs for many food commodities.Although we currently do not directly engage in future contracts or other financial risk management strategieswith respect to potential commodity cost fluctuations, from time to time we may opportunistically request thatour suppliers consider doing so to help minimize the impact of potential cost fluctuations. Suppliers will typicallypass the costs of such strategies along to us, either directly or indirectly.
We use Distribution Market Advantage (“DMA”), a consortium of large, regional food distributors locatedthroughout the United States to deliver the majority of our food products to our restaurants. Our agreement withDMA is for five years expiring June 2017. Jacmar Foodservice Distribution, an affiliate of one of our largershareholders, is a member of DMA and is the primary distributor of food and operating supplies for ourCalifornia and Nevada restaurants. See “Related Party Transactions.” We have a non-exclusive contract withDMA on terms and conditions that we believe are consistent with those made available to similarly situatedrestaurant companies.
Additionally, in 2006 we entered into an agreement with the largest nationwide foodservice distributor of freshproduce in the United States to service most of our restaurants and, where licensed, to distribute our proprietarycraft beer to our restaurants. This distributor currently delivers our proprietary craft beer to approximately 50%of our restaurants. If our relationship with this distributor were discontinued, we would pursue alternativedistributors. However, it may take some time to enter into replacement distribution arrangements, and our costsfor distribution may increase as a result.
The overall cost environment for food commodities can be extremely volatile due to domestic and worldwideagricultural, supply/demand and other macroeconomic factors that are outside of our control. Additionally, theavailabilities and prices of food commodities can also be influenced by increased energy prices, animal-related
13

diseases, natural disasters, increased geo-political tensions, the relationship of the dollar to other currencies,consumer demand both domestically and worldwide, and other factors. Virtually all commodities purchased andused in the restaurant industry, including proteins, grains, oils, dairy products, and energy have varying amountsof inherent price volatility associated with them. Additionally, during periods of rising costs for diesel fuel, ourmajor distributors have the ability under our agreements to pass along fuel surcharges to us that are triggeredwhen their cost per gallon of diesel fuel exceeds a certain assumed level. While we attempt to manage thesefactors by offering a diversified menu and by attempting to contract for our key commodities for extendedperiods of time whenever feasible and possible, there can be no assurance that we will be successful in thisrespect due to the many factors that are outside of our control.
COMPETITION
The domestic restaurant industry is highly competitive and generally considered to be mature. There are asubstantial number of casual dining chain restaurants and other food and beverage service operations thatcompete both directly and indirectly with us in every respect, including food quality and service, the price-valuerelationship, beer quality and selection, atmosphere, suitable sites for new restaurants and for qualified personnelto operate our restaurants, among other factors. We also compete within each of our trade areas with national andregional restaurant chains and locally-owned restaurants. We also face growing competition as a result of thetrend toward convergence in grocery, deli and restaurant services, particularly in the supermarket industry whichoffers “convenient meals” in the form of improved entrées and side dishes.
Our restaurant concept is a relatively small “varied menu” casual dining competitor when compared to themature “mass market” chains, with 63 of our restaurants currently located in one state — California. Our overallbrand awareness and competitive presence in states outside of California is not as significant as that of our majorcasual dining chain competitors. Many competitors with similar concepts to ours have been in business longerthan we have, have greater consumer awareness, and often have substantially greater capital, marketing andhuman resources. Accordingly, we must be prepared to constantly evolve and refine the critical elements of ourrestaurant concept over time to protect our longer-term competitiveness. Additionally, due to the continuingdifficult operating environment for casual dining restaurants, coupled with continuing pressure on consumerspending for restaurant occasions, we expect that our larger chain restaurant competitors will continue to allocateeven more resources to their national media advertising and discounting programs in order to protect theirrespective market shares, which could have an adverse effect on our sales and results of operations.
The restaurant industry can be significantly affected by changes in consumer tastes and nutritional concerns,national, regional or local economic conditions, demographic trends, traffic patterns, weather, and the type andnumber of competing restaurants. Changes in these factors could adversely affect us. In addition, other factorssuch as increased food, beverage, labor, energy and other operating costs could adversely affect us. We believe,however, that our ability to offer higher quality food and beverages at moderate prices with superior service in adistinctive dining environment provides us with the opportunity to capture additional market share in the casualdining segment.
FOOD QUALITY AND SAFETY
Our revenues can be substantially affected by adverse publicity resulting from food quality, illness, or healthconcerns stemming from incidents occurring at a single restaurant of ours as well as incidents that may occur atour competitors’ restaurants. In addition, our revenues can be affected by illness or health concerns stemmingfrom incidents occurring at our suppliers or competing suppliers. While we believe that our internal policies andprocedures for food safety and sanitation are thorough, the risk of food-borne illness cannot be completelyeliminated, and incidents at other restaurant chains or in the food supply chain may affect our restaurants even ifour restaurants are not implicated in a food safety concern. We attempt to manage risks of this nature, but theoccurrence of any one of these factors in any one of our restaurants or elsewhere within the foodservice industrycould cause our entire Company to be adversely affected.
14
RELATED PARTY TRANSACTIONS
As of December 30, 2014, we believe that Jacmar Companies and their affiliates (collectively referred to hereinas “Jacmar”) owned approximately 12.0% of our outstanding common stock. In addition, James Dal Pozzo, theChief Executive Officer of Jacmar, is a member of our Board of Directors. Jacmar, through its affiliation withDMA, is currently our largest supplier of food, beverage, paper products and supplies. We began using DMA forour national foodservice distribution in July 2006. In July 2012, we finalized a new five-year agreement withDMA, after conducting another extensive competitive bidding process. Jacmar services our restaurants inCalifornia and Nevada, while other DMA distributors service our restaurants in all other states. We alsounderstand that Jacmar and its affiliates are the controlling shareholders of the Shakey’s pizza parlor chain. Webelieve that Jacmar sells products to us at prices comparable to those offered by unrelated third parties based onour competitive bidding process. Jacmar supplied us with $86.7 million, $82.8 million, and $78.0 million offood, beverage, paper products and supplies for fiscal 2014, 2013, and 2012, respectively, which represents21.9%, 22.6%, and 23.9% of our total costs of sales and operating and occupancy costs, respectively. We hadtrade payables related to these products of $4.0 million and $4.8 million, at December 30, 2014 andDecember 31, 2013, respectively. Jacmar does not provide us with any produce, liquor, wine or beer products, allof which are provided by other vendors and are included in ”Cost of sales” on the Consolidated Statements ofIncome.
GOVERNMENT REGULATIONS
We are subject to various federal, state and local laws, rules and regulations that affect our business. Each of ourrestaurants is subject to licensing and regulation by a number of governmental authorities, which may includealcoholic beverage control, labor/equal employment, building, land use, health, safety and fire agencies in thestate or municipality in which the restaurant is located. Difficulties obtaining or maintaining the required licensesor approvals could delay or prevent the development of a new restaurant in a particular area or could adverselyaffect the operation of an existing restaurant. We believe, however, that we are in compliance in all materialrespects with all relevant laws, rules, and regulations. We have never experienced abnormal difficulties or delaysin obtaining the licenses or approvals required to open a new restaurant or to continue the operation of anexisting restaurant. Additionally, we are not aware of any environmental regulations that have had or that webelieve will have a materially adverse effect upon our operations.
Alcoholic beverage control regulations require each of our restaurants to apply to a federal and state authorityand, in certain locations, municipal authorities for a license and permit to sell alcoholic beverages on and offpremises. Typically, licenses must be renewed annually and may be revoked or suspended for cause by suchauthority at any time. Alcoholic beverage control regulations relate to numerous aspects of the daily operationsof our restaurants, including minimum age of patrons and employees, hours of operation, advertising, wholesalepurchasing, inventory control and handling, and storage and dispensing of alcoholic beverages.
Our restaurants and breweries are subject to “tied house” laws and the “three tier system” of liquor distribution,both of which were introduced at the federal level after the repeal of Prohibition. These laws generally prohibitbrewers from holding retail licenses and require separate licensing for manufacturers, distributors and retailers.Over the last 25 years, “brewpubs” have been legalized in most states through formalized exceptions to theselaws. However, brewpubs are generally licensed as retailers and do not have the same privileges as amicrobrewery, and the restrictions imposed on brewpubs vary from state to state. These restrictions prevent usfrom operating both brewpubs and restaurants in some states. We believe that we are currently in compliancewith the brewpub regulations in the states where we hold such licenses. However, there is some risk that a state’sbrewpub regulations or the interpretation of these regulations may change in a way that could impact our currentmodel of manufacturing beer and/or supplying beer to our restaurants in that state. We apply for our liquor andbrewing licenses with the advice of outside legal and licensing counsel and consultants. Even after the issuanceof these licenses, our operations could be subject to differing interpretations of the “tied house” laws and therequirements of the “three tier system” of liquor distribution in any jurisdiction that we conduct business.Additionally, the failure to receive or retain, or a delay in obtaining, a liquor license in a particular location couldadversely affect our ability to obtain such a license elsewhere.
15
We are subject to “dram-shop” statutes in California and other states in which we operate. Those statutesgenerally provide a person who has been injured by an intoxicated person the right to recover damages from anestablishment that has wrongfully served alcoholic beverages to such person. We carry liquor liability coverageas part of our existing comprehensive general liability insurance, which we believe is consistent with coveragecarried by other entities in the restaurant industry and would help protect us from exposure created by possibleclaims. Even though we carry liquor liability insurance, a judgment against us under a dram-shop statute inexcess of our liability coverage could have a materially adverse effect on us. Regardless of whether any claimsagainst us are valid or whether we are liable, claims may also be expensive to defend and may divertmanagement’s time and our financial resources away from our operations. We may also be adversely affected bypublicity resulting from such claims.
Various federal and state labor laws, along with rules and regulations, govern our relationship with ouremployees, including such matters as minimum wage, overtime, tip credits, health insurance, working conditions,safety and work eligibility requirements. Significant additional governmental mandates such as an increasedminimum wage, an increase in paid time off or leaves of absence, mandates on health benefits and insurance orincreased tax reporting and payment requirements for employees who receive gratuities, could negatively impactour restaurants. We are also subject to the regulations of the Immigration and Customs Enforcement (“ICE”)branch of the United States Department of Homeland Security. In addition, some states in which we operate haveadopted immigration employment protection laws. Even if we operate our restaurants in strict compliance withICE and state requirements, some of our employees may not meet federal work eligibility or residencyrequirements, despite our efforts and without our knowledge, which could lead to a disruption in our work force.Additionally, our suppliers may also be affected by various federal and state labor laws which could result insupply disruptions for our various goods and services or higher costs for goods and services supplied to us.
We are also subject to various laws and proposals regarding regulations relating to nutritional content, nutritionallabeling, product safety and menu labeling.
We are subject to federal and state environmental regulations. Various laws concerning the handling, storage, anddisposal of hazardous materials, such as cleaning solvents, and the operation of restaurants in environmentallysensitive locations may impact aspects of our operations. During fiscal 2014, there were no material capitalexpenditures for environmental control facilities and no such expenditures are anticipated.
Our facilities must comply with the applicable requirements of the Americans With Disabilities Act of 1990(“ADA”) and related state statutes. The ADA prohibits discrimination on the basis of disability with respect topublic accommodations and employment. Under the ADA and related state laws, when constructing newrestaurants or undertaking significant remodeling of existing restaurants, we must make them readily accessibleto disabled persons. We must also make reasonable accommodations for the employment of disabled persons.
We have a significant number of hourly restaurant employees who receive income from gratuities. We haveelected to voluntarily participate in a Tip Reporting Alternative Commitment (“TRAC”) agreement with theInternal Revenue Service. By complying with the educational and other requirements of the TRAC agreement,we reduce the likelihood of potential employer-only FICA assessments for unreported or under reported tips.
EMPLOYEES
At February 26, 2015, we employed approximately 18,500 employees at our 158 restaurants. Most of ouremployees in our restaurant operations provide their services on a part-time basis. We also employedapproximately 200 employees at our restaurant support center and in our field supervision organization. Webelieve that we maintain favorable relations with our employees. Currently, no unions or collective bargainingarrangements are in place at our Company.
16
INSURANCE
We maintain workers’ compensation, general liability, property, cyber and other insurance coverage withdeductibles and limits that we believe are currently appropriate for our operations. However, we are self-insuredfor a portion of our employee workers’ compensation program and our general liability program. We maintaincoverage with a third party insurer to limit our total exposure for these programs. There is no assurance that anyinsurance coverage maintained by us will be adequate or that we will not experience claims in excess of ourcoverage limits, that we can continue to obtain and maintain such insurance at all or that our premium costs willnot rise to an extent that they adversely affect our ability to economically obtain or maintain such insurance.While we also carry employment practices insurance, a settlement or judgment against us in excess of, or outsideof, our coverage limitations could have a material adverse effect on our results of operations, liquidity, financialposition and business. See “Limitations in our insurance coverage or rising insurance costs could adversely affectour business or financial condition in certain circumstances” in “Risk Factors” contained in Part I, Item 1A ofthis Annual Report on Form 10-K.
TRADEMARKS AND COPYRIGHTS
We believe that our trademarks, service marks and other proprietary rights have significant value and areimportant to our brand-building effort and the marketing of our restaurant concept. Our domestically-registeredtrademarks and service marks include, among others, our stylized logos displaying the name “BJ’s” for restaurantservices, restaurant and bar services, on-line ordering and take-out restaurant services and the word mark “BJ’s”for restaurant and bar services, take-out and carry-out restaurant services. We have also registered with theUnited States Patent and Trademark Office our standard and seasonal beer logos and names, as well as many ofour signature menu item names including “Great White” and “Sweet Pig” for our proprietary pizzas, “Pizookie”for our proprietary dessert and “Wow, I Love This Place” for our proprietary motto. We have registered severalof our marks in a number of foreign countries. Additional domestic and foreign trademark applications arepending. We have also registered our ownership of the internet domain name “www.bjsrestaurants.com” andother internet domain names. We believe that the trademarks, service marks and other proprietary rights havesignificant value and are important to our brand-building effort and the marketing of our restaurant concepts.However, there are other restaurants, retailers and businesses that also use the name “BJ’s” in some form orfashion throughout the United States and abroad. We have in the past protected, and expect to continue tovigorously protect, our proprietary rights. We cannot predict whether steps taken by us to protect our proprietaryrights will be adequate to prevent misappropriation of these rights or the use by others of restaurant featuresbased upon, or otherwise similar to, our concept and products. It may be difficult for us to prevent others fromcopying elements of our concept. Any litigation undertaken to enforce our rights will likely be costly. In addition,we may face claims of misappropriation or infringement of third parties’ trademarks or other intellectual propertyrights. Defending these claims may be costly and, if unsuccessful, may prevent us from continuing to use certainintellectual property rights or information in the future and may result in a judgment or monetary damages.
17
EXECUTIVE OFFICERS
The following table sets forth certain information concerning our executive officers and senior management as ofFebruary 26, 2015:
Name Age Position
Gregory A. Trojan 55 President, Chief Executive Officer and DirectorGregory S. Levin 47 Executive Vice President, Chief Financial Officer and SecretaryGregory S. Lynds 53 Executive Vice President and Chief Development OfficerKevin E. Mayer 45 Executive Vice President and Chief Marketing OfficerJohn D. Allegretto 51 Chief Supply Chain OfficerBrian S. Krakower 44 Senior Vice President and Chief Information OfficerKendra D. Miller 40 Senior Vice President, General Counsel and Assistant SecretaryAlexander M. Puchner 53 Senior Vice President, Brewing OperationsLon F. Ledwith 57 Senior Vice President, Operations Talent Development
GREGORY A. TROJAN has served as our President and a member of the Company’s Board of Directors sinceDecember 2012 and as our Chief Executive Officer since February 2013. Prior to joining the Company,Mr. Trojan was employed by Guitar Center, Inc., a leading retailer of musical instrument products, where heserved as President, Chief Executive Officer and Director from November 2010 to November 2012 and asPresident, Chief Operating Officer and Director from October 2007 to November 2010. From 1998 to 2006,Mr. Trojan served as Chief Executive Officer of House of Blues Entertainment, Inc., an operator of restaurantand music venues, concerts and media properties, having served as President from 1996 to 1998. Prior to that, heheld various positions with PepsiCo from 1990 to 1996, including service as an executive officer and eventuallyas Chief Executive Officer of California Pizza Kitchen, Inc., when it was owned by PepsiCo. Earlier in hiscareer, Mr. Trojan was a consultant at Bain & Company, the Wharton Small Business Development Center andArthur Andersen & Company. Mr. Trojan served on the Board of Directors at Oakley Inc. from June 2005 toNovember 2007. Since March 2010, he has served as a director of Domino’s Pizza, Inc.
GREGORY S. LEVIN has served as our Chief Financial Officer since September 2005. He was promoted toExecutive Vice President in October 2007 and added the post of Secretary in June 2008. From February 2004 toAugust 2005, Mr. Levin served as Chief Financial Officer and Secretary of SB Restaurant Company, a privatelyheld company that operated the Elephant Bar Restaurants. From 1996 to 2004, Mr. Levin was employed byCalifornia Pizza Kitchen, Inc., operator and licensor of casual dining restaurants, with his last position as VicePresident, Chief Financial Officer and Secretary. Earlier in his career, he served as an audit manager withErnst & Young LLP.
GREGORY S. LYNDS has served as our Chief Development Officer since July 2003 and was promoted toExecutive Vice President in October 2007. Prior to joining the Company, Mr. Lynds served as a Director of RealEstate for Darden Restaurants, Inc., the largest casual dining company in America. Prior to joining Darden,Mr. Lynds served as Vice President of Real Estate and Development for Wilshire Restaurant Group (MarieCallender’s and East Side Mario’s) and was a partner responsible for expanding the Mimi’s Café brand.
KEVIN E. MAYER has served as our Executive Vice President and Chief Marketing Officer since July2014. Prior to joining the Company, Mr. Mayer was employed by Volkswagen of America, the U.S. subsidiary ofthe second largest global auto brand, Volkswagen AG, where he served as Vice President of Marketing fromJune 2012 to December 2013. From October 2010 to June 2012, Mr. Mayer was employed by General Motorsand served as their Director of Global Advertising and Promotions for Chevrolet. Prior to that, Mr. Mayer servedas the Director of Marketing Communications for Subaru of America from March 2007 to October 2010. Early inhis career, Mr. Mayer served in a variety of agency and client-side leadership roles such as Grey Advertising.
JOHN D. ALLEGRETTO has served as our Chief Supply Chain Officer since July 2005. Prior to joining theCompany, Mr. Allegretto served as Vice President of Supply Chain Management for Pick Up Stix Restaurants
18
and Cal-International Foods, Inc. (subsidiaries of Carlson Companies, Inc.) from March 2003 to June 2005. Priorto that, Mr. Allegretto was employed by The Walt Disney Company as a director in their Strategic SourcingGroup from October 1997 to February 2003.
BRIAN S. KRAKOWER has served as our Senior Vice President and Chief Information Officer since February2013. Prior to joining the Company, Mr. Krakower served as Chief Technology Officer for RestaurantRevolution Technologies, a restaurant order management technology solutions company. From 2007 to 2012,Mr. Krakower was employed by California Pizza Kitchen, Inc., operator and licensor of casual diningrestaurants, with his last position as Vice President of Information Technology. From 2003 to 2007,Mr. Krakower served as Senior Director of Information Technology — Corporate Systems for The CheesecakeFactory Incorporated, a publicly held operator of upscale casual dining restaurants. Prior to that, Mr. Krakowerwas employed by House of Blues Entertainment, Inc., an operator of restaurant and music venues, concerts andmedia properties, where he served as its Senior Director of Information Systems & Technology from 1997 to2003.
KENDRA D. MILLER has served as our Senior Vice President, General Counsel and Assistant Secretary sinceMarch 2011. From August 2008 to February 2011, Ms. Miller practiced law as a partner at the international lawfirm of Crowell & Moring LLP in Irvine, California. From January 2001 to August 2008, she was employed byCarlton, DiSante & Freudenberger LLP where she became a partner in January 2008. From September 1999 toDecember 2000, she practiced law at Paul, Hastings, Janofsky & Walker LLP, in Los Angeles, California. In herprivate practice, she litigated on behalf of and counseled numerous restaurant chains on employment law andbusiness matters.
ALEXANDER M. PUCHNER has served as our Senior Vice President of Brewing Operations since 1996. From1993 to 1995, Mr. Puchner was a founder and brewmaster for a number of southern California-based brewpubs,including Laguna Beach Brewing Co., Huntington Beach Beer Co., Newport Beach Brewing Co. and WestwoodBrewing Co. From 1988 to 1993, Mr. Puchner served as a product manager for Aviva Sports/Mattel Inc. and as amarketing research manager for Mattel Inc. Mr. Puchner has been a nationally certified beer judge since 1990.
LON F. LEDWITH has served as our Senior Vice President of Operations Talent Development since January2010. Prior to this responsibility within the Company, Mr. Ledwith served as the Company’s Senior VicePresident of Restaurant Operations from April 2006 to December 2009 and as Vice President of Operations fromFebruary 2004 to March 2006. From July 1981 to November 2003, Mr. Ledwith was employed by BrinkerInternational, Inc., with his last position as a Regional Vice President of the Chili’s Grill & Bar concept.
ITEM 1A.RISK FACTORS
The risk factors presented below may affect our future operating results, financial position and cash flows. Therisks described in this Item 1A and other sections of this Annual Report on Form 10-K are not exhaustive and arenot the only risks we may ever face in our business. We operate in a very competitive and rapidly changingenvironment. New risks and uncertainties arise from time to time, and we cannot predict those events or howthey may affect us. There may be other risks and uncertainties that are not currently known or that are currentlydeemed by us to be immaterial. However, they may ultimately adversely affect our business, financial conditionand/or operating results. In addition to the risk factors presented below, changes in general economic conditions,credit markets, consumer tastes, discretionary spending patterns, demographic trends, and consumer confidencein the economy, all of which affect consumer behavior and spending for restaurant dining occasions, may have amaterial impact on us.
Our success depends substantially on the favorable image, credibility and value of the BJ’s brand and ourreputation for offering customers a higher quality, more differentiated total dining experience at a good value.
The successful operation of the BJ’s restaurant concept and the execution of our national expansion plan arehighly dependent upon BJ’s ability to remain relevant to consumers and a brand they trust. We believe that we
19
have built a strong reputation for the quality and differentiation of BJ’s menu and beverage offerings as integralcomponents of the total dining experience that customers enjoy in our restaurants. We believe that we mustcontinue to protect, enhance and evolve the BJ’s brand to continue to be successful in the future. Any incidentthat erodes consumer trust in or affinity for the BJ’s brand could significantly reduce its value. If consumersperceive or experience any reduction in our food or beverage quality, service or facility ambiance, or in any waybelieve we failed to deliver a consistently positive dining experience, the value of the BJ’s brand and our entireCompany could be impaired. We may also need to evolve the BJ’s restaurant concept in order to compete withpopular new restaurant formats or concepts that emerge from time to time, and we cannot provide any assurancethat we will be successful in doing so, or that any changes we make to our concept in response will be successfulor not adversely affect our profitability. In addition, with the increasing prevalence of food-away-from-home atfast casual restaurants, single-serve operations, quick-service restaurants and certain grocery operations,combined with the continuing pressure on consumer discretionary spending for restaurant occasions, consumersmay choose less expensive alternatives to BJ’s which could also negatively affect customer traffic at ourrestaurants.
In addition, our ability to successfully develop new restaurants in new markets may be adversely affected by alack of awareness or acceptance of our brand in these new markets. To the extent that we are unable to fostername recognition and affinity for our brand in new markets, our new restaurants may not perform as expectedand our growth may be significantly delayed or impaired.
Our inability or failure to recognize, respond to and effectively manage the accelerated impact of social mediacould materially adversely impact our business.
There has been a significant increase in the use of social media platforms and similar devices, including weblogs(blogs), social media websites and other forms of Internet-based communications which allow individuals’access to a broad audience of consumers and other interested persons. Consumers value readily availableinformation concerning goods and services that they have or plan to purchase, and may act on such informationwithout further investigation or authentication. The availability of information on social media platforms isvirtually immediate as is its impact. Many social media platforms immediately publish the content theirsubscribers and participants can post, often without filters or checks on accuracy of the content posted. Theopportunity for dissemination of information, including inaccurate information, is seemingly limitless and readilyavailable. Information concerning our Company may be posted on such platforms at any time. Informationposted may be adverse to our interests or may be inaccurate, each of which may harm our performance, prospectsor business. The harm may be immediate without affording us an opportunity for redress or correction. Suchplatforms also could be used for dissemination of trade secret information, compromising valuable companyassets. In sum, the dissemination of information online could harm our business, prospects, financial conditionand results of operations, regardless of the information’s accuracy. The inappropriate use of social mediavehicles by our customers or employees could increase our costs, lead to litigation or result in negative publicitythat could damage our reputation.
As part of our marketing efforts, we rely on search engine marketing and social media platforms such asFacebook®, Twitter® and Google+™ to attract and retain customers. We also are initiating a multi-year effort toimplement new technology platforms that should allow us to improve our level of digital engagement with ourcustomers and employees and thereby help strengthen our marketing and related consumer analytics capabilities.These initiatives may not prove to be successful and may result in expenses incurred without the benefit of higherrevenues or increased employee engagement. Our brand could also be confused with brands that have similarnames, including but not limited to brands such as BJ’s Wholesale Club and other unaffiliated restaurants thatuse “BJ’s” in their names. As a result, our brand value may be adversely affected by any negative publicityrelated to others that use “BJ’s” in their brand names. We have registered certain trademarks and service marksin the United States and foreign jurisdictions. However, we are aware of names and marks identical or similar toour service marks being used from time to time by other persons. Although our policy is to oppose any suchinfringement, further or unknown unauthorized uses or other misappropriation of our trademarks or servicemarks could diminish the value of our brands and adversely affect our business.
20
Any deterioration in general economic conditions may affect consumer spending and may adversely affect ourrevenues, operating results and liquidity.
Any resulting decreases in customer traffic or the average expenditure per customer will negatively impact ourfinancial results, since reduced sales result in the deleveraging of the fixed and semi-fixed costs in our operationsand thereby cause downward pressure on our operating profits and margins. There is also a risk that if negativeeconomic conditions persist for a long period of time or worsen, consumers may make long-lasting changes totheir discretionary purchasing behavior, including less frequent discretionary purchases on a more permanentbasis.
The above factors could also impose practical limits on our menu price increases. From time to time, we mayannounce that we intend to take price increases on selected menu items in order to offset increased operatingexpenses. Although we believe that we have not experienced significant consumer resistance to our past priceincreases, in light of the current economic and competitive environment, we cannot provide assurance that anyfuture menu price increases will not deter customers from visiting our restaurants, reduce the frequency of theirvisits or affect their purchasing decisions.
Any deterioration in general economic conditions could have a material adverse impact on our landlords oron businesses neighboring our locations, which could adversely affect our revenues and results of operations.
Any deterioration in general economic conditions could result in our landlords being unable to obtain financingor remain in good standing under their existing financing arrangements which could result in their failure tosatisfy obligations to us under leases, including failures to fund or reimburse agreed-upon tenant improvementallowances. Any such failure could adversely impact our operations.
In addition, if our landlords are unable to obtain sufficient credit to continue to properly manage their retailcenters, we may experience a drop in the level of quality of such centers where we operate restaurants. Our futuredevelopment of new restaurants may also be adversely affected by the negative financial situations of developersand potential landlords. Landlords may try to delay or cancel recent development projects (as well as renovationsof existing projects) which could reduce the number of appropriate locations available that we would consider forour new restaurants. Furthermore, the failure of landlords to obtain licenses or permits for development projectson a timely basis, which is beyond our control, may negatively impact our ability to implement our developmentplan.
Our restaurants are generally located in retail developments with nationally recognized co-tenants, which helpincrease overall customer traffic into those retail developments. Some of our co-tenants have ceased or maycease operations in the future or have deferred openings or failed to open in a retail development aftercommitting to do so. These failures may lead to reduced customer traffic and a general deterioration in thesurrounding retail centers in which our restaurants are located and may contribute to lower customer traffic at ourrestaurants. If these retail developments experience high vacancy rates, we could experience decreases incustomer traffic. As a result, our results of operations could be adversely affected.
Changes in consumer buying patterns, particularly e-commerce sites, may affect our revenues, operatingresults and liquidity.
Our restaurants are primarily located near high consumer activity areas such as regional malls, lifestyle centers,“big box” shopping centers and entertainment centers. We depend in large part on a high volume of visitors tothese centers to attract customers to our restaurants. E-Commerce or online shopping continues to increase andnegatively impact consumer traffic at traditional “brick and mortar” retail sites located in regional malls, lifestylecenters, “big box” shopping centers and entertainment centers. A decline in development or in visitors to thesecenters near our restaurants could negatively affect our sales.
21
If we do not successfully expand our restaurant operations, our growth rate and results of operations would beadversely affected.
A critical factor in our future success is our ability to expand our restaurant operations successfully, which willdepend in large part on our ability to open new restaurants in a profitable manner. We anticipate that our newrestaurants will generally take several months or even longer to reach targeted productivity levels due to theinefficiencies typically associated with new restaurants, including lack of initial market and consumer awareness,the need to hire and train sufficient management and restaurant personnel and other factors. The opening of newrestaurants can also have either an expected or an unintended effect on sales levels at existing restaurants. Wecannot guarantee that any restaurant we open will obtain operating results similar to those of our existingrestaurants. If we are unable to open and operate new restaurants successfully, our growth rate and our results ofoperations would be adversely affected. Our expansion plans could also be impacted by the delay or cancellationof potential new sites by developers and landlords, which may become more common during the next couple ofyears as a result of the current economic environment and tight credit markets.
We intend to open new restaurants in both established and new markets. Opening new restaurants in establishedmarkets generally provides some advantages in the form of stronger levels of initial consumer awareness, trialand usage, as well as greater leverage of certain supply chain and field supervision resources. On the other hand,there is a risk that some portion of the sales of existing restaurants in the market may transfer to newly openedrestaurants in the market, resulting in negative pressure on our overall comparable restaurant sales metric. Whilewe do not generally select locations for our new restaurants where we believe that a significant sales transfer willlikely occur, some unexpected sales transfer may inadvertently occur.
Some of our new restaurants are planned for new markets where we have little or no operating experience. Newmarkets may have different competitive conditions, consumer tastes and discretionary spending patterns than ourexisting markets. As a result, new restaurants in those markets may be less successful than restaurants in ourexisting markets. Consumers in a new market will typically not be familiar with the BJ’s brand. We also mayfind it more difficult to hire, motivate and retain qualified employees in new markets. Restaurants opened in newmarkets may also have lower average restaurant sales than restaurants opened in our existing markets, and mayhave higher construction, occupancy or operating costs than restaurants in existing markets. Sales at restaurantsopened in new markets may take longer to achieve margins more typical of mature restaurants in existingmarkets or may never achieve these targeted margins thereby affecting our overall profitability. As we expandinto new markets and geographic territories, our operating cost structures may not replicate our experience inexisting markets. Because there will initially be fewer restaurants in a given market, our ability to optimallyleverage our field supervision, marketing and supply chain resources will be limited for a period of time. Further,our overall new restaurant development and operating costs may increase due to more lengthy geographicdistances between restaurants resulting in higher purchasing, preopening, labor, transportation and supervisioncosts. The performance of restaurants in new markets will often be less predictable. New restaurants may nothave similar results as our existing restaurants and may not be as profitable.
As part of our ongoing restaurant expansion and growth strategy, we may consider the internal development oracquisition of additional restaurant concepts in the future. We may not be able to internally develop or acquireadditional concepts that are as profitable as our existing restaurants. Additionally, growth through acquisitionswill also involve additional financial and operational risks.
Our ability to open new restaurants on schedule in accordance with our targeted capacity growth rate may beadversely affected by delays or problems associated with securing suitable restaurant locations and leases,recruiting and training qualified managers and hourly employees to correctly operate our new restaurants andby other factors, some of which are beyond our control and the timing of which is difficult to forecastaccurately.
In order to achieve our targeted capacity rate of new restaurant growth, we must identify suitable restaurantlocations and successfully negotiate and finalize the terms of restaurant leases at a number of these locations.
22
Due in part to the unique nature of each proposed restaurant location, we cannot predict the timing or ultimatesuccess of our site selection process or these lease negotiations. Delays encountered in negotiating, or ourinability to finalize to our satisfaction, the terms of a restaurant lease may delay our actual rate of new restaurantgrowth and cause a significant variance from our targeted capacity growth rate. In addition, our scheduled rate ofnew restaurant openings may be adversely affected by other factors, some of which are beyond our control,including the following:
• the availability and cost of suitable restaurant locations for development;• our ability to compete successfully for suitable restaurant locations;• the availability of adequate financing;• the timing of delivery of leased premises from our landlords so we can commence our build-out
construction activities;• construction and development costs;• labor shortages or disputes experienced by our landlords or outside contractors, including their ability to
manage union activities such as picketing or hand billing which could delay construction and which couldcreate adverse publicity for our business and operations;
• any unforeseen engineering or environmental problems with the leased premises;• our ability to hire, train and retain additional management and restaurant personnel;• our ability to secure governmental approvals and permits, including liquor licenses;• our ability to make satisfactory arrangements for the delivery of our proprietary craft beer;• our ability to successfully promote our new restaurants and compete in the markets in which our new
restaurants are located;• weather conditions or natural disasters; and• general economic conditions.
Access to sources of capital and our ability to raise capital in the future may be limited, which could adverselyaffect our business and our expansion plans.
Our ability to continue to successfully grow our business depends, in part, on the availability of adequate capitalto finance the development of additional new restaurants and other growth-related expenses. Changes in ouroperating plans, acceleration of our expansion plans, a decision to acquire another restaurant concept, lower thananticipated revenues, unanticipated and/or uncontrollable events in the capital or credit markets that impact ourliquidity, lower than anticipated tenant improvement allowances offered by landlords, increased expenses orother events, including those described in this Annual Report on Form 10-K, may cause us to seek additionaldebt or equity financing on an accelerated basis in the event our cash flow from operations is insufficient.Financing may not be available on acceptable terms, or at all, and our failure to raise capital when needed couldadversely affect our growth and other plans, as well as our financial condition. Additional equity financing, ifavailable, may be dilutive to the holders of our common stock and adversely affect the price of our commonstock. Debt financing, if available, may involve significant cash payment obligations, covenants and financialratios that restrict our ability to operate and grow our business, and would cause us to incur additional interestexpense and financing costs. In addition, disruptions in the global credit and equity markets, includingunanticipated and/or uncontrollable events in the capital or credit markets, may have an adverse effect on ourliquidity and our ability to raise additional capital if and when required.
We may issue additional equity securities without the consent of shareholders and such issuances couldadversely affect our stock price and the rights of existing shareholders.
We are not restricted from issuing additional common stock or preferred stock, including any securities that areconvertible into or exchangeable for, or that represent the right to receive, common stock or preferred stock orany substantially similar securities. Our Board of Directors is authorized to issue additional shares of commonstock and additional classes or series of preferred stock without any action on the part of the shareholders. TheBoard of Directors also has the discretion, without shareholder approval, to set the terms of any such classes orseries of preferred stock that may be issued, including voting rights, dividend rights and preferences over the
23

common stock with respect to dividends or upon the liquidation, or winding up of our business and otherterms. If we issue preferred shares in the future that have a preference over our common stock with respect todividends or upon liquidation, dissolution or winding up, or if we issue preferred shares with voting rights thatdilute the voting power of our common stock, the rights of our common shareholders or the market price of ourcommon stock could be adversely affected.
Any failure of our existing or new restaurants to achieve expected results could have a negative impact on ourconsolidated revenues and financial results, including a potential impairment of the long-lived assets ofcertain restaurants.
The results achieved by our newer restaurants may not be indicative of longer term performance or the potentialmarket acceptance of restaurants in other locations. There can be no assurance that any new restaurant that weopen will have similar operating results to those of prior restaurants. Our newer restaurants typically take severalmonths, or even longer, to reach targeted levels of productivity due to inefficiencies typically associated withnew restaurants. Accordingly, incremental sales from newly-opened restaurants generally do not make asignificant contribution to our total operating profits in their initial months of operation. We make certainestimates and projections with regard to individual restaurant operations, as well as our overall performance inconnection with our impairment analyses for long-lived assets in accordance with U.S. GAAP. An impairmentcharge is required when the carrying value of the restaurant exceeds the estimated undiscounted future cash flowsof the restaurant, in which case the restaurant assets are written down to estimated fair value. The projection ofrestaurant future cash flows used in this analysis requires the use of judgment and a number of estimates andprojections of future operating results. If the restaurant’s actual results differ from our estimates, charges toimpair the restaurant’s assets may be required. If impairment charges are significant, our results of operationscould be adversely affected.
Our growth may strain our infrastructure and resources, which could slow our development of newrestaurants and adversely affect our ability to manage our existing restaurants.
We plan to continue opening new restaurants and currently expect to open at least 15 new restaurants duringfiscal 2015. We may also consider the internal development or acquisition of additional restaurant concepts in thefuture, and we may also evaluate potential joint ventures to supplement our pace of expansion. Our continuedexpansion will increase demands on our management team, restaurant management systems and resources,financial controls and information systems. These increased demands may adversely affect our ability to opennew restaurants and to manage our existing restaurants. If we fail to continue to improve our infrastructure or tomanage other factors necessary for us to meet our expansion objectives, our growth rate and operating resultscould be adversely affected.
Any decision to either reduce or accelerate the pace of openings may positively or adversely affect ourcomparative financial performance.
Our opening costs continue to be significant and the amount incurred in any one year or quarter is dependent onthe number of restaurants expected to be opened during that time period. As such, our decision to either decreaseor increase the rate of openings may have a significant impact on our financial performance for that period oftime being measured. Therefore, if we decide to reduce our openings, our comparable opening costs will belower and the effect on our comparative financial performance will be favorable. Conversely, if the rate at whichwe develop and open new restaurants is increased to higher levels in the future, the resulting increase in openingcosts will have an unfavorable short-term impact on our comparative financial performance. At some futurepoint, our pace of openings and annual rate of growth in total restaurant operating weeks will begin to graduallydecelerate as we become a more mature company.
24

Our recent trends in average restaurant sales or our trends in comparable restaurant sales may not beindicative of future trends or future operating results.
Our recent average restaurant sales and comparable restaurant sales trends may not be indicative of future trendsor future operating results. Our ability to operate new restaurants profitably and increase average restaurant salesand comparable restaurant sales will depend on many factors, some of which are beyond our control, including:
• our ability to execute our business strategy effectively;• our ability to execute productively and efficiently within the “four walls” of each restaurant;• our menu development and pricing strategy;• our ability to continue deploying menu, beverage, capital expenditure and technological innovations that
have the opportunity to increase customer visit frequency and spending per visit;• initial sales performance by new restaurants, some of which may be unusually strong and thus difficult to
increase further;• intrusions into our restaurant trade areas by new restaurants operated by competitors;• the timing of new restaurant openings and related expenses;• changing demographics, consumer tastes or discretionary spending;• our ability to develop restaurants in geographic locations that do not compete with or otherwise adversely
affect the sales of our existing restaurants;• overall brand awareness in new markets or existing markets where we may develop new restaurants;• maturation of the casual dining segment;• levels of competition in one or more of our markets; and• general economic conditions, credit markets and consumer confidence.
We believe that certain of our restaurants operate at or near their effective productive capacities. As a result, wemay be unable to grow or maintain comparable restaurant sales at those restaurants, particularly if additionalrestaurants are opened near the existing locations either by us or by our competitors.
Any failure to drive both short-term and long-term profitable sales growth through continued enhancements tothe BJ’s restaurant concept and brand, coupled with any slippage in restaurant operational execution, could resultin poor financial performance. As part of our business strategy, we intend to drive profitable sales growth byincreasing sales at existing restaurants and by opening new restaurants. This strategy involves numerous risks,and we may not be able to achieve our growth objectives. If we are unable to maintain BJ’s brand relevance andrestaurant operational excellence to achieve sustainable comparable restaurant sales growth, we may have toconsider slowing the pace of new restaurant openings. BJ’s short-term sales growth could be impacted if we areunable to drive near-term growth in customer traffic, and long-term sales growth could be impacted if we fail tocontinue to evolve BJ’s to maintain its relevance, contemporary energy and overall value and appeal to theconsumer.
Adverse changes in our average restaurant revenues and comparable restaurant sales could have an adverse effecton our common stock or increase the volatility of the price of our common stock.
Our menu development and marketing programs may not be successful.
We expect to continue investing in certain menu, marketing and merchandising initiatives that are intended toattract and retain customers for our restaurants. Not all of such initiatives may prove to be successful and maythereby result in incremental expenses incurred without the benefit of higher revenues, or may result in otherunfavorable economic consequences. Additionally, if our competitors were to increase their spending on menudevelopment and marketing initiatives, or if our menu and marketing initiatives were to be less effective thanthose of our competitors, we could experience a material adverse effect on our results of operations.
25

We have experienced significant increases in the costs of certain food, labor, energy and supply items in thepast, and we may be unable to successfully and sufficiently raise menu prices to offset rising costs andexpenses.
In the past, we have experienced dramatic increases in prices of certain commodities necessary for our restaurantand brewery operations, including increased costs of food, commodities, minimum wage, employee benefits,insurance arrangements, construction, energy and other costs. To manage this risk in part, we attempt to enterinto fixed price purchase commitments, with terms up to one year in some cases, for many of our commodityrequirements. However, it may not be possible for us to enter into fixed-price contracts for an entire fiscal yearfor many of our food commodity requirements. Additionally, we utilize menu price increases to help offset theincreased cost of our commodities and other costs. However, there is no guarantee that our menu price increaseswill be accepted by our customers. If our costs do not stabilize, our operating margins and results of operationswill be adversely affected if we are unable to increase our menu prices to offset such increased costs.
Our future operating results may fluctuate significantly due to the expenses required opening new restaurants.
The capital resources required to develop new restaurants are significant. Actual costs may vary significantlydepending upon a variety of factors, including the site type, the square footage and layout of each restaurant, andconditions in the local real estate market. The combination of our relatively small number of existing restaurants,the significant investment associated with each new restaurant and the average restaurant revenues of our newrestaurants may cause our results of operations to fluctuate significantly. Moreover, due to our relatively smallbase of existing restaurants, poor operating results at any one restaurant or a delay or cancellation in the plannedopening of a restaurant could adversely affect our entire business, making the investment risks related to any onelocation much greater than those associated with many other larger, well-established restaurant chains.
Our inability to renew existing leases on favorable terms may adversely affect our results of operations.
As of February 26, 2015, 153 of our 158 restaurants are located on leased premises and are subject to varyinglease-specific arrangements. Some of our leases require base rent that is subject to regional cost-of-livingincreases and other leases include base rent with specified periodic increases. Other leases are subject to renewalat fair market value, which could involve substantial increases. Additionally, many leases require contingent rentbased on a percentage of gross sales. There can be no assurance that we will be able to renew our expiring leasesafter the expiration of all remaining renewal options; therefore we may incur additional costs to operate ourrestaurants, including increased rent and other costs related to our renegotiation of terms of occupancy of anexisting leased premise in a desirable location, and costs for the relocation and development of a replacementrestaurant, if we choose not to renew a lease, or are unable to do so, on favorable terms in a desirable location.
The success of our restaurants depends in large part on their leased locations. As demographic and economicpatterns change, current leased locations may or may not continue to be attractive or profitable. Possible declinesin trade areas where our restaurants are located or adverse economic conditions in surrounding areas could resultin reduced revenues in those locations. In addition, desirable leased locations for new restaurant openings or forthe relocation of existing restaurants may not be available at an acceptable cost when we identify a particularopportunity for a new restaurant or relocation.
We are subject to all of the risks associated with leasing space subject to long-term non-cancelable leases.
Generally our leases are “net” leases, which require us to pay all of the cost of insurance, taxes, maintenance andutilities and cannot be canceled. Additional sites that we lease are likely to be subject to similar long-term non-cancelable terms. If an existing or future restaurant is not profitable and we decide to close it, we may becommitted to perform our obligations under the applicable lease including, among other things, paying the baserent for the balance of the lease term. In addition, as each of our leases expires, we may fail to negotiaterenewals, which could cause us to pay increased occupancy costs or to close restaurants in desirable locations.These potential increased occupancy costs could materially adversely affect our business, financial condition orresults of operations.
26

Our operations could be adversely affected if our suppliers are not able to continue to do business with us orare forced to alter the terms on which they do business with us.
If we are forced to find alternative suppliers for key services, whether due to demands from the vendor or thevendor’s bankruptcy or ceasing operations, that could be a distraction to us and adversely impact our business. Ifany of our major suppliers or a large number of other suppliers suspend or cease operations, we may havedifficulty keeping our restaurants fully supplied with the commodities and supplies that we require. In addition,we currently rely on one or a limited number of suppliers for certain key menu ingredients. If we were forced tosuspend serving one or more of our menu items, that could have a significant adverse impact on our restaurantcustomer traffic and public perceptions of us, which would be harmful to our operations.
A significant number of our restaurants are concentrated in California, Texas and Florida, which make usparticularly sensitive to economic, regulatory, weather and other risk factors and conditions that are moreprevalent in those states.
As of February 26, 2015, of our 158 restaurants, 63 were located in the state of California, 32 were located inTexas and 19 were located in the state of Florida. Many states and municipalities in which our restaurants arelocated are experiencing or may experience severe revenue shortfalls and budget shortfalls. Additionally,changes in state and municipal-level regulatory requirements, such as increases to the minimum wage rate,income, unemployment insurance, and other taxes as well as mandatory healthcare coverage or paid leave insome cities where we operate or may desire to operate restaurants, may adversely impact our financial results.Additionally, we believe that California is subject to a greater risk for earthquakes, fires, water shortages, energyfluctuations and other natural and man-made disasters than most other states.
We are dependent upon consumer trends and upon high levels of consumer traffic at the sites where ourrestaurants are located, and any adverse change in such consumer trends or traffic levels could adverselyaffect our business, revenues and results of operations.
Due to the nature of the restaurant industry, we are dependent upon consumer trends with respect to the public’stastes, eating habits, public perception toward alcohol consumption and discretionary spending priorities, all ofwhich can shift rapidly. We also are dependent upon high consumer traffic rates at the sites surrounding ourrestaurants, which are primarily located in high-activity areas such as urban, retail, mixed-use and lifestylecenters, to attract customers to our restaurants. In general, such consumer trends and visit frequencies aresignificantly affected by many factors, including national, regional or local economic conditions, changes in areademographics, public perception and attitudes, increases in regional competition, food, liquor and labor costs,traffic and shopping patterns, weather, natural disasters, interest rates, co-tenancies in urban, retail and mixed-useand lifestyle centers and the availability and relative cost of gasoline. Our success will depend, in part, on ourability to anticipate and respond to such changing consumer preferences, tastes, eating and purchasing habits, aswell as other factors affecting the restaurant industry, including new market entrants and demographic changes.Any adverse change in any of the above factors and our inability to respond to such changes could cause ourrestaurant volumes to decline and adversely affect our business, revenues and results of operations.
Our success depends on our ability to compete effectively in the restaurant industry.
The restaurant industry is highly competitive. We compete on the basis of the taste, quality and price of foodoffered, customer service, brand name identification, beer quality and selection, attractiveness of the facilities,restaurant location, atmosphere and overall dining experience. Our competitors include a large and diverse groupof restaurant chains and individual restaurants that range from independent local operators that have openedrestaurants in various markets to well-capitalized national restaurant companies. In addition, we compete withother restaurants and retailers for real estate. We also face growing competition as a result of the trend towardconvergence in grocery, deli and restaurant services, particularly in the supermarket industry which offers“convenient meals” in the form of improved entrées and side dishes from the deli section. Many of ourcompetitors have substantially greater financial, marketing and other resources than we do.
27
Restaurant consumers are highly focused on overall value and price perception. If other restaurants are able topromote and deliver a higher degree of perceived value through heavy discounting or other methods, ourcustomer traffic levels may suffer which would adversely impact our revenues and profitability. In addition, withimproving product offerings at “fast-casual” restaurants, quick-service restaurants and grocery stores, consumersmay choose to trade down to these alternatives, which could also negatively affect our financial results.
We believe that we have built a favorable reputation for the quality and differentiation of our restaurantconcept. We also believe that we must continue to re-invest in our core established restaurant operations tofurther protect and grow the overall consumer “value” of our concept so that it will continue to be relevant in thefuture. Any incident that erodes consumer trust in, or their attraction to, our concept could significantly reduce itsvalue. If consumers perceive or experience any material reduction in food quality, service or ambiance, or in anyway believe we materially failed to deliver a consistently positive dining experience, the consumer “value’ of ourconcept could suffer.
New information or attitudes regarding diet, health and the consumption of alcoholic beverages could resultin changes in regulations and consumer consumption habits that could adversely affect our results ofoperations.
Regulations and consumer eating habits may change as a result of new information or attitudes regarding diet andhealth. Such changes may include regulations that impact the ingredients and nutritional content of the food andbeverages we offer. For example, several municipalities and states have approved restrictions on the use of trans-fats by restaurants. The success of our restaurant operations is dependent, in part, upon our ability to effectivelyrespond to changes in any consumer health regulations and our ability to adapt our menu offerings to trends infood consumption. If consumer health regulations or consumer eating habits change significantly, we may berequired to modify or delete certain menu items. To the extent we are unable to respond with appropriate changesto our menu offerings, it could materially affect customer demand and have an adverse impact on our results ofoperations. The risks and costs associated with nutritional disclosures on our menus could also impact ouroperations, particularly given differences among applicable legal requirements and practices within the restaurantindustry with respect to testing and disclosure, ordinary variations in food preparation among our ownrestaurants, and the need to rely on the accuracy and completeness of nutritional information obtained from thirdparty suppliers.
The gross profit margin on our sales of alcoholic beverages is generally higher than our gross profit margin onsales of food items. The alcoholic beverage industry has become the subject of considerable societal and politicalattention in recent years due to increasing public concern over alcohol-related social problems, including drivingunder the influence, underage drinking and health consequences from the misuse of alcohol, includingalcoholism. As an outgrowth of these concerns, the possibility exists that advertising by beer producers could berestricted, that additional cautionary labeling or packaging requirements might be imposed, that furtherrestrictions on the sale of alcohol might be imposed, or that there may be renewed efforts to impose increasedexcise or other taxes on beer or alcohol related items sold in the United States. If beer or alcohol consumptionwere to come into disfavor among domestic drinkers, or if the domestic beer industry were subjected tosignificant additional governmental regulations, our sales and profits could be adversely affected.
Health concerns arising from outbreaks of flu viruses or other diseases, or regional or global healthpandemics, could severely affect our business.
The United States and other countries have experienced, or may experience in the future, outbreaks of viruses,such as norovirus, Avian Flu or “SARS,” and H1N1 or “swine flu,” or other diseases such as bovine spongiformencephalopathy, commonly known as “mad cow disease.” To the extent that a virus or disease is food-borne, orperceived to be food-borne, future outbreaks may adversely affect the price and availability of certain foodproducts and cause our customers to eat less of a product. For example, health concerns relating to theconsumption of beef or to specific events such as the outbreak of “mad cow disease” may adversely impact salesof our beef-related menu items. In addition, public concern over “avian flu” may cause fear about the
28
consumption of chicken, eggs and other products derived from poultry. The inability to serve beef or poultry-based products would restrict our ability to provide a variety of menu items to our customers. If we change ourmenu in response to such concerns, we may lose customers who do not prefer the new menu, and we may not beable to sufficiently attract new customers to produce the revenue needed to restore the profitability of ourrestaurant operations. We also may generate different or additional competitors for our intended customers as aresult of such a menu change and may not be able to successfully compete against such competitors. If a virus istransmitted by human contact, our employees or customers could become infected, or could choose, or beadvised, to avoid gathering in public places, any of which could adversely affect our restaurant customer trafficand our ability to adequately staff our restaurants, receive deliveries on a timely basis or perform functions at thecorporate level. We also could be adversely affected if jurisdictions in which we have restaurants imposemandatory closures, seek voluntary closures or impose restrictions on operations. Even if such measures are notimplemented and a virus or other disease does not spread significantly, the perceived risk of infection orsignificant health risk may adversely affect our business.
A health pandemic is a disease outbreak that spreads rapidly and widely by infection and affects manyindividuals in an area or population at the same time. We believe that our restaurants have one of the highestlevels of customer traffic per square foot in the casual dining segment of the restaurant industry. Our restaurantsare places where people can gather together for human connection. Customers might avoid public gatheringplaces in the event of a health pandemic, and local, regional or national governments might limit or ban publicgatherings to halt or delay the spread of disease. The impact of a health pandemic on us might bedisproportionately greater than on other casual dining concepts that have lower customer traffic and that dependless on the gathering of people.
Negative publicity about us, our restaurants, other restaurants, or others across the food supply chain, orabout the consumption of beef, seafood, poultry/produce, beer or alcoholic beverages, whether or notaccurate, could adversely affect the reputation and popularity of our restaurants and our results of operations.
The good reputation of our restaurants is a key factor to the success of our business. Incidents that occur at any ofour restaurants, or at restaurants operated by other foodservice providers or generally in the food supply chain,could be damaging to the restaurant industry overall, may specifically harm our brand and reputation and mayquickly result in negative publicity for us, which could adversely affect our reputation and popularity with ourcustomers. In addition, negative publicity resulting from poor food quality, illness, injury, food tampering orother health concerns, whether related to one of our restaurants, to the restaurant industry, or to the beef, seafood,poultry or produce industries (such as negative publicity concerning the accumulation of carcinogens in seafood,e-coli, hepatitis A, Avian Flu, listeria, salmonella, and other food-borne illnesses), or operating problems relatedto one or more of our restaurants, could adversely affect sales for all of our restaurants and make our brand andmenu offerings less appealing to consumers. If our restaurant customers or employees become ill from food-borne illnesses, we could be forced to temporarily close the affected restaurants.
Our brewing operations are subject to certain hazards and liability risks faced by all brewers, such as potentialcontamination of ingredients or products by bacteria or other external agents that may be wrongfully oraccidentally introduced into products or packaging. While we have not experienced any serious contaminationproblem in our products, the occurrence of such a problem could result in a costly product recall and seriousdamage to our reputation for product quality, as well as claims for product liability.
Our operations are susceptible to changes in our food, labor and related employee benefits (including, but notlimited to, group health insurance coverage for our employees), brewery and energy supplies which couldadversely affect our profitability.
Our profitability depends, in part, on our ability to anticipate and effectively react to changes in food, labor,utilities and supply costs. Our supply chain department negotiates prices for all of our ingredients and suppliesthrough contracts (with terms of one month up to one year, or longer in a few cases), spot market purchases orcommodity pricing formulas. Furthermore, various factors beyond our control, including adverse weather
29

conditions and governmental regulations, could also cause our food and supply costs to increase. We cannotpredict whether we will be able to anticipate and react to changing food and supply costs by adjusting ourpurchasing practices. A failure to do so could adversely affect our operating results or cash flows fromoperations. We also have a single or a limited number of suppliers for certain of our commodity and supplyitems. Accordingly, supply chain risk could increase our costs and limit the availability of some products that arecritical to our restaurant and brewing operations.
The overall cost environment for food commodities can be volatile primarily due to domestic and worldwideagricultural supply/demand and other macroeconomic factors that are outside of our control. The availabilitiesand prices of food commodities are also influenced by increased energy prices, droughts, animal-related diseases,natural disasters, increased geo-political tensions, the relationship of the dollar to other currencies, and otherissues. Virtually all commodities purchased and used in the restaurant industry (meats, grains, oils, dairyproducts, and energy) have varying amounts of inherent price volatility associated with them. Our suppliers alsomay be affected by higher costs to produce and transport commodities used in our restaurants and breweries,higher minimum wage and benefit costs, and other expenses that they pass through to their customers, whichcould result in higher costs for goods and services supplied to us. Increases in minimum wage, health care costsand other benefit costs may have a material adverse effect on our labor costs. While we attempt to manage thesefactors by offering a diversified menu and by contracting for our key commodities for extended periods of timewhenever feasible and possible, there can be no assurance that we will be successful in this respect due to themany factors that are outside of our control. In addition, raw materials that we may purchase on the internationalmarket are subject to fluctuations in both the value of the U.S. dollar and increases in local demand, which mayincrease our costs and negatively impact our profitability.
We and our major independent third party brewing partners purchase a substantial portion of brewery rawmaterials and products, primarily malt and hops, from a limited number of domestic and foreign suppliers. Wepurchase both North American and European malts and hops for our beers. We purchase a majority of our maltsfrom a single supplier with multiple sources of malts. We generally enter into one-year purchase commitmentswith our malt and hops suppliers, based on the projected future volumes and brewing needs. We are exposed tothe quality of the barley crop each year, and significant failure of a crop could adversely affect our beer costs.Changes in currency exchange rates and freight costs can also result in increased prices. There are other maltvendors available that are capable of supplying all of our needs. We use American and German hops for ourbeers. We enter into purchase commitments with several hops suppliers, based on our projected future volumesand brewing needs. However, the quality and availability of the hops may be materially adversely affected byfactors such as adverse weather and changes in currency exchange rates, resulting in increased prices. Weattempt to maintain at least six months’ supply of essential hop varieties on hand in order to limit the risk of anunexpected reduction in supply. We store our hops in multiple cold storage warehouses, both at our breweriesand at our suppliers, to minimize the impact of a catastrophe at a single site. Hops and malt are agriculturalproducts and, therefore, many outside factors, including weather conditions, farmers rotating out of hops orbarley to other crops, government regulations and legislation affecting agriculture, could affect both price andsupply.
Our restaurant-level operating margins are also affected by fluctuations in the availability and cost of utilitiesservices, such as electricity and natural gas. Interruptions in the availability of gas, electric, water or otherutilities, whether due to aging infrastructure, weather conditions, fire, animal damage, trees, digging accidents orother reasons largely out of our control, may adversely affect our operations. In addition, weather patterns inrecent years have resulted in lower than normal levels of rainfall in certain areas that could produce droughts inkey states such as California, thus impacting the price of water and the corresponding prices of commoditiesgrown in states facing drought conditions. There is no assurance that we will be able to maintain our utility andcommodity costs at levels that do not have a material adverse effect on our operations.
30

If our distributors or suppliers do not provide food and beverages to us in a timely fashion, we may experienceshort-term supply shortages, increased food and beverage costs and quality control problems.
We currently depend on national and regional food distribution service companies, as well as other foodmanufacturers and suppliers, to provide food and beverage products to all of our restaurants. We also rely onindependent third party brewers and many local beer distributors to provide us with beer for our restaurants. Theoperations of our distributors, suppliers and independent third party brewers are subject to risks including labordisputes, financial liquidity, inclement weather, natural disasters, supply constraints, and general economic andpolitical conditions that could limit their ability to timely provide us with acceptable products. Additionally,under the “force majeure” provisions in most of our agreements with suppliers, certain unexpected and disruptiveevents may excuse a supplier from performing. If our distributors, suppliers and independent third party brewerscease doing business with us, or cannot make a scheduled delivery to us, or are unable to obtain credit in atightened credit market or experience other issues, we could experience short-term product supply shortages insome or all of our restaurants and could be required to purchase food, beer and beverage products from alternatesuppliers at higher prices. We may also be forced to temporarily remove popular items from the menu offering ofour restaurants. If alternative suppliers cannot meet our current product specifications, the consistency andquality of our food and beverage offerings, and thus our reputation, customer patronage, revenues and results ofoperations, could be adversely affected.
With respect to potential liability claims related to our food, beer and beverage products, we believe we havesufficient primary or excess umbrella liability insurance in place. However, this insurance may not continue to beavailable at a reasonable cost or, if available, may not be adequate to cover all claims. We generally seekcontractual indemnification and insurance coverage from our key suppliers of food, beer and beverages, but thisindemnification or insurance coverage is limited, as a practical matter, by the creditworthiness of theindemnifying party and the insured limits of any insurance provided by suppliers.
Pursuant to various laws and regulations, the majority of our proprietary craft beer must be distributed to ourrestaurants through independent wholesale beer distributors, whether we produce the beer or it is produced byindependent third party brewers. Although we currently have arrangements with a sufficient number of beerdistributors in all markets where we operate restaurants, our continued national expansion will require us to enterinto agreements with additional beer distributors. No assurance can be given that we will be able to maintain orsecure additional beer distributors on terms favorable to us. Changes in control or ownership of the participantsin our current beer distribution network could lead to less willingness on the part of certain distributors to carryour proprietary craft beer. Our beer distribution agreements are generally terminable by the distributor on shortnotice. While these beer distribution agreements contain provisions regarding our enforcement and terminationrights, some state laws prohibit us from readily exercising these contractual rights. Our ability to maintain ourexisting beer distribution agreements may also be adversely affected by the fact that many of our distributors arereliant on one of the major beer producers for a large percentage of their revenue and, therefore, they may beinfluenced by such producers. If our existing beer distribution agreements are terminated, we may not be able toenter into new distribution agreements on substantially similar terms or it may take some time to enter into areplacement agreement, which may result in an increase in the delivered cost of beer to our restaurants.
Failure to protect our trademarks, service marks, trade secrets or other intellectual property could adverselyaffect our business.
Our business prospects depend in part on our ability to develop favorable consumer recognition of our brands,including the BJ’s Restaurants name in particular. Although BJ’s is a federally registered trademark, there aremany other retailers, restaurants and other types of businesses using the name “BJ’s” in some form or fashionthroughout the United States. While we intend to aggressively protect and defend our trademarks, service marks,trade dress, trade secrets and other intellectual property, particularly with respect to their use in our restaurantand brewing operations, they could be imitated or appropriated in ways that we cannot prevent. Alternatively,third parties may attempt to cause us to change our trademarks, service marks or trade dress or not operate in acertain geographic region or regions if our names are deemed confusingly similar to their prior trademarks,
31

service marks or trade dress. We may also encounter claims from prior users of similar intellectual property inareas where we operate or intend to conduct operations. This could harm our image, brand or competitiveposition and cause us to incur significant penalties and costs. In addition, we rely on trade secrets, proprietaryknow-how, concepts and recipes. Our methods of protecting this information may not be adequate. While webelieve that we take reasonable protective actions with respect to our intellectual property, these actions may notbe sufficient to prevent, and we may not be aware of all incidents of, unauthorized usage or imitation by others.Moreover, we may face claims of misappropriation or infringement of third parties’ rights that could interferewith our use of this information. Defending these claims may be costly and, if unsuccessful, may prevent us fromcontinuing to use this proprietary information in the future and may result in a judgment or monetary damages.We do not maintain confidentiality and non-competition agreements with all of our employees or suppliers.Moreover, even with respect to the confidentiality and non-competition agreements we have, we cannot assurethat those agreements will not be breached, that they will provide meaningful protection or that adequateremedies will be available in the event of an unauthorized use or disclosure of our proprietary information. Ifcompetitors independently develop or otherwise obtain access to our trade secrets, proprietary know-how orrecipes, the appeal of our restaurants could be reduced and our business could be harmed.
Federal, state and local beer, liquor and food service regulations may have a significant adverse impact on ouroperations.
We are required to operate in compliance with federal laws and regulations relating to alcoholic beveragesadministered by the Alcohol and Tobacco Tax and Trade Bureau of the U.S. Department of Treasury, as well asthe laws and licensing requirements for alcoholic beverages of states and municipalities where our restaurants areor will be located. In addition, each restaurant must obtain a food service license from local authorities. Failure tocomply with federal, state or local regulations could cause our licenses to be revoked and force us to cease thebrewing or sale of alcoholic beverages, or both, or the serving of food at our restaurants. Additionally, stateliquor laws may prevent or impede the expansion of our restaurants into certain markets. The liquor laws ofcertain states prevent us from selling at wholesale the beer brewed at our restaurants. Any difficulties, delays orfailures in obtaining such licenses, permits or approvals could delay or prevent the opening of a restaurant in aparticular area or increase the costs associated therewith. In addition, in certain states, including states where wehave existing restaurants or where we plan to open a restaurant, the number of liquor licenses available is limited,and licenses are traded on the open market. Liquor, beer and wine sales comprise a significant portion of ourrevenues. If we are unable to maintain our existing licenses, our customer patronage, revenues and results ofoperations could be adversely affected. Or, if we choose to open a restaurant in those states where the number ofavailable licenses is limited, the cost of a new license could be significant.
Brewery operations require various federal, state, and local licenses, permits and approvals. Our restaurants andon-site breweries operate pursuant to exceptions to the “tied house” laws, which created the “three tier system” ofliquor distribution. These “tied house” laws were adopted by all of the states after the repeal of Prohibition and,generally, prohibit brewers from holding retail licenses and prohibit vertical integration in ownership and controlamong the three tiers. Brewery restaurants and brewpubs operate under exceptions to these general prohibitions.Over the last 25 years, nearly all of the states have adopted laws and regulations permitting brewery restaurantsand brewpubs; however, the privileges and restrictions for brewpubs and brewery restaurants vary from state tostate.
We apply for our liquor and brewing licenses with the advice of outside legal and licensing consultants.Generally, our brewery restaurants are licensed as retailers with limited privileges to brew beer on the restaurantpremises, and we do not have the same privileges as a microbrewery. Other restrictions imposed by law mayprevent us from operating both brewery restaurants and non-brewery restaurants in some states. We are at riskthat a state’s regulations concerning brewery restaurants or the interpretation of these regulations may change.Because of the many and various state and federal licensing and permitting requirements, there is a significantrisk that one or more regulatory agencies could determine that we have not complied with applicable licensing orpermitting regulations or have not maintained the approvals necessary for us to conduct business within itsjurisdiction. Even after the issuance of our licenses, our operations could be subject to differing interpretations of
32
the “tied house” laws and the requirements of the “three tier system” of liquor distribution in any jurisdiction thatwe conduct business. Any such changes in interpretation may adversely impact our current model of brewingbeer or supplying beer, or both, to our restaurants in that state, and could also cause us to lose, either temporarilyor permanently, the licenses, permits and registrations necessary to conduct our restaurant operations, and subjectus to fines and penalties.
The manufacture and sale of alcoholic beverages is a highly regulated and taxed business. Our operations aresubject to more restrictive regulations and increased taxation by federal, state, and local governmental entitiesthan are those of non-alcohol related beverage businesses. Federal, state, and local laws and regulations governthe production and distribution of beer, including permitting, licensing, trade practices, labeling, advertising,marketing, distributor relationships, and related matters. Federal, state, and local governmental entities also levyvarious taxes, license fees, and other similar charges and may require bonds to ensure compliance with applicablelaws and regulations. Failure to comply with applicable federal, state, or local laws and regulations could resultin higher taxes, penalties, fees, and suspension or revocation of permits, licenses or approvals.
Increasing the federal and/or state excise tax on alcoholic beverages, or certain types of alcoholic beverages, isfrequently proposed in various jurisdictions either to increase revenues or discourage purchase by underagedrinkers. If adopted, these measures could affect some or all of our proprietary craft beer products. If federal orstate excise taxes are increased, we may have to raise prices to maintain our current profit margins. Higher taxesmay reduce overall demand for beer, thus negatively impacting sales of our beer. Some states have also beenreviewing the state tax treatment for flavored malt beverages which could result in increased costs for us, as wellas decreased sales. Further federal or state regulation may be forthcoming that could further restrict thedistribution and sale of alcohol products.
Our dependence on independent third party brewers and manufacturers for some of our beer and soda couldhave an adverse effect on our operations if they cease to supply us with our proprietary craft beer and sodas.
Our proprietary craft beer and soda are key factors in the success of our business. Each year, our breweryoperations department forecasts our annual beer requirements based on our current restaurant requirements andexpansion plans and determines our brewery production. Additionally, in certain states we are either legallyrequired or choose to arrange for independent third party brewers to brew our beer using our proprietary recipes.If our independent third party brewers cease doing business with us, or cannot make a scheduled delivery to usbecause of a supply chain or production disruption or other issues, or if we cannot otherwise satisfy our internalbrewing requirements, we could experience short-term supply shortages in some or all of our restaurants whichmay result in a loss of revenue. Potential disruptions at breweries include labor issues, governmental andregulatory actions, quality issues, contractual disputes, machinery failures or operational shut downs.Additionally, if these independent third party brewers cease doing business with us, we could be required topurchase or brew our own beer at higher costs to us, or we may not be able to sell our proprietary craft beer at all,until we are able to secure an alternative supply source. If our independent third party brewers fail to adhere toour proprietary recipe and brewing specifications, the consistency and quality of beer offerings, and thus ourreputation, customer patronage, revenues and results of operations, could be adversely affected. The above riskfactors also apply to the supply of our proprietary craft cider, root beer and other sodas, which are currentlyproduced by an outside independent third party manufacturer. As the brewing industry continues to consolidate,the financial stability of those brewery operations where we currently contract for our proprietary craft beerproduction, as well as their ability or willingness to continue to meet our beer production requirements, continuesto be a significant risk in our business model. Accordingly, there can be no guarantees that our proprietarybrewing requirements will continue to be met in the future.
From time to time, we or our independent third party brewers and manufacturers may also experience shortagesof kegs necessary to distribute our craft beer and proprietary craft sodas. We distribute our craft beer andproprietary craft sodas in kegs that are owned by us as well as leased from third party vendors. We are alsoresponsible for providing kegs to the independent third party brewers and third party soda manufacturers thatproduce our proprietary craft beers and sodas.
33
Our internal brewing, independent third party brewing and beer distribution arrangements are subject toperiodic reviews and audits by various federal, state and local governmental and regulatory agencies andcould be adversely affected by different interpretations of the laws and regulations that govern sucharrangements or by new laws and regulations.
Brewery and wholesale operations require various federal, state and local licenses, permits and approvals. Theloss or revocation of any existing licenses, permits or approvals, and/or the failure to obtain any requiredadditional or new licenses, permits, or approvals could have a material adverse effect on the ability of theCompany to conduct its business.
We are subject to periodic audits and reviews by federal, state and local regulatory agencies related to ourinternal and independent third party brewing operations. We are particularly subject to extensive regulation at thefederal, state and local levels. Permits, licenses and approvals necessary to the U.S. beer business are requiredfrom the Alcohol and Tobacco Tax and Trade Bureau of the United States Treasury Department (“TTB”), statealcohol beverage regulatory agencies and local authorities in some jurisdictions. Compliance with these laws andregulations can be costly. TTB permits and registrations can be suspended, revoked or otherwise adverselyaffected for failure to pay taxes, keep proper accounts, pay fees, bond premises, abide by federal alcoholicbeverage production and distribution regulations, or notify the TTB of any material change. Permits, licenses andapprovals from state regulatory agencies can be revoked for many of the same reasons. Our operations aresubject to audit and inspection by the TTB at any time. At the state and local level, some jurisdictions merelyrequire notice of any material change in the operations, management or ownership of the permit or license holderand others require advance approvals, requiring that new licenses, permits or approvals be applied for andobtained in the event of a change in the management or ownership of the permit or license holder. State and locallaws and regulations governing the sale of malt beverages and hard cider within a particular state by a supplier orwholesaler vary from locale to locale. Our operations are subject to audit and inspection by state regulatoryagencies at any time. Because of the many and various state and federal licensing and permitting requirements,there is a risk that one or more regulatory agencies could determine that hawse have not complied with applicablelicensing or permitting regulations or have not maintained the approvals necessary to conduct business within itsjurisdiction.
We are routinely subject to new or modified laws and regulations for which we must comply in order to avoidfines and other penalties. From time to time, new laws and regulations are proposed that could affect the overallstructure and effectiveness of the proprietary craft beer production and distribution model we currently utilize.Any such changes in interpretation may adversely impact our current model of brewing beer or supplying beer,or both, to our restaurants in that state, and could also cause us to lose, either temporarily or permanently, thelicenses, permits and registrations necessary to conduct our restaurant operations, and subject us to fines andpenalties.
The Texas Alcoholic Beverage Commission has taken the position that our historical brewing arrangement withrespect to the supply of proprietary craft beer for our Texas restaurants was not in compliance with the provisionsof the Texas Alcoholic Beverage Code and related rules and regulations. However, as a result of a change inTexas law on September 1, 2013, brewpubs in Texas are now permitted to produce up to 10,000 barrels per yearand distribute that beer outside of the brewpub to other licensed establishments within the state of Texas. Forfurther information regarding the risks and uncertainties that may affect our future results, please review theinformation set forth in “Item 1. Business – Brewery Operations.”
Government laws and regulations affecting the operation of our restaurants, including (but not limited to)those that apply to the acquisition and maintenance of our brewing and retail liquor licenses, minimumwages, consumer health and safety, health insurance coverage, nutritional disclosures, and employmenteligibility-related documentation requirements could increase our operating costs, cause unexpecteddisruptions to our operations and restrict our growth.
Our development and construction of additional restaurants must comply with applicable zoning, land use andenvironmental regulations. More stringent and varied requirements of local government bodies with respect to
34

zoning, land use and environmental factors could delay construction of new restaurants and add to their cost inthe future. In addition, difficulties or failure in obtaining the required licenses and approvals could delay, orresult in our decision to cancel, the opening of new restaurants.
In addition, various federal and state labor laws govern our relationship with our employees and affect ouroperating costs. These laws include minimum wage requirements, overtime pay, meal and rest breaks,unemployment tax rates, workers’ compensation rates, work eligibility requirements, employee classification asexempt/non-exempt for overtime and other purposes, immigration status and other wage and benefitrequirements. In particular, we are subject to the regulations of the ICE branch of the United States Departmentof Homeland Security. In addition, some states in which we operate have adopted immigration employmentprotection laws. Changes to these aforementioned laws or other employment laws or regulations, could adverselyaffect our operating results and thus restrict our growth, including additional government-imposed increases inminimum wages, overtime pay, paid time off or leaves of absence, mandated health benefits, increased taxreporting and tax payment requirements for employees who receive gratuities, a reduction in the number of statesthat allow tips to be credited toward minimum wage requirements and increased employee litigation, includingclaims relating to the Fair Labor Standards Act and comparable state laws.
The U.S. Congress and Department of Homeland Security from time to time consider and may implementchanges to federal immigration laws, regulations or enforcement programs. Some of these changes may increaseour obligations for compliance and oversight, which could subject us to additional costs and make our hiringprocess more cumbersome, or reduce the availability of potential employees. Even if we operate our restaurantsin strict compliance with ICE and state requirements, some of our employees may not meet federal workeligibility or residency requirements, which could lead to a disruption in our work force. Although we require allof our new employees to provide us with the government-specified documentation evidencing their employmenteligibility, some of our employees may, without our knowledge, be unauthorized workers. Unauthorized workersare subject to seizure and deportation and may subject us to fines, penalties or loss of our business license incertain jurisdictions. Additionally, a government audit could result in a disruption to our workforce or adversepublicity that could negatively impact our brand and our use of E-Verify and/or potential for receipt of lettersfrom the Social Security Administration requesting information (commonly referred to as no-match letters) couldmake it more difficult to recruit and/or retain qualified employees.
Potential changes in labor laws or increased union recruiting activates could result in portions of our workforcebeing subjected to greater organized labor influence. Although we do not currently have any unionizedemployees, labor legislation could have an adverse effect on our business and financial results by imposingrequirements that could potentially increase our costs, reduce our flexibility and impact our ability to service ourcustomers. In addition, a labor dispute involving some or all of our employees could harm our reputation, disruptour operations and reduce our revenues and resolution of disputes may increase our costs.
Additionally, some states, counties and cities have enacted menu labeling laws which are separate of thefederally mandated menu labeling law that is part of the Patient Protection and Affordable Care Act. Non-compliance with these laws could result in the imposition of fines and/or the closure of restaurants. We couldalso be subject to lawsuits that claim our non-compliance. These menu labeling laws could also result inchanging consumer preferences which may adversely affect our results of operations and financial position. Wemay not be able to adequately adapt our menu offerings to keep pace with developments in current consumerpreferences related to nutrition, which may adversely impact our sales.
Some jurisdictions in which we operate have recently enacted new requirements that require us to adopt andimplement a Hazard Analysis and Critical Control Points (“HACCP”) System for managing food safety andquality. HACCP refers to a management system in which food safety is addressed through the analysis andcontrol of potential hazards from production, procurement and handling, to manufacturing, distribution andconsumption of the finished product. We expect to incur certain costs to comply with these regulations, and thesecosts may be more than we anticipate. If we fail to comply with these laws or regulations, our business couldexperience a material adverse effect.
35

The Americans with Disabilities Act of 1990 prohibits discrimination on the basis of disability in publicaccommodations and employment. Although our restaurants are designed to be accessible to the disabled, wecould be required to make modifications to our restaurants to provide service to, or make reasonableaccommodations for, disabled persons. Non-compliance with this law and related laws enacted at the state orlocal level could result in the imposition of fines or an award of damages to private litigants.
The collective impact of current laws and regulations, the effect of future changes in laws or regulations thatimpose additional requirements and the consequences of litigation relating to current or future laws andregulations, or our inability to respond effectively to significant regulatory or public policy issues, could increaseour compliance and other costs of doing business and therefore have an adverse effect on our results ofoperations. Failure to comply with the laws and regulatory requirements of federal, state and local authoritiescould result in, among other things, revocation of required licenses, administrative enforcement actions, fines andcivil and criminal liability. Compliance with these laws and regulations can be costly and can increase ourexposure to litigation or governmental investigations or proceedings.
Limitations in our insurance coverage or rising insurance costs could adversely affect our business orfinancial condition in certain circumstances.
We purchase comprehensive insurance coverage, including, but not limited to, workers’ compensation, generalliability, directors’ and officers’ liability, employment practices, fire and extended coverage and propertyinsurance with coverage levels that we consider appropriate, based on the advice of our outside insurance andrisk management advisors. However, such insurance is subject to limitations, including deductibles, exclusionsand maximum liabilities covered. The cost of workers’ compensation insurance, general liability insurance,property insurance and directors’ and officers’ liability insurance fluctuates based on market conditions andavailability as well as our historical trends. Moreover, there are certain types of losses that may be uninsurable ornot economically insurable. Such hazards may include earthquake, hurricane and flood losses and certainemployment practices. If such a loss should occur, we would, to the extent that we were not covered for such lossby insurance, suffer a loss of the capital invested, as well as anticipated profits and cash flow from such damagedor destroyed properties. Punitive damage awards are generally not covered by insurance; thus, any awards ofpunitive damages as to which we may be liable could adversely affect our ability to continue to conduct ourbusiness, to expand our operations or to develop additional restaurants. There is no assurance that any insurancecoverage we maintain will be adequate, that we can continue to obtain and maintain such insurance at all or thatthe premium costs will not rise to an extent that they adversely affect us or our ability to economically obtain ormaintain such insurance.
We self-insure a substantial portion of our workers’ compensation and general liability costs, and unfavorablechanges in trends could have a negative impact on our profitability. The dollar amount of claims that we actuallyexperience under our workers’ compensation and general liability insurance, for which we carry highdeductibles, may also increase at any time, thereby further increasing our costs. Additionally, health insurancecosts have risen significantly over the past few years and are expected to continue to increase. These increaseshave a negative impact on our profitability if we are not able to offset the effect of such increases with planmodifications and cost control measures, or by continuing to improve our operating efficiencies.
Our business and future development could be harmed if we are unable to retain key personnel or havedifficulties in recruiting qualified personnel.
The success of our business continues to depend on the contributions of our senior management team, bothindividually and as a group. Our senior executives have been instrumental in setting our strategic direction,operating our business, identifying, recruiting and training key personnel, identifying expansion opportunitiesand arranging necessary financing. Losing the services of any of these individuals could materially adverselyaffect our business until a suitable replacement is found. We believe that these individuals cannot easily bereplaced with executives of equal experience and capabilities. Although we have employment agreements withour Chief Executive Officer and some of our senior executives, we cannot prevent them from terminating theiremployment with us.
36
Litigation, including allegations of illegal, unfair or inconsistent employment practices, could have a materialadverse effect on our business.
Our business is subject to the risk of litigation by employees, customers, suppliers, shareholders, governmentagencies or others through private actions, class or collective actions, administrative proceedings, regulatoryactions or other litigation. These actions and proceedings may involve allegations of illegal, unfair or inconsistentemployment practices, including wage and hour violations and employment discrimination; customerdiscrimination; food safety issues including poor food quality, food-borne illness, food tampering, foodcontamination, and adverse health effects from consumption of various food products or high-calorie foods(including obesity); other personal injury; violation of “dram-shop” laws (providing an injured party withrecourse against an establishment that serves alcoholic beverages to an intoxicated party who then causes injuryto himself or a third party); trademark or patent infringement; violation of the federal securities laws; or otherconcerns. The outcome of litigation, particularly class action lawsuits and regulatory actions, is difficult to assessor quantify. Plaintiffs in these types of lawsuits may seek recovery of very large or indeterminate amounts, andthe magnitude of the potential loss relating to such lawsuits may remain unknown for substantial periods of time.The cost to defend litigation may be significant. There may also be adverse publicity associated with litigationthat could decrease customer acceptance of our brands, regardless of whether the allegations are valid or weultimately are found liable. Litigation could impact our operations in other ways as well. Allegations of illegal,unfair or inconsistent employment practices, for example, could adversely affect employee acquisition andretention. Also, some employment related claims in the area of wage and hour disputes are not insurable risks.We also are subject to claims and disputes from landlords under our leases, which could lead to litigation or athreatened or actual lease termination. Litigation of any nature may be expensive to defend and may divertmoney and management’s attention from our operations and adversely affect our financial condition and resultsof operations.
The occurrence or threat of extraordinary events, including terrorist attacks, could cause consumer spendingto decline, which would adversely affect our sales and results of operations.
The occurrence or threat of extraordinary events, including future terrorist attacks and military and governmentalresponses and the prospect of future wars, may result in negative changes to economic conditions likely resultingin decreased consumer spending. Additionally, decreases in consumer discretionary spending could impact thefrequency with which our customers choose to dine out at restaurants or the amount they spend on meals whiledining out at restaurants, thereby adversely affecting our sales and results of operations. A decrease in consumerdiscretionary spending could also adversely affect our ability to achieve the benefit of planned menu priceincreases to help preserve our operating margins.
Natural disasters could unfavorably affect our operations.
The occurrence of natural disasters, such as fires, hurricanes, freezing weather or earthquakes (particularly inCalifornia where our centralized operating systems and restaurant support center administrative personnel arelocated) could unfavorably affect our operations and financial performance. Such events could result in physicaldamage to one or more of our restaurants; the temporary or permanent closure of one or more of our restaurantsor restaurant support center; the temporary lack of an adequate work force in an affected geographical trade area;the temporary or long-term disruption in the supply of food, beverages, beer and other products to ourrestaurants; the temporary disruption of electric, water, sewer and waste disposal services necessary for ourrestaurants to operate; and/or the temporary reduction in the availability of certain products in our restaurants.
We have disaster recovery procedures and business continuity plans in place to address most events of a crisisnature, including hurricanes and other natural disasters, including back up and off-site locations for recovery ofelectronic and other forms of data and information. However, if we are unable to fully implement our disasterrecovery plans, we may experience delays in recovery of data, inability to perform vital corporate functions,tardiness in required reporting and compliance, failures to adequately support field operations and otherbreakdowns in normal communication and operating procedures that could have a material adverse effect on ourfinancial condition, results of operation and exposure to administrative and other legal claims.
37

Future changes in financial accounting standards may significantly change our reported results ofoperations.
Generally accepted accounting principles in the U.S. are subject to interpretation by the Financial AccountingStandards Board, or FASB, the American Institute of Certified Public Accountants, the SEC and various bodiesformed to promulgate and interpret appropriate accounting principles. A change in these principles orinterpretations could have a significant effect on our reported financial results and could affect the reporting oftransactions completed before the announcement of a change. In addition, the SEC has announced a multi-yearplan that could ultimately lead to the use of International Financial Reporting Standards by U.S. issuers in theirSEC filings. Any such change could have a significant effect on our reported financial results.
Additionally, our assumptions, estimates and judgments related to complex accounting matters couldsignificantly affect our financial results. Generally accepted accounting principles and related accountingpronouncements, implementation guidelines and interpretations with regard to a wide range of matters that arerelevant to our business, including but not limited to, revenue recognition, fair value of investments, impairmentof long-lived assets, leases and related economic transactions, intangibles, self-insurance, income taxes, propertyand equipment, unclaimed property laws and litigation, and stock-based compensation are highly complex andinvolve many subjective assumptions, estimates and judgments by us. Changes in these rules or theirinterpretation or changes in underlying assumptions, estimates or judgments by us could significantly change ourreported or expected financial performance.
The market price of our common stock may be volatile and our shareholders may lose all or part of theirinvestment.
The market price of our common stock could fluctuate significantly, and our shareholders may not be able toresell their shares at or above the price they paid for them. Those fluctuations could be based on various factorsin addition to those otherwise described in this Form 10-K and the following:
• actual or anticipated fluctuations in comparable restaurant sales or operating results, whether in ouroperations or in those of our competitors;
• changes in financial estimates or opinions by research analysts, either with respect to us or other casualdining companies;
• any failure to meet investor or analyst expectations, particularly with respect to total restaurant operatingweeks, number of restaurant openings, comparable restaurant sales, average weekly sales per restaurant,total revenues, operating margins and net income per share;
• the public’s reaction to our press releases, other public announcements and our filings with the SEC;• actual or anticipated changes in domestic or worldwide economic, political or market conditions, such as
recessions or international currency fluctuations;• changes in the consumer spending environment;• terrorist acts;• changes in laws or regulations, or new interpretations or applications of laws and regulations, that are
applicable to our business;• changes in accounting standards, policies, guidance, interpretations or principles;• short sales, hedging and other derivative transactions in the shares of our common stock;• future sales or issuances of our common stock, including sales or issuances by us, our directors or
executive officers and our significant stockholders;• our dividend policy;• changes in the market valuations of other restaurant companies;• actions by stockholders;• various market factors or perceived market factors, including rumors, involving us, our suppliers and
distributors, whether accurate or not;• announcements by us or our competitors of new locations, menu items, technological advances,
significant acquisitions, strategic partnerships, divestitures, joint ventures or other strategic initiatives;
38

• the addition or loss of a key member of management; and• changes in the costs or availabilities of key inputs to our operations.
In addition, we cannot assure that an active trading market for our common stock will continue which couldaffect our stock price and the liquidity of any investment in our common stock.
The trading market for our common stock is influenced by the research and reports that industry or securitiesanalysts publish about us, our business and our industry. If one or more analysts adversely change theirrecommendation regarding our shares or our competitors’ stock, our share price would likely decline. If one ormore analysts cease coverage of us or fail to regularly publish reports on us, we could lose visibility in thefinancial markets which, in turn, could cause our share price or trading volume to decline.
In addition, our stock price can be influenced by trading activity in our common stock or trading activity inderivative instruments with respect to our common stock as a result of market commentary (includingcommentary that may be unreliable or incomplete in some cases); changes in expectations about our business,our creditworthiness or investor confidence generally; actions by shareholders and others seeking to influenceour business strategies; portfolio transactions in our stock by significant shareholders; or trading activity thatresults from the ordinary course rebalancing of stock indices in which our stock may be included.
In the past, following periods of volatility in the market price of a company’s securities, shareholders have ofteninstituted securities class action litigation against those companies. Such litigation, if instituted, could result insubstantial costs and a diversion of management attention and resources, which would significantly harm ourprofitability and reputation.
Because we do not anticipate paying any dividends for the foreseeable future, our shareholders may notreceive any return on their investment unless they sell their common stock for a price greater than that whatthey paid for it.
The continued operation and expansion of our business will require substantial funding. Accordingly, we do notanticipate paying any dividends to our shareholders for the foreseeable future. Therefore, our shareholders mayhave to sell some or all of their common stock in order to generate cash flow from their investment. Ourshareholders may not receive a gain on their investment when they sell our common stock and they may losesome or the entire amount of their investment. Any determination to pay dividends in the future will be at thediscretion of our Board of Directors and will depend upon our financial condition, operating results, contractualrestrictions, restrictions imposed by applicable law and other factors our Board of Directors deems relevant.
Failure to establish, maintain and apply adequate internal control over our financial reporting could affectour reported results of operations.
We are subject to the ongoing internal control provisions of Section 404 of the Sarbanes-Oxley Act of 2002 andthe related rules adopted by the SEC and the Public Company Accounting Oversight Board. These provisionsprovide for the identification of material weaknesses in internal control over financial reporting, which is aprocess to provide reasonable assurance regarding the reliability of financial reporting for external purposes inaccordance with U.S. GAAP. Because of its inherent limitations, internal control over financial reporting is notintended to provide absolute assurance that a misstatement of our financial statements would be prevented ordetected. Should we identify a material weakness in internal controls, there can be no assurance that we will beable to remediate any future material weaknesses that may be identified in a timely manner or maintain all of thecontrols necessary to remain in compliance. Any failure to maintain an effective system of internal controls overfinancial reporting could limit our ability to report our financial results accurately and timely or to detect andprevent fraud. Any such failure could subject us to adverse regulatory consequences, including sanctions by theSEC or violations of applicable stock exchange listing rules, or cause a breach of certain covenants under ourfinancing arrangements. There also could be a negative reaction in the financial markets due to a loss of investorconfidence in us and the reliability of our financial statements. Confidence in the reliability of our financial
39

statements also could suffer if we or our independent registered public accounting firm were to report a materialweakness in our internal controls over financial reporting. This could materially adversely affect us and lead to adecline in the price of our common stock.
We are heavily dependent on information technology in our operations as well as with respect to our customerloyalty and employee engagement programs. And any material failure of such technology, including but notlimited to cyber-attacks, could materially adversely affect our revenues and impair our ability to efficientlyoperate our business.
We rely heavily on electronic information systems in all aspects of our operations, including (but not limited to)point-of-sale transaction processing in our restaurants; efficient operation of our restaurant kitchens; managementof our inventories and overall supply chain; collection of cash; payment of payroll and other obligations; and,various other processes and procedures including our customer loyalty and employee engagement programs. Ourability to efficiently manage our business depends significantly on the reliability and capacity of our in-houseinformation systems and those technology services and systems that we contract for from third parties. Ourelectronic information systems, including our back-up systems, are subject to damage or interruption from poweroutages, cyber-attacks, computer and telecommunications failures, computer viruses, internal or external securitybreaches, catastrophic events such as fires, earthquakes, tornadoes and hurricanes, and/or errors by ouremployees. The failure of any of these systems to operate effectively, any problems with their maintenance, anyissues with upgrades or transitions to replacement systems, or any breaches in data security could cause materialinterruptions to our operations or harm to individuals in the form of identity theft or improper use of personalinformation. While we have invested and continue to invest in technology security initiatives and disasterrecovery plans, these measures cannot fully insulate us from technology disruption that could result in adverseeffects on operations and profits. Although we, with the help of third party service providers and consultants,intend to maintain and upgrade our security technology and establish operational procedures to prevent suchdamage, breaches, or attacks, there can be no assurance that these security measures will be successful. Inaddition, advances in computer capabilities, new discoveries in the field of cryptography or other developmentscould result in a compromise or breach of the algorithms we and our third party service providers use to encryptand protect customer transaction data. A failure of such security measures could harm our reputation andfinancial results, as well as subject us to litigation or actions by regulatory authorities. Significant capitalinvestments might be required to remediate any problems, infringements, misappropriations or other third partyclaims.
We outsource certain essential business processes to third party vendors that subject us to risks, includingdisruptions in business and increased costs.
Some of our essential business processes that are dependent on technology are outsourced to third parties. Suchprocesses include, but are not limited to, gift card tracking and authorization, on-line ordering, credit cardauthorization and processing, certain components of our “BJ’s Premier Rewards” customer loyalty program,certain insurance claims processing, payroll processing, web site hosting and maintenance, data warehousing andbusiness intelligence services, point-of-sale system maintenance, certain tax filings, telecommunicationsservices, web-based labor scheduling and other key processes. We make a diligent effort to ensure that allproviders of outsourced services are observing proper internal control practices, such as redundant processingfacilities; however, there are no guarantees that failures will not occur. Failure of third parties to provideadequate services could have an adverse effect on our results of operations, financial condition or ability toaccomplish our financial and management reporting.
We may incur costs resulting from security risks we face in connection with our electronic processing andtransmission of confidential customer information.
We accept electronic payment cards from our customers for payment in our restaurants. A number of restaurantoperators and retailers have experienced actual or potential security breaches in which credit and debit cardinformation may have been stolen in addition to other personal information such as our customer’s names, email
40

addresses, home addresses and phone numbers. While we have taken reasonable steps to prevent the occurrenceof security breaches in this respect, we may, in the future, become subject to claims for purportedly fraudulenttransactions arising out of the actual or alleged theft of credit or debit card information, and we may also besubject to lawsuits or other proceedings in the future relating to these types of incidents. Proceedings related totheft of credit or debit card information may be brought by payment card providers, banks and credit unions thatissue cards, cardholders (either individually or as part of a class action lawsuit) and federal and state regulators.Any such proceedings could distract our management from running our business and cause us to incur significantunplanned losses and expenses. Additionally, any publicity related to stolen personal identification from creditand debit card information or other personal information such as our customer’s or employee names, emailaddresses, home addresses and phone numbers may negatively affect our sales and profitability. We also receiveand maintain certain personal information about our customers and employees. The use of this information by usis regulated at the federal and state levels. If our security and information systems are compromised or ouremployees fail to comply with these laws and regulations and this information is obtained by unauthorizedpersons or used inappropriately, it could adversely affect our reputation, as well as results of operations, andcould result in litigation against us or the imposition of penalties. In addition, our ability to accept credit cards aspayment in our restaurants and on-line store depends on us remaining in compliance with standards set by thePCI Security Standards Council. These standards, set by a consortium of the major credit card companies, requirecertain levels of system security and procedures to protect our customers’ credit card and other personalinformation. Privacy and information security laws and regulations change over time, and compliance with thosechanges may result in cost increases due to necessary systems and process changes.
Our federal, state and local tax returns may, from time to time, be selected for audit by the taxing authorities,which may result in tax assessments or penalties that could have a material adverse impact on our results ofoperations and financial position.
We are subject to federal, state and local taxes. Significant judgment is required in determining the provision forincome taxes. Although we believe our tax estimates are reasonable, if the IRS or other taxing authority disagreeswith the positions we have taken on our tax returns, we could have additional tax liability, including interest andpenalties. If material, payment of such additional amounts, upon final adjudication of any disputes, could have amaterial impact on our results of operations and financial position. The cost of complying with new tax rules,laws or regulations could be significant. Increases in federal or state statutory tax rates and other changes in taxlaws, rules or regulations may increase our effective tax rate. Any increase in our effective tax rate could have amaterial impact on our financial results.
Unsolicited takeover proposals, governance change proposals, proxy contests and certain proposals/actions byactivist investors may create additional risks and uncertainties with respect to the Company’s financialposition, operations, strategies and management, and may adversely affect our ability to attract and retain keyemployees. Any perceived uncertainties as to our future direction also could affect the market price andvolatility of our securities.
Public companies in the restaurant industry have been the target of unsolicited takeover proposals in the past. Inthe event that a third party, such as a competitor, private equity firm or activist investor makes an unsolicitedtakeover proposal, or proposes to change our governance policies or board of directors, or makes other proposalsconcerning the Company’s ownership structure or operations, our review and consideration of such proposalsmay be a significant distraction for our management and employees, and could require the expenditure ofsignificant time and resources by us. Such proposals may create uncertainty for our employees’ additional risksand uncertainties with respect to the Company’s financial position, operations, strategies and management, andmay adversely affect our ability to attract and retain key employees. Any perceived uncertainties as to our futuredirection also could affect the market price and volatility of our securities.
41

Any failure to complete stock repurchases under our previously announced repurchase program maynegatively impact investor perception of us, and could therefore affect the market price and volatility of ourstock.
Our stock repurchase program may require us to use a significant portion of our cash flow from operations and/ormay require us to incur indebtedness utilizing our existing Credit Facility or some other form of debt financing.Our ability to repurchase stock will depend on our ability to generate sufficient cash flows from operations, assupplemented by proceeds from the exercise of employee stock options and our capacity to borrow funds, whichmay be subject to economic, financial, competitive and other factors that are beyond our control. The inability tocomplete stock repurchases under our previously announced repurchase program may negatively impact investorperception of us, and could therefore affect the market price and volatility of our stock.
ITEM 1B. UNRESOLVED STAFF COMMENTS
None.
ITEM 2. PROPERTIES
RESTAURANT LOCATIONS
As of February 26, 2015, we operated a total of 158 restaurants as follows:
BJ’s Pizza& Grill®
BJ’sGrill®
BJ’s Restaurant& Brewhouse®
BJ’s Restaurant& Brewery® Total
Arkansas – – 1 – 1Arizona – – 5 1 6California 4 1 52 6 63Colorado – – 5 – 5Florida – – 19 – 19Indiana – – 1 – 1Kansas – – 1 – 1Kentucky – – 2 – 2Louisiana – – 2 – 2Maryland – – 2 – 2Nevada – – 4 1 5New Mexico – – 1 – 1New York – – 1 – 1Ohio – – 4 – 4Oklahoma – – 3 – 3Oregon – – 2 1 3Texas – – 31 1 32Virginia – – 3 – 3Washington – – 4 – 4
4 1 143 10 158
As of February 26, 2015, the average interior square footage of our restaurants was approximately 8,300 squarefeet. Many of our restaurants also have outdoor patios that are utilized when weather conditions permit.
As of February 26, 2015, 153 of our 158 existing restaurants are located on leased properties. We own theunderlying land for five of our operating restaurants. There can be no assurance that we will be able to renewexpiring leases after the expiration of all remaining renewal options. Most of our restaurant leases provide forcontingent rent based on a percentage of restaurant sales (to the extent this amount exceeds a minimum base rent)and payment of certain occupancy-related expenses. We own substantially all of the equipment, furnishings and
42

trade fixtures in our restaurants. Our restaurant support center (“RSC”) is located in an approximate 56,000square foot leased space in Huntington Beach, California. Our RSC lease expires August 31, 2018.
ITEM 3. LEGAL PROCEEDINGS
See Note 7 of Notes to Consolidated Financial Statements in Part IV, Item 15 of this Annual Report onForm 10-K for a summary of legal proceedings.
ITEM 4. MINE SAFETY DISCLOSURES
Not applicable.
43
PART II
ITEM 5. MARKET FOR REGISTRANT’S COMMON EQUITY, RELATED SHAREHOLDERMATTERS AND ISSUER PURCHASES OF EQUITY SECURITIES
Market Information
Our common stock (symbol BJRI) trades on the NASDAQ Global Select Market. All stock prices are closingprices per the NASDAQ Global Select Market. On February 25, 2015, the closing price of our common stockwas $52.47 per share. The table below shows our high and low common stock closing prices as reported by theNASDAQ Global Select Market.
Common Stock
High Low
Fiscal 2014First Quarter $35.18 $25.63Second Quarter $35.87 $28.55Third Quarter $37.77 $30.64Fourth Quarter $50.30 $33.06
Fiscal 2013First Quarter $35.27 $29.40Second Quarter $38.87 $31.57Third Quarter $40.61 $28.67Fourth Quarter $31.59 $25.60
As of February 26, 2015, we had approximately 90 shareholders of record and we estimate that there wereapproximately 9,000 beneficial shareholders.
44

Stock Performance Graph
The following chart compares the five year cumulative total stock performance of our common stock, the S&P500 Index and a peer group consisting of: Bloomin’ Brands, Inc., Bravo Brio Restaurant Group, BrinkerInternational, Inc., Buffalo Wild Wings, Inc., The Cheesecake Factory Incorporated, Chuy’s Holdings, Inc.,Darden Restaurants, Inc., Famous Dave’s of America, Inc., Ignite Restaurant Group, Kona Grill, Inc., Red RobinGourmet Burgers, Inc., Ruby Tuesday, Inc. (GA), and Texas Roadhouse, Inc. (Class A). Bloomin’ Brands, Inc.,Chuy’s Holdings, Inc. and Ignite Restaurant Group became a publicly traded company in fiscal 2012; therefore,the peer group data only includes their price information beginning in 2012. The peer group companies allcompete in the “casual dining” segment of the restaurant industry. The graph assumes that $100 was invested atinception in our common stock and in each of the indices that all dividends were reinvested. The measurementpoints utilized in the graph consist of the last trading day in each calendar year, which closely approximates thelast day of our respective fiscal year. The historical stock performance presented below is not intended to andmay not be indicative of future stock performance.
$0$50
$100$150$200$250$300
12/09 12/10 12/11 12/12 12/13 12/14
COMPARISON OF 5 YEAR CUMULATIVE TOTAL RETURN*Among BJ's Restaurants, Inc., the S&P 500 Index,
and a Peer Group
BJ’s Restaurants, Inc. S&P 500 Peer Group
Stock-Based Compensation Plan Information
We have two stock-based compensation plans – the 2005 Equity Incentive Plan and the 1996 Stock OptionPlan – under which we may issue shares of our common stock to employees, officers, directors and consultants.Upon effectiveness of the 2005 Equity Incentive Plan, the 1996 Stock Option Plan was closed for purposes ofnew grants and the remaining available shares for grant, including those shares related to option awards forfeitedor terminated without exercise under the 1996 Stock Option Plan accrue to the 2005 Equity Incentive Plan. Bothof these plans have been approved by our shareholders. Under the 2005 Equity Incentive Plan, we have grantedincentive stock options, non-qualified stock options and restricted stock units. The following table providesinformation about the shares of our common stock that may be issued upon exercise of awards under these twoplans as of December 30, 2014 (share numbers in thousands):
Number of securitiesto be issued upon
exercise ofoutstanding stock
options and restrictedstock units
Weighted averageexercise price of
outstanding stockoptions and restricted
stock units
Number of securitiesremaining availablefor future issuanceunder stock-based
compensation plans
Stock-based compensation plans approved byshareholders 1,979 $25.62 435Stock-based compensation plans not approved byshareholders – $ – –
45

Dividend Policy and Stock Repurchases
The continued operation and expansion of our business will require substantial funding. Accordingly, we havenot paid any dividends since our inception and have currently not allocated any funds for the payment ofdividends. Rather, it is our current policy to retain earnings, if any, for expansion of our operations, remodelingand investing in our existing restaurants and other general corporate purposes. We have no plans to pay any cashdividends in the foreseeable future. Any determination to pay dividends in the future will be at the discretion ofour Board of Directors and will depend upon our financial condition, operating results and other factors ourBoard of Directors deem relevant. Our Credit Facility contains, and debt instruments that we enter into in thefuture may contain, covenants that place limitations on the amount of dividends we may pay.
In April 2014, our Board of Directors authorized a $50 million share repurchase plan, which was subsequentlyincreased to $150 million in August 2014. Approximately $100 million of this amount was repurchased duringfiscal 2014. The share repurchases may be completed through the combination of individually negotiatedtransactions, accelerated share buybacks, and/or open market purchases. As of December 30, 2014, we haveapproximately $50 million available under our current share repurchase plan. Our Credit Facility does notcontain any restrictions on the amount of borrowings that can be used to make stock repurchases as long as weare in compliance with our financial and non-financial covenants.
The following table sets forth information with respect to repurchases of common shares made during fiscal2014:
Period (1)
TotalNumberof Shares
Purchased
AveragePrice
Paid PerShare
TotalNumber of
SharesPurchasedas Part of
the PubliclyAnnounced
Plans
Increase inDollars for
ShareRepurchase
Authorization
ApproximateDollar Value of
Shares thatMay Yet BePurchasedUnder thePlans or
Programs
04/02/2014 – 04/30/2014 – $– – $– $50,000,00005/01/2014 – 05/28/2014 70,469 $29.50 70,469 $– $47,948,93105/29/2014 – 07/01/2014 220,685 $34.42 220,685 $– $40,203,60407/02/2014 – 07/29/2014 324,712 $33.69 324,712 $– $29,348,10407/30/2014 – 08/26/2014 763,547 $35.41 763,547 $100,000,000 $102,183,69308/27/2014 – 09/30/2014 642,515 $36.82 642,515 $– $78,570,87810/01/2014 – 10/28/2014 814,057 $35.28 814,057 $– $50,000,02110/29/2014 – 11/25/2014 – $– – $– $50,000,02111/26/2014 – 12/30/2014 – $– – $– $50,000,021
Total 2,835,985 $34.62 2,835,985
(1) Period information is presented by reference to our fiscal months during fiscal 2014.
46

ITEM 6. SELECTED CONSOLIDATED FINANCIAL DATA
The following selected consolidated financial and operating data for each of the five fiscal years in the periodended December 30, 2014, are derived from our audited consolidated financial statements. This selectedconsolidated financial and operating data should be read in conjunction with the consolidated financialstatements and accompanying notes, “Management’s Discussion and Analysis of Financial Condition and Resultsof Operations” and other financial information included elsewhere in this report.
Fiscal Year2014 2013 2012 2011 (1) 2010
(in thousands, except per share data)Revenues $845,569 $775,125 $708,325 $620,943 $513,860Costs and expenses:
Cost of sales 212,979 191,891 175,636 152,695 126,078Labor and benefits 298,703 273,458 245,078 214,470 178,199Occupancy and operating 182,149 173,981 150,312 127,291 109,566General and administrative 51,558 49,105 45,131 39,952 34,632Depreciation and amortization 55,387 49,007 41,347 34,075 28,878Restaurant opening 4,973 9,132 8,440 6,997 5,189Loss on disposal of assets and impairments 1,963 3,879 557 1,039 1,164Legal and other settlements 2,431 812 959 2,037 –
Total costs and expenses 810,143 751,265 667,460 578,556 483,706
Income from operations 35,426 23,860 40,865 42,387 30,154Other income:Interest income (expense), net (238) 133 222 89 34Gain on investment settlement – – 797 614 –Other income, net 1,135 1,019 772 562 612
Total other income 897 1,152 1,791 1,265 646
Income before income taxes 36,323 25,012 42,656 43,652 30,800
Income tax expense 8,926 3,990 11,247 12,082 7,638
Net income $27,397 $21,022 $31,409 $31,570 $23,162
Net income per share:Basic $0.99 $0.75 $1.12 $1.14 $0.86
Diluted $0.97 $0.73 $1.09 $1.08 $0.82
Weighted average number of shares outstanding:Basic 27,710 28,194 27,994 27,631 27,073
Diluted 28,316 28,895 28,857 29,143 28,167
Consolidated Balance Sheets Data (end ofperiod):
Cash and cash equivalents $30,683 $22,995 $15,074 $22,391 $31,518Marketable securities $– $9,791 $25,850 $30,744 $22,679Total assets $647,083 $610,879 $559,521 $502,079 $430,085Total long-term debt (including current portion) $58,000 $– $– $– $–Shareholders’ equity $348,689 $401,436 $371,834 $332,449 $287,826
(1) Fiscal 2011 consists of 53 weeks. All other fiscal years presented consist of 52 weeks.
47
ITEM 7. MANAGEMENT’S DISCUSSION AND ANALYSIS OF FINANCIAL CONDITION ANDRESULTS OF OPERATIONS
GENERAL
As of February 26, 2015, we owned and operated 158 restaurants located in 19 states as described in Item 2 —Properties — “Restaurant Locations” in this Form 10-K. Each of our restaurants is operated either as a BJ’sRestaurant & Brewery®, a BJ’s Restaurant & Brewhouse®, a BJ’s Pizza & Grill®, or a BJ’s Grill® restaurant.Our menu features BJ’s award-winning, signature deep-dish pizza, our proprietary craft beers and other beers, aswell as a wide selection of appetizers, entrées, pastas, sandwiches, specialty salads and desserts, including ourPizookie® dessert. Our proprietary craft beer is produced at several of our BJ’s Restaurant & Brewery® locationsas well as by independent third party brewers using our proprietary recipes. Our four BJ’s Pizza & Grill®
restaurants are a smaller format, full-service restaurant than our large format BJ’s Restaurant & Brewhouse® andBJ’s Restaurant & Brewery® locations and reflect the original format of the BJ’s restaurant concept that was firstintroduced in 1978. Our BJ’s Restaurant & Brewhouse® format currently represents our primary expansionvehicle. BJ’s Grill® is a smaller footprint restaurant that is currently intended to serve as a live research anddevelopment restaurant, where certain food, beverage, facility, technological and operational enhancements aretested for potential application to our larger restaurants.
We intend to continue developing and opening new BJ’s restaurants in high profile locations within denselypopulated areas in both existing and new markets. Since most of our established restaurants currently operateclose to full capacity during the peak demand periods of lunch and dinner, and given our relatively high averagesales per productive square foot, we generally do not expect to achieve sustained increases in comparablerestaurant sales in excess of our annual effective menu price increases for our mature restaurants, assuming weare able to retain our customer traffic levels in those restaurants. Therefore, we currently expect that the majorityof our year-over-year revenue growth for fiscal 2015 will be derived from new restaurant openings and thecarryover impact of partial-year openings during fiscal 2014.
Newly opened restaurants typically experience normal inefficiencies in the form of higher cost of sales, labor anddirect operating and occupancy costs for several months after their opening in both percentage and dollar termswhen compared with our more mature, established restaurants. Accordingly, the number and timing of newlyopened restaurants has had, and is expected to continue to have, an impact on restaurant opening expenses, costof sales, labor and occupancy and operating expenses. Additionally, initial restaurant openings in new marketsmay experience even greater inefficiencies for several months, if not longer, due to lower initial sales volumes,which results from initially low consumer awareness levels, and a lack of supply chain and other operating costleverage until additional restaurants can be opened in the markets.
Our revenues are comprised of food and beverage sales at our restaurants. Revenues from restaurant sales arerecognized when payment is tendered at the point of sale. Amounts paid with a credit card are recorded inaccounts and other receivables until payment is collected. Revenues from our gift cards are recognized uponredemption in our restaurants. Gift card breakage is recognized as a component of “Other income, net” on ourConsolidated Statements of Income. Gift card breakage is recorded when the likelihood of the redemption of thegift cards becomes remote, which is typically after 24 months from original gift card issuance.
In calculating comparable company-owned restaurant sales, we include a restaurant in the comparable base onceit has been open for 18 months. Customer traffic for our restaurants is estimated based on individual customerchecks.
Cost of sales is comprised of food and beverage costs, including the cost to produce and distribute ourproprietary craft beer, soda and ciders. The components of cost of sales are variable and typically fluctuatedirectly with sales volumes. Labor and benefit costs include direct hourly and management wages, bonuses andpayroll taxes and fringe benefits for restaurant employees, including stock-based compensation that is directlyrelated to restaurant level employees.
48

Occupancy and operating expenses include restaurant supplies, credit card fees, marketing costs, fixed rent,percentage rent, common area maintenance charges, utilities, real estate taxes, repairs and maintenance and otherrelated restaurant costs.
General and administrative costs include all corporate, field supervision and administrative functions that supportexisting operations and provide infrastructure to facilitate our future growth. Components of this categoryinclude corporate management, field supervision and corporate hourly staff salaries and related employeebenefits (including stock-based compensation expense and cash-based incentive compensation), travel andrelocation costs, information systems, the cost to recruit and train new restaurant management employees,corporate rent, certain brand marketing-related expenses and legal, professional and consulting fees.
Depreciation and amortization principally include depreciation on capital expenditures for restaurants.
Restaurant opening expenses, which are expensed as incurred, consist of the costs of hiring and training theinitial hourly work force for each new restaurant, travel, the cost of food and supplies used in training, grandopening promotional costs, the cost of the initial stocking of operating supplies and other direct costs related tothe opening of a restaurant, including rent during the construction and in-restaurant training period.
During fiscal year 2014, we closed a smaller format, BJ’s Pizza & Grill® legacy restaurant in Belmont Shore,California, when its lease expired. While we currently expect to pursue the renewal of substantially all of ourexpiring restaurant leases, there is no guarantee that we can mutually agree to a new lease that is satisfactory toour landlord and us or that, if renewed, rents will not increase substantially. We currently have one smallerformat “Pizza & Grill” restaurant lease scheduled to expire during the next twelve months. We are currently indiscussions to relocate this restaurant within the same trade area in the next 12 to 24 months.
RESULTS OF OPERATIONS
The following table sets forth, for the years indicated, our Consolidated Statements of Income expressed aspercentages of total revenues. All fiscal years presented consist of 52 weeks with the exception of fiscal year2011 which consists of 53 weeks. Percentages reflected below may not reconcile due to rounding.
Fiscal Year2014 2013 2012 2011 2010
Revenues 100.0% 100.0% 100.0% 100.0% 100.0%Costs and expenses:
Cost of sales 25.2 24.8 24.8 24.6 24.5Labor and benefits 35.3 35.3 34.6 34.5 34.7Occupancy and operating 21.5 22.4 21.2 20.5 21.3General and administrative 6.1 6.3 6.4 6.4 6.7Depreciation and amortization 6.6 6.3 5.8 5.5 5.6Restaurant opening 0.6 1.2 1.2 1.1 1.0Loss on disposal of assets and impairments 0.2 0.5 0.1 0.2 0.2Legal and other settlements 0.3 0.1 0.1 0.3 –
Total costs and expenses 95.8 96.9 94.2 93.2 94.1
Income from operations 4.2 3.1 5.8 6.8 5.9Other income:Interest income (expense), net – – – – –Gain on investment settlement – – 0.1 0.1 –Other income, net 0.1 0.1 0.1 0.1 0.1
Total other income 0.1 0.1 0.3 0.2 0.1
Income before income taxes 4.3 3.2 6.0 7.0 6.0Income tax expense 1.1 0.5 1.6 1.9 1.5
Net income 3.2% 2.7% 4.4% 5.1% 4.5%
49
52 WEEKS ENDED DECEMBER 30, 2014 (FISCAL 2014) COMPARED TO THE 52 WEEKS ENDEDDECEMBER 31, 2013 (FISCAL 2013)
Revenues. Total revenues increased by $70.4 million, or 9.1%, to $845.6 million during fiscal 2014 from$775.1 million during fiscal 2013. The increase in revenues primarily consisted of an increase of approximately$76.2 million in sales from new restaurants not yet in our comparable restaurant sales base, partially offset by anapproximate 0.8%, or $5.8 million decrease in comparable restaurant sales. The decrease in comparablerestaurant sales resulted principally from a reduction in customer traffic.
Cost of Sales. Cost of sales increased by $21.1 million, or 11.0%, to $213.0 million during fiscal 2014 comparedto $191.9 million during fiscal 2013. This increase was primarily due to the opening of 11 new restaurants duringfiscal 2014. As a percentage of revenues, cost of sales increased to 25.2% for fiscal 2014 from 24.8% for theprior fiscal year. The percentage increase was primarily related to commodity cost increases for dairy and meatsand a shift in our sales mix to items with higher food costs as a percentage of their selling prices, partially offsetby increased menu pricing.
Labor and Benefits. Labor and benefit costs for our restaurants increased by $25.2 million, or 9.2%, to$298.7 million during fiscal 2014, compared to $273.5 million during fiscal 2013. This increase was primarilydue to the opening of 11 new restaurants during fiscal 2014. As a percentage of revenues, labor and benefit costsremained at 35.3% for fiscal 2014 and the prior fiscal year as minimum wage increases were essentially offset byimproved hourly labor productivity. Included in labor and benefits for fiscal 2014 and 2013 was approximately$1.5 million and $1.3 million, respectively, or 0.2% of revenues, of stock-based compensation expense related toequity awards granted in accordance with our Gold Standard Stock Ownership Program for certain restaurantmanagement employees.
Occupancy and Operating. Occupancy and operating expenses increased by $8.2 million, or 4.7%, to$182.1 million during fiscal 2014 compared to $174.0 million during fiscal 2013. This increase was primarilydue to the opening of 11 new restaurants during fiscal 2014. As a percentage of revenues, occupancy andoperating expenses decreased to 21.5% for fiscal 2014 from 22.4% for the prior fiscal year. This percentagedecrease was primarily due to certain cost savings initiatives focused on repairs and maintenance and supplycosts, plus a reduction in the Texas mixed beverage gross receipts tax paid by us.
General and Administrative. General and administrative expenses increased by $2.5 million, or 5.0%, to$51.6 million during fiscal 2014 compared to $49.1 million during fiscal 2013. The increase in general andadministrative costs was primarily due to higher cash-based incentive compensation and other restaurant supportcosts, offset by fewer managers in our training program and less recruiting, travel and related expenses. Includedin general and administrative costs for fiscal 2014 and 2013 was $3.2 million and $3.1 million, respectively, ofstock-based compensation expense. As a percentage of revenues, general and administrative expenses decreasedto 6.1% for fiscal 2014 from 6.3% for the prior fiscal year. This percentage decrease was primarily due to fewermanagers in our training program and less travel related expenses as compared to the prior year, offset by highercash-based incentive compensation.
Depreciation and Amortization. Depreciation and amortization increased by $6.4 million, or 13.0%, to$55.4 million during fiscal 2014 compared to $49.0 million during fiscal 2013. As a percentage of revenues,depreciation and amortization increased to 6.6% for fiscal 2014 from 6.3% for the prior fiscal year. Thispercentage increase was principally a result of depreciation for new restaurants, restaurant remodels and otherinitiatives, coupled with the deleveraging of the fixed component of these expenses as a result of lowercomparable restaurant sales.
Restaurant Opening. Restaurant opening expenses decreased by $4.2 million, or 45.5%, to $5.0 million duringfiscal 2014 compared to $9.1 million during fiscal 2013. This decrease is primarily due the opening of 11 new
50

restaurants during fiscal 2014 as compared to 17 new restaurants during fiscal 2013. Our opening costs willfluctuate from period to period, depending upon, but not limited to, the number of restaurant openings, thelocation of the restaurants and the complexity of the staff hiring and training process.
Loss on Disposal of Assets and Impairments. Loss on disposal of assets and impairments decreased by$1.9 million, or 49.4%, to $2.0 million during fiscal 2014 compared to $3.9 million during fiscal 2013. Duringfiscal 2014, these costs related to the disposal of certain unproductive restaurant assets, the write off of theremaining net book value of assets related to the closure of our smaller format restaurant in Belmont Shore,California upon the expiration of its lease, and the reduction in the carrying value of our smaller formatrestaurant in La Jolla, California, which is scheduled to close upon the expiration of its lease in fiscal 2015.During fiscal 2013, these costs were related to the reduction in the carrying value of one of our underperformingBJ’s Restaurant & Brewhouse® restaurants and the write off of the remaining net book value of assets related tothe closure and relocation of our smaller format restaurant in Eugene, Oregon, coupled with the disposal ofcertain unproductive restaurant assets in connection with our ongoing productivity/efficiency initiatives andfacility image enhancement activities.
Legal and Other Settlements. Legal and other settlements of approximately $2.4 million during fiscal 2014 wasrelated to professional fees and other expenses incurred in connection with our shareholder settlement datedApril 21, 2014, as compared to legal and other settlements of approximately $0.8 million during fiscal 2013related to accrued compensation and related benefits resulting from employment settlements, a Texas AlcoholicBeverage Commission settlement related to our beer model in Texas and a sales tax audit assessment. See ourCurrent Report on Form 8-K filed on April 22, 2014 for a description of our shareholder settlement.
Other Income, Net. Other income, net, increased by $0.1 million, or 11.4%, to $1.1 million during fiscal 2014compared to $1.0 million during fiscal 2013. This increase was primarily due to greater gift card breakageincome offset by a decrease in the cash surrender value of certain life insurance programs under our deferredcompensation plan. Based on an analysis of our gift card program since its inception, we determined that at24 months after issuance date, the likelihood of gift card redemption is remote.
Income Tax Expense. Our effective income tax rate for fiscal 2014 was 24.6% compared to 16.0% for fiscal2013. This increase was primarily driven by higher pre-tax income in fiscal 2014 as compared to fiscal 2013,coupled with a small increase in FICA tax credits.
52 WEEKS ENDED DECEMBER 31, 2013 (FISCAL 2013) COMPARED TO THE 52 WEEKS ENDEDJANUARY 1, 2013 (FISCAL 2012)
Revenues. Total revenues increased by $66.8 million, or 9.4%, to $775.1 million during fiscal 2013 from$708.3 million during fiscal 2012. The increase in revenues consisted of an increase of approximately$74.0 million in sales from new or relocated restaurants not in our comparable restaurant sales base, partiallyoffset by an approximate 1.1%, or $7.2 million decrease in comparable restaurant sales. The decrease incomparable restaurant sales is primarily due to a reduction in customer traffic, partially offset by an effectivemenu price increase of approximately 2.2% for the year.
Cost of Sales. Cost of sales increased by $16.3 million, or 9.3%, to $191.9 million during fiscal 2013 comparedto $175.6 million during fiscal 2012. This increase was primarily due to the opening of 17 new restaurants duringfiscal 2013. As a percentage of revenues, cost of sales remained at 24.8% for fiscal 2013 and the prior fiscal year.
Labor and Benefits. Labor and benefit costs for our restaurants increased by $28.4 million, or 11.6%, to$273.5 million during fiscal 2013, compared to $245.1 million during fiscal 2012. This increase was primarilydue to the opening of 17 new restaurants during fiscal 2013. As a percentage of revenues, labor and benefit costsincreased to 35.3% for fiscal 2013 from 34.6% for the prior fiscal year. This percentage increase was primarilyrelated to the deleveraging of the fixed portion of management related labor and benefits as a result of lowercomparable restaurant sales. Included in labor and benefits for fiscal 2013 and 2012 was approximately
51
$1.3 million or 0.2% of revenues of stock-based compensation expense related to equity awards granted inaccordance with our Gold Standard Stock Ownership Program for certain restaurant management employees.
Occupancy and Operating. Occupancy and operating expenses increased by $23.7 million, or 15.7%, to$174.0 million during fiscal 2013 compared to $150.3 million during fiscal 2012. This increase was primarilydue to the opening of 17 new restaurants during fiscal 2013. As a percentage of revenues, occupancy andoperating expenses increased to 22.4% for fiscal 2013 from 21.2% for the prior fiscal year. This percentageincrease was principally due to planned additional marketing (0.7%), including expanded television testing inselect markets, coupled with increased facilities and general liability insurance costs (0.3%) and the deleveragingof the fixed component of these expenses as a result of lower comparable restaurant sales.
General and Administrative. General and administrative expenses increased by $4.0 million, or 8.8%, to$49.1 million during fiscal 2013 compared to $45.1 million during fiscal 2012. Included in general andadministrative costs for fiscal 2013 and 2012 was $3.1 million and $3.3 million, respectively, of stock-basedcompensation expense. The increase in general and administrative costs was primarily due to higher fieldsupervision and restaurant support costs, higher rent expense related to the expansion of our restaurant supportcenter and increased consulting and director fees, partially offset by lower cash-based incentive compensationexpense. As a percentage of revenues, general and administrative expenses slightly decreased to 6.3% for fiscal2013 from 6.4% for the prior fiscal year.
Depreciation and Amortization. Depreciation and amortization increased by $7.7 million, or 18.5%, to$49.0 million during fiscal 2013 compared to $41.3 million during fiscal 2012. Depreciation and amortizationincreased as a result of new restaurants, restaurant remodels and initiatives, including the expansion of ourrestaurant support center and test kitchen. As a percentage of revenues, depreciation and amortization increasedto 6.3% for fiscal 2013 from 5.8% for the prior fiscal year. This percentage increase was principally a result ofthe deleveraging of the fixed component of these expenses as a result of negative comparable restaurant sales aswell as additional depreciation related to our remodels and initiatives, including the expansion of our restaurantsupport center and test kitchen.
Restaurant Opening. Restaurant opening expenses increased by $0.7 million, or 8.2%, to $9.1 million duringfiscal 2013 compared to $8.4 million during fiscal 2012. This increase is primarily due the opening of 17 newrestaurants during fiscal 2013 as compared to 16 new restaurants during fiscal 2012. Our opening costs willfluctuate from period to period, depending upon, but not limited to, the number of restaurant openings, thelocation of the restaurants and the complexity of the staff hiring and training process.
Loss on Disposal of Assets and Impairments. Loss on disposal of assets and impairments increased by $3.3million, or 596.4%, to $3.9 million during fiscal 2013 compared to $0.6 million during fiscal 2012. These costswere related to the reduction in the carrying value of one underperforming BJ’s Restaurant & Brewhouse®
restaurants (approximately $3.1 million) and the write off of the remaining net book value of assets related to theclosure and relocation of our smaller format restaurant in Eugene, Oregon, coupled with the disposal of certainunproductive restaurant assets in connection with our ongoing productivity/efficiency initiatives and facilityimage enhancement activities.
Legal and Other Settlements. Legal and other settlements of approximately $0.8 million, or 0.1% of revenues,during fiscal 2013 was primarily related to accrued compensation and related benefits resulting from employmentsettlements, a Texas Alcoholic Beverage Commission settlement related to our beer model in Texas and a salestax audit assessment as compared to legal settlements of approximately $1.0 million, or 0.1% of revenues, duringfiscal 2012, which related to the settlement of a trademark infringement civil action and a California sales taxaudit.
Gain on Investment Settlement. Gain on investment settlement of approximately $0.8 million for fiscal 2012related to the settlement agreement reached in December 2009 with our former broker-dealer for the fullliquidation of our auction rate securities investment portfolio.
52

Other Income, Net. Other income, net, increased by $0.2 million, or 32.2%, to $1.0 million during fiscal 2013compared to $0.8 million during fiscal 2012. This increase was primarily due to greater gift card breakageincome coupled with an increase in the cash surrender value of certain life insurance programs under ourdeferred compensation plan. Based on an analysis of our gift card program since its inception, we determinedthat at 24 months after issuance date, the likelihood of gift card redemption is remote.
Income Tax Expense. Our effective income tax rate for fiscal 2013 was 16.0% compared to 26.4% for fiscal2012. The effective income tax rate for fiscal 2013 differed from the statutory income tax rate primarily due toadditional tax credits.
LIQUIDITY AND CAPITAL RESOURCES
The following tables set forth, for the periods indicated, a summary of our key liquidity measurements (dollaramounts in thousands):
December 30,2014
December 31,2013
Cash and cash equivalents $ 30,683 $ 22,995Total marketable securities $ — $ 9,791Net working capital ($25,707) ($21,303)Current ratio 0.8:1.0 0.8:1.0
Fiscal Year2014 2013
Cash provided by operating activities $100,040 $ 95,544Capital expenditures $ 88,124 $117,060
Our fundamental corporate finance philosophy is to maintain a conservative balance sheet in order to support ourlong-term restaurant expansion plan with sufficient financial flexibility; to provide the financial resourcesnecessary to protect and enhance the competitiveness of our restaurant and brewing operations; to provide ourrestaurant landlords with confidence as to our intent and ability to honor all of our financial obligations under ourrestaurant leases; and to provide a prudent level of financial capacity to manage the risks and uncertainties ofconducting our business operations on a larger-scale. We obtain financial resources principally from our ongoingoperations, supplemented by our cash balance on hand, employee stock option exercises and tenant improvementallowances from our landlords and our $150 million Credit Facility. Additionally, in the past we have obtainedcapital resources from public stock offerings.
Our capital requirements are principally related to our restaurant expansion plans and restaurant enhancementsand initiatives. While our ability to achieve our growth plans is dependent on a variety of factors, some of whichare outside of our control, currently, our primary growth objective is to achieve an approximate 10% increase intotal restaurant operating weeks on an annual basis over the next few years. For fiscal 2015, we plan to open atleast 15 new restaurants. Depending on the expected level of future new restaurant development and expectedtenant improvement allowances that we receive from our landlords, as well as our other planned capitalinvestments including ongoing maintenance capital expenditures, our base of established restaurant operationsmay not yet be large enough to generate enough cash flow from operations to totally fund our planned expansionover the long-term. We estimate the total domestic capacity for BJ’s restaurants to be at least 425, given the sizeof our current restaurant prototype and the current structure of the BJ’s concept and menu. Accordingly, we willcontinue to actively monitor overall conditions in the capital markets with respect to the potential sources andtiming of additional financing for our planned future expansion. However, there can be no assurance that suchfinancing will be available when required or available on terms acceptable to us. If we are unable to secureadditional capital resources, we may be required to reduce our long-term planned rate of expansion.
Similar to many restaurant chains, we typically utilize operating lease arrangements (principally ground leases)for the majority of our restaurant locations. We believe our operating lease arrangements continue to provide
53

appropriate leverage for our capital structure in a financially efficient manner. However, we are not limited to theuse of lease arrangements as our only method of opening new restaurants and from time to time have purchasedthe underlying land for new restaurants. While our operating lease obligations are not currently required to bereflected as indebtedness on our Consolidated Balance Sheets, the minimum rents and other related leaseobligations, such as common area expenses, under our lease agreements must be satisfied by cash flows from ourongoing operations. Accordingly, our lease arrangements reduce, to some extent, our capacity to utilize fundedindebtedness in our capital structure.
We also require capital resources to evolve, maintain and increase the productive capacity of our existing base ofrestaurants and brewery operations and to further expand and strengthen the capabilities of our corporate andinformation technology infrastructures. Our requirement for working capital is not significant since our restaurantcustomers pay for their food and beverage purchases in cash or credit cards at the time of the sale. Thus, we areable to sell many of our inventory items before we have to pay our suppliers for such items.
We typically seek to lease our restaurant locations for primary periods of 15 to 20 years under operating leasearrangements. Our rent structures vary from lease to lease, but generally provide for the payment of bothminimum and contingent (percentage) rent based on sales, as well as other expenses related to the leases (forexample, our pro-rata share of common area maintenance, property tax and insurance expenses). Many of ourlease arrangements include the opportunity to secure tenant improvement allowances to partially offset the costof developing and opening the related restaurants. Generally, landlords recover the cost of such allowances fromincreased minimum rents. However, there can be no assurance that such allowances will be available to us oneach project. From time to time, we may also decide to purchase the underlying land for a new restaurant if thatis the only way to secure a highly desirable site. Currently, we own the underlying land for five of our operatingrestaurants. It is not our current strategy to own a large number of land parcels that underlie our restaurants.Therefore, in many cases we subsequently enter into sale-leaseback arrangements for land parcels that we maypurchase. We disburse cash for certain site-related work, buildings, leasehold improvements, furnishings, fixturesand equipment to build our leased and owned premises. We own substantially all of the equipment, furniture andtrade fixtures in our restaurants and currently plan to do so in the future.
Our cash flows from operating activities, as detailed in the Consolidated Statements of Cash Flows, provided$100.0 million during fiscal 2014, representing a $4.5 million increase from the $95.5 million provided by duringfiscal 2013. The increase in cash from operating activities for fiscal 2014, in comparison to fiscal 2013, isprimarily due to the timing of accrued expenses and deferred income taxes and greater depreciation expense as aresult of more restaurants in operation coupled with higher net income, offset by the timing of accountsreceivable accounts payable and deferred lease incentives.
For fiscal 2014, total capital expenditures were approximately $88.1 million, of which expenditures for thepurchase of the underlying land for new restaurants as well as the acquisition of restaurant and breweryequipment and leasehold improvements to construct new restaurants were $74.3 million. These expenditureswere primarily related to the construction of our 11 new restaurants that opened during fiscal 2014, as well asexpenditures related to restaurants expected to open in the first quarter of fiscal 2015. In addition, total capitalexpenditures related to the maintenance and key productivity initiatives of existing restaurants and expendituresfor restaurant and corporate systems were $13.1 million and $0.7 million, respectively.
We have a $150 million unsecured revolving line of credit that expires on September 3, 2019, and may be usedfor working capital and other general corporate purposes. We utilize the Credit Facility principally for letters ofcredit that are required to support certain of our self-insurance programs, to fund a portion of the Company’sannounced stock repurchase program and for working capital and construction requirements as needed.Borrowings under the Credit Facility will bear interest at the Company’s choice of either LIBOR plus apercentage not to exceed 1.75%, or at a rate ranging from Bank of America’s publicly announced prime rate to0.75% above Bank of America’s prime rate, based on our level of lease and debt obligations as compared toEBITDA and lease expenses. As of December 30, 2014, there were borrowings of $58.0 million outstandingunder the Credit Facility and there were outstanding letters of credit totaling approximately $15.2 million. The
54

Credit Facility agreement also contains affirmative and negative covenants which restrict our ability to, amongother things, create liens, borrow money (other trade credit and other ordinary course liabilities) and engage inmergers, consolidations, significant asset sales and certain other transactions. In addition, the Credit Facilitycontains provisions requiring us to maintain compliance with certain covenants, including a Fixed ChargeCoverage Ratio and a Lease Adjusted Leverage Ratio which, if not met, would place additional customaryrestrictions on the Company, including the ability to redeem or repurchase stock or pay dividends. While we havethe Credit Facility in place and it can be currently drawn upon, it is possible that creditors could place limitationsor restrictions on our ability to borrow from the Credit Facility.
Our capital expenditures during fiscal 2015 will continue to be significant as we currently plan to open at least15 new restaurants and two 10,000 barrel brewpub locations. Our brewpub locations will be in the state of Texas,per our settlement with the Texas Alcoholic Beverage Commission in January 2014, in addition to our necessaryrestaurant-level maintenance and key initiative-related capital expenditures. As of February 26, 2015, we haveentered into 13 signed leases or land purchase agreements for new restaurant locations that we have alreadyopened or expect to open in fiscal 2015. We currently anticipate our total capital expenditures for fiscal 2015,including all expenditure categories, to be approximately $100 million. We expect to fund our anticipated capitalexpenditures for fiscal 2015 with current cash balances on hand, expected cash flows from operations, proceedsfrom sale-leaseback transactions, expected tenant improvement allowances and our line of credit. Our future cashrequirements will depend on many factors, including the pace of our expansion, conditions in the retail propertydevelopment market, construction costs, the nature of the specific sites selected for new restaurants, and thenature of the specific leases and associated tenant improvement allowances available, if any, as negotiated withlandlords.
From time to time, we will evaluate opportunities to acquire and convert other restaurant locations or entirerestaurant chains to the BJ’s restaurant concept. In the future we may consider joint venture arrangements toaugment BJ’s expansion into new markets or we may evaluate non-controlling investments in other emergingrestaurant concepts that offer complementary growth opportunities to our BJ’s restaurant operations. Currently,we have no binding commitments (other than the signed leases or land purchase agreements set forth in Item 1 —Business — “Restaurant Site Selection and Expansion Objectives” in this Form 10-K) or agreements to acquireor convert any other restaurant locations or chains to our concept, or to enter into any joint ventures or non-controlling investments. However, we would likely require additional capital resources to take advantage of anyof these growth opportunities should they become feasible.
In January 2014, our subsidiary Chicago Pizza Hospitality Holding, Inc. entered into a Settlement Agreement andWaiver with the Texas Alcoholic Beverage Commission. Under the terms of the Settlement Agreement andWaiver, we agreed to terminate the use of independent third party brewers to supply proprietary craft beer for ourTexas restaurants and to transition the production and supply of all of our proprietary craft beer for our Texasrestaurants through licensed brewpubs to be built, owned and operated by us on or before June 30, 2015. Weexpect that the supply of proprietary craft beer in Texas will be met through the construction and operation oftwo licensed brewpubs with adjoining taprooms. We do not believe the cost to construct or operate thesebrewpubs will have any material impact on our liquidity or operating margins.
We significantly depend on our expected cash flows from operations, coupled with agreed-upon landlord tenantimprovement allowances and sale-leaseback proceeds, to fund the majority of our planned capital expendituresfor 2015. If our business does not generate enough cash flows from operations as expected, or if our landlords areunable to honor their agreements with us, or we are unable to successfully enter in a sale-leaseback transactionand replacement funding sources are not otherwise available to us from borrowings under our Credit Facility orother alternatives, we may not be able to expand our operations at the pace currently planned.
The continued operation and expansion of our business will require substantial funding. Accordingly, we havenot paid any dividends since our inception and have currently not allocated any funds for the payment ofdividends. We have no plans to pay any cash dividends in the foreseeable future. Any determination to paydividends in the future will be at the discretion of our Board of Directors and will depend upon our financial
55
condition, operating results and other factors our Board of Directors deem relevant. Our Credit Facility contains,and debt instruments that we enter into in the future may contain, covenants that place limitations on the amountof dividends we may pay.
In April 2014, our Board of Directors authorized a $50 million share repurchase plan, which was subsequentlyincreased to $150 million in August 2014. Approximately $100 million of this amount was repurchased duringfiscal 2014. The share repurchases were completed through open market purchases and future share repurchasesmay be completed through the combination of individually negotiated transactions, accelerated share buyback,and/or open market purchases. As of December 30, 2014, we have approximately $50 million available under ourcurrent share repurchase plan. Our Credit Facility does not contain any restrictions on the amount of borrowingsthat can be used to make stock repurchases as long as we are in compliance with our financial and non-financialcovenants.
OFF-BALANCE SHEET ARRANGEMENTS
We do not participate in transactions that generate relationships with unconsolidated entities or financialpartnerships, such as entities often referred to as structured finance or variable interest entities (“VIEs”), whichwould have been established for the purpose of facilitating off-balance sheet arrangements or other contractuallynarrow limited purposes. As of December 30, 2014, we are not involved in any off-balance sheet arrangements.
IMPACT OF INFLATION
Our profitability is dependent, among other things, on our ability to anticipate and react to changes in the costs ofkey operating resources, including food and other raw materials, labor, energy and other supplies andservices. Substantial increases in costs and expenses could impact our operating results to the extent that suchincreases cannot be passed along to our restaurant customers. While we have taken steps to enter into agreementsfor some of the commodities used in our restaurant operations, there can be no assurance that future supplies andcosts for such commodities will not fluctuate due to weather and other market conditions outside of ourcontrol. We are currently unable to contract for certain commodities, such as fluid dairy, fresh seafood and mostfresh produce items, for long periods of time. Consequently, such commodities can be subject to unforeseensupply and cost fluctuations. The impact of inflation on food, labor, energy and occupancy costs can significantlyaffect the profitability of our restaurant operations.
Many of our restaurant employees are paid hourly rates related to the federal, state or local minimumwage. Numerous state and local governments have their own minimum wage requirements that are generallygreater than the federal minimum wage and are subject to annual increases based on changes in their localconsumer price indices. Additionally, a general shortage in the availability of qualified restaurant managementand hourly workers in certain geographical areas in which we operate has caused related increases in the costs ofrecruiting and compensating such employees. Certain operating and other costs, such as health benefits, theanticipated impact from the Patient Protection and Affordable Care Act, taxes, insurance and other outsideservices, continue to increase with the general level of inflation and may also be subject to other cost and supplyfluctuations outside of our control.
While we have been able to partially offset inflation and other changes in the costs of key operating resources bygradually increasing prices of our menu items, coupled with more efficient purchasing practices, productivityimprovements and greater economies of scale, there can be no assurance that we will be able to continue to do so inthe future. From time to time, competitive conditions will limit our menu pricing flexibility. In addition,macroeconomic conditions that impact consumer discretionary spending for food away from home could makeadditional menu price increases imprudent. There can be no assurance that all of our future cost increases can beoffset by higher menu prices or that higher menu prices will be accepted by our restaurant customers without anyresulting changes in their visit frequencies or purchasing patterns. Many of the leases for our restaurants provide forcontingent rent obligations based on a percentage of sales. As a result, rent expense will absorb a proportionateshare of any menu price increases in our restaurants. There can be no assurance that we will continue to generateincreases in comparable restaurant sales in amounts sufficient to offset inflationary or other cost pressures.
56

SEASONALITY AND ADVERSE WEATHER
Our business is subject to seasonal fluctuations. Additionally, our restaurants in the Midwest and Eastern states,including Florida, are impacted by weather and other seasonal factors that typically impact other restaurantoperations in those regions. Holidays (and shifts in the holiday calendar), severe winter weather, hurricanes,tornados, thunderstorms and similar conditions may impact restaurant sales volumes seasonally in some of themarkets where we operate. Many of our restaurants are located in or near shopping centers and malls thattypically experience seasonal fluctuations in sales. Quarterly results have been and will continue to besignificantly impacted by the timing of new restaurant openings and their associated restaurant opening expenses.As a result of these and other factors, our financial results for any given quarter may not be indicative of theresults that may be achieved for a full fiscal year.
CRITICAL ACCOUNTING POLICIES
Critical accounting policies require the greatest amount of subjective or complex judgments by management andare important to portraying our financial condition and results of operations. Judgments or uncertaintiesregarding the application of these policies may result in materially different amounts being reported underdifferent conditions or using different assumptions. We consider the following policies to be the most critical inunderstanding the judgments that are involved in preparing our consolidated financial statements.
Fair Value of Marketable Securities and Cash Equivalents
We measure the fair value of our marketable securities using quoted market prices in active markets. All of ourmarketable securities were classified as held-to-maturity and included as short-term and long-term marketablesecurities in the Consolidated Balance Sheets. Held-to-maturity securities were reported at amortized cost, whichapproximated fair value, with related gains and losses reflected in earnings once realized, and available-for-salesecurities were reported at their fair value, with unrealized gains and losses excluded from net income andreported as a separate component of shareholders’ equity (net of related tax effect) until realized. We believe thatthe fair value of our marketable securities equaled the quoted market price of our marketable securities atDecember 31, 2013. We also believe the carrying value of cash equivalents approximated fair value due to theshort-term nature of those instruments.
Property and Equipment
We record all property and equipment at cost. Property and equipment accounting requires estimates of theuseful lives for the assets for depreciation purposes and selection of depreciation methods. We believe the usefullives reflect the actual economic life of the underlying assets. We have elected to use the straight-line method ofdepreciation over the estimated useful life of an asset or the primary lease term of the respective lease, whicheveris shorter. Renewals and betterments that materially extend the useful life of an asset are capitalized whilemaintenance and repair costs are charged to operations as incurred. Judgment is often required in the decision todistinguish between an asset which qualifies for capitalization versus an expenditure which is for maintenanceand repairs. When property and equipment are sold or otherwise disposed of, the asset account and relatedaccumulated depreciation and amortization accounts are relieved, and any gain or loss is included in earnings.Additionally, any interest capitalized for new restaurant construction would be included in “Property andequipment, net” on the Consolidated Balance Sheets.
Impairment of Long-Lived Assets
We assess potential impairments of our long-lived assets whenever events or changes in circumstances indicatethat the carrying value of the assets may not be recoverable. The assets are generally reviewed for impairment intotal as well as on a restaurant by restaurant basis. Factors considered include, but are not limited to, significantunderperformance by the restaurant relative to expected historical or projected future operating results;significant changes in the manner of use of the acquired assets or the strategy for the overall business; andsignificant negative industry or economic trends. The recoverability is assessed in most cases by comparing the
57
carrying value of the asset to the undiscounted cash flows expected to be generated by the asset. This assessmentprocess requires the use of estimates and assumptions regarding future restaurant cash flows and estimated usefullives, which are subject to a significant degree of judgment. If these assumptions change in the future, we may berequired to record impairment charges for these assets or for the entire restaurant.
Self-Insurance Liability
We are self-insured for a portion of our general liability insurance and our employee workers’ compensationprograms. We maintain coverage with a third party insurer to limit our total exposure for these programs. Theaccrued liability associated with these programs is based on our estimate of the ultimate costs to settle knownclaims as well as claims incurred but not yet reported to us (“IBNR claims”) as of the balance sheet date. Ourestimated liability is based on information provided by our insurance broker and a third party actuary, combinedwith our judgments regarding a number of assumptions and factors, including the frequency and severity ofclaims, our claims development history, case jurisdiction, related legislation, and our claims settlement practice.Significant judgment is required to estimate IBNR claims as parties have yet to assert such claims. If actualclaims trends, including the severity or frequency of claims, differ from our estimates, our financial results couldbe significantly impacted.
Income Taxes
We provide for income taxes based on our estimate of federal and state tax liabilities. Our estimates include, butare not limited to, effective state and local income tax rates, allowable tax credits for items such as FICA taxespaid on reported tip income and estimates related to depreciation expense allowable for tax purposes. We usuallyfile our income tax returns several months after our fiscal year-end. We file our tax returns with the advice andcompilation of tax consultants. All tax returns are subject to audit by federal and state governments, usually yearsafter the returns are filed, and could be subject to differing interpretation of the tax laws.
We utilize the liability method of accounting for income taxes. Deferred income taxes are recognized based onthe tax consequences in future years of differences between the tax basis of assets and liabilities and theirfinancial reporting amounts at each year-end based on enacted tax laws and statutory tax rates applicable to theperiods in which differences are expected to affect taxable income. Valuation allowances are established, whennecessary, to reduce deferred tax assets to the amount expected to be realized. The provision for income taxesrepresents the tax payable for the period and the change during the period in deferred tax assets and liabilities.
We recognize the impact of a tax position in our financial statements if that position is more likely than not ofbeing sustained on audit, based on the technical merits of the position. Interest and penalties related to uncertaintax positions are included in income tax expense.
Leases
We lease the majority of our restaurant locations. We account for our leases in accordance with U.S. GAAP,which require that our leases be evaluated and classified as operating or capital leases for financial reportingpurposes. The term used for this evaluation includes renewal option periods only in instances in which theexercise of the renewal option can be reasonably assured and failure to exercise such option would result in aneconomic penalty. All of our restaurant leases are classified as operating leases. We disburse cash for leaseholdimprovements, furniture and fixtures and equipment to build out and equip our leased premises. Tenantimprovement allowance incentives may be available to partially offset the cost of developing and opening therelated restaurants, pursuant to agreed-upon terms in our leases. Tenant improvement allowances can take theform of cash payments upon the opening of the related restaurants, full or partial credits against minimum orpercentage rents otherwise payable by us or a combination thereof. All tenant improvement allowances receivedby us are recorded as a deferred lease incentive and amortized over the term of the lease. The related cashreceived from the landlord is reflected as “Landlord contribution for tenant improvements” within operatingactivities of our Consolidated Statements of Cash Flows.
58
The lease term used for straight-line rent expense is calculated from the date we obtain possession of the leasedpremises through the lease termination date. We expense rent from possession date through restaurant open dateas preopening expense. Once a restaurant opens for business, we record straight-line rent over the lease term pluscontingent rent to the extent it exceeded the minimum rent obligation per the lease agreement.
There is potential for variability in the rent holiday period, which begins on the possession date and ends on therestaurant open date, during which no cash rent payments are typically due under the terms of the lease. Factorsthat may affect the length of the rent holiday period generally relate to construction related delays. Extension ofthe rent holiday period due to delays in restaurant opening will result in greater preopening rent expenserecognized during the rent holiday period and lesser occupancy expense during the rest of the lease term (post-opening).
For leases that contain rent escalations in which the amount of future rent is certain or can be reasonablycalculated, we record the total rent payable during the lease term, as determined above, on the straight-line basisover the term of the lease (including the rent holiday period beginning upon our possession of the premises), andrecord the difference between the minimum rents paid and the straight-line rent as deferred rent. Certain leasescontain provisions that require additional rent payments based upon restaurant sales volume (“contingent rent”).Contingent rent is accrued each period as the liabilities are incurred, in addition to the straight-line rent expensenoted above. This results in some variability in occupancy expense as a percentage of revenues over the term ofthe lease in restaurants where we pay contingent rent.
Management makes judgments regarding the probable term for each restaurant property lease, which can impactthe classification and accounting for a lease as capital or operating, the rent holiday and/or escalations inpayments that are taken into consideration when calculating straight-line rent and the term over which leaseholdimprovements for each restaurant are amortized. These judgments may produce materially different amounts ofdepreciation, amortization and rent expense than would be reported if different assumed lease terms were used.
Stock-Based Compensation
Under shareholder approved stock-based compensation plans, we have granted incentive stock options, non-qualified stock options, and restricted stock units that generally vest over three to five years and expire ten yearsfrom the date of grant. Stock-based compensation is measured in accordance with U.S. GAAP based on theunderlying fair value of the awards granted. In valuing stock options, we are required to make certainassumptions and judgments regarding the grant date fair value utilizing the Black-Scholes option-pricingmodel. These judgments include expected volatility, risk free interest rate, expected option life, dividend yieldand vesting percentage. These estimations and judgments are determined by us using many different variablesthat, in many cases, are outside of our control. The changes in these variables or trends, including stock pricevolatility and risk free interest rate, may significantly impact the grant date fair value resulting in a significantimpact to our financial results. The cash flow tax benefits resulting from tax deductions in excess of thecompensation cost recognized for those options (excess tax benefits) are required to be classified as financingcash flows.
59
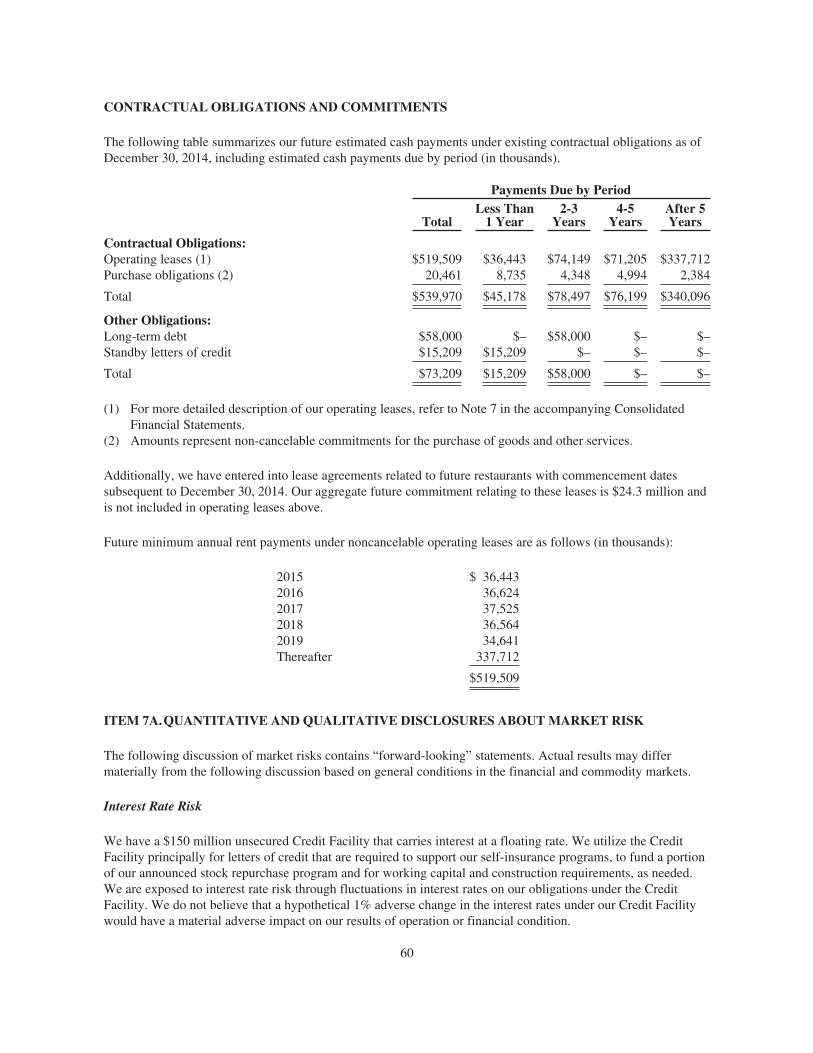
CONTRACTUAL OBLIGATIONS AND COMMITMENTS
The following table summarizes our future estimated cash payments under existing contractual obligations as ofDecember 30, 2014, including estimated cash payments due by period (in thousands).
Payments Due by Period
TotalLess Than
1 Year2-3
Years4-5
YearsAfter 5Years
Contractual Obligations:Operating leases (1) $519,509 $36,443 $74,149 $71,205 $337,712Purchase obligations (2) 20,461 8,735 4,348 4,994 2,384
Total $539,970 $45,178 $78,497 $76,199 $340,096
Other Obligations:Long-term debt $58,000 $– $58,000 $– $–Standby letters of credit $15,209 $15,209 $– $– $–
Total $73,209 $15,209 $58,000 $– $–
(1) For more detailed description of our operating leases, refer to Note 7 in the accompanying ConsolidatedFinancial Statements.
(2) Amounts represent non-cancelable commitments for the purchase of goods and other services.
Additionally, we have entered into lease agreements related to future restaurants with commencement datessubsequent to December 30, 2014. Our aggregate future commitment relating to these leases is $24.3 million andis not included in operating leases above.
Future minimum annual rent payments under noncancelable operating leases are as follows (in thousands):
2015 $ 36,4432016 36,6242017 37,5252018 36,5642019 34,641Thereafter 337,712
$519,509
ITEM 7A.QUANTITATIVE AND QUALITATIVE DISCLOSURES ABOUT MARKET RISK
The following discussion of market risks contains “forward-looking” statements. Actual results may differmaterially from the following discussion based on general conditions in the financial and commodity markets.
Interest Rate Risk
We have a $150 million unsecured Credit Facility that carries interest at a floating rate. We utilize the CreditFacility principally for letters of credit that are required to support our self-insurance programs, to fund a portionof our announced stock repurchase program and for working capital and construction requirements, as needed.We are exposed to interest rate risk through fluctuations in interest rates on our obligations under the CreditFacility. We do not believe that a hypothetical 1% adverse change in the interest rates under our Credit Facilitywould have a material adverse impact on our results of operation or financial condition.
60

Food and Commodity Price Risks
We purchase food and other commodities for use in our operations based upon market prices established with oursuppliers. Many of the commodities purchased by us can be subject to volatility due to market supply anddemand factors outside of our control, whether contracted for or not. To manage this risk in part, we attempt toenter into fixed-price purchase commitments, with terms typically up to one year, for some of our commodityrequirements. However, it may not be possible for us to enter into fixed-price contracts for certain commoditiesor we may choose not to enter into fixed-price contracts for certain commodities. Dairy costs can also fluctuatedue to government regulation. We believe that substantially all of our food and supplies are available fromseveral sources, which helps to diversify our overall commodity cost risk. We also believe that we have someflexibility and ability to increase certain menu prices, or vary certain menu items offered, in response to foodcommodity price increases. Some of our commodity purchase arrangements may contain contractual features thatlimit the price paid by establishing certain price floors or caps. We do not use financial instruments to hedgecommodity prices, since our purchase arrangements with suppliers, to the extent that we can enter into sucharrangements, help control the ultimate cost that we pay.
61
ITEM 8. FINANCIAL STATEMENTS AND SUPPLEMENTARY DATA
See the Consolidated Financial Statements and other data attached hereto beginning on page F-1 of this AnnualReport on Form 10-K.
ITEM 9. CHANGES IN AND DISAGREEMENTS WITH ACCOUNTANTS ON ACCOUNTING ANDFINANCIAL DISCLOSURE
None.
ITEM 9A.CONTROLS AND PROCEDURES
Evaluation of Disclosure Controls and Procedures
Under the supervision and with the participation of our management, including the Chief Executive Officer andChief Financial Officer, we have evaluated the effectiveness of our disclosure controls and procedures pursuantto Rules 13a-15 and 15d-15 promulgated under the Securities Exchange Act of 1934 as amended, as of the end ofthe period covered by this report. Based on this evaluation, our Chief Executive Officer and Chief FinancialOfficer concluded that, as of December 30, 2014, our disclosure controls and procedures are designed at areasonable assurance level and are effective to provide reasonable assurance that information we are required todisclose in reports that we file or submit under the Exchange Act is recorded, processed, summarized, andreported within the time periods specified in the SEC’s rules and forms, and that such information is accumulatedand communicated to our management, including our Chief Executive Officer and Chief Financial Officer, asappropriate, to allow timely decisions regarding required disclosure.
Changes in Internal Control Over Financial Reporting
There has not been any change in our internal control over financial reporting (as such term is defined inRules 13a-15(f) and 15d-15(f) under the Exchange Act) during our fourth fiscal quarter that has materiallyaffected, or is reasonably likely to materially affect, our internal control over financial reporting.
Management’s Report on Internal Control Over Financial Reporting
Our management is responsible for establishing and maintaining adequate internal control over financialreporting, as such term is defined in Exchange Act Rules 13a-15(f) and 15d-15(f). Under the supervision andwith the participation of our management, including our Chief Executive Officer and Chief Financial Officer, weconducted an evaluation of the effectiveness of our internal control over financial reporting as of December 30,2014, based on the framework in Internal Control — Integrated Framework issued by the Committee ofSponsoring Organizations of the Treadway Commission (1992 framework) (“COSO”). Based on that evaluation,our management concluded that our internal control over financial reporting was effective as of December 30,2014.
Ernst & Young LLP, the independent registered public accounting firm that audited the financial statementsincluded in this Annual Report on Form 10-K, has issued an attestation report on our internal control overfinancial reporting.
62

Report of Independent Registered Public Accounting Firm
The Board of Directors and Shareholders of BJ’s Restaurants, Inc.
We have audited BJ’s Restaurants, Inc.’s internal control over financial reporting as of December 30, 2014,based on criteria established in Internal Control—Integrated Framework issued by the Committee of SponsoringOrganizations of the Treadway Commission (1992 framework) (the COSO criteria). BJ’s Restaurants, Inc.’smanagement is responsible for maintaining effective internal control over financial reporting, and for itsassessment of the effectiveness of internal control over financial reporting included in the accompanyingManagement’s Report on Internal Control over Financial Reporting. Our responsibility is to express an opinionon the Company’s internal control over financial reporting based on our audit.
We conducted our audit in accordance with the standards of the Public Company Accounting Oversight Board(United States). Those standards require that we plan and perform the audit to obtain reasonable assurance aboutwhether effective internal control over financial reporting was maintained in all material respects. Our auditincluded obtaining an understanding of internal control over financial reporting, assessing the risk that a materialweakness exists, testing and evaluating the design and operating effectiveness of internal control based on theassessed risk, and performing such other procedures as we considered necessary in the circumstances. We believethat our audit provides a reasonable basis for our opinion.
A company’s internal control over financial reporting is a process designed to provide reasonable assuranceregarding the reliability of financial reporting and the preparation of financial statements for external purposes inaccordance with generally accepted accounting principles. A company’s internal control over financial reportingincludes those policies and procedures that (1) pertain to the maintenance of records that, in reasonable detail,accurately and fairly reflect the transactions and dispositions of the assets of the company; (2) provide reasonableassurance that transactions are recorded as necessary to permit preparation of financial statements in accordancewith generally accepted accounting principles, and that receipts and expenditures of the company are being madeonly in accordance with authorizations of management and directors of the company; and (3) provide reasonableassurance regarding prevention or timely detection of unauthorized acquisition, use, or disposition of thecompany’s assets that could have a material effect on the financial statements.
Because of its inherent limitations, internal control over financial reporting may not prevent or detectmisstatements. Also, projections of any evaluation of effectiveness to future periods are subject to the risk thatcontrols may become inadequate because of changes in conditions, or that the degree of compliance with thepolicies or procedures may deteriorate.
In our opinion, BJ’s Restaurants, Inc. maintained, in all material respects, effective internal control over financialreporting as of December 30, 2014, based on the COSO criteria.
We also have audited, in accordance with the standards of the Public Company Accounting Oversight Board(United States), the consolidated balance sheets of BJ’s Restaurants, Inc. as of December 30, 2014 andDecember 31, 2013, and the related consolidated statements of income, shareholders’ equity, and cash flows foreach of the three years in the period ended December 30, 2014, and our report dated February 26, 2015 expressedan unqualified opinion thereon.
/s/ Ernst & Young LLP
Irvine, CaliforniaFebruary 26, 2015
63

Inherent Limitations on Effectiveness of Controls
Our management, including the Chief Executive Officer and Chief Financial Officer, does not expect that ourdisclosure controls or our internal control over financial reporting will prevent or detect all errors and all fraud. Acontrol system, no matter how well designed and operated, can provide only reasonable, not absolute, assurancethat the control system’s objectives will be met. The design of a control system must reflect the fact that there areresource constraints, and the benefits of controls must be considered relative to their costs. Further, because ofthe inherent limitations in all control systems, no evaluation of controls can provide absolute assurance thatmisstatements due to error or fraud will not occur or that all control issues and instances of fraud, if any, withinthe Company have been detected. These inherent limitations include the realities that judgments in decision-making can be faulty and that breakdowns can occur because of simple error or mistake. Controls can also becircumvented by the individual acts of some persons, by collusion of two or more people, or by managementoverride of the controls. The design of any system of controls is based in part on certain assumptions about thelikelihood of future events, and there can be no assurance that any design will succeed in achieving its statedgoals under all potential future conditions. Projections of any evaluation of control effectiveness to future periodsare subject to risks. Over time, controls may become inadequate because of changes in conditions or deteriorationin the degree of compliance with policies or procedures.
ITEM 9B. OTHER INFORMATION
None.
64
PART III
ITEM 10. DIRECTORS, EXECUTIVE OFFICERS AND CORPORATE GOVERNANCE
We have adopted a Code of Business Ethics and a Code of Business Conduct to promote honest and ethicalconduct of our business, professional and personal relationships. The Code of Business Ethics covers allexecutives, including our principal executive officer and principal financial and accounting officer. The Code ofBusiness Conduct is applicable to all directors, executives and other employees. A copy of our Code of Integrity,Ethics and Conduct is available on our website http://investors.bjsrestaurants.com under Corporate Governance.We intend to post any amendments to or waivers from our Code of Business Ethics and Code of BusinessConduct at this website location.
Information with respect to our executive officers is included in Part I, Item 1 of this Annual Report onForm 10-K. Other information required by this Item is hereby incorporated by reference to the informationcontained in the Proxy Statement relating to the Annual Meeting of Shareholders, which we expect to be filedwith the Securities and Exchange Commission no later than 120 days after the close of the year endedDecember 30, 2014.
ITEM 11. EXECUTIVE COMPENSATION
The information required by this Item is incorporated herein by reference to the information contained in theProxy Statement relating to the Annual Meeting of Shareholders, which we expect to file with the Securities andExchange Commission no later than 120 days after the close of the year ended December 30, 2014.
ITEM 12. SECURITY OWNERSHIP OF CERTAIN BENEFICIAL OWNERS AND MANAGEMENTAND RELATED SHAREHOLDER MATTERS
The information required by this Item is incorporated herein by reference to the information contained in theProxy Statement relating to the Annual Meeting of Shareholders, which we expect to file with the Securities andExchange Commission no later than 120 days after the close of the year ended December 30, 2014.
ITEM 13. CERTAIN RELATIONSHIPS AND RELATED TRANSACTIONS AND DIRECTORINDEPENDENCE
The information required by this Item is incorporated herein by reference to the information contained in theProxy Statement relating to the Annual Meeting of Shareholders, which we expect to file with the Securities andExchange Commission no later than 120 days after the close of the year ended December 30, 2014.
See Part II, Item 5 — “Market for Registrant’s Common Equity, Related Shareholder Matters, and IssuerPurchases of Equity Securities — Stock-Based Compensation Plan Information” for certain informationregarding our equity compensation plans.
ITEM 14. PRINCIPAL ACCOUNTING FEES AND SERVICES
The information required by this Item is incorporated herein by reference to the information contained in theProxy Statement relating to the Annual Meeting of Shareholders, which we expect to file with the Securities andExchange Commission no later than 120 days after the close of the year ended December 30, 2014.
65

PART IV
ITEM 15. EXHIBITS AND FINANCIAL STATEMENT SCHEDULES
(a) (1) CONSOLIDATED FINANCIAL STATEMENTS
The following documents are contained in Part II, Item 8 of this Annual Report on Form 10-K:
Report of Independent Registered Public Accounting Firm
Consolidated Balance Sheets at December 30, 2014 and December 31, 2013
Consolidated Statements of Income for Each of the Three Fiscal Years in the Period EndedDecember 30, 2014
Consolidated Statements of Shareholders’ Equity for Each of the Three Fiscal Years in the PeriodEnded December 30, 2014
Consolidated Statements of Cash Flows for Each of the Three Fiscal Years in the Period EndedDecember 30, 2014
Notes to the Consolidated Financial Statements
(2) FINANCIAL STATEMENT SCHEDULES
All schedules are omitted because they are not applicable or the required information is shown in theConsolidated Financial Statements or notes thereto.
(3) EXHIBITS
ExhibitNumber Description
3.1 Amended and Restated Articles of Incorporation of the Company, as amended, incorporated byreference to Exhibit 3.1 to the Registration Statement on Form SB-2 filed with the Securities andExchange Commission on June 28, 1996, as amended by the Company’s Registration Statement onForm SB-2/A filed with the Commission on August 1, 1996 and the Company’s RegistrationStatement on Form SB-2A filed with the Commission on August 22, 1996 (File No. 3335182-LA)(as amended, the “Registration Statement”).
3.2 Amended and Restated Bylaws of the Company, incorporated by reference to Exhibits 3.1 to theForm 8-K filed on June 4, 2007.
3.3 Certificate of Amendment of Articles of Incorporation incorporated by reference to Exhibit 3.3 ofthe 2004 Annual Report.
3.4 Certificate of Amendment of Articles of Incorporation, dated June 8, 2010, incorporated byreference to Exhibit 3.4 of the Form 10-K for the year ended December 28, 2010.
4.1 Specimen Common Stock Certificate of the Company, incorporated by reference to Exhibit 4.1 ofthe Registration Statement.
10.1* Form of Indemnification Agreement with Officers and Directors, incorporated by reference toExhibit 10.6 of the Registration Statement.
10.2* BJ’s Restaurants, Inc. Amended and Restated 1996 Stock Option Plan, incorporated by reference toExhibit 10.4 of the 2004 Annual Report.
10.3* BJ’s Restaurants, Inc. 2005 Equity Incentive Plan, as amended (incorporated by reference toExhibit 10.1 to Form 10-Q filed on August 6, 2012).
10.4* Form of Employee Stock Option Agreement for employees under the 2005 Equity Incentive Plan,incorporated by reference to Exhibit 10.1 to the Form 10-Q filed on October 31, 2006.
66

ExhibitNumber Description
10.5* Form of Notice of Grant of Stock Option for employees under the 2005 Equity Incentive Plan,incorporated by reference to Exhibit 10.4 of the Form 8-K filed July 1, 2005.
10.6* Form of Non-Employee Director Stock Option Agreement under the 2005 Equity Incentive Plan,incorporated by reference to Exhibit 10.8 of the Form 10-K for the year ended January 3, 2006.
10.7* Form of Non-Employee Director Notice of Grant of Stock Option under the 2005 Equity IncentivePlan, incorporated by reference to Exhibit 10.9 of the Form 10-K for the year ended January 3,2006.
10.8* Form of Restricted Stock Unit Agreement (non-GSSOP) for employees under the 2005 EquityIncentive Plan, incorporated by reference to Exhibit 10.1 to the Form 10-Q filed on November 6,2007.
10.9* Form of Restricted Stock Unit Notice (non-GSSOP) for employees under the 2005 Equity IncentivePlan, incorporated by reference to Exhibit 10.2 to the Form 10-Q filed on November 6, 2007.
10.10* Form of Restricted Stock Unit Agreement (2012 BJ’s GSSOP) for employees under the 2005Equity Incentive Plan, incorporated by reference to Exhibit 10.11 to the Form 10-K for the yearended January 1, 2013.
10.11* Form of Equity Award Certificate (2012 BJ’s GSSOP) for employees under the 2005 EquityIncentive Plan, incorporated by reference to Exhibit 10.12 to the Form 10-K for the year endedJanuary 1, 2013.
10.12* Form of Stock Option Agreement (2012 BJ’s GSSOP) for employees under the 2005 EquityIncentive Plan, incorporated by reference to Exhibit 10.12 to the Form 10-K for the year endedJanuary 1, 2013.
10.13* Form of Option Grant Notice (2012 BJ’s GSSOP) for employees under the 2005 Equity IncentivePlan, incorporated by reference to Exhibit 10.12 to the Form 10-K for the year ended January 1,2013.
10.14* Form of Restricted Stock Unit Agreement for non-employee directors under the 2005 EquityIncentive Plan, incorporated by reference to Exhibit 10.12 to the Form 10-K for the year endedJanuary 1, 2013.
10.15* Form of Restricted Stock Unit Award Certificate for non-employee directors under the 2005 EquityIncentive Plan, incorporated by reference to Exhibit 10.12 to the Form 10-K for the year endedJanuary 1, 2013.
10.16* Employment Agreement, dated June 12, 2003, between the Company and Gregory S. Lynds,employed as Chief Development Officer, incorporated by reference to Exhibit 10.26 of theForm 10-K filed on or about March 14, 2008.
10.17* Employment Agreement dated April 6, 2010, between the Company and Gerald W. Deitchle,incorporated by reference to Form 8-K filed on April 12, 2010.
10.18* Employment Agreement, dated September 6, 2005, between the Company and Gregory S. Levin,employed as Chief Financial Officer, incorporated by reference to Exhibit 10.1 of the Form 10-Qfiled on November 3, 2005.
10.19* Employment Agreement, dated August 10, 2005, between the Company and John D. Allegretto,employed as Chief Supply Chain Officer, incorporated by reference to Exhibit 10.2 of theForm 10-Q filed on November 3, 2005.
10.20* Employment Agreement, dated March 2, 2011, between the Company and Kendra D. Miller,employed as Senior Vice President and General Counsel., incorporated by reference toExhibit 10.17 of the Form 10-K filed on March 4, 2011.
10.21* Employment Agreement dated October 28, 2012, between the Company and Gregory A. Trojan,employed as President and Chief Executive Officer, incorporated by reference to Exhibit 10.1 toForm 8-K filed on October 29, 2012.
10.22* Employment Agreement dated January 28, 2013, between the Company and Brian S. Krakower,employed as Senior Vice President and Chief Information Officer, incorporated by reference toExhibit 10.1 to Form 10-Q filed on May 6, 2013.
67
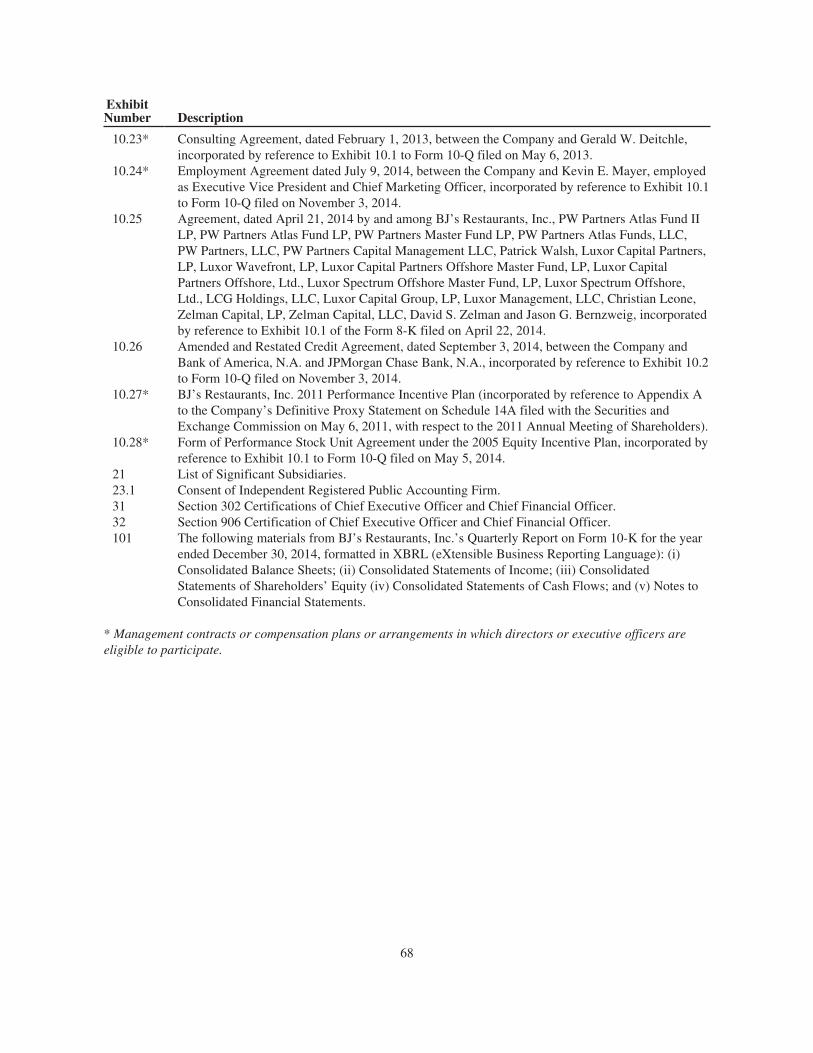
ExhibitNumber Description
10.23* Consulting Agreement, dated February 1, 2013, between the Company and Gerald W. Deitchle,incorporated by reference to Exhibit 10.1 to Form 10-Q filed on May 6, 2013.
10.24* Employment Agreement dated July 9, 2014, between the Company and Kevin E. Mayer, employedas Executive Vice President and Chief Marketing Officer, incorporated by reference to Exhibit 10.1to Form 10-Q filed on November 3, 2014.
10.25 Agreement, dated April 21, 2014 by and among BJ’s Restaurants, Inc., PW Partners Atlas Fund IILP, PW Partners Atlas Fund LP, PW Partners Master Fund LP, PW Partners Atlas Funds, LLC,PW Partners, LLC, PW Partners Capital Management LLC, Patrick Walsh, Luxor Capital Partners,LP, Luxor Wavefront, LP, Luxor Capital Partners Offshore Master Fund, LP, Luxor CapitalPartners Offshore, Ltd., Luxor Spectrum Offshore Master Fund, LP, Luxor Spectrum Offshore,Ltd., LCG Holdings, LLC, Luxor Capital Group, LP, Luxor Management, LLC, Christian Leone,Zelman Capital, LP, Zelman Capital, LLC, David S. Zelman and Jason G. Bernzweig, incorporatedby reference to Exhibit 10.1 of the Form 8-K filed on April 22, 2014.
10.26 Amended and Restated Credit Agreement, dated September 3, 2014, between the Company andBank of America, N.A. and JPMorgan Chase Bank, N.A., incorporated by reference to Exhibit 10.2to Form 10-Q filed on November 3, 2014.
10.27* BJ’s Restaurants, Inc. 2011 Performance Incentive Plan (incorporated by reference to Appendix Ato the Company’s Definitive Proxy Statement on Schedule 14A filed with the Securities andExchange Commission on May 6, 2011, with respect to the 2011 Annual Meeting of Shareholders).
10.28* Form of Performance Stock Unit Agreement under the 2005 Equity Incentive Plan, incorporated byreference to Exhibit 10.1 to Form 10-Q filed on May 5, 2014.
21 List of Significant Subsidiaries.23.1 Consent of Independent Registered Public Accounting Firm.31 Section 302 Certifications of Chief Executive Officer and Chief Financial Officer.32 Section 906 Certification of Chief Executive Officer and Chief Financial Officer.101 The following materials from BJ’s Restaurants, Inc.’s Quarterly Report on Form 10-K for the year
ended December 30, 2014, formatted in XBRL (eXtensible Business Reporting Language): (i)Consolidated Balance Sheets; (ii) Consolidated Statements of Income; (iii) ConsolidatedStatements of Shareholders’ Equity (iv) Consolidated Statements of Cash Flows; and (v) Notes toConsolidated Financial Statements.
* Management contracts or compensation plans or arrangements in which directors or executive officers areeligible to participate.
68

SIGNATURES
Pursuant to the requirements of Section 13 or 15(d) of the Securities Exchange Act of 1934, the Registrant hasduly caused this report to be signed on our behalf by the undersigned, thereunto duly authorized.
BJ’S RESTAURANTS, INC.
By: /s/ Gregory A. Trojan
February 26, 2015 Gregory A. TrojanPresident, Chief Executive Officer and Director(Principal Executive Officer)
Pursuant to the requirements of the Securities and Exchange Act of 1934, this Report has been signed below bythe following persons on behalf of the Registrant and in the capacities and on the dates indicated.
Signature Capacity Date
By: /s/ GREGORY A. TROJAN President, Chief Executive Officer February 26, 2015
Gregory A. Trojan and Director (Principal ExecutiveOfficer)
By: /s/ GREGORY S. LEVIN Executive Vice President, Chief February 26, 2015
Gregory S. Levin Financial Officer and Secretary(Principal Financial andAccounting Officer)
By: /s/ PETER A. BASSI Lead Independent Director February 26, 2015
Peter A. Bassi
By: /s/ LARRY D. BOUTS Director February 26, 2015
Larry D. Bouts
By: /s/ JAMES A. DAL POZZO Director February 26, 2015
James A. Dal Pozzo
By: /s/ GERALD W. DEITCHLE Chairman of the Board and Director February 26, 2015
Gerald W. Deitchle
By: /s/ NOAH A. ELBOGEN Director February 26, 2015
Noah A. Elbogen
By: /s/ J. ROGER KING Director February 26, 2015
J. Roger King
By: /s/ MARK A. MCEACHEN Director February 26, 2015
Mark A. McEachen
By: /s/ WESLEY A. NICHOLS Director February 26, 2015
Wesley A. Nichols
By: /s/ LEA ANNE S. OTTINGER Director February 26, 2015
Lea Anne S. Ottinger
By: /s/ PATRICK D. WALSH Director February 26, 2015
Patrick D. Walsh
69
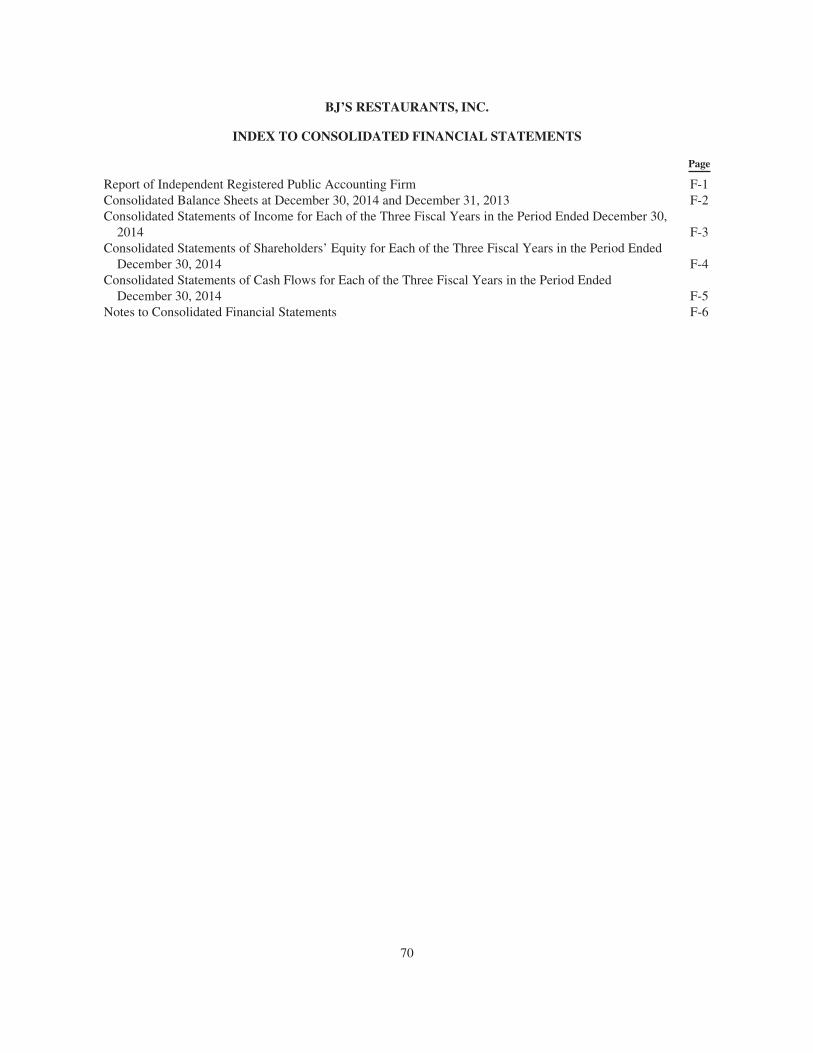
BJ’S RESTAURANTS, INC.
INDEX TO CONSOLIDATED FINANCIAL STATEMENTS
Page
Report of Independent Registered Public Accounting Firm F-1Consolidated Balance Sheets at December 30, 2014 and December 31, 2013 F-2Consolidated Statements of Income for Each of the Three Fiscal Years in the Period Ended December 30,
2014 F-3Consolidated Statements of Shareholders’ Equity for Each of the Three Fiscal Years in the Period Ended
December 30, 2014 F-4Consolidated Statements of Cash Flows for Each of the Three Fiscal Years in the Period Ended
December 30, 2014 F-5Notes to Consolidated Financial Statements F-6
70
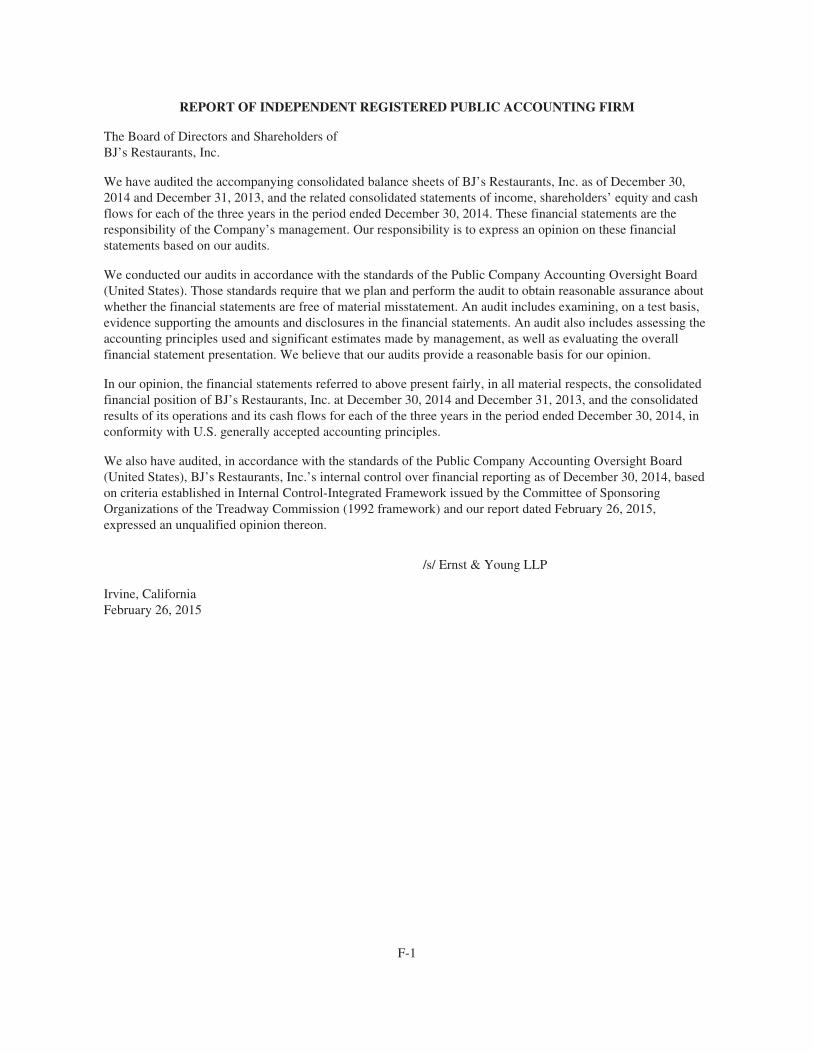
REPORT OF INDEPENDENT REGISTERED PUBLIC ACCOUNTING FIRM
The Board of Directors and Shareholders ofBJ’s Restaurants, Inc.
We have audited the accompanying consolidated balance sheets of BJ’s Restaurants, Inc. as of December 30,2014 and December 31, 2013, and the related consolidated statements of income, shareholders’ equity and cashflows for each of the three years in the period ended December 30, 2014. These financial statements are theresponsibility of the Company’s management. Our responsibility is to express an opinion on these financialstatements based on our audits.
We conducted our audits in accordance with the standards of the Public Company Accounting Oversight Board(United States). Those standards require that we plan and perform the audit to obtain reasonable assurance aboutwhether the financial statements are free of material misstatement. An audit includes examining, on a test basis,evidence supporting the amounts and disclosures in the financial statements. An audit also includes assessing theaccounting principles used and significant estimates made by management, as well as evaluating the overallfinancial statement presentation. We believe that our audits provide a reasonable basis for our opinion.
In our opinion, the financial statements referred to above present fairly, in all material respects, the consolidatedfinancial position of BJ’s Restaurants, Inc. at December 30, 2014 and December 31, 2013, and the consolidatedresults of its operations and its cash flows for each of the three years in the period ended December 30, 2014, inconformity with U.S. generally accepted accounting principles.
We also have audited, in accordance with the standards of the Public Company Accounting Oversight Board(United States), BJ’s Restaurants, Inc.’s internal control over financial reporting as of December 30, 2014, basedon criteria established in Internal Control-Integrated Framework issued by the Committee of SponsoringOrganizations of the Treadway Commission (1992 framework) and our report dated February 26, 2015,expressed an unqualified opinion thereon.
/s/ Ernst & Young LLP
Irvine, CaliforniaFebruary 26, 2015
F-1
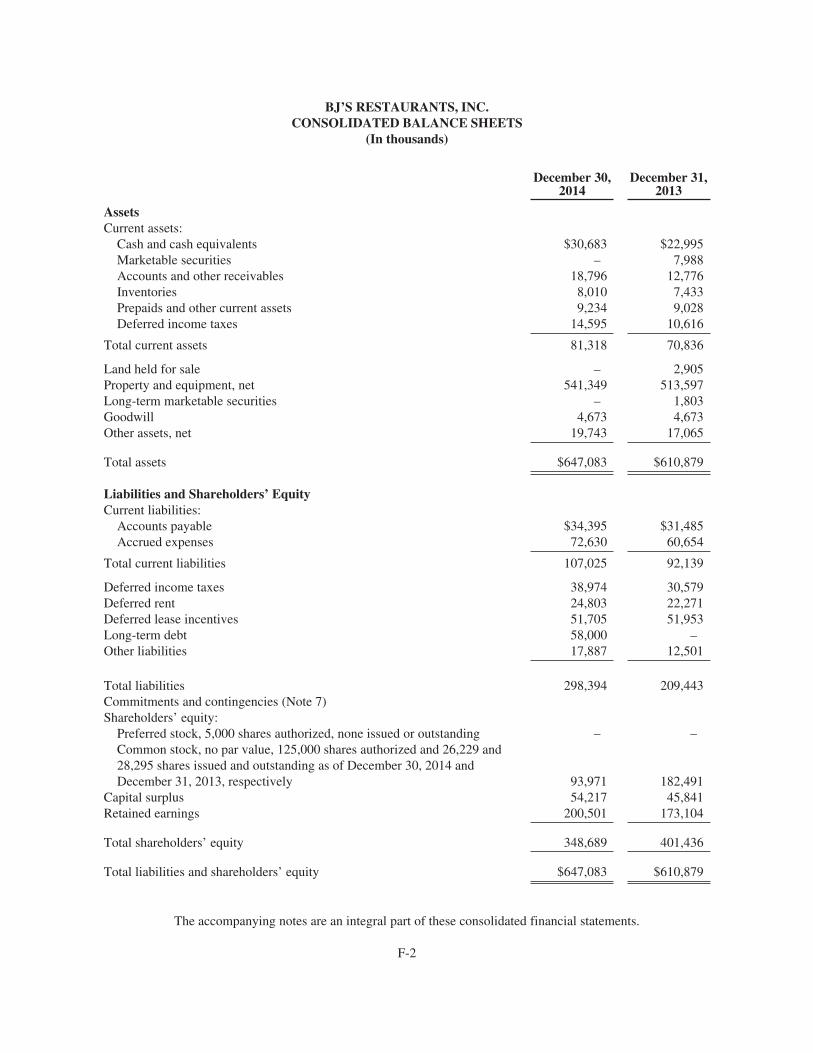
BJ’S RESTAURANTS, INC.CONSOLIDATED BALANCE SHEETS
(In thousands)
December 30,2014
December 31,2013
AssetsCurrent assets:
Cash and cash equivalents $30,683 $22,995Marketable securities – 7,988Accounts and other receivables 18,796 12,776Inventories 8,010 7,433Prepaids and other current assets 9,234 9,028Deferred income taxes 14,595 10,616
Total current assets 81,318 70,836
Land held for sale – 2,905Property and equipment, net 541,349 513,597Long-term marketable securities – 1,803Goodwill 4,673 4,673Other assets, net 19,743 17,065
Total assets $647,083 $610,879
Liabilities and Shareholders’ EquityCurrent liabilities:
Accounts payable $34,395 $31,485Accrued expenses 72,630 60,654
Total current liabilities 107,025 92,139
Deferred income taxes 38,974 30,579Deferred rent 24,803 22,271Deferred lease incentives 51,705 51,953Long-term debt 58,000 –Other liabilities 17,887 12,501
Total liabilities 298,394 209,443Commitments and contingencies (Note 7)Shareholders’ equity:
Preferred stock, 5,000 shares authorized, none issued or outstanding – –Common stock, no par value, 125,000 shares authorized and 26,229 and28,295 shares issued and outstanding as of December 30, 2014 andDecember 31, 2013, respectively 93,971 182,491
Capital surplus 54,217 45,841Retained earnings 200,501 173,104
Total shareholders’ equity 348,689 401,436
Total liabilities and shareholders’ equity $647,083 $610,879
The accompanying notes are an integral part of these consolidated financial statements.
F-2
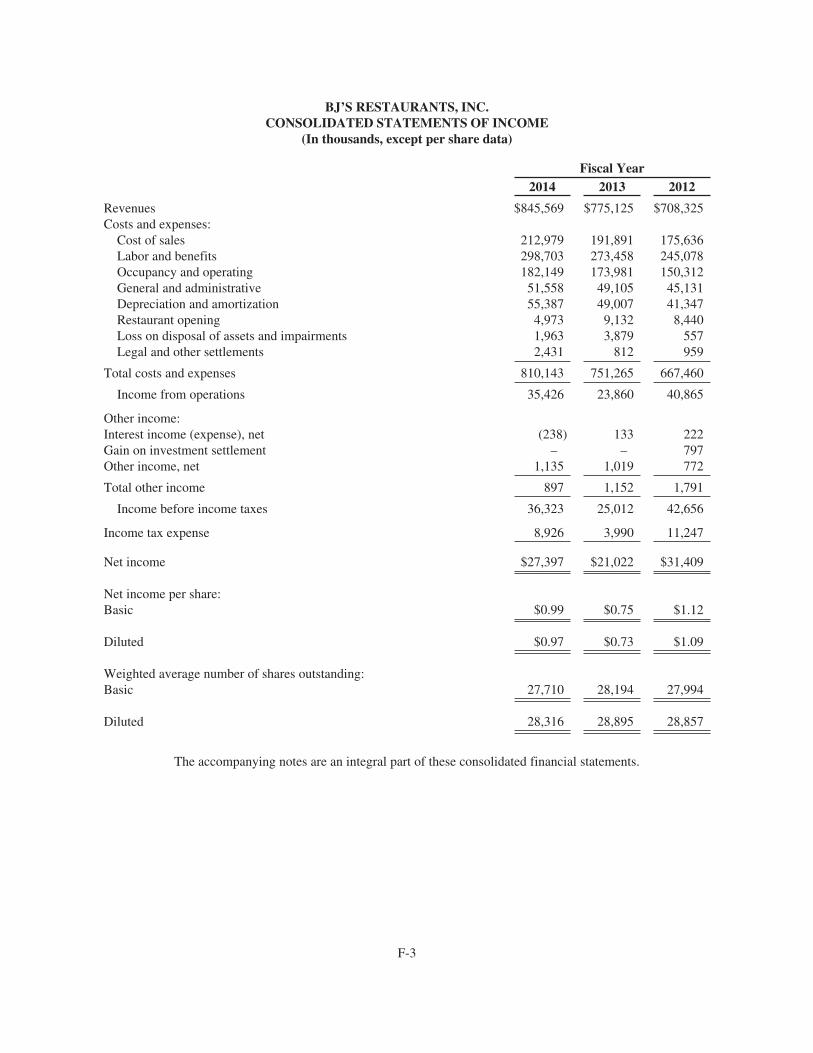
BJ’S RESTAURANTS, INC.CONSOLIDATED STATEMENTS OF INCOME
(In thousands, except per share data)
Fiscal Year2014 2013 2012
Revenues $845,569 $775,125 $708,325Costs and expenses:
Cost of sales 212,979 191,891 175,636Labor and benefits 298,703 273,458 245,078Occupancy and operating 182,149 173,981 150,312General and administrative 51,558 49,105 45,131Depreciation and amortization 55,387 49,007 41,347Restaurant opening 4,973 9,132 8,440Loss on disposal of assets and impairments 1,963 3,879 557Legal and other settlements 2,431 812 959
Total costs and expenses 810,143 751,265 667,460
Income from operations 35,426 23,860 40,865
Other income:Interest income (expense), net (238) 133 222Gain on investment settlement – – 797Other income, net 1,135 1,019 772
Total other income 897 1,152 1,791
Income before income taxes 36,323 25,012 42,656
Income tax expense 8,926 3,990 11,247
Net income $27,397 $21,022 $31,409
Net income per share:Basic $0.99 $0.75 $1.12
Diluted $0.97 $0.73 $1.09
Weighted average number of shares outstanding:Basic 27,710 28,194 27,994
Diluted 28,316 28,895 28,857
The accompanying notes are an integral part of these consolidated financial statements.
F-3
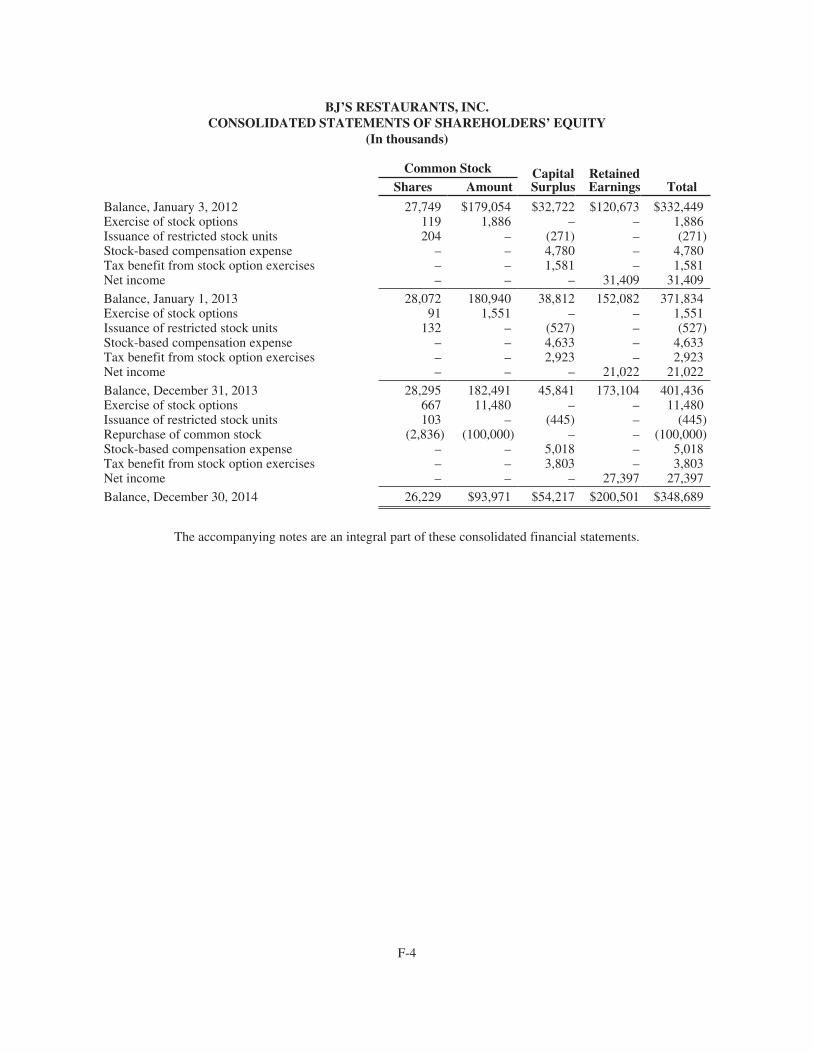
BJ’S RESTAURANTS, INC.CONSOLIDATED STATEMENTS OF SHAREHOLDERS’ EQUITY
(In thousands)
Common Stock CapitalSurplus
RetainedEarnings TotalShares Amount
Balance, January 3, 2012 27,749 $179,054 $32,722 $120,673 $332,449Exercise of stock options 119 1,886 – – 1,886Issuance of restricted stock units 204 – (271) – (271)Stock-based compensation expense – – 4,780 – 4,780Tax benefit from stock option exercises – – 1,581 – 1,581Net income – – – 31,409 31,409
Balance, January 1, 2013 28,072 180,940 38,812 152,082 371,834Exercise of stock options 91 1,551 – – 1,551Issuance of restricted stock units 132 – (527) – (527)Stock-based compensation expense – – 4,633 – 4,633Tax benefit from stock option exercises – – 2,923 – 2,923Net income – – – 21,022 21,022
Balance, December 31, 2013 28,295 182,491 45,841 173,104 401,436Exercise of stock options 667 11,480 – – 11,480Issuance of restricted stock units 103 – (445) – (445)Repurchase of common stock (2,836) (100,000) – – (100,000)Stock-based compensation expense – – 5,018 – 5,018Tax benefit from stock option exercises – – 3,803 – 3,803Net income – – – 27,397 27,397
Balance, December 30, 2014 26,229 $93,971 $54,217 $200,501 $348,689
The accompanying notes are an integral part of these consolidated financial statements.
F-4

BJ’S RESTAURANTS, INC.CONSOLIDATED STATEMENTS OF CASH FLOWS
(In thousands)Fiscal Year
2014 2013 2012
Cash flows from operating activities:Net income $ 27,397 $ 21,022 $ 31,409Adjustments to reconcile net income to net cash provided by operating
activities:Depreciation and amortization 55,387 49,007 41,347Deferred income taxes 4,416 (3,448) 6,764Stock-based compensation expense 4,855 4,418 4,585Loss on disposal of assets and impairments 1,963 3,879 557Gain on investment settlement – – (797)
Changes in assets and liabilities:Accounts and other receivables (5,393) 6,846 (8,032)Landlord contribution for tenant improvements (627) (611) 2,442Inventories (577) (1,372) (98)Prepaids and other current assets (1,662) (409) (717)Other assets, net (2,706) (2,800) (3,306)Accounts payable 842 7,571 (51)Accrued expenses 12,179 3,582 6,467Deferred rent 2,532 3,626 3,426Deferred lease incentives (248) 3,531 3,635Other liabilities 1,682 702 700
Net cash provided by operating activities 100,040 95,544 88,331Cash flows from investing activities:Purchases of property and equipment (88,124) (117,060) (109,182)Deposit received on land held for sale – 3,295 –Proceeds from sale of assets 13,143 7,823 3,740Proceeds from marketable securities sold 18,950 41,404 37,366Purchases of marketable securities (9,159) (25,345) (30,992)Collection of notes receivable – 28 224
Net cash used in investing activities (65,190) (89,855) (98,844)Cash flows from financing activities:Borrowings on line of credit 125,000 – –Payments on line of credit (67,000) – –Excess tax benefit from stock-based compensation 3,803 1,208 1,581Taxes paid on vested stock units under employee plans (445) (527) (271)Proceeds from exercise of stock options 11,480 1,551 1,886Repurchases of common stock (100,000) – –
Net cash (used in) provided by financing activities (27,162) 2,232 3,196
Net increase (decrease) in cash and cash equivalents 7,688 7,921 (7,317)
Cash and cash equivalents, beginning of year 22,995 15,074 22,391
Cash and cash equivalents, end of year $30,683 $22,995 $15,074
Supplemental disclosure of cash flow information:Cash paid for income taxes $4,936 $5,411 $2,563
Cash paid for interest, net of capitalized interest $175 $– $–
Supplemental disclosure of non-cash investing and financing activities:Fixed assets acquired by accounts payable $10,294 $8,226 $9,977
Stock-based compensation capitalized $213 $215 $195
The accompanying notes are an integral part of these consolidated financial statements.
F-5
BJ’S RESTAURANTS, INC.
NOTES TO CONSOLIDATED FINANCIAL STATEMENTS
1. The Company and Summary of Significant Accounting Policies
Description of Business
BJ’s Restaurants, Inc. (referred to herein as the “Company” or “BJ’s” or in the first person notations “we,” “us”and “our”) was incorporated in California on October 1, 1991, to assume the management of five “BJ’s ChicagoPizzeria” restaurants then in existence and to develop additional BJ’s restaurants. As of December 30, 2014, weowned and operated 156 restaurants located in 18 states. Each of our restaurants is currently operated as a BJ’sRestaurant & Brewery®, BJ’s Restaurant & Brewhouse®, BJ’s Pizza & Grill® or BJ’s Grill®. During fiscal 2014,we opened 11 new restaurants and closed an existing, smaller format “Pizza & Grill” restaurant in BelmontShore, California when its lease expired. Several of our BJ’s Restaurant & Brewery® locations brew oursignature, proprietary craft BJ’s beer on the restaurant premises. All of our other restaurants receive their BJ’sbeer either from one of our breweries and/or independent third party brewers using our proprietary recipes.
Basis of Presentation
The accompanying consolidated financial statements include the accounts of BJ’s Restaurants, Inc. and itswholly owned subsidiaries. All intercompany transactions and balances have been eliminated in consolidation.The financial statements presented herein include all material adjustments (consisting of normal recurringadjustments) which are, in the opinion of management, necessary for a fair statement of the financial condition,results of operations and cash flows for the period.
The preparation of financial statements in conformity with U.S. generally accepted accounting principles (“U.S.GAAP”) requires management to make estimates and assumptions for the reporting period and as of the financialstatement date. These estimates and assumptions affect the reported amounts of assets and liabilities, thedisclosure of contingent assets and liabilities, and the reported amounts of revenues and expenses. Actual resultscould differ from those estimates.
Our fiscal year consists of 52 or 53 weeks and ends on the Tuesday closest to December 31 for financialreporting purposes. Fiscal years 2014, 2013, and 2012 ended on December 30, 2014, December 31, 2013, andJanuary 1, 2013, respectively, and consisted of 52 weeks of operations.
Segment Disclosure
Financial Accounting Standards Board (“FASB”) Accounting Standards Codification (“ASC”) Topic No. 280,Segment Reporting, establishes standards for disclosures about products and services, geographic areas and majorcustomers. We currently operate in one operating segment: casual dining restaurants, several of which have on-premise brewing operations that produce BJ’s signature, proprietary craft beers for our restaurants. Additionally,we operate in one geographic area: the United States of America.
Recent Accounting Pronouncements
In May 2014, the FASB issued Accounting Standards Update (“ASU”) 2014-09, Revenue from Contracts withCustomers (Topic 606). This update provides a comprehensive new revenue recognition model that requires acompany to recognize revenue to depict the transfer of goods or services to a customer at an amount that reflectsthe consideration it expects to receive in exchange for those goods or services. Additionally, this guidanceexpands related disclosure requirements. ASU 2014-09 is effective for annual and interim reporting periodsbeginning after December 15, 2016, and early application is not permitted. This update permits the use of eitherthe retrospective or cumulative effect transition method. We are currently evaluating the impact this guidancewill have on our consolidated financial statements as well as the expected adoption method.
F-6

In August 2014, the FASB issued ASU 2014-15, Disclosure of Uncertainties about an Entity’s Going Concern(ASC Subtopic 205-40). This update requires management to evaluate whether there are conditions and eventsthat raise substantial doubt about an entity’s ability to continue as a going concern within one year after thefinancial statements are issued. Management is required to make this evaluation for both annual and interimreporting periods and must disclose whether its plans alleviate that doubt. ASU 2014-15 is effective for annualperiods ending after December 15, 2016, and for interim periods beginning after December 15, 2016, and earlyadoption is permitted. We do not believe the adoption of ASU 2014-15 will have a material impact on ourconsolidated financial statements.
Cash and Cash Equivalents
Cash and cash equivalents consist of highly liquid investments and money market funds with an original maturityof three months or less when purchased. Cash and cash equivalents are stated at cost, which approximates fairmarket value.
Concentration of Credit Risk
Financial instruments which potentially subject us to a concentration of credit risk principally consist of cash andcash equivalents. We currently maintain our day-to-day operating cash balances with a major financialinstitution. At times, our operating cash balances may be in excess of the FDIC insurance limit. At December 30,2014, we did not have investments in marketable securities. At December 31, 2013, we had approximately $9.8million of investments in marketable securities, of which $0.1 million were considered cash and cash equivalents,held by institutional brokers. We placed a majority of our temporary excess cash with major financial institutionsand institutional brokers that, in turn, invested in instruments with expected minimal volatility, such as moneymarket funds, U.S. Treasury and direct agency obligations, municipal and bank securities and investment-gradecorporate debt securities. Our investment policy limits the amount of exposure to any one institution orinvestment. We did not experience any losses in these accounts during fiscal 2014, 2013 or 2012, and believe wewere not exposed to significant risk on cash and cash equivalents.
Inventories
Inventories are comprised primarily of food and beverage products and are stated at the lower of cost (first-in,first-out) or market.
Property and Equipment
Property and equipment are recorded at cost and depreciated over their estimated useful lives. Leaseholdimprovements are amortized over the estimated useful life of the asset or the primary lease term of the respectivelease including exercised options, whichever is shorter. Renewals and betterments that materially extend the lifeof an asset are capitalized while maintenance and repair costs are expensed as incurred. When property andequipment are sold or otherwise disposed of, the asset account and related accumulated depreciation oramortization accounts are relieved, and any gain or loss is included in earnings.
Depreciation and amortization are recorded using the straight-line method over the following estimated usefullives:
Furniture and fixtures 10 yearsEquipment 5-10 yearsBrewery equipment 10-20 yearsBuilding improvements the shorter of 20 years or the remaining lease termLeasehold improvements the shorter of the useful life or the lease term
F-7

Goodwill
We perform impairment testing annually, during the fourth quarter, and more frequently if factors andcircumstances indicate an impairment may have occurred. When evaluating goodwill for impairment, we firstperform a qualitative assessment to determine whether it is more likely than not that the fair value of a reportingunit is less than its carrying value. If it is concluded that this is the case, we calculate the implied estimated fairvalue of the reporting unit and compare it to the carrying value of the goodwill. If the carrying value of thegoodwill is greater than the implied estimated fair value, an impairment charge is recorded to reduce the carryingvalue to the implied estimated fair value. This adjusted carrying value becomes the new goodwill accountingbasis value. We believe that no impairments of goodwill occurred during fiscal 2014, 2013 or 2012.
Intangible Assets
Definite-lived intangible assets are composed of trademarks and amortized over their estimated useful lives often years and tested for impairment when facts and circumstances indicate that the carrying values may not berecoverable. Indefinite-lived intangible assets are not subject to amortization and tested for impairment whenfacts and circumstances indicate that the carrying values may not be recoverable. We believe that no impairmentsof intangible assets occurred during fiscal 2014, 2013 or 2012. Intangible assets are included in “Other assets,net” on the accompanying Consolidated Balance Sheets.
Long-Lived Assets
We assess potential impairments of our long-lived assets whenever events or changes in circumstances indicate thatthe carrying value of the assets may not be recoverable. The assets are generally reviewed for impairment in total aswell as on a restaurant by restaurant basis. Factors considered include, but are not limited to, significantunderperformance by the restaurant relative to expected historical or projected future operating results, significantchanges in the manner of use of the acquired assets or the strategy for the overall business, and significant negativeindustry or economic trends. The recoverability is assessed in most cases by comparing the carrying value of theasset to the undiscounted cash flows expected to be generated by the asset. This assessment process requires the useof estimates and assumptions regarding future restaurant cash flows and estimated useful lives, which are subject toa significant degree of judgment. If these assumptions change in the future, we may be required to recordimpairment charges for these assets or for the entire restaurant. If the carrying amount is greater than the anticipatedundiscounted cash flows, an impairment charge is recorded as the difference between the carrying amount and theassets fair value. In fiscal 2014 and 2013, we recorded impairment expense of $0.3 million and $3.1 million,respectively, which is included in “Loss on disposal of assets and impairments” in the Consolidated Statements ofIncome, representing a reduction in the carrying value of one of our underperforming BJ’s Pizza & Grill® and BJ’sRestaurant & Brewhouse® restaurants, respectively. There was no long-lived asset impairment recorded duringfiscal 2012.
Revenue Recognition
Revenues from food and beverage sales at restaurants are recognized when payment is tendered at the point-of-sale.Amounts paid with a credit card are recorded in accounts and other receivables until payment is collected. Revenuesfrom the sale of gift cards are deferred and recognized upon redemption. Deferred gift card revenue, included in“Accrued expenses” on the accompanying Consolidated Balance Sheets, was $9.6 million and $7.8 million as ofDecember 30, 2014 and December 31, 2013, respectively. We recognize gift card breakage income when thelikelihood of the redemption of the cards becomes remote, which is typically 24 months after original issuance. Giftcard breakage income is recorded in “Other income, net” on the Consolidated Statements of Income.
Customer Loyalty Program
Our “BJ’s Premier Rewards” customer loyalty program enables participants to earn points for each qualifyingpurchase. The points can then be redeemed for rewards including food discounts, trips, events and other items.We measure our total rewards obligation based on the estimated number of customers that will ultimately earn
F-8
and claim rewards under the program, and record the estimated related expense as reward pointsaccumulate. These expenses are accrued for and recorded as marketing expenses and are included in “Occupancyand operating” expenses on our Consolidated Statements of Income.
Sales Taxes
Revenues are presented net of sales taxes. The obligation is included in other accrued expenses until the taxes areremitted to the appropriate taxing authorities.
Advertising Costs
Advertising costs are expensed as incurred. Advertising expense for fiscal 2014, 2013, and 2012 wasapproximately $19.2 million, $17.1 million, and $10.6 million, respectively. Advertising costs are primarilyincluded in “Occupancy and operating” expenses on our Consolidated Statements of Income.
Income Taxes
We provide for income taxes based on our estimate of federal and state tax liabilities. Our estimates include, butare not limited to, effective state and local income tax rates, allowable tax credits for items such as FICA taxespaid on reported tip income and estimates related to depreciation expense allowable for tax purposes. We usuallyfile our income tax returns several months after our fiscal year-end. We file our tax returns with the advice andcompilation of tax consultants. All tax returns are subject to audit by federal and state governments, usually yearsafter the returns are filed, and could be subject to differing interpretation of the tax laws.
We utilize the liability method of accounting for income taxes. Deferred income taxes are recognized based onthe tax consequences in future years of differences between the tax basis of assets and liabilities and theirfinancial reporting amounts at each year-end based on enacted tax laws and statutory tax rates applicable to theperiods in which differences are expected to affect taxable income. Valuation allowances are established, whennecessary, to reduce deferred tax assets to the amount expected to be realized. The provision for income taxesrepresents the tax payable for the period and the change during the period in deferred tax assets and liabilities.
We recognize the impact of a tax position in our financial statements if that position is more likely than not ofbeing sustained on audit, based on the technical merits of the position. Interest and penalties related to uncertaintax positions are included in income tax expense.
Restaurant Opening Expense
Restaurant payroll, supplies, training, other start-up costs and rent expense incurred prior to the opening of a newrestaurant are expensed as incurred.
Legal and Other Settlements
In fiscal 2014, legal and other settlements related to professional fees and other expenses incurred in connectionwith our shareholder settlement dated April 21, 2014. In fiscal 2013, legal and other settlements primarily relatedto the proposed settlements of certain California employment practices lawsuits, an alleged trademarkinfringement lawsuit, an employment separation agreement, a Texas Alcoholic Beverage Commission settlementrelated to our beer distribution model, and a California sales tax audit assessment. We agreed to thesesettlements, in order to avoid the costs, risks and uncertainties inherent in litigation and to eliminate the furtherdiversion of our management’s time and attention, and without admitting any liability on our part.
Investment Settlement
In December 2009, we agreed to a settlement with our former broker-dealer for the full liquidation of our auctionrate securities (“ARS”) investment portfolio. Under the terms of the settlement agreement, we were entitled to
F-9

potential future recoveries of our loss on that portfolio based on the performance of those auction rate securitiesthrough December 2012. We received recoveries of approximately $0.8 million for fiscal 2012.
Leases
We lease the majority of our restaurant locations. We account for our leases in accordance with U.S. GAAP,which require that our leases be evaluated and classified as operating or capital leases for financial reportingpurposes. The term used for this evaluation includes renewal option periods only in instances in which theexercise of the renewal option can be reasonably assured and failure to exercise such option would result in aneconomic penalty. All of our restaurant leases are classified as operating leases. We disburse cash for leaseholdimprovements, furniture and fixtures and equipment to build out and equip our leased premises. Tenantimprovement allowance incentives may be available to partially offset the cost of developing and opening therelated restaurants, pursuant to agreed-upon terms in our leases. Tenant improvement allowances can take theform of cash payments upon the opening of the related restaurants, full or partial credits against minimum orpercentage rents otherwise payable by us or a combination thereof. All tenant improvement allowances receivedby us are recorded as a deferred lease incentive and amortized over the term of the lease. The related cashreceived from the landlord is reflected as “Landlord contribution for tenant improvements” within operatingactivities of our Consolidated Statements of Cash Flows.
The lease term used for straight-line rent expense is calculated from the date we obtain possession of the leasedpremises through the lease termination date. We expense rent from possession date through restaurant open dateas preopening expense. Once a restaurant opens for business, we record straight-line rent over the lease term pluscontingent rent to the extent it exceeded the minimum rent obligation per the lease agreement.
There is potential for variability in the rent holiday period, which begins on the possession date and ends on therestaurant open date, during which no cash rent payments are typically due under the terms of the lease. Factorsthat may affect the length of the rent holiday period generally relate to construction related delays. Extension ofthe rent holiday period due to delays in restaurant opening will result in greater preopening rent expenserecognized during the rent holiday period and lesser occupancy expense during the rest of the lease term (post-opening).
For leases that contain rent escalations in which the amount of future rent is certain or can be reasonablycalculated, we record the total rent payable during the lease term, as determined above, on the straight-line basisover the term of the lease (including the rent holiday period beginning upon our possession of the premises), andrecord the difference between the minimum rents paid and the straight-line rent as deferred rent. Certain leasescontain provisions that require additional rent payments based upon restaurant sales volume (“contingent rent”).Contingent rent is accrued each period as the liabilities are incurred, in addition to the straight-line rent expensenoted above. This results in some variability in occupancy expense as a percentage of revenues over the term ofthe lease in restaurants where we pay contingent rent.
Management makes judgments regarding the probable term for each restaurant property lease, which can impactthe classification and accounting for a lease as capital or operating, the rent holiday and/or escalations inpayments that are taken into consideration when calculating straight-line rent and the term over which leaseholdimprovements for each restaurant are amortized. These judgments may produce materially different amounts ofdepreciation, amortization and rent expense than would be reported if different assumed lease terms were used.
Fair Value of Financial Instruments
The carrying value of cash and cash equivalents, investments classified as held-to-maturity or other currentassets, accounts receivable and current liabilities approximate fair values due to the short-term maturity of theseinstruments. Investments classified as non-current assets are recorded at fair value based on valuation models andmethodologies provided by a third party using either “Level 2” or “Level 3” inputs when the fair value of theinvestment cannot be determined based on current trades on the open market. Declines in fair value below ourcarrying value deemed to be other than temporary are charged against net earnings.
F-10
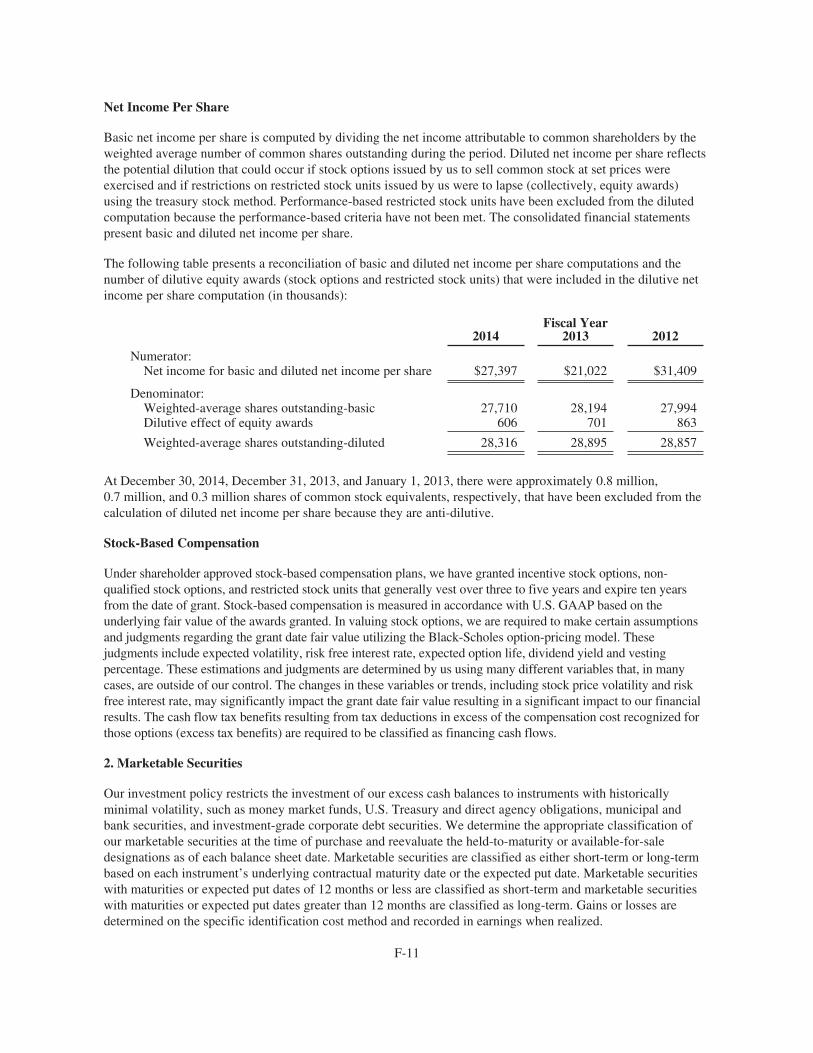
Net Income Per Share
Basic net income per share is computed by dividing the net income attributable to common shareholders by theweighted average number of common shares outstanding during the period. Diluted net income per share reflectsthe potential dilution that could occur if stock options issued by us to sell common stock at set prices wereexercised and if restrictions on restricted stock units issued by us were to lapse (collectively, equity awards)using the treasury stock method. Performance-based restricted stock units have been excluded from the dilutedcomputation because the performance-based criteria have not been met. The consolidated financial statementspresent basic and diluted net income per share.
The following table presents a reconciliation of basic and diluted net income per share computations and thenumber of dilutive equity awards (stock options and restricted stock units) that were included in the dilutive netincome per share computation (in thousands):
Fiscal Year2014 2013 2012
Numerator:Net income for basic and diluted net income per share $27,397 $21,022 $31,409
Denominator:Weighted-average shares outstanding-basic 27,710 28,194 27,994Dilutive effect of equity awards 606 701 863
Weighted-average shares outstanding-diluted 28,316 28,895 28,857
At December 30, 2014, December 31, 2013, and January 1, 2013, there were approximately 0.8 million,0.7 million, and 0.3 million shares of common stock equivalents, respectively, that have been excluded from thecalculation of diluted net income per share because they are anti-dilutive.
Stock-Based Compensation
Under shareholder approved stock-based compensation plans, we have granted incentive stock options, non-qualified stock options, and restricted stock units that generally vest over three to five years and expire ten yearsfrom the date of grant. Stock-based compensation is measured in accordance with U.S. GAAP based on theunderlying fair value of the awards granted. In valuing stock options, we are required to make certain assumptionsand judgments regarding the grant date fair value utilizing the Black-Scholes option-pricing model. Thesejudgments include expected volatility, risk free interest rate, expected option life, dividend yield and vestingpercentage. These estimations and judgments are determined by us using many different variables that, in manycases, are outside of our control. The changes in these variables or trends, including stock price volatility and riskfree interest rate, may significantly impact the grant date fair value resulting in a significant impact to our financialresults. The cash flow tax benefits resulting from tax deductions in excess of the compensation cost recognized forthose options (excess tax benefits) are required to be classified as financing cash flows.
2. Marketable Securities
Our investment policy restricts the investment of our excess cash balances to instruments with historicallyminimal volatility, such as money market funds, U.S. Treasury and direct agency obligations, municipal andbank securities, and investment-grade corporate debt securities. We determine the appropriate classification ofour marketable securities at the time of purchase and reevaluate the held-to-maturity or available-for-saledesignations as of each balance sheet date. Marketable securities are classified as either short-term or long-termbased on each instrument’s underlying contractual maturity date or the expected put date. Marketable securitieswith maturities or expected put dates of 12 months or less are classified as short-term and marketable securitieswith maturities or expected put dates greater than 12 months are classified as long-term. Gains or losses aredetermined on the specific identification cost method and recorded in earnings when realized.
F-11

During fiscal 2014, all remaining investments were liquidated. At December 31, 2013, all highly liquidinvestments with maturities of three months or less at the date of purchase were classified as cash equivalents andincluded with “Cash and cash equivalents” on our accompanying Consolidated Balance Sheets. Marketablesecurities, which we had the intent and ability to hold until maturity, were classified as held-to-maturity securitiesand reported at amortized cost, which approximated fair value.
Investments in marketable securities consist of the following (in thousands):
December 31, 2013
Held-to-maturityAmortized
CostAverage
Maturity (1)
Short-term marketable securities:Municipal securities, U.S. Treasury and direct agency obligations $6,943 5 monthsDomestic corporate obligations 1,045 10 months
$7,988
Long-term marketable securities:Municipal securities and direct agency obligations $1,803 14 months
$1,803
(1) Average maturity is determined from the respective balance sheet date and reported in the table as thelesser of the original maturity date or the expected put date for each investment type.
3. Fair Value Measurement
In accordance with U.S. GAAP, a framework for using fair value to measure assets and liabilities was establishedby defining a three-tier fair value hierarchy, which prioritizes the inputs used to measure fair value. These tiersinclude:
• Level 1: Defined as observable inputs such as quoted prices in active markets for identical assets orliabilities as of the reporting date. Active markets are those in which transactions for the asset or liabilityoccur in sufficient frequency and volume to provide pricing information on an ongoing basis.
• Level 2: Defined as pricing inputs other than quoted prices in active markets included in Level 1, whichare either directly or indirectly observable as of the reporting date. Level 2 includes those financialinstruments that are valued using models or other valuation methodologies. These models are primarilyindustry-standard models that consider various assumptions, including quoted forward prices forcommodities, time value, volatility factors, and current market and contractual prices for the underlyinginstruments, as well as other relevant economic measures.
• Level 3: Defined as pricing inputs that are generally less observable from objective sources. These inputsmay be used with internally developed methodologies that result in management’s best estimate of fairvalue.
At December 31, 2013, our marketable securities were held by institutional brokers, classified as held-to-maturity securities and reported at amortized cost, which approximated fair value (effectively, Level 2). Weplaced a majority of our cash, in excess of our current operating needs, with major financial institutions andinstitutional brokers that, in turn, invested in instruments with historically minimal volatility, such as moneymarket funds, U.S. Treasury and direct agency obligations, municipal and bank securities, and investment-gradecorporate debt securities. Our investment policy limits the amount of exposure to any one institution orinvestment; therefore we did not experience any losses on these marketable securities.
F-12
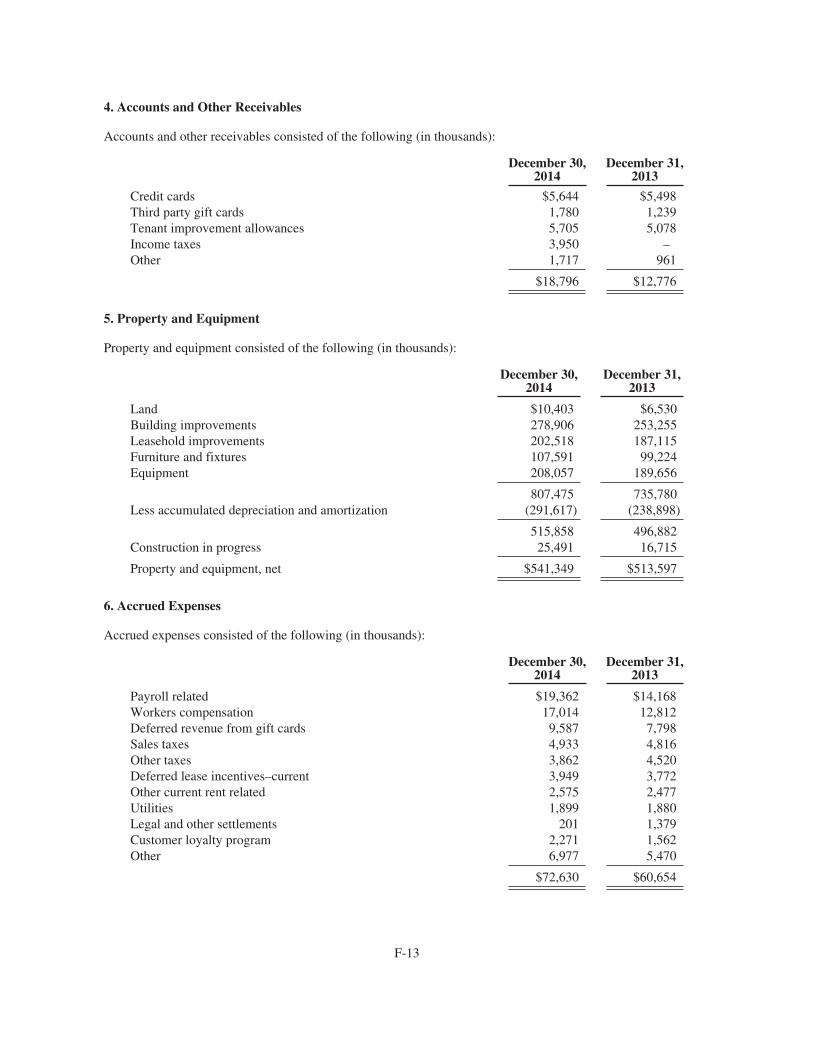
4. Accounts and Other Receivables
Accounts and other receivables consisted of the following (in thousands):
December 30,2014
December 31,2013
Credit cards $5,644 $5,498Third party gift cards 1,780 1,239Tenant improvement allowances 5,705 5,078Income taxes 3,950 –Other 1,717 961
$18,796 $12,776
5. Property and Equipment
Property and equipment consisted of the following (in thousands):
December 30,2014
December 31,2013
Land $10,403 $6,530Building improvements 278,906 253,255Leasehold improvements 202,518 187,115Furniture and fixtures 107,591 99,224Equipment 208,057 189,656
807,475 735,780Less accumulated depreciation and amortization (291,617) (238,898)
515,858 496,882Construction in progress 25,491 16,715
Property and equipment, net $541,349 $513,597
6. Accrued Expenses
Accrued expenses consisted of the following (in thousands):
December 30,2014
December 31,2013
Payroll related $19,362 $14,168Workers compensation 17,014 12,812Deferred revenue from gift cards 9,587 7,798Sales taxes 4,933 4,816Other taxes 3,862 4,520Deferred lease incentives–current 3,949 3,772Other current rent related 2,575 2,477Utilities 1,899 1,880Legal and other settlements 201 1,379Customer loyalty program 2,271 1,562Other 6,977 5,470
$72,630 $60,654
F-13

7. Commitments and Contingencies
Leases
We lease our restaurant and office facilities under non-cancelable operating leases with remaining terms rangingfrom approximately 1 to 20 years with renewal options ranging from 5 to 20 years. Rent expense for fiscal 2014,2013, and 2012 was $35.9 million, $32.8 million, and $29.7 million, respectively.
We have certain operating leases that contain fixed rent escalation clauses. Rent expense for these leases hasbeen calculated on the straight-line basis over the term of the leases, resulting in deferred rent of approximately$24.8 million and $22.3 million at December 30, 2014 and December 31, 2013, respectively. The deferred rent ispresented on the accompanying Consolidated Balance Sheets and will be amortized to rent expense over the lifeof the leases.
A number of the leases also provide for contingent rent based on a percentage of sales above a specifiedminimum. Total contingent rent, included in rent expense, above the minimum, for fiscal 2014, 2013, and 2012were approximately $3.5 million, $3.6 million, and $4.4 million, respectively.
Future minimum annual rent payments under non-cancelable operating leases are as follows (in thousands):
2015 $36,4432016 36,6242017 37,5252018 36,5642019 34,641Thereafter 337,712
$519,509
Additionally, we have entered into lease agreements related to the construction of future restaurants withcommencement dates subsequent to December 30, 2014. Our aggregate future commitment relating to theseleases is $24.3 million.
Legal Proceedings
We are subject to private lawsuits, administrative proceedings and demands that arise in the ordinary course ofour business and which typically involve claims from customers, employees and others related to operational,employment, real estate and intellectual property issues common to the foodservice industry. A number of theseclaims may exist at any given time. We are self-insured for a portion of our general liability insurance and ouremployee workers’ compensation programs. We maintain coverage with a third party insurer to limit our totalexposure for these programs. We believe that most of our customer claims will be covered by our generalliability insurance, subject to coverage limits and the portion of such claims that are self-insured. Punitivedamages awards and employee unfair practice claims, however, are not covered by our general liabilityinsurance. To date, we have not been ordered to pay punitive damages with respect to any claims, but there canbe no assurance that punitive damages will not be awarded with respect to any future claims. We could beaffected by adverse publicity resulting from allegations in lawsuits, claims and proceedings, regardless ofwhether these allegations are valid or whether we are ultimately determined to be liable. We currently believethat the final disposition of these types of lawsuits, proceedings and claims will not have a material adverse effecton our financial position, results of operations or liquidity. It is possible, however, that our future results ofoperations for a particular quarter or fiscal year could be impacted by changes in circumstances relating tolawsuits, proceedings or claims.
F-14
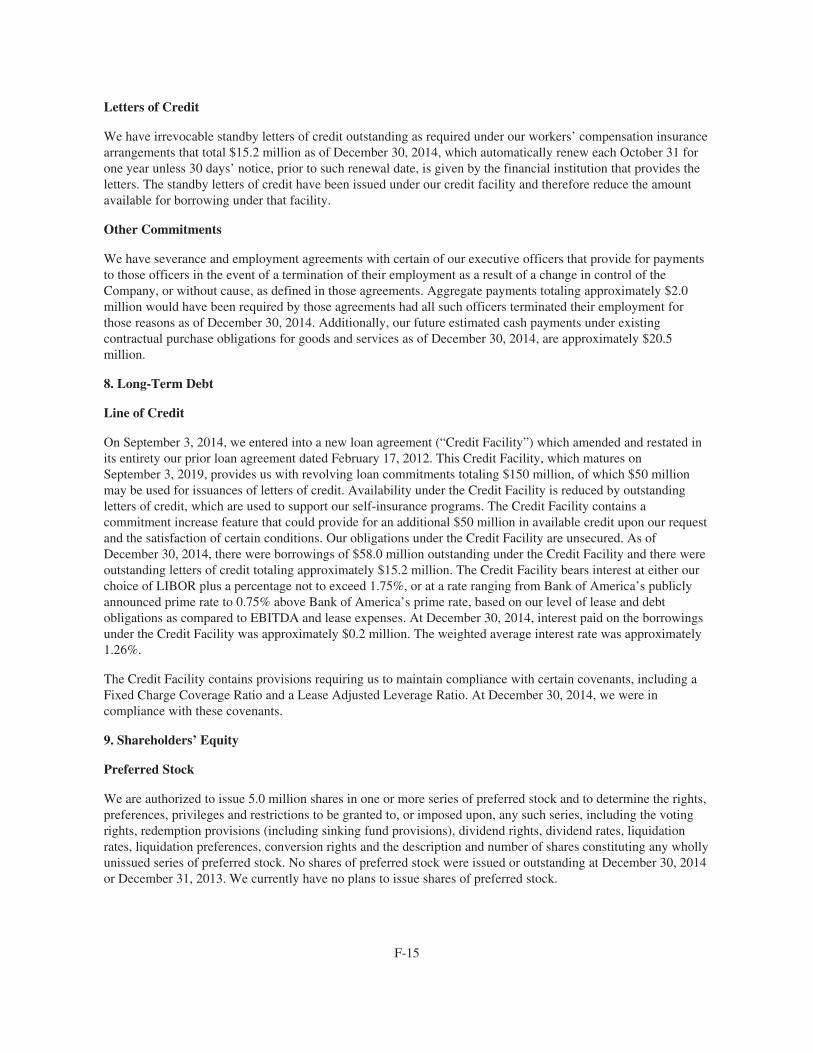
Letters of Credit
We have irrevocable standby letters of credit outstanding as required under our workers’ compensation insurancearrangements that total $15.2 million as of December 30, 2014, which automatically renew each October 31 forone year unless 30 days’ notice, prior to such renewal date, is given by the financial institution that provides theletters. The standby letters of credit have been issued under our credit facility and therefore reduce the amountavailable for borrowing under that facility.
Other Commitments
We have severance and employment agreements with certain of our executive officers that provide for paymentsto those officers in the event of a termination of their employment as a result of a change in control of theCompany, or without cause, as defined in those agreements. Aggregate payments totaling approximately $2.0million would have been required by those agreements had all such officers terminated their employment forthose reasons as of December 30, 2014. Additionally, our future estimated cash payments under existingcontractual purchase obligations for goods and services as of December 30, 2014, are approximately $20.5million.
8. Long-Term Debt
Line of Credit
On September 3, 2014, we entered into a new loan agreement (“Credit Facility”) which amended and restated inits entirety our prior loan agreement dated February 17, 2012. This Credit Facility, which matures onSeptember 3, 2019, provides us with revolving loan commitments totaling $150 million, of which $50 millionmay be used for issuances of letters of credit. Availability under the Credit Facility is reduced by outstandingletters of credit, which are used to support our self-insurance programs. The Credit Facility contains acommitment increase feature that could provide for an additional $50 million in available credit upon our requestand the satisfaction of certain conditions. Our obligations under the Credit Facility are unsecured. As ofDecember 30, 2014, there were borrowings of $58.0 million outstanding under the Credit Facility and there wereoutstanding letters of credit totaling approximately $15.2 million. The Credit Facility bears interest at either ourchoice of LIBOR plus a percentage not to exceed 1.75%, or at a rate ranging from Bank of America’s publiclyannounced prime rate to 0.75% above Bank of America’s prime rate, based on our level of lease and debtobligations as compared to EBITDA and lease expenses. At December 30, 2014, interest paid on the borrowingsunder the Credit Facility was approximately $0.2 million. The weighted average interest rate was approximately1.26%.
The Credit Facility contains provisions requiring us to maintain compliance with certain covenants, including aFixed Charge Coverage Ratio and a Lease Adjusted Leverage Ratio. At December 30, 2014, we were incompliance with these covenants.
9. Shareholders’ Equity
Preferred Stock
We are authorized to issue 5.0 million shares in one or more series of preferred stock and to determine the rights,preferences, privileges and restrictions to be granted to, or imposed upon, any such series, including the votingrights, redemption provisions (including sinking fund provisions), dividend rights, dividend rates, liquidationrates, liquidation preferences, conversion rights and the description and number of shares constituting any whollyunissued series of preferred stock. No shares of preferred stock were issued or outstanding at December 30, 2014or December 31, 2013. We currently have no plans to issue shares of preferred stock.
F-15
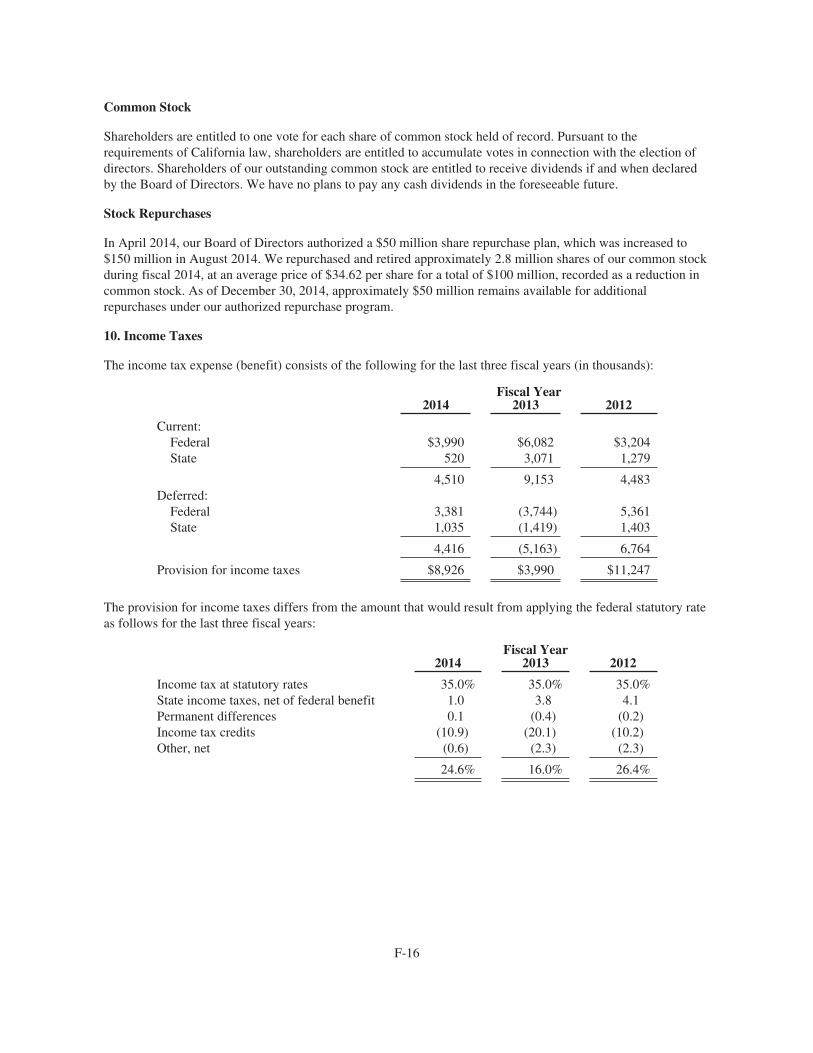
Common Stock
Shareholders are entitled to one vote for each share of common stock held of record. Pursuant to therequirements of California law, shareholders are entitled to accumulate votes in connection with the election ofdirectors. Shareholders of our outstanding common stock are entitled to receive dividends if and when declaredby the Board of Directors. We have no plans to pay any cash dividends in the foreseeable future.
Stock Repurchases
In April 2014, our Board of Directors authorized a $50 million share repurchase plan, which was increased to$150 million in August 2014. We repurchased and retired approximately 2.8 million shares of our common stockduring fiscal 2014, at an average price of $34.62 per share for a total of $100 million, recorded as a reduction incommon stock. As of December 30, 2014, approximately $50 million remains available for additionalrepurchases under our authorized repurchase program.
10. Income Taxes
The income tax expense (benefit) consists of the following for the last three fiscal years (in thousands):
Fiscal Year2014 2013 2012
Current:Federal $3,990 $6,082 $3,204State 520 3,071 1,279
4,510 9,153 4,483Deferred:
Federal 3,381 (3,744) 5,361State 1,035 (1,419) 1,403
4,416 (5,163) 6,764
Provision for income taxes $8,926 $3,990 $11,247
The provision for income taxes differs from the amount that would result from applying the federal statutory rateas follows for the last three fiscal years:
Fiscal Year2014 2013 2012
Income tax at statutory rates 35.0% 35.0% 35.0%State income taxes, net of federal benefit 1.0 3.8 4.1Permanent differences 0.1 (0.4) (0.2)Income tax credits (10.9) (20.1) (10.2)Other, net (0.6) (2.3) (2.3)
24.6% 16.0% 26.4%
F-16

The components of the deferred income tax asset (liability) consist of the following (in thousands):
December 30,2014
December 31,2013
Current deferred income tax asset:State tax $542 $1,004Gift cards 815 649Accrued expenses 11,364 8,191Other 2,029 772Valuation allowance (155) —
Total current deferred income tax asset 14,595 10,616
Non-current deferred income tax asset (liability):Property and equipment (70,346) (53,574)Intangible assets (2,112) (1,660)Smallwares (4,665) (4,423)Accrued expenses 5,389 3,187Stock-based compensation 5,495 4,995Deferred rent 9,719 8,819Income tax credits 15,823 11,828Net operating losses 557 153Other 1,752 210Valuation allowance (586) (114)
Total non-current deferred income tax liability (38,974) (30,579)
Net deferred income tax liability $(24,379) $(19,963)
At December 30, 2014, we had federal and California income tax credit carryforwards of approximately$15.9 million and $2.1 million, respectively, consisting primarily of the credit for FICA taxes paid on reportedemployee tip income and California enterprise zone credits. The FICA tax credits will begin to expire in 2032and the California enterprise zone credits will begin to expire in 2023.
As of December 30, 2014 and December 31, 2013, we have recorded a valuation allowance against certain statenet operating loss and tax credit carryforwards, the benefits of which are not more likely than not to be realizedprior to expiration, in the amount of $0.7 million and $0.1 million, respectively, net of federal benefit.
We recognize interest and penalties related to uncertain tax positions in income tax expense. As of December 30,2014, the amount recorded for interest and penalties changed for tax positions taken in the current year. As ofDecember 30, 2014, unrecognized tax benefits recorded was approximately $2.2 million, of which approximately$0.8 million, if reversed, would impact our effective tax rate. We anticipate a decrease of $1.4 million to ourliability for unrecognized tax benefits within the next twelve-month period due to the lapse of statutes oflimitation. A reconciliation of the beginning and ending amount of unrecognized tax benefits is as follows (inthousands):
Balance at January 3, 2012 $870Increase for tax positions taken during the current period 27
Balance at January 1, 2013 897Decrease for tax positions taken during the current period (678)
Balance at December 31, 2013 219Increase for tax positions taken in prior years 1,798Decrease for tax positions taken in prior years (52)Increase for tax positions taken in current year 317Decrease for statute expiration (109)
Balance at December 30, 2014 $2,173
F-17
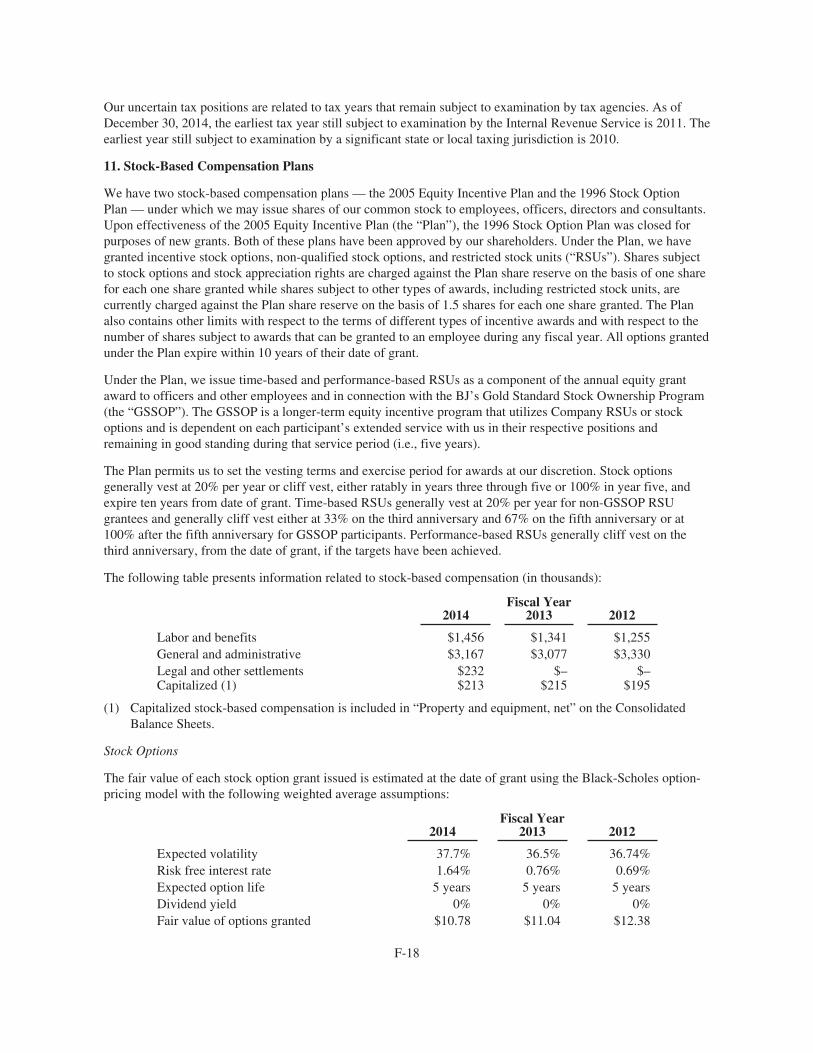
Our uncertain tax positions are related to tax years that remain subject to examination by tax agencies. As ofDecember 30, 2014, the earliest tax year still subject to examination by the Internal Revenue Service is 2011. Theearliest year still subject to examination by a significant state or local taxing jurisdiction is 2010.
11. Stock-Based Compensation Plans
We have two stock-based compensation plans — the 2005 Equity Incentive Plan and the 1996 Stock OptionPlan — under which we may issue shares of our common stock to employees, officers, directors and consultants.Upon effectiveness of the 2005 Equity Incentive Plan (the “Plan”), the 1996 Stock Option Plan was closed forpurposes of new grants. Both of these plans have been approved by our shareholders. Under the Plan, we havegranted incentive stock options, non-qualified stock options, and restricted stock units (“RSUs”). Shares subjectto stock options and stock appreciation rights are charged against the Plan share reserve on the basis of one sharefor each one share granted while shares subject to other types of awards, including restricted stock units, arecurrently charged against the Plan share reserve on the basis of 1.5 shares for each one share granted. The Planalso contains other limits with respect to the terms of different types of incentive awards and with respect to thenumber of shares subject to awards that can be granted to an employee during any fiscal year. All options grantedunder the Plan expire within 10 years of their date of grant.
Under the Plan, we issue time-based and performance-based RSUs as a component of the annual equity grantaward to officers and other employees and in connection with the BJ’s Gold Standard Stock Ownership Program(the “GSSOP”). The GSSOP is a longer-term equity incentive program that utilizes Company RSUs or stockoptions and is dependent on each participant’s extended service with us in their respective positions andremaining in good standing during that service period (i.e., five years).
The Plan permits us to set the vesting terms and exercise period for awards at our discretion. Stock optionsgenerally vest at 20% per year or cliff vest, either ratably in years three through five or 100% in year five, andexpire ten years from date of grant. Time-based RSUs generally vest at 20% per year for non-GSSOP RSUgrantees and generally cliff vest either at 33% on the third anniversary and 67% on the fifth anniversary or at100% after the fifth anniversary for GSSOP participants. Performance-based RSUs generally cliff vest on thethird anniversary, from the date of grant, if the targets have been achieved.
The following table presents information related to stock-based compensation (in thousands):
Fiscal Year2014 2013 2012
Labor and benefits $1,456 $1,341 $1,255General and administrative $3,167 $3,077 $3,330Legal and other settlements $232 $– $–Capitalized (1) $213 $215 $195
(1) Capitalized stock-based compensation is included in “Property and equipment, net” on the ConsolidatedBalance Sheets.
Stock Options
The fair value of each stock option grant issued is estimated at the date of grant using the Black-Scholes option-pricing model with the following weighted average assumptions:
Fiscal Year2014 2013 2012
Expected volatility 37.7% 36.5% 36.74%Risk free interest rate 1.64% 0.76% 0.69%Expected option life 5 years 5 years 5 yearsDividend yield 0% 0% 0%Fair value of options granted $10.78 $11.04 $12.38
F-18
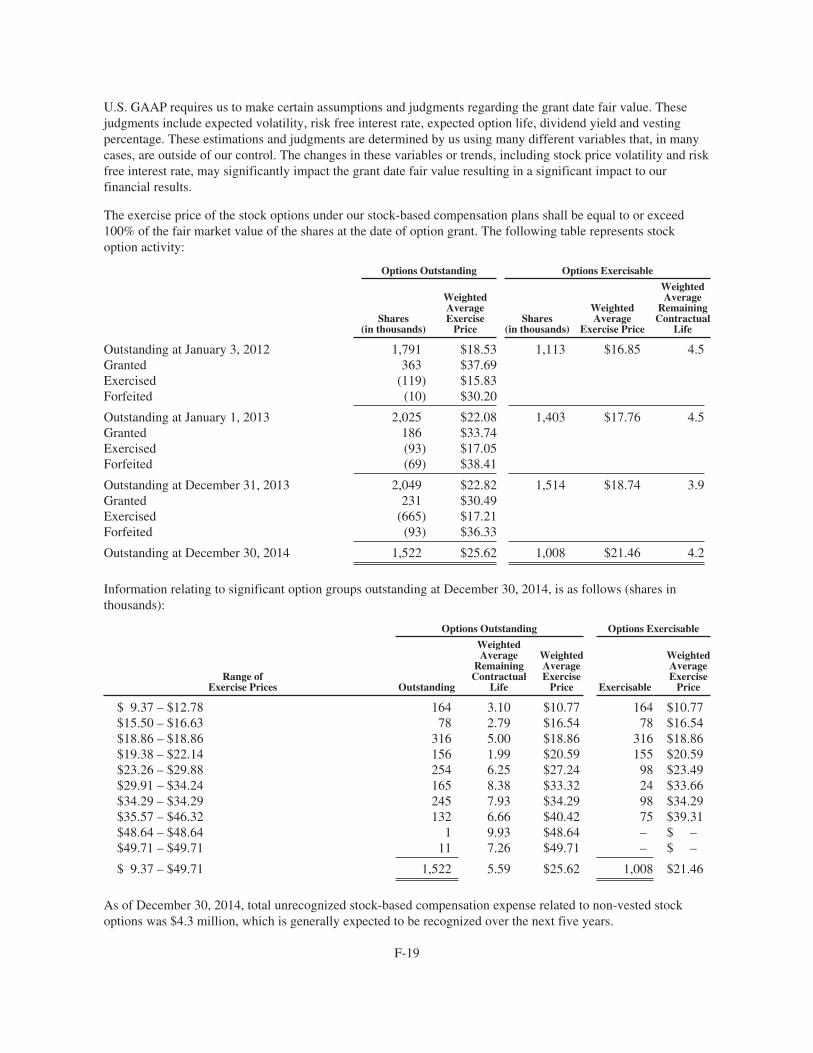
U.S. GAAP requires us to make certain assumptions and judgments regarding the grant date fair value. Thesejudgments include expected volatility, risk free interest rate, expected option life, dividend yield and vestingpercentage. These estimations and judgments are determined by us using many different variables that, in manycases, are outside of our control. The changes in these variables or trends, including stock price volatility and riskfree interest rate, may significantly impact the grant date fair value resulting in a significant impact to ourfinancial results.
The exercise price of the stock options under our stock-based compensation plans shall be equal to or exceed100% of the fair market value of the shares at the date of option grant. The following table represents stockoption activity:
Options Outstanding Options Exercisable
Shares(in thousands)
WeightedAverageExercise
PriceShares
(in thousands)
WeightedAverage
Exercise Price
WeightedAverage
RemainingContractual
Life
Outstanding at January 3, 2012 1,791 $18.53 1,113 $16.85 4.5Granted 363 $37.69Exercised (119) $15.83Forfeited (10) $30.20
Outstanding at January 1, 2013 2,025 $22.08 1,403 $17.76 4.5Granted 186 $33.74Exercised (93) $17.05Forfeited (69) $38.41
Outstanding at December 31, 2013 2,049 $22.82 1,514 $18.74 3.9Granted 231 $30.49Exercised (665) $17.21Forfeited (93) $36.33
Outstanding at December 30, 2014 1,522 $25.62 1,008 $21.46 4.2
Information relating to significant option groups outstanding at December 30, 2014, is as follows (shares inthousands):
Options Outstanding Options Exercisable
Range ofExercise Prices Outstanding
WeightedAverage
RemainingContractual
Life
WeightedAverageExercise
Price Exercisable
WeightedAverageExercise
Price
$ 9.37 – $12.78 164 3.10 $10.77 164 $10.77$15.50 – $16.63 78 2.79 $16.54 78 $16.54$18.86 – $18.86 316 5.00 $18.86 316 $18.86$19.38 – $22.14 156 1.99 $20.59 155 $20.59$23.26 – $29.88 254 6.25 $27.24 98 $23.49$29.91 – $34.24 165 8.38 $33.32 24 $33.66$34.29 – $34.29 245 7.93 $34.29 98 $34.29$35.57 – $46.32 132 6.66 $40.42 75 $39.31$48.64 – $48.64 1 9.93 $48.64 – $ –$49.71 – $49.71 11 7.26 $49.71 – $ –
$ 9.37 – $49.71 1,522 5.59 $25.62 1,008 $21.46
As of December 30, 2014, total unrecognized stock-based compensation expense related to non-vested stockoptions was $4.3 million, which is generally expected to be recognized over the next five years.
F-19

Time-Vested Restricted Stock Units
Time-vested restricted stock unit activity was as follows:
Shares(in thousands)
WeightedAverage
Fair Value
Outstanding at January 3, 2012 616 $20.48Granted 160 $43.34Vested or released (213) $17.49Forfeited (77) $27.91
Outstanding at January 1, 2013 486 $28.14Granted 169 $32.63Vested or released (150) $15.66Forfeited (72) $34.04
Outstanding at December 31, 2013 433 $33.23Granted 130 $31.71Vested or released (80) $21.36Forfeited (56) $35.60
Outstanding at December 30, 2014 427 $34.66
The fair value of the time-vested RSUs is the quoted market value of our common stock on the date of grant. The fairvalue of each time-vested RSU is expensed over the period during which the restrictions are expected to lapse (i.e., fiveyears). As of December 30, 2014, total unrecognized stock-based compensation expense related to non-vestedrestricted shares was approximately $7.4 million, which is generally expected to be recognized over the next five years.
Performance-Based Restricted Stock Units
Performance-based restricted stock unit activity was as follows:
Shares(in thousands)
WeightedAverage
Fair Value
Outstanding at December 31, 2013 – $–Granted 36 $32.49Vested or released – $–Forfeited (6) $32.49
Outstanding at December 30, 2014 30 $32.49
The fair value of the performance-based RSUs is the quoted market value of our common stock on the date ofgrant. The fair value of each performance-based RSU is recognized when it is probable the performance goal willbe achieved. As of December 30, 2014, total unrecognized stock-based compensation expense related to non-vested performance-based RSUs was approximately $0.6 million.
12. Employee Benefit Plans
We maintain a voluntary, contributory 401(k) plan for all eligible employees. Employees may elect to contributeup to 100% of their earnings, up to the IRS maximum for the plan year of participation. Additionally, eligibleparticipants may also elect allowable catch-up contributions as provided for by the IRS. Our executive officersand other highly compensated employees are not eligible to participate in the 401(k) plan. Employeecontributions are matched by us at a rate of 33% for the first 6% of deferred earnings. We contributedapproximately $0.3 million, $0.3 million, and $0.3 million in fiscal 2014, 2013, and 2012, respectively.
F-20

We also maintain a non-qualified deferred compensation plan (the “DCP”) for our executive officers and other highlycompensated employees, as defined in the DCP who are otherwise ineligible for participation in our 401(k) plan. TheDCP allows participating employees to defer the receipt of a portion of their base compensation and up to 100% oftheir eligible bonuses. Additionally, the DCP allows for a voluntary company match as determined by the Company’scompensation committee. During fiscal 2014, there were no contributions made or accrued by us. We pay for relatedadministrative costs, which were not significant during fiscal 2014. Employee deferrals are deposited into a rabbi trustand the funds are generally invested in individual variable life insurance contracts owned by us that are specificallydesigned to informally fund savings plans of this nature. Our investment in variable life insurance contracts, reflectedin “Other assets, net” on our Consolidated Balance Sheets, was $4.2 million and $3.2 million as of December 30, 2014and December 31, 2013, respectively. Our obligation to participating employees, included in “Other liabilities” on theaccompanying Consolidated Balance Sheets, was $4.1 million and $3.3 million as of December 30, 2014 andDecember 31, 2013, respectively. All income and expenses related to the rabbi trust are reflected in our ConsolidatedStatements of Income.
13. Related Party Transactions
As of December 30, 2014, we believe that Jacmar Companies and their affiliates (collectively referred to herein as“Jacmar”) owned approximately 12.0% of our outstanding common stock. In addition, James Dal Pozzo, the ChiefExecutive Officer of Jacmar, is a member of our Board of Directors. Jacmar, through its affiliation with DMA, iscurrently our largest supplier of food, beverage, paper products and supplies. We began using DMA for our nationalfoodservice distribution in July 2006. In July 2012, we finalized a new five-year agreement with DMA, afterconducting another extensive competitive bidding process. Jacmar services our restaurants in California and Nevada,while other DMA distributors service our restaurants in all other states. We also understand that Jacmar and itsaffiliates are the controlling shareholders of the Shakey’s pizza parlor chain. We believe that Jacmar sells products tous at prices comparable to those offered by unrelated third parties based on our competitive bidding process. Jacmarsupplied us with $86.7 million, $82.8 million, and $78.0 million of food, beverage, paper products and supplies forfiscal 2014, 2013, and 2012, respectively, which represents 21.9%, 22.6%, and 23.9% of our total costs of sales andoperating and occupancy costs, respectively. We had trade payables related to these products of $4.0 million and $4.8million, at December 30, 2014 and December 31, 2013, respectively. Jacmar does not provide us with any produce,liquor, wine or beer products, all of which are provided by other vendors and are included “Cost of sales” on theConsolidated Statements of Income.
14. Selected Consolidated Quarterly Financial Data (Unaudited)
Our summarized unaudited consolidated quarterly financial data is as follows (in thousands, except per share data):
April 1,2014
July 1,2014
September 30,2014
December 30,2014
Total revenues $205,822 $219,380 $206,450 $213,917Income from operations $ 5,787 $ 10,689 $ 8,034 $ 10,916Net income $ 4,658 $ 8,004 $ 6,482 $ 8,253Basic net income per share (1) $ 0.16 $ 0.28 $ 0.23 $ 0.31Diluted net income per share (1) $ 0.16 $ 0.28 $ 0.23 $ 0.31
April 2,2013
July 2,2013
October 1,2013
December 31,2013
Total revenues $188,625 $198,487 $188,245 $199,768Income from operations $ 10,832 $ 11,777 $ 3,486 $ (2,235)Net income $ 8,273 $ 8,597 $ 3,648 $ 504Basic net income per share (1) $ 0.29 $ 0.31 $ 0.13 $ 0.02Diluted net income per share (1) $ 0.29 $ 0.30 $ 0.13 $ 0.02
(1) Basic and diluted net income per share calculations for each quarter is based on the weighted averagediluted shares outstanding for that quarter and may not sum to the full year total amount as presented on theConsolidated Statements of Income.
F-21

Exhibit 21
BJ’S RESTAURANTS, INC.
List of Significant Subsidiaries
Chicago Pizza Northwest, Inc., a Washington corporationChicago Pizza & Brewery, LP, a Texas limited partnershipChicago America Holding, LLC, a Nevada limited liability companyChicago Pizza Management, LLC, a Nevada limited liability companyChicago Pizza Restaurant Holding, Inc., a Nevada corporationChicago Pizza Hospitality Holding, Inc., a Texas corporationBJ’s Restaurant Operations Company, a California corporationReno Brewery Holding, Inc., a Nevada corporationBJ’s Restaurant Operations Company of Kansas, LLC, a Kansas limited liability companyBJROC Maryland, LLC, a California limited liability company
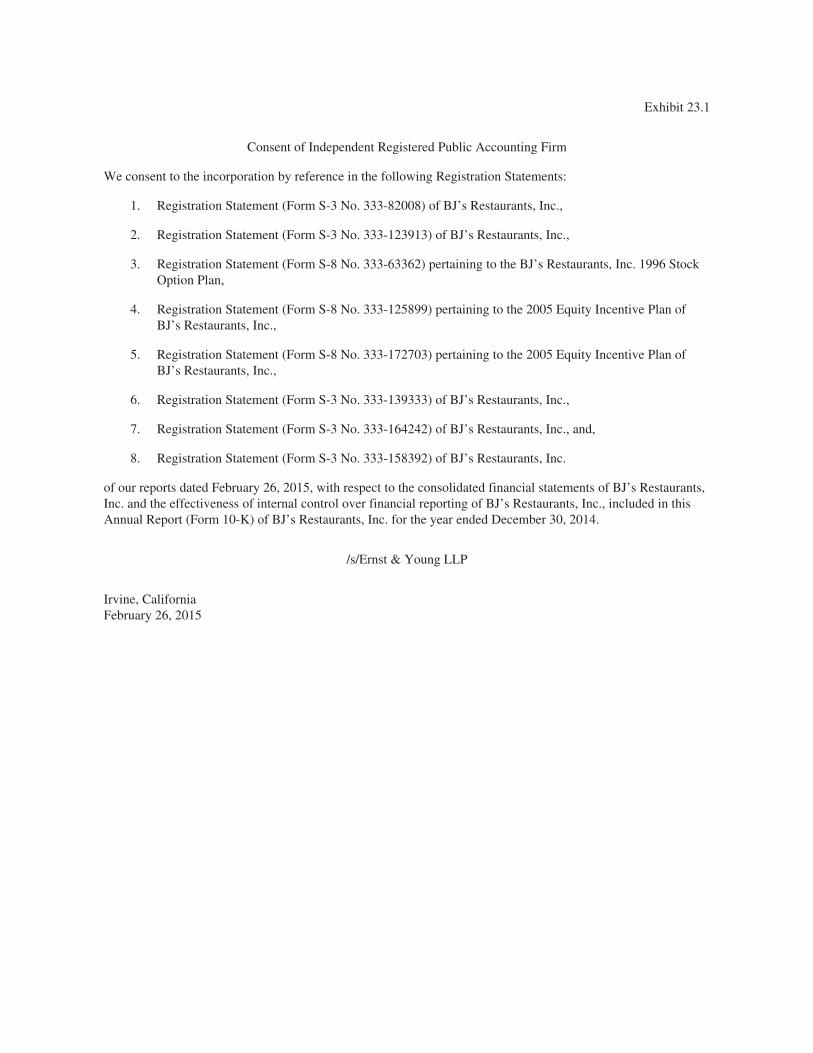
Exhibit 23.1
Consent of Independent Registered Public Accounting Firm
We consent to the incorporation by reference in the following Registration Statements:
1. Registration Statement (Form S-3 No. 333-82008) of BJ’s Restaurants, Inc.,
2. Registration Statement (Form S-3 No. 333-123913) of BJ’s Restaurants, Inc.,
3. Registration Statement (Form S-8 No. 333-63362) pertaining to the BJ’s Restaurants, Inc. 1996 StockOption Plan,
4. Registration Statement (Form S-8 No. 333-125899) pertaining to the 2005 Equity Incentive Plan ofBJ’s Restaurants, Inc.,
5. Registration Statement (Form S-8 No. 333-172703) pertaining to the 2005 Equity Incentive Plan ofBJ’s Restaurants, Inc.,
6. Registration Statement (Form S-3 No. 333-139333) of BJ’s Restaurants, Inc.,
7. Registration Statement (Form S-3 No. 333-164242) of BJ’s Restaurants, Inc., and,
8. Registration Statement (Form S-3 No. 333-158392) of BJ’s Restaurants, Inc.
of our reports dated February 26, 2015, with respect to the consolidated financial statements of BJ’s Restaurants,Inc. and the effectiveness of internal control over financial reporting of BJ’s Restaurants, Inc., included in thisAnnual Report (Form 10-K) of BJ’s Restaurants, Inc. for the year ended December 30, 2014.
/s/Ernst & Young LLP
Irvine, CaliforniaFebruary 26, 2015
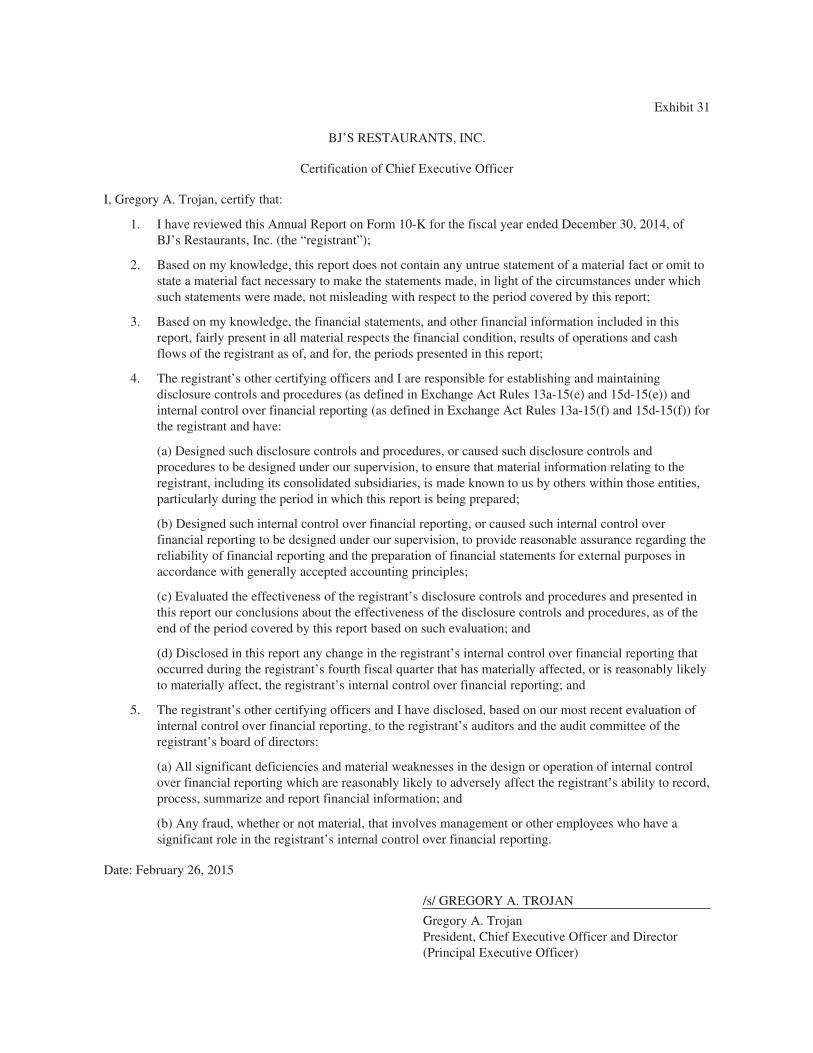
Exhibit 31
BJ’S RESTAURANTS, INC.
Certification of Chief Executive Officer
I, Gregory A. Trojan, certify that:
1. I have reviewed this Annual Report on Form 10-K for the fiscal year ended December 30, 2014, ofBJ’s Restaurants, Inc. (the “registrant”);
2. Based on my knowledge, this report does not contain any untrue statement of a material fact or omit tostate a material fact necessary to make the statements made, in light of the circumstances under whichsuch statements were made, not misleading with respect to the period covered by this report;
3. Based on my knowledge, the financial statements, and other financial information included in thisreport, fairly present in all material respects the financial condition, results of operations and cashflows of the registrant as of, and for, the periods presented in this report;
4. The registrant’s other certifying officers and I are responsible for establishing and maintainingdisclosure controls and procedures (as defined in Exchange Act Rules 13a-15(e) and 15d-15(e)) andinternal control over financial reporting (as defined in Exchange Act Rules 13a-15(f) and 15d-15(f)) forthe registrant and have:
(a) Designed such disclosure controls and procedures, or caused such disclosure controls andprocedures to be designed under our supervision, to ensure that material information relating to theregistrant, including its consolidated subsidiaries, is made known to us by others within those entities,particularly during the period in which this report is being prepared;
(b) Designed such internal control over financial reporting, or caused such internal control overfinancial reporting to be designed under our supervision, to provide reasonable assurance regarding thereliability of financial reporting and the preparation of financial statements for external purposes inaccordance with generally accepted accounting principles;
(c) Evaluated the effectiveness of the registrant’s disclosure controls and procedures and presented inthis report our conclusions about the effectiveness of the disclosure controls and procedures, as of theend of the period covered by this report based on such evaluation; and
(d) Disclosed in this report any change in the registrant’s internal control over financial reporting thatoccurred during the registrant’s fourth fiscal quarter that has materially affected, or is reasonably likelyto materially affect, the registrant’s internal control over financial reporting; and
5. The registrant’s other certifying officers and I have disclosed, based on our most recent evaluation ofinternal control over financial reporting, to the registrant’s auditors and the audit committee of theregistrant’s board of directors:
(a) All significant deficiencies and material weaknesses in the design or operation of internal controlover financial reporting which are reasonably likely to adversely affect the registrant’s ability to record,process, summarize and report financial information; and
(b) Any fraud, whether or not material, that involves management or other employees who have asignificant role in the registrant’s internal control over financial reporting.
Date: February 26, 2015
/s/ GREGORY A. TROJAN
Gregory A. TrojanPresident, Chief Executive Officer and Director(Principal Executive Officer)

BJ’S RESTAURANTS, INC.
Certification of Chief Financial Officer
I, Gregory S. Levin, certify that:
1. I have reviewed this Annual Report on Form 10-K for the fiscal year ended December 30, 2014, ofBJ’s Restaurants, Inc. (the “registrant”);
2. Based on my knowledge, this report does not contain any untrue statement of a material fact or omit tostate a material fact necessary to make the statements made, in light of the circumstances under whichsuch statements were made, not misleading with respect to the period covered by this report;
3. Based on my knowledge, the financial statements, and other financial information included in thisreport, fairly present in all material respects the financial condition, results of operations and cashflows of the registrant as of, and for, the periods presented in this report;
4. The registrant’s other certifying officers and I are responsible for establishing and maintainingdisclosure controls and procedures (as defined in Exchange Act Rules 13a-15(e) and 15d-15(e)) andinternal control over financial reporting (as defined in Exchange Act Rules 13a-15(f) and 15d-15(f)) forthe registrant and have:
(a) Designed such disclosure controls and procedures, or caused such disclosure controls andprocedures to be designed under our supervision, to ensure that material information relating to theregistrant, including its consolidated subsidiaries, is made known to us by others within those entities,particularly during the period in which this report is being prepared;
(b) Designed such internal control over financial reporting, or caused such internal control overfinancial reporting to be designed under our supervision, to provide reasonable assurance regarding thereliability of financial reporting and the preparation of financial statements for external purposes inaccordance with generally accepted accounting principles;
(c) Evaluated the effectiveness of the registrant’s disclosure controls and procedures and presented inthis report our conclusions about the effectiveness of the disclosure controls and procedures, as of theend of the period covered by this report based on such evaluation; and
(d) Disclosed in this report any change in the registrant’s internal control over financial reporting thatoccurred during the registrant’s fourth fiscal quarter that has materially affected, or is reasonably likelyto materially affect, the registrant’s internal control over financial reporting; and
5. The registrant’s other certifying officers and I have disclosed, based on our most recent evaluation ofinternal control over financial reporting, to the registrant’s auditors and the audit committee of theregistrant’s board of directors:
(a) All significant deficiencies and material weaknesses in the design or operation of internal controlover financial reporting which are reasonably likely to adversely affect the registrant’s ability to record,process, summarize and report financial information; and
(b) Any fraud, whether or not material, that involves management or other employees who have asignificant role in the registrant’s internal control over financial reporting.
Date: February 26, 2015
/s/ GREGORY S. LEVIN
Gregory S. LevinExecutive Vice President, Chief Financial Officerand Secretary(Principal Financial and Accounting Officer)

Exhibit 32
BJ’S RESTAURANTS, INC.
CERTIFICATION PURSUANT TO SECTION 906 OF THE SARBANES-OXLEY ACT OF 2003
In accordance with 18 U.S.C. Section 1350, as adopted pursuant to Section 906 of the Sarbanes-Oxley Act of2003, the undersigned, Gregory A. Trojan, Chief Executive Officer and Gregory S. Levin, Chief FinancialOfficer of BJ’s Restaurants, Inc. (the “Company”), certify to their knowledge:
(1) The Annual Report on Form 10-K of the Company for the year ended December 30, 2014, as filed with theSecurities and Exchange Commission on the date hereof (the “Report”) fully complies with the requirements ofSection 13(a) or 15(d) of the Securities Exchange Act of 1934; and,
(2) The information contained in the Report fairly presents, in all material respects, the financial condition andresults of operations of the Company.
A signed original of this written statement required by Section 906 has been provided to the Company and willbe retained by the Company and furnished to the Securities and Exchange Commission or its staff upon request.
In Witness Whereof, each of the undersigned has signed this Certification as of this February 26, 2015.
/s/ GREGORY A. TROJAN /s/ GREGORY S. LEVIN
Gregory A. Trojan Gregory S. LevinPresident and Chief Executive Executive Vice President, ChiefOfficer and Director Financial Officer and Secretary(Principal Executive Officer) (Principal Financial and Accounting Officer)

Kevin E. MayerExecutive Vice President andChief Marketing Officer
John D. AllegrettoChief Supply Chain Officer
Brian S. KrakowerChief Information Officer
Sheamus W. FeeleySenior Vice President, Culinary and Kitchen Innovation
Ame I. HullSenior Vice President, Operations Services
Lon F. LedwithSenior Vice President,Restaurant Operations
Kendra D. MillerSenior Vice President and General Counsel
Christopher P. PinsakSenior Regional Vice President, Operations
Alexander M. PuchnerSenior Vice President, Brewing Operations
Luis J. RuvalcabaSenior Regional Vice President, Operations
Stephen J. DemetorVice President, Construction
Ryan M. FesslerVice President, Accounting and Corporate Controller
Donald M. Gardner, Jr.Vice President, Facilities
Roger OrtizVice President, Restaurant Planning
Jeffrey R. PrestonVice President, Purchasing
Eric M. BermanRegional Vice President, Operations
Maurice P. RobiglioRegional Vice President, Operations
Robert B. DeLiemaPresident, BJ’s Restaurants Foundation
B O A R D O F D I R E C T O R S
Gerald W. DeitchleChairman of the Board,BJ’s Restaurants, Inc.
Gregory A. TrojanPresident and Chief Executive Officer,BJ’s Restaurants, Inc.
Peter A. BassiRetired Chairman,Yum! Restaurants International
Larry D. BoutsInvestor/Business Advisor;Former Chairman andChief Executive Officer,Six Flags Theme Parks
James A. Dal PozzoChairman and Chief Executive Officer,The Jacmar Companies
Noah A. ElbogenInvestment Analyst, Luxor Capital Group, LP
J. Roger KingRetired Senior Vice President,Human Resources, PepsiCo, Inc.
Mark A. McEachenChief Executive Officer,Dolan Media, Inc.
Wesley A. NicholsCo-founder and Chief Executive Officer, MarketShare
Lea Anne S. OttingerStrategic Business Consultant;Managing Partner, LMR Advisors
Patrick D. WalshManaging Member and Chief Executive Officer of PW Partners, LLC and PW Partners Atlas Funds, LLC
L E A D E R S H I P T E A M
Gregory A. TrojanPresident and Chief Executive Officer
Gregory S. LevinExecutive Vice President andChief Financial Officer and Secretary
Gregory S. LyndsExecutive Vice President andChief Development Officer
C O R P O R AT E O F F I C E S
Restaurant Support CenterBJ’s Restaurants, Inc.7755 Center Avenue, Suite 300Huntington Beach, California 92647(714) 500-2400www.bjsrestaurants.com
C O M M O N S T O C K
The Company’s common stock is traded on the NASDAQ stock market under the symbol “BJRI.”
L E G A L C O U N S E L
Jeffer, Mangels, Butler & Mitchell, LLPLos Angeles, California
I N D E P E N D E N T R E G I S T E R E D P U B L I C A C C O U N T I N G F I R M
Ernst & Young LLPIrvine, California
I N V E S T O R R E L AT I O N S
Inquiries from shareholders, analysts or prospective investors should be directed to:
Gregory S. LevinExecutive Vice President,Chief Financial Officer and Secretary(714) [email protected]
T R A N S F E R A G E N T
Inquiries for stock transfer requirements, lost certificates and changes to addresses should be directed to:
Computershare Trust Company, N.A.250 Royall StreetCanton, Massachusetts 02021(800) 962-4284www.computershare.com
A N N U A L M E E T I N G
June 2, 2015At the Restaurant Support Center ofBJ’s Restaurants, Inc.7755 Center Avenue, 4th FloorHuntington Beach, California 92647
An
nual
Rep
ort
Des
ign
by C
urra
n &
Con
nors
, Inc
. / w
ww
.cur
ran-
conn
ors.c
om
2 014 A N N U A L R E P O R T
corporate INFORMATION: