Embed Size (px)
Citation preview
Bkg modeling for hot Bkg modeling for hot medium z Clustersmedium z Clusters
Alberto Leccardi Alberto Leccardi
Silvano MolendiSilvano Molendi
Focus Focus
Bkg treatment for:Bkg treatment for:
Low SB Low SB
Extended emission NOT filling FOVExtended emission NOT filling FOV
Hard Band 1.5,2.0-10 keVHard Band 1.5,2.0-10 keV
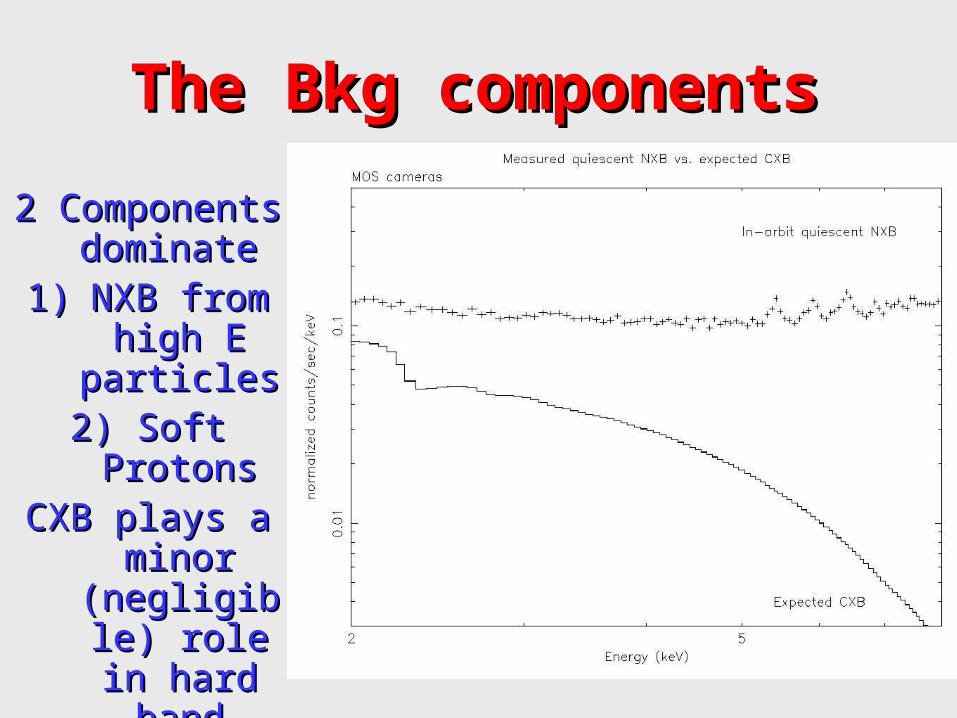
The Bkg components The Bkg components
2 Components 2 Components dominate dominate
1)1) NXB from NXB from high E high E
particles particles 2) Soft 2) Soft ProtonsProtons
CXB plays a CXB plays a minor minor
(negligible) (negligible) role in role in
hard bandhard band
Some Considerations Some Considerations
Double Subtraction not particularly usefullDouble Subtraction not particularly usefull
• SP spectrum variable in time, vignetted SP spectrum variable in time, vignetted (possibly with time dependent vignetting) (possibly with time dependent vignetting) very difficult to calibratevery difficult to calibrate
• Best option is to remove it to the best of Best option is to remove it to the best of our ability our ability
• High E NXB spectrum does not vary with High E NXB spectrum does not vary with intensity (De Luca & Molendi 2004) can be intensity (De Luca & Molendi 2004) can be accounted for through simple renorm.accounted for through simple renorm.
The Recipe The Recipe 1.1. Cut data with fixed thrs. (better than Cut data with fixed thrs. (better than
sigma clipping or growth curve) Allows a sigma clipping or growth curve) Allows a homogenous treatment for different homogenous treatment for different sources and for background datasources and for background data
2.2. Apply In/Out Diagnostic (De Luca & Apply In/Out Diagnostic (De Luca & Molendi 2004) to MOS and pn (new!)Molendi 2004) to MOS and pn (new!)
3.3. Remove observation significantly (more Remove observation significantly (more than 20% of total bkg contributed by soft than 20% of total bkg contributed by soft protons) contaminated by “quasi quiscent” protons) contaminated by “quasi quiscent” soft proton component that cannot be soft proton component that cannot be cleaned through data thrs.cleaned through data thrs.
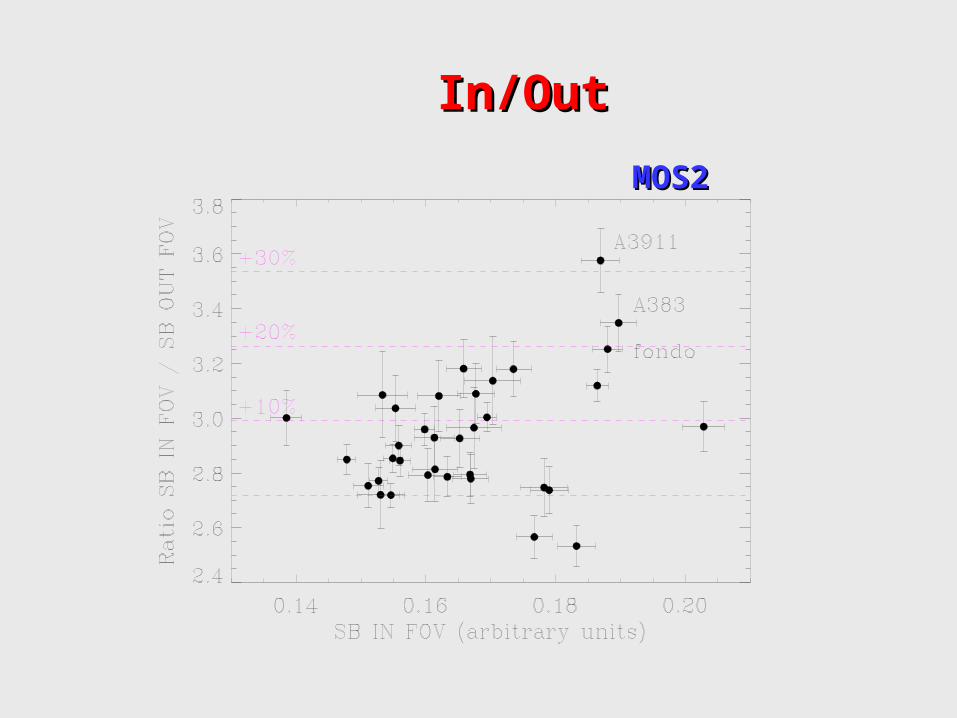
In/OutIn/Out
MOS2MOS2
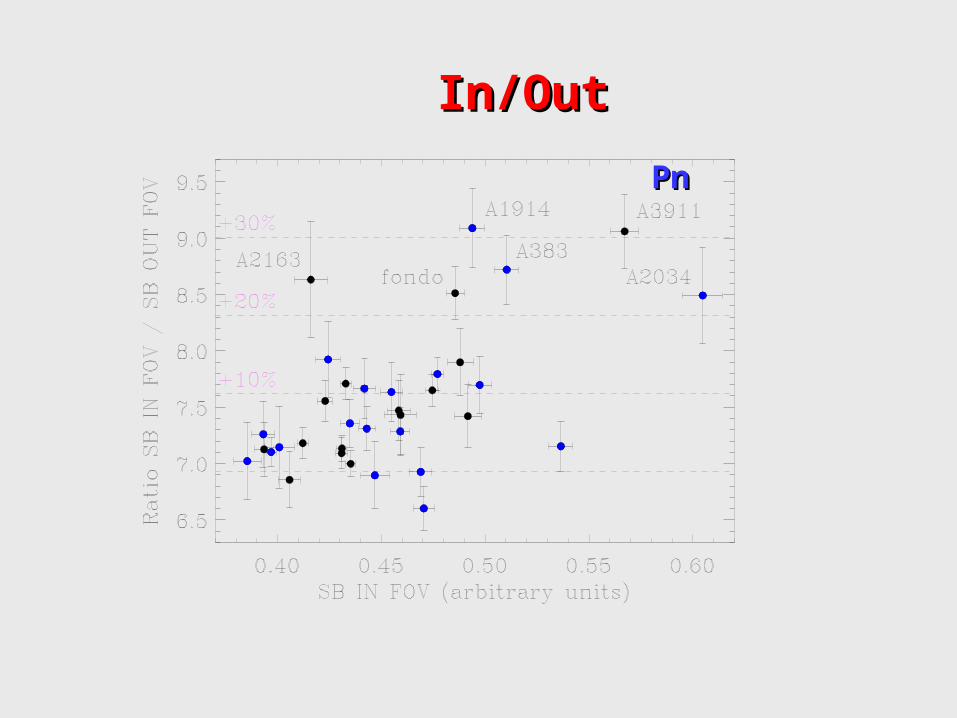
In/OutIn/Out
PnPn
In/OutIn/Out
No difference in distribution of eFF (blue) and FF (black)
points
Pn Out of FOV contaminated from SP because of OOT events,
however data has been thresholded, SP contamination
outside FOV should be very modest.
The Recipe The Recipe • Produce bkg compilation with exp time > Produce bkg compilation with exp time >
600 ks. 600 ks. • Bkg Expo Time has to be 20-30 times longer Bkg Expo Time has to be 20-30 times longer
than typical source observation than typical source observation • Statistical error in bkg subtraction is almost Statistical error in bkg subtraction is almost
all due to source statisticsall due to source statistics• Bkg observations processed in the same Bkg observations processed in the same
way as the source observation.way as the source observation.
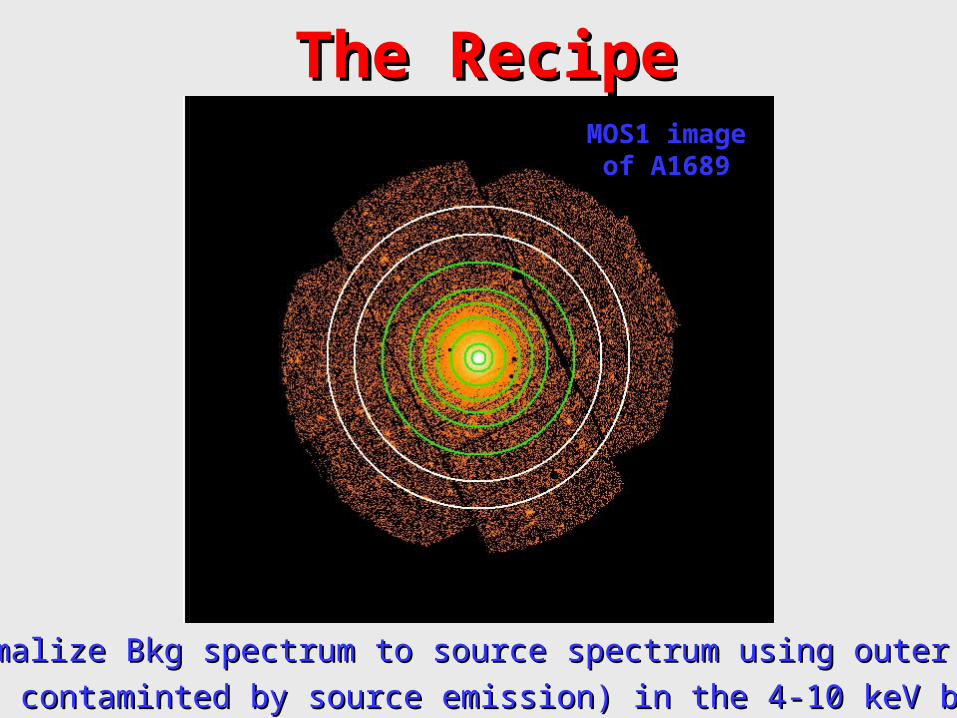
The RecipeThe RecipeMOS1 image MOS1 image
of A1689of A1689
Renormalize Bkg spectrum to source spectrum using outer ring Renormalize Bkg spectrum to source spectrum using outer ring
(not contaminted by source emission) in the 4-10 keV band.(not contaminted by source emission) in the 4-10 keV band.
The Recipe The Recipe
The use of a band as similar as possible to the The use of a band as similar as possible to the one used for spectral fitting reduces the one used for spectral fitting reduces the
systematic error in T measurement systematic error in T measurement associated to the difference in spectral associated to the difference in spectral
shape of the bkg in the source and shape of the bkg in the source and background observation. background observation.
The Recipe The Recipe
The tacit assumption in the renorm procedure is that The tacit assumption in the renorm procedure is that the bkg in the sou and bkg observation have the the bkg in the sou and bkg observation have the same spectral shape, this is true to the best of same spectral shape, this is true to the best of our knowledge for the high E NXB, it is not for our knowledge for the high E NXB, it is not for
the SP background. Differences in the small but the SP background. Differences in the small but still not negligible SP contribution to the still not negligible SP contribution to the
background in the sou and bkg observations may background in the sou and bkg observations may lead to slightly different bkg spectral shapes. The lead to slightly different bkg spectral shapes. The
impact on the T measure is minimized by impact on the T measure is minimized by performing the norm in a band as similar as performing the norm in a band as similar as possible to the one used for spectral fitting. possible to the one used for spectral fitting.
The Effect of SP The Effect of SP contamination on MOS contamination on MOS
and Pn and Pn
ΔT/T variation of best fit T with respect to that found when using standard thrs
vsΔQ/Q relative variation of Q (norm factor)
with respect to that found when using standard thrs
Raise the SP threshold to allow more SP in the source Raise the SP threshold to allow more SP in the source observation and see what happens to T measuresobservation and see what happens to T measures
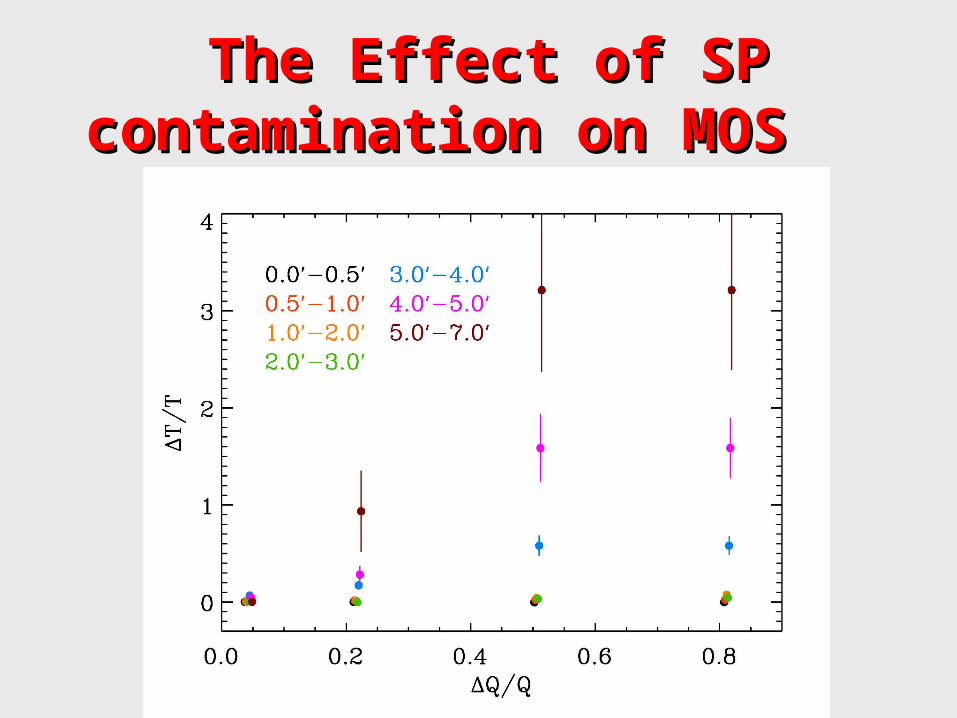
The Effect of SP The Effect of SP contamination on MOS contamination on MOS
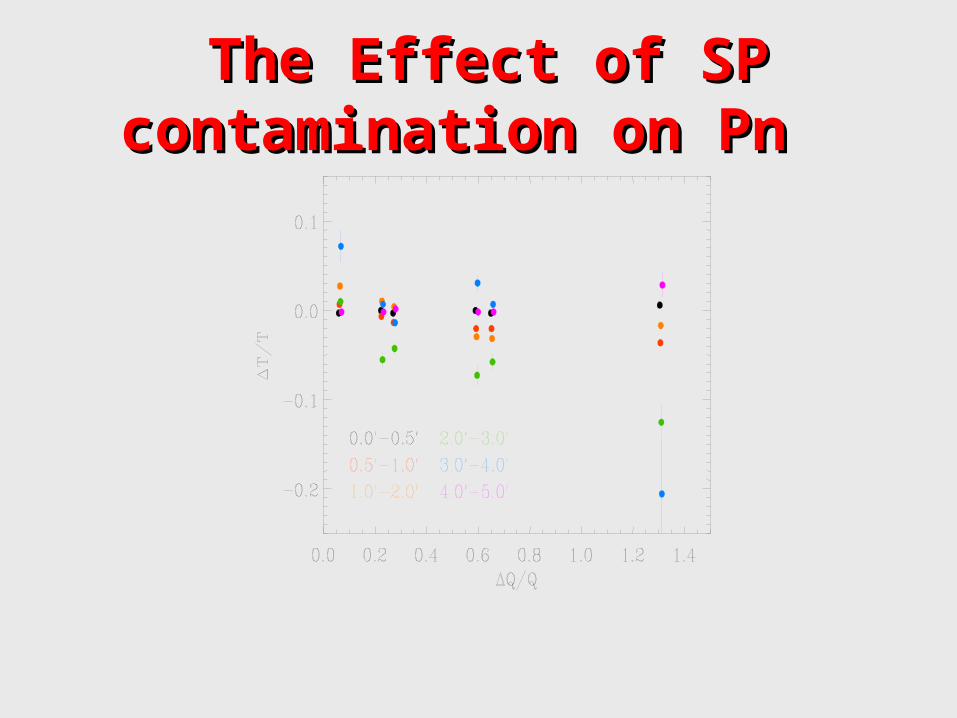
The Effect of SP The Effect of SP contamination on Pn contamination on Pn
MOS vs PnMOS vs Pn
1.1.In MOS the SP spectrum is typically In MOS the SP spectrum is typically harder than the NXB high E harder than the NXB high E spectrum, a simple renormalization spectrum, a simple renormalization when the sou obs is badly when the sou obs is badly contaminated by SP will lead to a contaminated by SP will lead to a systematically higher T.systematically higher T.
2.2.In Pn the SP spectrum is very similar In Pn the SP spectrum is very similar in shape to the NXB high E in shape to the NXB high E spectrum, renorm when spectrum is spectrum, renorm when spectrum is badly contaminated by SP will lead badly contaminated by SP will lead to errors in T of the order of 5-10%, to errors in T of the order of 5-10%, with higher or lower T found with higher or lower T found depending on the specific SP depending on the specific SP spectrum.spectrum.
Spectral fittingSpectral fitting
Since we are interested in T> 4 Since we are interested in T> 4 keV spectral fitting is done in a keV spectral fitting is done in a hard band we have tried 1.5-10 hard band we have tried 1.5-10
keV and 2-10 keVkeV and 2-10 keV
How far down do we How far down do we go?go?
With this technique we get reliable T estmates for sou/bkg down to 20% in some cases 15%.
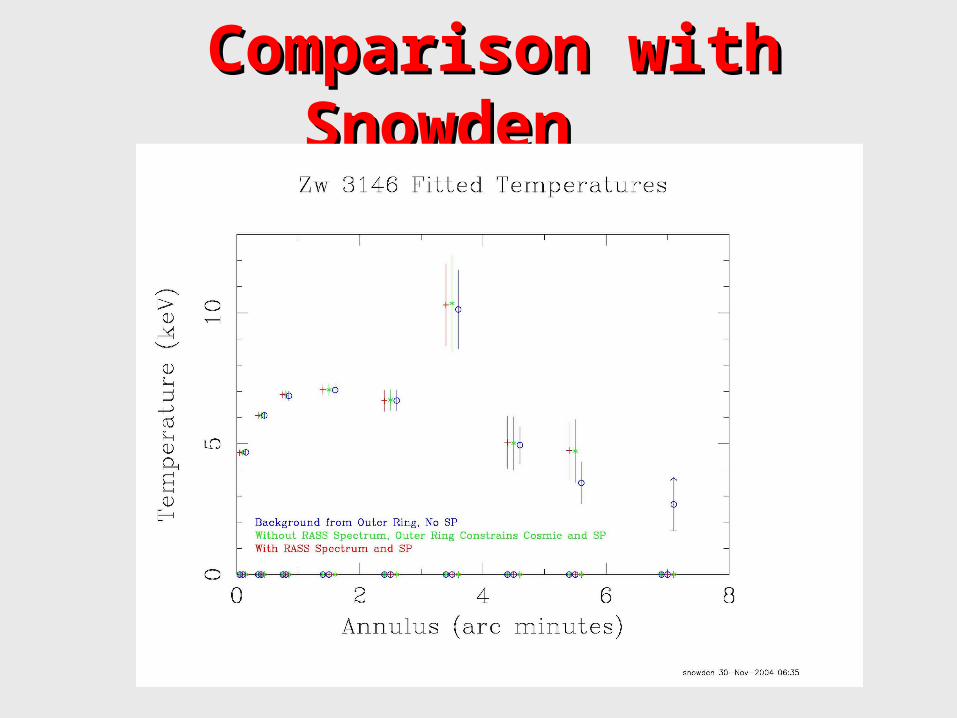
Comparison with Comparison with Snowden Snowden
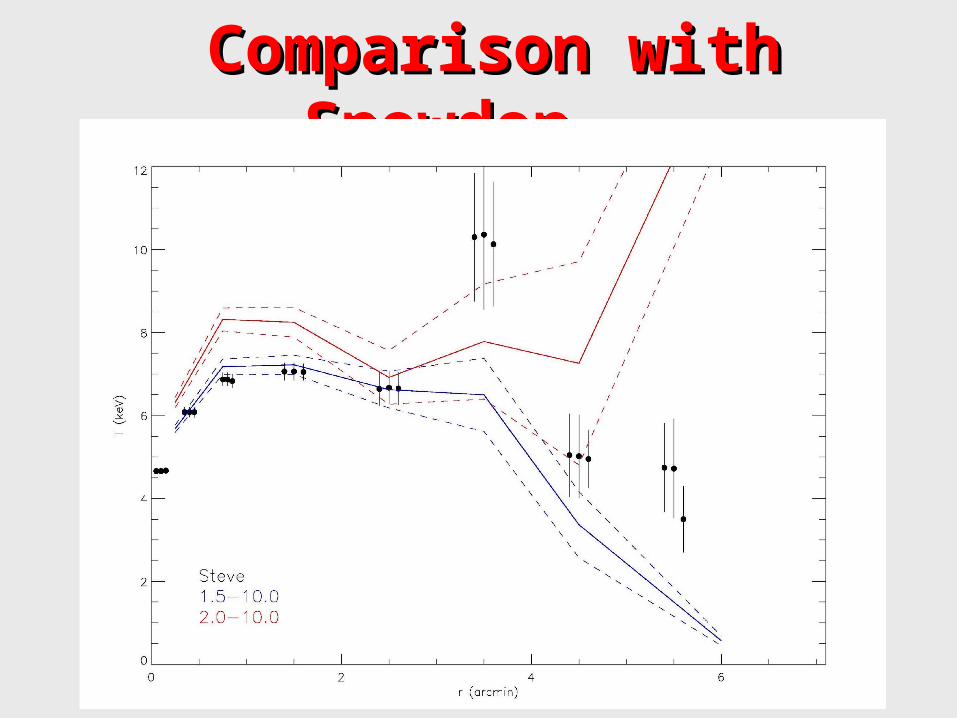
Comparison with Comparison with Snowden Snowden


![tt signal tauola tt bkg tauola tt signal madgraph tt bkg madgraph mm179.80.255181.60.71 InvM ]76,106[136.70139.10.48 MET>5077.55077.50.19 Btag1>1.75](https://img.pdfslide.net/doc/110x75/56649c785503460f9492e033/-tt-signal-tauola-tt-bkg-tauola-tt-signal-madgraph-tt-bkg-madgraph-mm179802551816071.jpg)