Embed Size (px)
Citation preview

Black, Asian and Minority Ethnic disproportionality in the Criminal Justice System in England and Wales
Noah Uhrig Ministry of Justice
Ministry of Justice Analytical Services 2016

Analytical Services exists to improve policy making, decision taking and practice
by the Ministry of Justice. It does this by providing robust, timely and relevant
data and advice drawn from research and analysis undertaken by the
department’s analysts and by the wider research community.
Disclaimer The views expressed are those of the authors and are not necessarily shared by the Ministry
of Justice (nor do they represent government policy).
First published 2016
© Crown copyright 2016
This publication is licensed under the terms of the Open Government Licence v3.0 except
where otherwise stated. To view this licence, visit nationalarchives.gov.uk/doc/open-
government-licence/version/3 or write to the Information Policy Team, The National Archives,
Kew, London TW9 4DU, or email: [email protected]
Where we have identified any third party copyright information you will need to obtain
permission from the copyright holders concerned.
Any enquiries regarding this publication should be sent to us at
This publication is available for download at http://www.justice.gov.uk/publications/research-
and-analysis/moj
ISBN 978-1-84099-767-5
Contents
List of tables
List of figures
1. Introduction 1
2. Background 3
3. The Relative Rate Index model 4
4. Data and Measures 7
5. Findings 9
5.1 Arrests, charging and prosecution 12
5.2 Court experiences 16
5.3 Issues arising for specific offences 20
5.4 Prison experiences 23
5.5 Reoffending 25
6. Implications 28
Appendix 1 31
Detailed description of assumptions and measures used in the analysis 31
Appendix 2 35
RRI assessment of court processes by detailed age, sex, ethnicity
and offence group 37
List of tables
Table 5.1. Relative Rate Index, 2014, arrest, charging and prosecutions, all groups relative to the white ethnic group 13
Table 5.2. Relative Rate Index, 2014, magistrates’ court experience, all groups relative to the white ethnic group 17
Table 5.3. Relative Rate Index, 2014, Crown Court experience, all groups relative to the white ethnic group 18
Table 5.4. Placement in a high security prison, RRI of each ethnic group versus the white ethnic group, adult males, mid-year 2015 24
Table 5.5. Adjudications brought and proven, RRI of each ethnic group versus white, adult males and females, 2015 24
Table 5.6. Release on temporary licence, RRI of each ethnic group versus white, adult males and females, 2015 25
Table 5.7. Temporary licences granted for training, apprenticeship, employment as a proportion of all temporary licences granted, RRI of each ethnic group versus white, adult males and females, 2015 26
Table 5.8. Proven reoffending, RRI of each ethnic group relative to the white ethnic group, 2013 cohort 27
Table A1.1. Rates calculated for comparison, their definition and data sources 35
Table A2.1. Relative Rate Index, 2014, court experience of black young males relative to white young males (aged 10 to 17) 37
Table A2.2. Relative Rate Index, 2014, court experience of Asian young males relative to white young males (aged 10 to 17) 38
Table A2.3. Relative Rate Index, 2014, court experience of mixed ethnic young males relative to white young males (aged 10 to17) 39
Table A2.4. Relative Rate Index, 2014, court experience of Chinese and other ethnic young males relative to white young males (aged 10 to 17) 40
Table A2.5 Relative Rate Index, 2014, court experience of black young females relative to white young females (aged 10 to 17) 41
Table A2.6. Relative Rate Index, 2014, court experience of Asian young females relative to white young females (aged 10 to 17) 42
Table A2.7. Relative Rate Index, 2014, court experience of mixed ethnic young females relative to white young females (aged 10 to 17) 43
Table A2.8. Relative Rate Index, 2014, court experience of Chinese and other ethnic young females relative to white young females (aged 10 to 17) 44
Table A2.9. Relative Rate Index, 2014, court experience of black men relative to white men (aged 18 and over) 45
Table A2.10. Relative Rate Index, 2014, court experience of Asian men relative to white men (aged 18 and over) 46
Table A2.11. Relative Rate Index, 2014, court experience of mixed ethnic men relative to white men (aged 18 and over) 47
Table A2.12. Relative Rate Index, 2014, court experience of Chinese and other ethnic men relative to white men (aged 18 and over) 48
Table A2.13. Relative Rate Index, 2014, court experience of black women relative to white women (aged 18 and over) 49
Table A2.14. Relative Rate Index, 2014, court experience of Asian women relative to white women (aged 18 and over) 50
Table A2.15. Relative Rate Index, 2014, court experience of mixed ethnic women relative to white women (aged 18 and over) 51
Table A2.16. Relative Rate Index, 2014, court experience of Chinese and other ethnic women relative to white women (aged 18 and over) 52
List of figures
Figure 3.1. Diagram depicting the flow through criminal justice system pipeline (bar sizes are only approximately proportionate to actual volumes) 5
Figure 5.1. Relative Rate Index for court experiences, BAME young males relative to white young males, 2014 (striped bars indicate no difference between groups) 9
Figure 5.2. Relative Rate Index for court experiences, BAME young females versus white young females, 2014 (* indicates RRI could not be calculated due to too few cases, striped bars indicate no difference between groups) 10
Figure 5.3. Relative Rate Index for court experiences, BAME men versus white men, 2014 10
Figure 5.4. Relative Rate Index for court experiences, BAME women versus white women, 2014 11

1. Introduction
The landscape of disproportionality for black, Asian and minority ethnic (BAME) individuals in
the criminal justice system (CJS) is complex. Policing and specific policies, such as stop and
search, are well evidenced and the subject of considerable debate in this arena.1 There is
less published evidence on disproportionality from the point of Crown Prosecution Service
(CPS) involvement onwards in the CJS. Therefore, this analysis aims to identify key pinch-
points in the CJS from this point onward, focusing on identifying where disproportionality
becomes more pronounced and may therefore warrant further explanatory investigation.
This paper contributes to an independent review led by the Rt Hon David Lammy (MP)
considering the treatment of, and outcomes for, BAME adults and young people within the
CJS in England and Wales.
This paper addresses the following research questions:
• Where is disproportionate BAME contact with the CJS more pronounced?
• To what extent is disproportionate BAME contact with the CJS paralleled in the
youth system compared to the adult system?
• To what extent is disproportionate BAME contact with the CJS paralleled for
males and females?
Analysis of management information data showed large BAME disproportionate contact
occurring at the point of arrest with small contributions to BAME disproportionate contact
emerging at subsequent stages in the CJS. Some areas – such as CPS charging and
convictions – found white ethnic groups experienced small levels of disproportionate
outcomes. Nevertheless, areas within the CJS post-arrest where BAME disproportionality
was found to be particularly pronounced included:
• being tried at Crown Court rather than magistrates’ court;
• custodial remand and plea at Crown Court;
• custodial sentencing; and
• adjudications of prison discipline.
1 For example, see http://www.youngreview.org.uk/sites/default/files/clinks_young-review_report_dec2014.pdf, page 31
1

The analysis also found that the pattern of disproportionality across the CJS for BAME adult
males and females was broadly similar. However, BAME young males2 experienced
noticeably different disproportionality, particularly in the magistrates’ courts, compared to
both BAME young females and adults.
2 The terms ‘youth’, ‘young males’ and ‘young females’ refer to individuals aged 10 to 17. The terms ‘adults’, ‘men’ and ‘women’ refer to individuals aged 18 and over.
2
2. Background
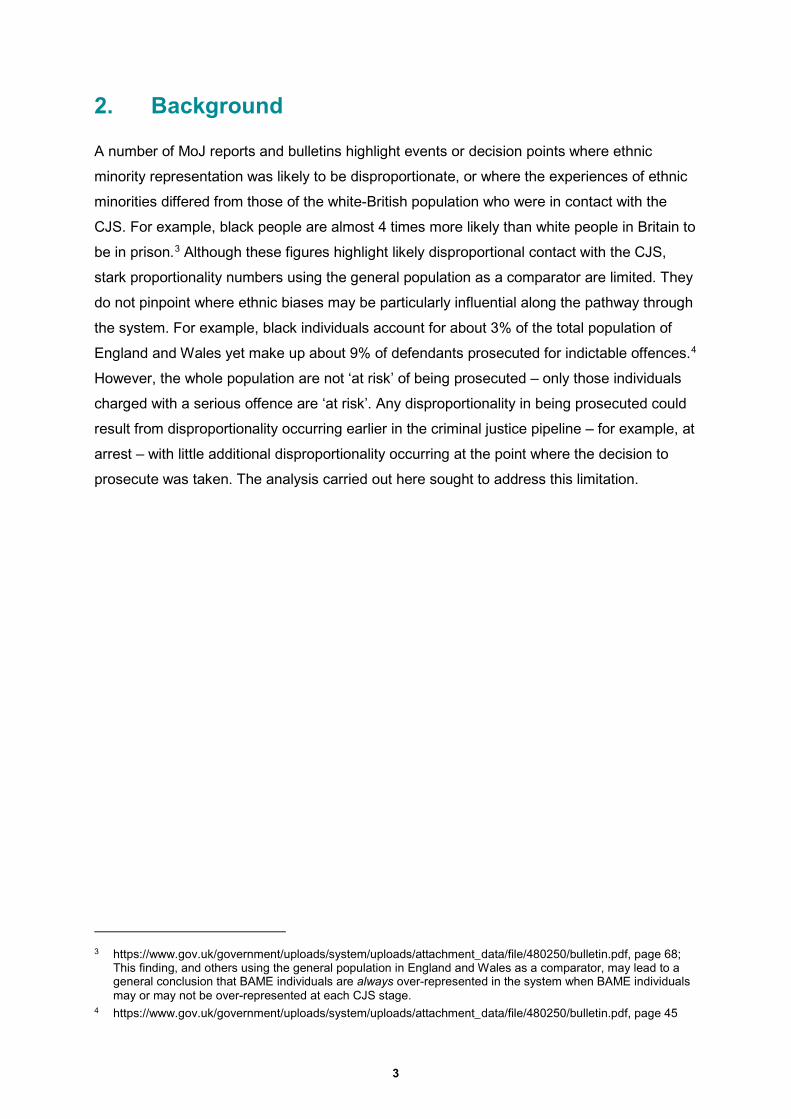
A number of MoJ reports and bulletins highlight events or decision points where ethnic
minority representation was likely to be disproportionate, or where the experiences of ethnic
minorities differed from those of the white-British population who were in contact with the
CJS. For example, black people are almost 4 times more likely than white people in Britain to
be in prison.3 Although these figures highlight likely disproportional contact with the CJS,
stark proportionality numbers using the general population as a comparator are limited. They
do not pinpoint where ethnic biases may be particularly influential along the pathway through
the system. For example, black individuals account for about 3% of the total population of
England and Wales yet make up about 9% of defendants prosecuted for indictable offences.4
However, the whole population are not ‘at risk’ of being prosecuted – only those individuals
charged with a serious offence are ‘at risk’. Any disproportionality in being prosecuted could
result from disproportionality occurring earlier in the criminal justice pipeline – for example, at
arrest – with little additional disproportionality occurring at the point where the decision to
prosecute was taken. The analysis carried out here sought to address this limitation.
3 https://www.gov.uk/government/uploads/system/uploads/attachment_data/file/480250/bulletin.pdf, page 68; This finding, and others using the general population in England and Wales as a comparator, may lead to a general conclusion that BAME individuals are always over-represented in the system when BAME individuals may or may not be over-represented at each CJS stage.
4 https://www.gov.uk/government/uploads/system/uploads/attachment_data/file/480250/bulletin.pdf, page 45
3
3. The Relative Rate Index model
The aim of this paper was to identify the stages in the CJS where disproportionality
increased or decreased for BAME individuals with a view to identifying where further
explanatory investigation may be warranted. Drawing on existing management information
data from England and Wales, the analysis in this paper replicated the US Department of
Justice Office of Juvenile Justice and Delinquency Prevention’s Relative Rate Index (RRI)5
to locate disproportionate minority contact with the CJS, post CPS engagement.
The RRI allows for the identification of specific stages, decision points or junctures in the
CJS where disproportionality emerges. Simply put, the RRI is a means of comparing the
rates of CJS contact experienced by different groups. A rate was defined as the count of
persons experiencing an event or outcome out of the total number of people who were ‘at
risk’ for experiencing the event or outcome. Rates for each ethnic group relative to the white
ethnic group were compared to determine whether they were significantly different from one
another.
The RRI has specific advantages over other methods of assessing disproportionality. First,
the index is calculated for the specific people ‘at risk’ for particular outcomes at the system
juncture rather than the general population as a whole. If one thinks of the CJS as a
sequential set of individual decisions, the RRI concept could be used to assess the level of
BAME disproportionality introduced at each decision point. This is achieved through careful
definition of the number of people experiencing an event or outcome and those ‘at risk’ for
experiencing that outcome. Figure 3.1 shows how the CJS functions as a flow of individuals
where people drop out of the system at various points. Clearly, only those individuals present
in the system at the immediately prior stage are ‘at risk’ of moving through to the next
decision point.
5 C Puzzanchera and S Hockenberry, ‘National Disproportionate Minority Contact Databook’, 2014. Developed by the National Center for Juvenile Justice for the Office of Juvenile Justice and Delinquency Prevention. Available online: http://www.ojjdp.gov/ojstatbb/dmcdb/
4
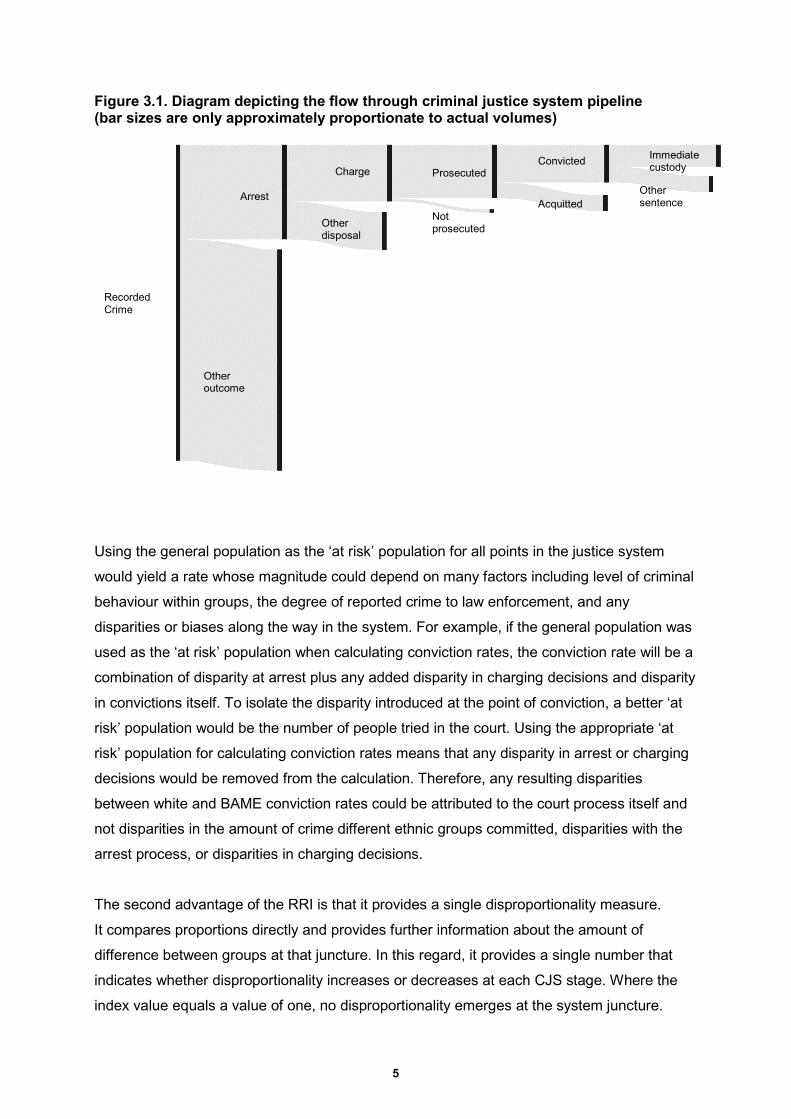
Figure 3.1. Diagram depicting the flow through criminal justice system pipeline (bar sizes are only approximately proportionate to actual volumes)
Arrest
Other outcome
Charge
Other disposal
Prosecuted
Not prosecuted
Convicted
Acquitted
Immediate custody
Other sentence
Recorded Crime
Using the general population as the ‘at risk’ population for all points in the justice system
would yield a rate whose magnitude could depend on many factors including level of criminal
behaviour within groups, the degree of reported crime to law enforcement, and any
disparities or biases along the way in the system. For example, if the general population was
used as the ‘at risk’ population when calculating conviction rates, the conviction rate will be a
combination of disparity at arrest plus any added disparity in charging decisions and disparity
in convictions itself. To isolate the disparity introduced at the point of conviction, a better ‘at
risk’ population would be the number of people tried in the court. Using the appropriate ‘at
risk’ population for calculating conviction rates means that any disparity in arrest or charging
decisions would be removed from the calculation. Therefore, any resulting disparities
between white and BAME conviction rates could be attributed to the court process itself and
not disparities in the amount of crime different ethnic groups committed, disparities with the
arrest process, or disparities in charging decisions.
The second advantage of the RRI is that it provides a single disproportionality measure.
It compares proportions directly and provides further information about the amount of
difference between groups at that juncture. In this regard, it provides a single number that
indicates whether disproportionality increases or decreases at each CJS stage. Where the
index value equals a value of one, no disproportionality emerges at the system juncture.
5
BAME disproportionality increases at a juncture where the index value is greater than one
and decreases at a juncture where the index value is less than one. RRI values between
zero and one, and one and two are reported here in percentage terms, for example ‘40%
less likely’ or ‘40% more likely’. RRI values of 2 or greater are reported here in multiples, for
example ‘2 times more likely’. By adding a ‘difference of proportions’ statistical test, this
summary measure could be used to locate at which stage in the system disproportionality
became particularly pronounced.
The analysis presented in this paper is descriptive of the CJS. It starts with arrest, which
affects the volume through the system. It shows the marginal effects on the volume at
specific stages. As far as possible it compares like-for-like cases by controlling for gender,
age and offence type but not for the existence or level of violence of the committed offence
nor geographical variation. This analysis does not follow a cohort of individuals through the
CJS but instead describes the experiences of groups at stages in the system. It cannot
describe the experiences of highly-specific groups, nor can it be used to discern a time trend.
The RRI method is a comparison of group rates, therefore stages where BAME
disproportionality decreases necessarily implies that white ethnic group disproportionality
increases at that point.
6
4. Data and Measures
In conducting the analysis for this paper, it was necessary to select the appropriate ‘at risk’
population and to isolate and identify major decision points where disproportionality could
arise. Therefore the RRI here was calculated from arrest onwards as it was the arrested
population who ultimately got charged and prosecuted by the CPS.
Appendix 1 contains details of the assumptions made, specific rates, calculations, and data
sources used in this analysis. The data for this exercise mostly came from multiple
management information sources for which data extracts are readily available. The majority
of these data exist as published national statistics, whilst the CPS provided non-public data
for inclusion in this report.6 As far as possible the most recent data was used. This generally
related to 2014 for court information and 2015 for prison information.7 The major CJS
decision points investigated include the following:
• Arrest
• CPS Charge
• Proceeding at magistrates’ court
• Conviction at magistrates’ court
• Custodial sentence at magistrates’ court
• Trial at Crown Court
• Plea at Crown Court
• Custodial remand at Crown Court
• Conviction at Crown Court
• Custodial sentencing at Crown Court
• Placement in the high security prison estate
• Adjudications brought and proven
• Release on temporary licence (ROTL)
• Proven reoffending8
6 This analysis assumes that national statistical publications use robust measures in addressing any data quality issues, such as missing data.
7 Please see Table A1.1 in Appendix 1 for a summary of data sources used in this analysis. 8 This is not an exhaustive list of areas where disproportionality could be investigated using this RRI method.
7
England and Wales distinguish between 3 types of offence categories: summary, indictable
and triable-either-way. Apart from calculations involving arrest data, the analysis in this paper
excluded summary offences.9
All rates were calculated at the most granular level possible from the combined data in terms
of age, sex, ethnicity and primary or most serious offence. The following categories were
used:
• broad ethnic groups based on self-identification (1) white, (2) black, (3) Asian,
(4) mixed ethnic, and (5) other ethnic including Chinese, and
• adults were aged 18 or older while youth were aged 10 to 17.
It is recognised that the method of ethnic group classification used in the analyses could
conceal the complexities of criminal justice experiences that may exist at a more detailed
ethnic identity level. However, directly comparable rates could not be calculated at higher
levels of granularity because there were too few cases either ‘at risk’ for the event or
experiencing the event itself. Indeed, small numbers affect the analysis even at the levels of
granularity used here – particularly for young females. Rates were only calculated where 30
or more individuals were ‘at risk’ for the event happening or where 10 or more individuals
experienced the target event.
Once rates were obtained, the RRI comparing the detailed ethnic group classification against
the white ethnic group was calculated within each detailed sex, age and offence group.
Additionally, statistical significance tests were calculated comparing the detailed BAME
group rates relative to the white group to determine which RRI were important to overall
disproportionality across the system.10
9 The police, rather than the CPS, routinely charge summary offences which are also typically not contested in court. For these reasons, this analysis excluded summary offences where doing so was possible.
10 This analysis applied statistical tests for differences in proportions and rates between groups that were appropriate for truncated distributions - with zero as a minimum, for instance. Differences between groups were judged to be statistically significant if there was less than 5% likelihood that the difference was due to chance.
8
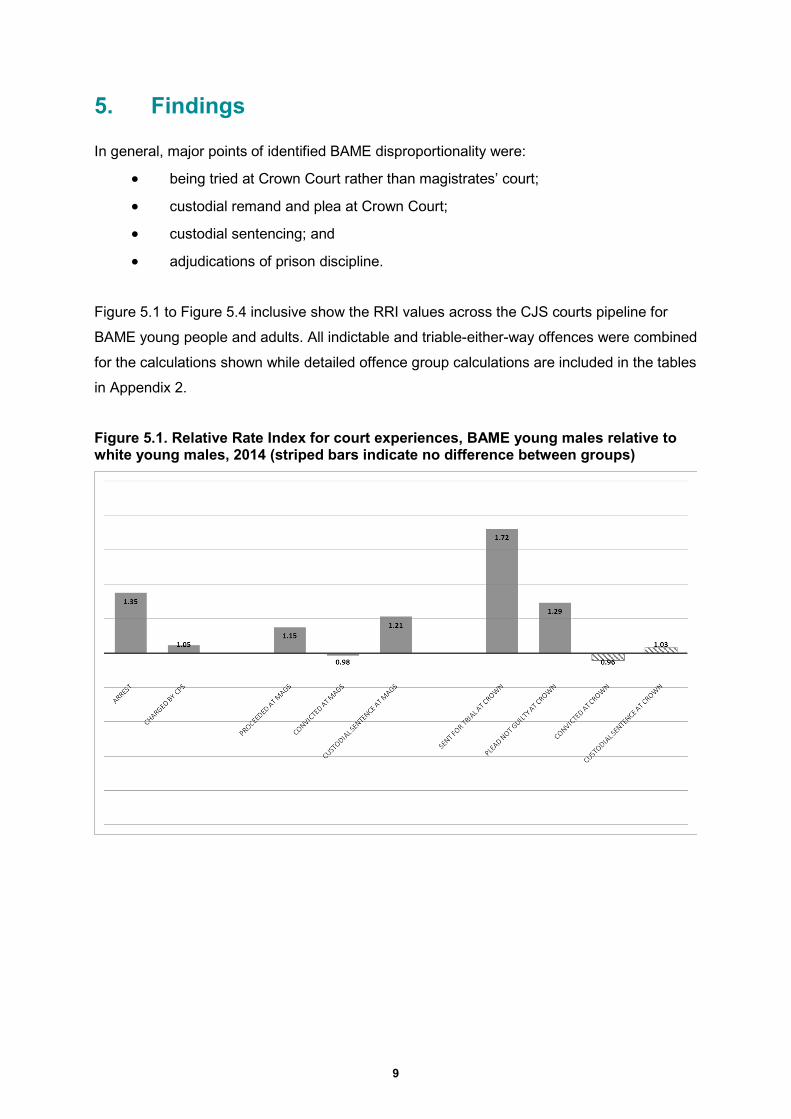
5. Findings
In general, major points of identified BAME disproportionality were:
• being tried at Crown Court rather than magistrates’ court;
• custodial remand and plea at Crown Court;
• custodial sentencing; and
• adjudications of prison discipline.
Figure 5.1 to Figure 5.4 inclusive show the RRI values across the CJS courts pipeline for
BAME young people and adults. All indictable and triable-either-way offences were combined
for the calculations shown while detailed offence group calculations are included in the tables
in Appendix 2.
Figure 5.1. Relative Rate Index for court experiences, BAME young males relative to white young males, 2014 (striped bars indicate no difference between groups)
9

Figure 5.2. Relative Rate Index for court experiences, BAME young females versus white young females, 2014 (* indicates RRI could not be calculated due to too few cases, striped bars indicate no difference between groups)
Figure 5.3. Relative Rate Index for court experiences, BAME men versus white men, 2014
10

Figure 5.4. Relative Rate Index for court experiences, BAME women versus white women, 2014
As previously stated, the RRI represents the level of disproportionality occurring at the
specific system juncture labelled independent of any disproportionality occurring at an earlier
point in this system. Taken together, Figure 5.2 to Figure 5.4 show some consistencies
across groups. BAME young males and adults were more likely than the white group to be
arrested. BAME young females and adults were less likely to be charged by the CPS than
the white group. BAME males, both youth and adults, and BAME women were all more likely
to be tried at the Crown Court compared to the white group. Finally, BAME adults, both male
and female, were more likely to receive custodial sentences at the Crown Court compared to
the white group. These results are now broken down in more detail.
11
5.1 Arrests, charging and prosecution Table 5.1 shows the RRI values for arrest, charging and prosecution broken down by a more
detailed categorisation of ethnicity. Although empirical analysis of self-reported offending
suggests BAME groups are less likely to commit crime,11 arrest rates were generally higher
across ethnic groups in comparison to the white group. Specifically:
• black young males were just under 3 times more likely than white young males to
be arrested;
• black men were greater than 3 times more likely to be arrested than white men;
• mixed ethnic men were greater than 2 times more likely to be arrested than white
men; and
• both black and mixed ethnic women were greater than 2 times more likely to be
arrested than white women.
Notable exceptions to this pattern were for Asian young males and Asian females, all of
whom were significantly less likely than the white group to be arrested. While arrest, and the
involvement of the police, is expressly outside the remit of this Review, it was important to
report data on disproportionality at arrest as this influences the raw number of defendants
proceeding through the courts system and ultimately into prison if convicted and sentenced.
If disproportionality does not emerge at later points in the CJS, then disproportionality at later
points, such as in the prison population, could be explained by these differences in arrests.
The analysis found that the system itself did add some degree of disproportionality at
subsequent stages, however rarely at the levels seen in arrest differences. In some
instances, white groups experienced greater disproportionate outcomes compared to
BAME groups.
11 See UK Home Office. Research, Development and Statistics Directorate. Offending Surveys and Research, National Centre for Social Research and BMRB. Social Research, ‘Offending, Crime and Justice Survey, 2003 [computer file]. 3rd Edition’ (Colchester, Essex: UK Data Archive [distributor], August 2008. SN: 5248)
12

Table 5.1. Relative Rate Index, 2014, arrest, charging and prosecutions, all groups relative to the white ethnic group
Males Females
Black Asian Mixed Chinese
Other All BAME
(known) Black Asian Mixed Chinese
Other All BAME
(known) Youth Arrests 2.77 * 0.66 * 1.44 * 1.01 1.35 * 1.67 * 0.25 * 1.17 * 0.78 * 0.83 * CPS charged 1.07 * 0.99 1.06 * 1.07 1.05 * 0.62 -- 1.28 -- 0.87 Proceeded at mags’ 1.22 * 1.01 1.17 * 1.04 * 1.15 * 1.17 * 0.80 * 1.27 * 1.30 * 1.16 * Tried at Crown 1.56 * 2.44 * 1.38 * 2.09 * 1.72 * 0.62 -- 1.28 -- 0.58 * Adults Arrests 3.28 * 1.09 * 2.18 * 1.51 * 1.75 * 2.24 * 0.51 * 2.11 * 1.89 * 1.23 * CPS charged 0.98 * 0.92 * 1.02 * 0.98 0.96 * 0.88 0.71 * 0.97 0.96 0.85 * Proceeded at mags’ 0.99 0.81 * 1.00 0.77 * 0.91 * 0.90 * 0.64 * 1.02 0.68 * 0.84 * Tried at Crown 1.40 * 1.62 * 1.29 * 1.39 * 1.45 * 1.63 * 2.08 * 1.36 * 1.54 * 1.64 *
Notes: * indicates a statistically significant difference; ‘--’ means RRI could not be calculated due to either too few ‘at risk’ or experiencing the event analysed
13

The data in Table 5.1 indicates that CPS charging decisions were often proportionate or
slightly favoured BAME groups relative to the white group. For example, for most BAME
young females and most BAME adults, the CPS charged at rates which were significantly
lower or were no different from the white group. On the other hand, the CPS charged black
and mixed ethnic young males, and mixed ethnic adult males at rates higher than for the
white group. The magnitude of disproportionality added by the CPS across all groups,
however, was generally small. For example:
• for each white young male charged, 1.07 black young males and 1.06 mixed
ethnic young males were charged;
• for each white man charged, 0.98 black men and 0.92 Asian men were charged,
but 1.02 mixed ethnic men were charged; and
• for each white woman charged, 0.71 Asian women were charged.
The CPS was involved in making charging decisions for about 35% of all cases in 2014/15.
These were the most serious offences including all indictable crimes and those triable-either-
way crimes where the suspect was likely to plead not guilty.12 The CPS are also responsible
for making the charging decision in all domestic abuse and hate crime cases regardless of
the mode of trial or anticipated plea. Since the analysis was of only indictable and triable-
either-way offences, the CPS’s involvement would account for the bulk of cases analysed.
12 Note that the police may charge triable-either-way cases in which the suspect pleads or is likely to plead guilty.
14
Once charged, a further measure of severity was whether the case proceeded at
magistrates’ court or was committed for trial at the Crown Court. While indictable offences
are tried at the Crown Court, magistrates may send triable-either-way cases to the Crown
Court depending on the seriousness of the offence committed and the case’s complexity.
This requires a degree of judgement, and possibly some negotiation with defendants, as to
where triable-either-way cases are heard.13 Considering magistrates’ court appearances:
• black, mixed ethnic, and other ethnic youth, both male and female, were
disproportionately more likely to be proceeded against at magistrates’ court;
• Asian young males were as likely as white young males to be proceeded against
at magistrates’ court while Asian young females were less likely than white young
females to be proceeded against there; and
• all adult BAME groups were either less likely or as likely as the white group to
appear at magistrates’ court.
Considering Crown Court trials, all BAME males - both adults and youth - and BAME women
were disproportionately more likely than their white counterparts to be committed for trial at
the Crown Court. Disproportionality was particularly pronounced for Asian and other ethnic
young males, while black and mixed ethnic young females were no different from white
young females to be committed to the Crown Court. Specifically:
• black young males were just less than 60% more likely than white young males
to be committed to the Crown Court for trial; and
• Asian young males were just less than 2.5 times more likely and other ethnic
young males were just greater than 2 times more likely to be committed to the
Crown Court for trial compared to white young males.
For adults, disproportionality was consistent across ethnic groups. For example, black (40%
more likely), Asian (62%), mixed ethnic (29%) and other ethnic (39%) men were more likely
to be committed to the Crown Court for trial compared to white men. Black (63% more likely),
mixed ethnic (36%) and other ethnic (54%) women were more likely to be committed to the
Crown Court for trial compared to white women. Strikingly, Asian women were greater than
2 times more likely to be committed to the Crown Court for trial relative to white women.
13 Magistrates consider triable-either-way cases and can decide to commit the case to the Crown Court for trial if the matter is very serious or highly complex. However, if the magistrate decides the case is suitable for magistrates’ court, a defendant who has pleaded not guilty can still opt for the matter to be tried at Crown Court. Available data for 2014 suggest that of all cases heard at the Crown Court, about 8% were sent to the Crown Court at the election of the defendant (for example, see https://www.gov.uk/government/uploads/system/uploads/attachment_data/file/417233/criminal-court-statistics-bulletin-october-to-december-2014.pdf).
15
The disproportionality magnitudes in proceeding at magistrates’ court and being committed
to the Crown Court differed from the CPS charging rates. Charging rates for agencies other
than the CPS, such as the police, could not be calculated because data were not available.
The magistrates’ court proceeding rate was calculated using an ‘at risk’ population of those
arrested rather than charged for this reason (see Appendix 1) and would necessarily include
any effects of charging by agencies other than the CPS in addition to the CPS charging rates
themselves. At the same time, disproportionality in being committed to the Crown Court for
trial would be influenced by magistrates’ decision-making as well as any negotiation over
placement of trial with triable-either-way defendants pleading not guilty. For these reasons,
this finding is an area where further investigation into the mechanisms which drive the
disproportionate appearance of ethnic minorities at the Crown Court could be warranted.
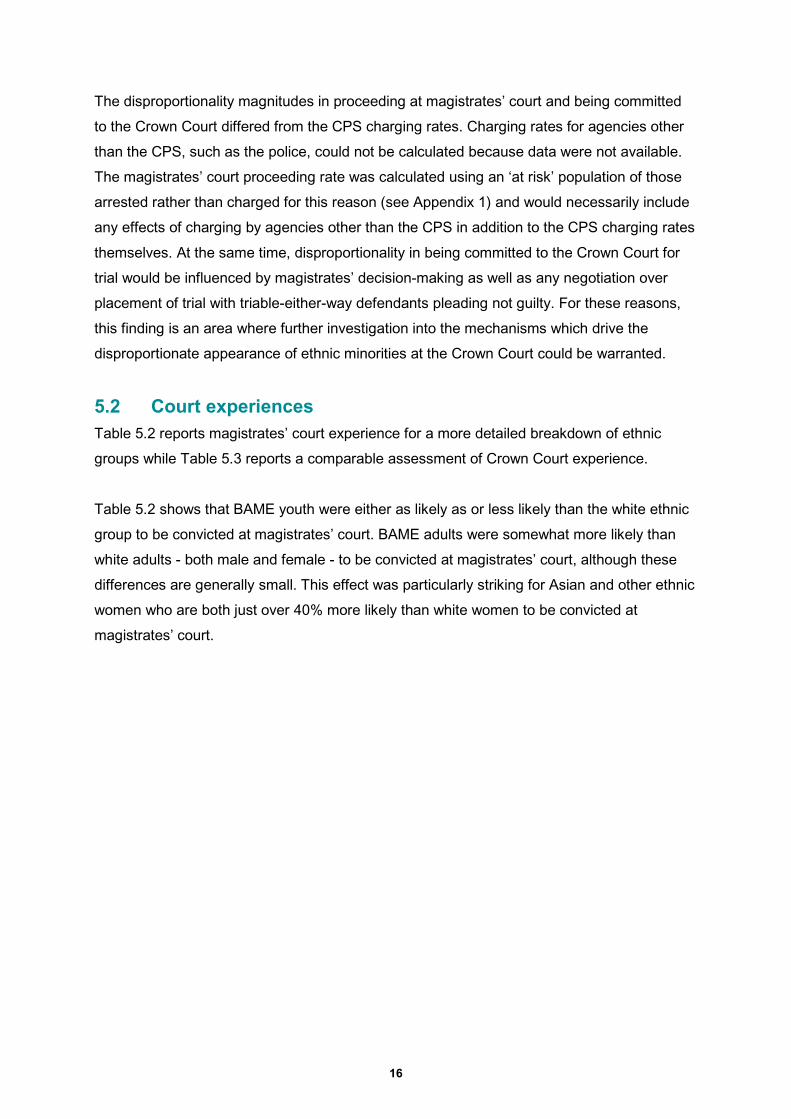
5.2 Court experiences Table 5.2 reports magistrates’ court experience for a more detailed breakdown of ethnic
groups while Table 5.3 reports a comparable assessment of Crown Court experience.
Table 5.2 shows that BAME youth were either as likely as or less likely than the white ethnic
group to be convicted at magistrates’ court. BAME adults were somewhat more likely than
white adults - both male and female - to be convicted at magistrates’ court, although these
differences are generally small. This effect was particularly striking for Asian and other ethnic
women who are both just over 40% more likely than white women to be convicted at
magistrates’ court.
16

Table 5.2. Relative Rate Index, 2014, magistrates’ court experience, all groups relative to the white ethnic group
Males Females
Black Asian Mixed Chinese
Other All BAME
(known) Black Asian Mixed Chinese
Other All BAME
(known) Youth Proceeded at mags’ 1.22 * 1.01 1.17 * 1.04 * 1.15 * 1.17 * 0.80 * 1.27 * 1.30 * 1.16 * Convicted at mags’ 0.97 * 1.04 0.97 * 0.94 0.98 0.93 1.03 1.03 -- 0.98 Custodial sentence at mags’ 1.23 * 1.04 1.35 * -- 1.21 * -- -- -- -- -- Adults Proceeded at mags’ 0.99 0.81 * 1.00 0.77 * 0.91 * 0.90 * 0.64 * 1.02 0.68 * 0.84 * Convicted at mags’ 1.04 1.15 * 1.08 * 1.14 * 1.08 * 1.22 * 1.42 * 1.11 1.43 * 1.24 * Custodial sentence at mags’ 0.83 * 0.91 * 0.92 * 1.15 * 0.89 * 0.93 0.76 1.12 -- 0.88 *
Notes: * indicates a statistically significant difference; ‘--’ means RRI could not be calculated due to either too few ‘at risk’ or experiencing the event analysed
17
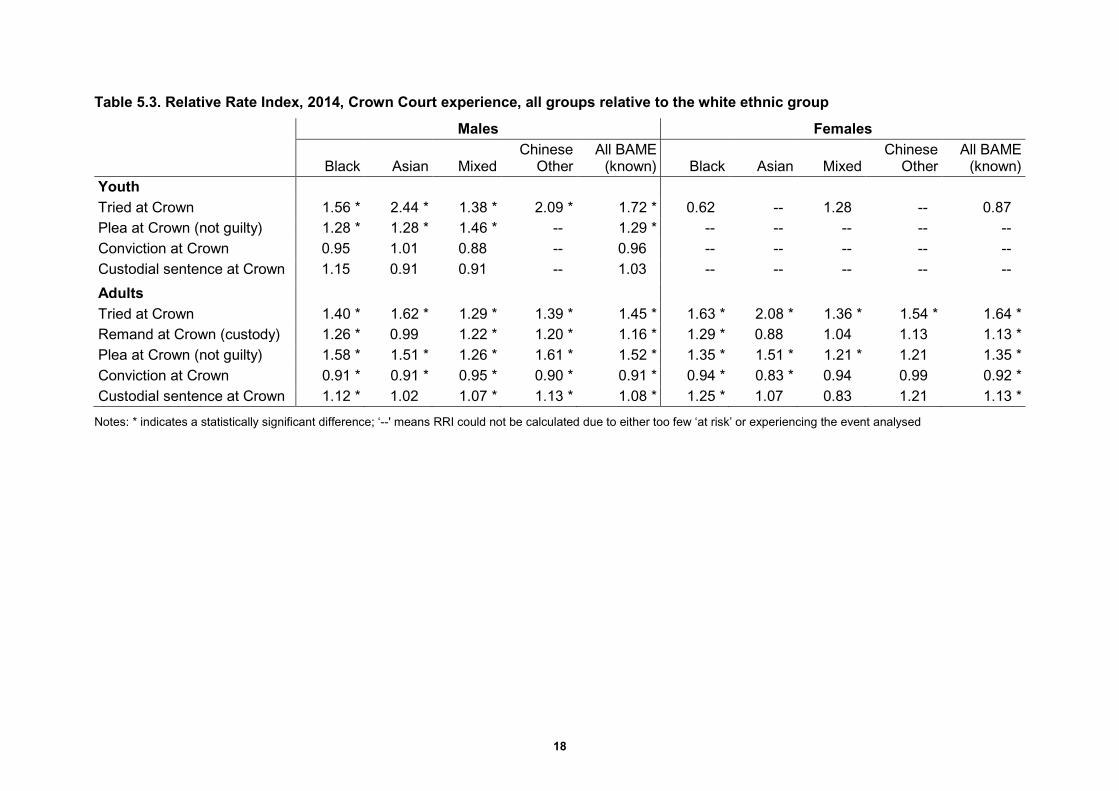
Table 5.3. Relative Rate Index, 2014, Crown Court experience, all groups relative to the white ethnic group
Males Females
Black Asian Mixed Chinese
Other All BAME
(known) Black Asian Mixed Chinese
Other All BAME
(known) Youth Tried at Crown 1.56 * 2.44 * 1.38 * 2.09 * 1.72 * 0.62 -- 1.28 -- 0.87 Plea at Crown (not guilty) 1.28 * 1.28 * 1.46 * -- 1.29 * -- -- -- -- -- Conviction at Crown 0.95 1.01 0.88 -- 0.96 -- -- -- -- -- Custodial sentence at Crown 1.15 0.91 0.91 -- 1.03 -- -- -- -- -- Adults Tried at Crown 1.40 * 1.62 * 1.29 * 1.39 * 1.45 * 1.63 * 2.08 * 1.36 * 1.54 * 1.64 * Remand at Crown (custody) 1.26 * 0.99 1.22 * 1.20 * 1.16 * 1.29 * 0.88 1.04 1.13 1.13 * Plea at Crown (not guilty) 1.58 * 1.51 * 1.26 * 1.61 * 1.52 * 1.35 * 1.51 * 1.21 * 1.21 1.35 * Conviction at Crown 0.91 * 0.91 * 0.95 * 0.90 * 0.91 * 0.94 * 0.83 * 0.94 0.99 0.92 * Custodial sentence at Crown 1.12 * 1.02 1.07 * 1.13 * 1.08 * 1.25 * 1.07 0.83 1.21 1.13 *
Notes: * indicates a statistically significant difference; ‘--' means RRI could not be calculated due to either too few ‘at risk’ or experiencing the event analysed
18
Of those convicted at magistrates’ court, custodial sentences were somewhat more likely for
black and mixed ethnic young males than white young males. For every white young male
sentenced to custody, 1.2 black and about 1.4 mixed ethnic young males received custody.
For other groups, a custodial sentence was less likely than for the white ethnic group.
Notably, black men were about 20% less likely than white men to be sentenced to custody at
magistrates’ court. The only exception to this was other ethnic men who were about 15%
more likely to receive a custodial sentence at magistrates’ court.
Comparable to magistrates’ court, Crown Court conviction rates for BAME groups were also
either proportionate or lower than the white ethnic group. Black, Asian and other ethnic men
were about 10% less likely to be convicted at Crown Court than the white group. Asian
women were about 20% less likely to be convicted at Crown Court than white women. Apart
from Asian men, this analysis found disproportionality in custodial sentencing at Crown Court
for BAME men. These effects were small, though statistically significant. For example, black
men were about 12% more likely than white men to receive a custodial sentence.
The analysis found that black women were about 25% more likely than white women to be
sentenced to custody at Crown Court while custodial sentencing was proportionate for all
other BAME women.
In addition to the seriousness of the offence committed, custodial remand and plea could
influence custodial sentencing for those convicted at Crown Court. Where the number of
cases was sufficiently large for calculations to be made, all adult BAME groups were more
likely than the white group to be remanded in custody at Crown and, apart from other ethnic
women, to plead ‘not guilty’ in their cases. For instance, black, mixed ethnic and other ethnic
men were more than 20% more likely than white men to be remanded in custody. The
difference in plea for adults was particularly striking. Black, Asian and other ethnic men were
greater than 50% percent more likely than white men to plead ‘not guilty’ at Crown Court.
The levels of disproportionality that emerged in custodial remand at Crown, plea at Crown,
and custodial sentencing at both Crown and magistrates’ court might warrant further
analysis.
19

5.3 Issues arising for specific offences Appendix 2 contains tables showing detailed analyses of court experiences for each ethnic
group relative to the white group broken down by major offence category. Results for 3
offence categories demonstrated distinctive disproportionality findings: (1) robbery, (2) sexual
offences, and (3) drugs offences.
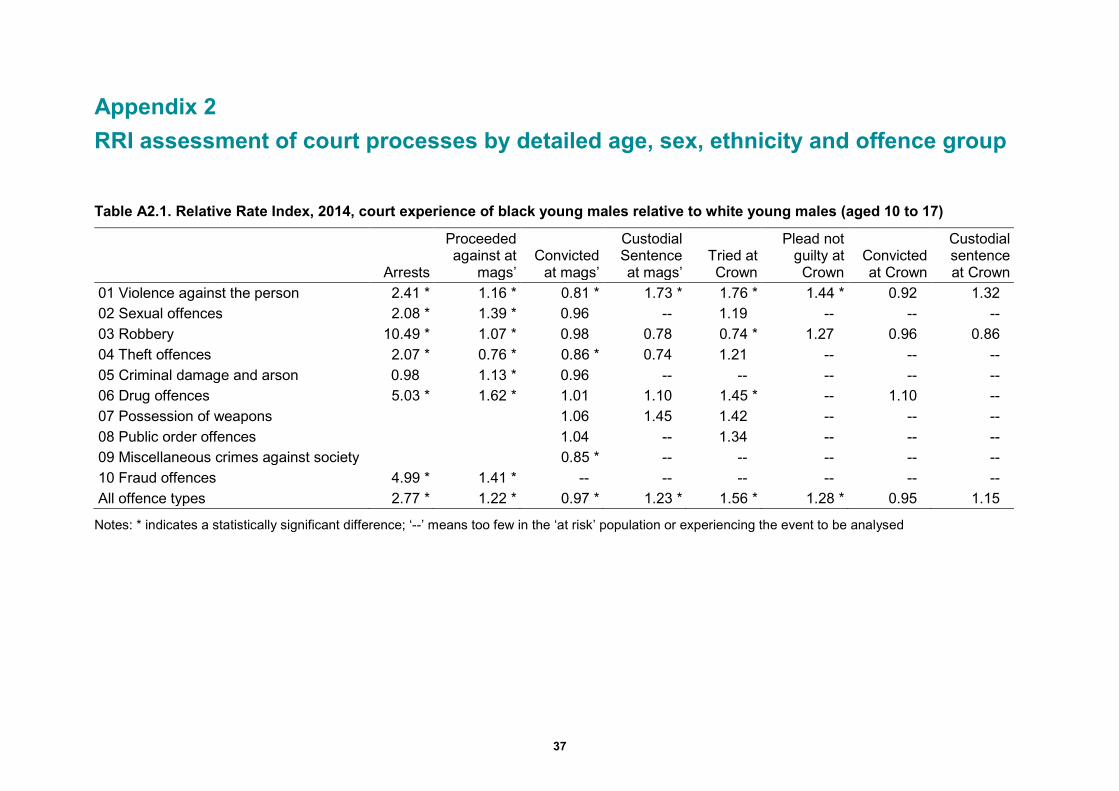
Robbery Black young males were 10.5 times more likely than white young males to be arrested for
robbery (shown in Table A2.1 in Appendix 2). They were, however, only marginally more
likely than white young males to be proceeded against at magistrates’ court and
proportionately likely to be convicted there. They were significantly less likely to be
committed to the Crown Court for trial compared to white young males and were no more
likely to be convicted or receive a custodial sentence there.
Mixed ethnic young males were 4.2 times more likely than white young males to be arrested
for robbery (Table A2.3 in Appendix 2). They were marginally more likely to be proceeded
against at magistrates’ court and no more likely to be convicted or sentenced to custody
there compared to white young males. Mixed ethnic young males were proportionately likely
to be committed to the Crown Court for trial compared to white young males and significantly
less likely to be convicted there.
Among adults, black men were about 8.4 times more likely to be arrested for robbery
compared to white men (see Table A2.9 in Appendix 2). However, they were less likely than
white men to be either proceeded against at magistrates’ court or committed to the Crown
Court for trial. Too few black men were proceeded against for robbery at magistrates’ court to
calculate conviction rates there, probably because most robberies are tried at the Crown
Court. At the Crown Court, custodial remand was lower for black men than white men, and
not guilty pleas were significantly more likely. Conviction rates were lower, consistent with
the experience of young males, but custodial sentencing was also lower than for the white
group.
Among mixed ethnic men, arrests rates were about 5.5 times higher than for the white group
for robbery (see Table A2.11 in Appendix 2). However, rates of proceeding at magistrates’
court and being committed to Crown Court for trial were either less likely or proportionate
compared to white men. There were insufficient case numbers to complete analyses on
those proceeded at magistrates’ court. However, conviction rates in the Crown Court were
20
marginally lower for mixed ethnic men appearing for robbery while custodial sentencing was
proportionate to the white ethnic group.
A comparable picture emerged for black young females who were 5.1 times more likely to be
arrested for robbery compared to white young females (See Table A2.5 in Appendix 2). Black
young females were somewhat more likely to be proceeded against at magistrates’ court but
proportionately likely to be convicted there. There were, however, insufficient case numbers
of young females sentenced at magistrates’ or committed to the Crown Court for trial to
compare court experiences between black and white youth.
Robbery arrest rates for black and mixed ethnic males, both youth and adults, were high. At
the same time, trials, conviction and sentencing rates for robbery appeared somewhat more
proportionate to, if not disproportionate towards, the white ethnic group. The RRI evidence
implies, here, that disproportionality in prison for the offence of robbery could be traced
primarily to disproportionate arrest rates.
Sexual offences Black and Asian men were significantly more likely to be arrested for sexual offences
compared to white men. These disproportionality figures were not as large as for robbery,
however. Black men were 3.7 times more likely than white men to be arrested for sexual
offences while Asian men were about 1.8 times more likely (see Tables A2.9 and A2.10 in
Appendix 2).
As with robbery, prosecutions and convictions for both black and Asian men were either
lower than or proportionate to white men. Notwithstanding this general pattern of court
experience, convicted black and Asian men were about twice as likely as white men to be
sentenced to custody at magistrates’ court for sexual offences. At the same time, black men
convicted of sexual offences were proportionality likely to white men to receive custody while
convicted Asian men were significantly less likely than white men to receive a custodial
sentence.
Compared to robbery, disproportionality in the prison population for sexual offences could be
traced back to a combination of disproportionality in arrests and disproportionate custodial
sentencing for black and Asian men at magistrates’ court.
21

Drugs offences It is generally the case that custodial sentencing may be associated with offender age,
ethnicity, offence type and court where the case was heard.14 This analysis found custodial
sentencing for all BAME men and black women committing drugs offences was particularly
disproportionate at Crown Court. Indeed, this was the only offence group where custodial
sentencing was consistently more likely for all BAME men relative to the white group, and for
black women. For example:
• black men were about 1.4 times more likely than white men to receive a custodial
sentence (Table A2.9 in Appendix 2);
• Asian men were 1.4 times more likely than white men to receive a custodial
sentence (Table A2.10 in Appendix 2);
• mixed ethnic men were 1.1 times more likely than white men to receive a
custodial sentence (Table A2.11 in Appendix 2);
• other ethnic men were about 1.6 times more likely than white men to receive a
custodial sentence (Table A2.12 in Appendix 2); and
• black women were about 2.3 times more likely to receive a custodial sentence for
drugs offences compared to white women (Table A2.13 in Appendix 2).
For all of the groups highlighted, arrest rates for drugs offences were also disproportionately
high. These ranged from black men being 5.4 times more likely than white men to be
arrested for drugs offences to Asian men being about 1.4 times more likely. All BAME men
were somewhat more likely than white men to be committed to the Crown Court for trial, but
conviction rates were marginally lower than, or proportionate to, white men across all groups.
Taken together, this analysis implies that disproportionality in prison for BAME men and
black women convicted of drugs offences can be traced back to a combination of
disproportionate arrest and disproportionate custodial sentencing at the Crown Court.
14 K Hopkins, ‘Associations between police-recorded ethnic background and being sentenced to prison in England and Wales’, 2015: https://www.gov.uk/government/uploads/system/uploads/attachment_data/file/479874/analysis-of-ethnicity-and-custodial-sentences.pdf
22
5.4 Prison experiences The analysis investigated 3 aspects of prison experience as part of this disproportionality
mapping exercise: (1) placement in the high security estate, (2) adjudications for breach of
prison discipline, and (3) release from prison on temporary licence.15
Prisons in England and Wales vary in classification based on the likelihood of prisoner
escape and the risk to the public likely to be caused by the escaped prisoner. High security
prisons house the most serious offenders who pose the most risk to the public if they were to
escape. Table 5.4 shows that black and Asian men were more likely to be housed in high
security than white men for public order offences, specifically just over 4 times more likely for
black men and more than 6 times more likely for Asian men. Other areas of disproportionality
that emerged were for black men who had committed theft (1.9 times more likely),
possession of weapons (1.8 times more likely) and violence against the person (1.6 times
more likely), and Asian men who committed criminal damage (1.9 times more likely).
15 The latest MoJ published Race and the Criminal Justice System report compares sentence length, finding BAME groups tend to have longer average sentence lengths than white prisoners. See https://www.gov.uk/government/statistics/race-and-the-criminal-justice-system-2014
23
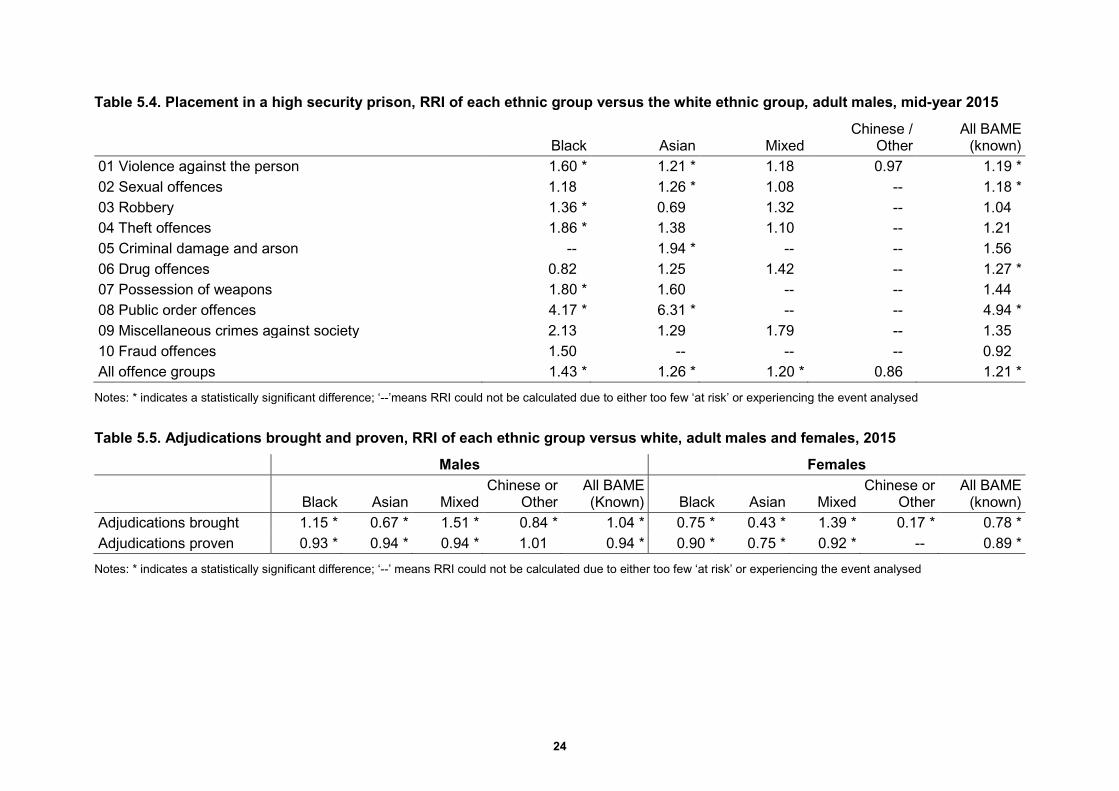
Table 5.4. Placement in a high security prison, RRI of each ethnic group versus the white ethnic group, adult males, mid-year 2015
Black Asian Mixed Chinese /
Other All BAME
(known) 01 Violence against the person 1.60 * 1.21 * 1.18 0.97 1.19 * 02 Sexual offences 1.18 1.26 * 1.08 -- 1.18 * 03 Robbery 1.36 * 0.69 1.32 -- 1.04 04 Theft offences 1.86 * 1.38 1.10 -- 1.21 05 Criminal damage and arson -- 1.94 * -- -- 1.56 06 Drug offences 0.82 1.25 1.42 -- 1.27 * 07 Possession of weapons 1.80 * 1.60 -- -- 1.44 08 Public order offences 4.17 * 6.31 * -- -- 4.94 * 09 Miscellaneous crimes against society 2.13 1.29 1.79 -- 1.35 10 Fraud offences 1.50 -- -- -- 0.92 All offence groups 1.43 * 1.26 * 1.20 * 0.86 1.21 *
Notes: * indicates a statistically significant difference; ‘--’means RRI could not be calculated due to either too few ‘at risk’ or experiencing the event analysed
Table 5.5. Adjudications brought and proven, RRI of each ethnic group versus white, adult males and females, 2015
Males Females
Black Asian Mixed Chinese or
Other All BAME (Known) Black Asian Mixed
Chinese or Other
All BAME (known)
Adjudications brought 1.15 * 0.67 * 1.51 * 0.84 * 1.04 * 0.75 * 0.43 * 1.39 * 0.17 * 0.78 * Adjudications proven 0.93 * 0.94 * 0.94 * 1.01 0.94 * 0.90 * 0.75 * 0.92 * -- 0.89 *
Notes: * indicates a statistically significant difference; ‘--’ means RRI could not be calculated due to either too few ‘at risk’ or experiencing the event analysed
24

Table 5.5 shows both rates of adjudications brought and adjudications proven if brought.
The adjudication system allows prison governors and independent adjudicators to address
breaches of prison discipline. This analysis showed that black and mixed ethnic men, and
mixed ethnic women, had adjudications brought against them at higher rates than white
groups. The rate for mixed ethnic men was a notable 50% higher than for white men.
Nevertheless, no ethnic group had adjudications proven at higher rates than white groups. In
fact, adjudications against Asian women were significantly less likely to be brought compared
to white women and were about one-third less likely to be proven if brought.16 In summary,
this analysis of adjudications could imply that even while in prison, BAME prisoner behaviour
is more heavily scrutinised.
The analysis compared rates of release on temporary licence (ROTL) by establishment type
given that not all prisoners are equally likely to receive a temporary licence. Results are
shown in Table 5.6. Black and mixed ethnic men were less likely than white men to have an
episode of ROTL from Category C institutions, while both were more likely than white men to
receive an episode of ROTL from local prisons. Asian men were significantly more likely to
receive licences from open and local prisons. Asian women were about 55% more likely and
mixed ethnic women were 50% more likely than white women to be released on temporary
licence.
Table 5.6. Release on temporary licence, RRI of each ethnic group versus white, adult males and females, 2015
Black Asian Mixed Chinese /
Other All BAME
(known) Males Cat C establishments 0.69 * 1.06 0.64 * 0.47 0.78 * Open prisons 1.07 1.20 * 1.00 1.33 1.11 * Local prisons 1.40 * 4.00 * 1.59 * 0.35 2.16 * Females Female prisons 1.08 1.55 * 1.50 * 0.72 1.26 *
Notes: * indicates a statistically significant difference; ‘--’means RRI could not be calculated due to either too few ‘at risk’ or experiencing the event analysed
16 Although not shown in the tables, adjudication dismissal rates for all ethnic groups were also much lower than for white groups.
25

Table 5.7. Temporary licences granted for training, apprenticeship, employment as a proportion of all temporary licences granted, RRI of each ethnic group versus white, adult males and females, 2015
Black Asian Mixed Chinese /
Other All BAME
(known) Males Cat C establishments 0.25 * 0.72 -- -- 0.48 * Open prisons 1.22 * 1.27 * 1.11 1.45 1.23 Local prisons 1.29 1.10 -- -- 1.15 Females Female prisons 0.88 0.99 0.99 -- 0.93
Notes: * indicates a statistically significant difference; ‘--’ means RRI could not be calculated due to either too few ‘at risk’ or experiencing the event analysed
Prisoners can be released on licence for a number of reasons, one of which is
apprenticeship, training or education. Results shown in Table 5.7 show black men were
significantly less likely than white men to be released for these reasons from Category C
establishments (RRI = 0.25) while being significantly more likely to receive this type of
licence from open prisons (RRI = 1.22). Similarly, Asian men were more likely than white
men in open prisons to be released for training, apprenticeship or employment (RRI = 1.27).
Results for women suggest no difference across ethnic groups in their propensity to be
released for these reasons.
5.5 Reoffending Analysis of reoffending rates requires a lag of approximately 24 months from an initial
offence for any further reoffending to be committed and detected, plus an additional 6
months waiting period for any offences to be proven in court. Given that disproportionality
could occur at any point in the CJS, analyses of reoffending rates do not separate out any
disproportionality in the system, nor do they suggest why proven reoffending rates might be
higher or lower for some ethnic groups over others. In short, a comparison of proven
reoffending rates effectively aggregates all system wide reasons for disproportionality.
Notwithstanding this caveat, results in Table 5.8 show marginally higher proven reoffending
rates for black youth and adults. Black young males were about 15% more likely to be
proven to reoffend compared to white young males. Similarly, black men were about 7%
more likely to be proven to reoffend compared to white men. This analysis found significantly
lower proven reoffending rates for all other ethnic groups than for white groups.
26

Table 5.8. Proven reoffending, RRI of each ethnic group relative to the white ethnic group, 2013 cohort
Black Asian All other ethnic groups
Youth Males 1.15 * 0.84 * 0.90 Females 0.78 * 0.57 * 0.60 *
Adult Males 1.07 * 0.74 * 0.70 * Females 0.85 * 0.44 * 0.53 *
Notes: * indicates a statistically significant difference; ‘--’ means RRI could not be calculated due to either too few ‘at risk’ or experiencing the event analysed
27
6. Implications
The analysis reported in this paper aimed to identify locations in the CJS where
disproportionality was particularly pronounced for BAME young people and adults. In so
doing, it intended to highlight specific points in the CJS which warranted further explanatory
investigation. Five areas were identified.
First, for some offences, such as robbery, arrest rates were significantly higher for certain
BAME groups, but analyses of court processes generally did not suggest that
disproportionality emerged for these groups later across the CJS. The current analysis was
limited in that it isolated disproportionality at specific points, but could not address the effect
of earlier disproportionality on subsequent points in the system. For this reason, one area for
further assessment would be to address how disproportionality influences downstream
events. For example, what is the relationship between disproportionate custodial sentencing
and placement in prison and then placement in prison’s relationship with temporary release
on licence?
Second, this analysis isolated a level of BAME disproportionality in both remand at Crown
Court and pleas of ‘not guilty’ at Crown Court. Reasons a defendant might be remanded at
Crown Court could include the seriousness of the offence committed, prior conviction for a
comparable offence, risk of bail flight, prohibiting interference with witnesses, the destruction
of evidence, or even a risk of danger from others to the defendant. Further investigation into
CJS decision-making around remand could be warranted, particularly in cases where the
defendant had been arrested for a comparable offence in the past.
Plea at Crown Court was disproportionately ‘not guilty’ for BAME defendants. How
defendants arrive at a plea could be influenced by the legal advice they receive, the type of
legal representation they have, if any, the level of trust they place in any sentencing
discounts they may receive for early guilty pleas, the defendant’s assessment of their
chances with a jury, as well as whether they actually committed the offence with which they
were charged. Further investigation into the differences between BAME and white
defendants in this area may be warranted.
Third, this analysis found that BAME rates of being committed to the Crown Court for trial
was disproportionate. The analysis was limited to only indictable or triable-either-way
offences, which are more likely to be heard in the Crown Court. However, disproportionality
in being committed to the Crown Court might reflect a degree of disproportionality in the
28
specific offence charged as well as magistrates’ decision-making around triable-either-way
cases. It may also reflect greater reoffending among certain groups, even though charging
rates appear no different across ethnic groups. More detailed analysis may be warranted to
control for the seriousness of offence charged, case complexity, prior offending, and whether
the matter was elected by the defendant or decided by a magistrate to be sent to the Crown
Court for trial.
Next, one of the effects of being tried at the Crown Court is that sentencing powers are
comparatively greater there than at magistrates’ courts. However, the analysis found that
custodial sentencing was more likely for certain BAME groups in combination with certain
offence groups, for example, sexual offences at magistrates’ court. A more nuanced
understanding of custodial sentencing might be warranted that controls for offence, its level
of violence, prior offending, the content and recommendations of pre-sentencing reports and
plea.
Finally, this analysis identified that adjudications for breaches of prison discipline were more
likely for certain BAME groups although they were significantly less likely to be proven and
were often dismissed. The analysis, however, has not addressed the offender journey post-
sentence in detail. A large number of areas may yet warrant investigation including such
things as custodial risk-assessments, alternatives to custody, custodial safety, placement on
the prison incentives and earned privileges scheme, and rehabilitation experiences.
While some key areas of disproportionality are highlighted here, it is important to consider
the decision points where BAME representation was either proportionate or lower than for
white groups. This may include CPS charging decisions and conviction at Crown Court.
When viewed against the CJS junctures where disproportionality was more pronounced, one
might surmise that there were characteristics of the decision process at the proportionate
junctures that differentiated them to some degree. For example, charging decisions and
Crown Court convictions are subject to the rules of evidence, established guidelines and
some degree of institutional oversight. Conviction in Crown Court is also routinely subject to
collective decision-making. On the other hand, decisions to arrest, remand, conviction at
magistrates’ court and adjudication may have some degree of individual discretion.
Sentencing, though subject to guidelines, also has some discretion involved. One
overarching hypothesis worth investigating may be that established principles of oversight,
guidance and collective decision-making reduce the effects of any unconscious racial bias
29

that play out in areas of the system where decision-makers exercise a higher degree of
individual discretion.
This analysis was intended to inform the debate around the creation of a fairer and more
trusted CJS. By increasing transparency on the issue of ethnic minority treatment, the
problems of disproportionality and confidence in the CJS may be addressed more effectively.
30

Appendix 1 Detailed description of assumptions and measures used in the analysis
This appendix contains detailed descriptions of the underlying assumptions, data used, and
proportions, rates or ratios compared using the RRI framework. Table A1.1 lists all items
calculated, along with further detail on data sources used in the calculations.
Arrests, charging and prosecution Age, gender and self-declared ethnicity specific arrest rates were derived from Home Office
sources published in association with the most recent Race and the Criminal Justice System
report.17 Rates were obtained for specific offence group categories by counting the number
of arrests in 2013/14 within age, gender, ethnicity and offence group out of an ‘at risk’ age,
gender and ethnicity specific population from the 2011 census of England and Wales. Unlike
the remaining rates calculated as part of this analysis, the arrest rate included any summary
offences for which the suspect was arrested.
The calculated arrest rate has 2 limitations. First, estimates of the 2013/14 mid-year
population would be a more timely ‘at risk’ group for 2013/14 arrest rates. However, specific
age, gender and ethnic group breakdowns for mid-year populations are not available from
the ONS. Second, there were slight differences between the set of offences classified into
groups by the Home Office and what was recorded by courts and prisons in official statistics.
Nevertheless, given that this analysis was ultimately concerned with comparing rates
between ethnic groups, small differences in offence group classifications should not have
affected comparisons greatly.
Age, gender and self-declared ethnicity specific CPS charging rates were derived from non-
public data provided directly from the CPS.18 Rates were calculated from the number of
individuals charged or prosecuted by the CPS out of an ‘at risk’ group of individuals sent to
the CPS for charging decisions by the police. Official guidance on charging outlines when the
police or when CPS are responsible for charging suspects.19 In 2014/15, CPS made charging
decisions in approximately 35% of prosecuted cases and the police took charging decisions
17 Chapter 4: Police Activity Tables, https://www.gov.uk/government/statistics/race-and-the-criminal-justice-system-2014
18 The CPS data categorised by offence group was not available for this analysis. 19 http://www.cps.gov.uk/publications/directors_guidance/dpp_guidance_5.html
31
on the remaining 65% of cases. The CPS are responsible for determining the charge on the
most serious offences, notably those offences which are indictable and triable-either-way as
well as summary offences which involve hate crime or domestic violence.
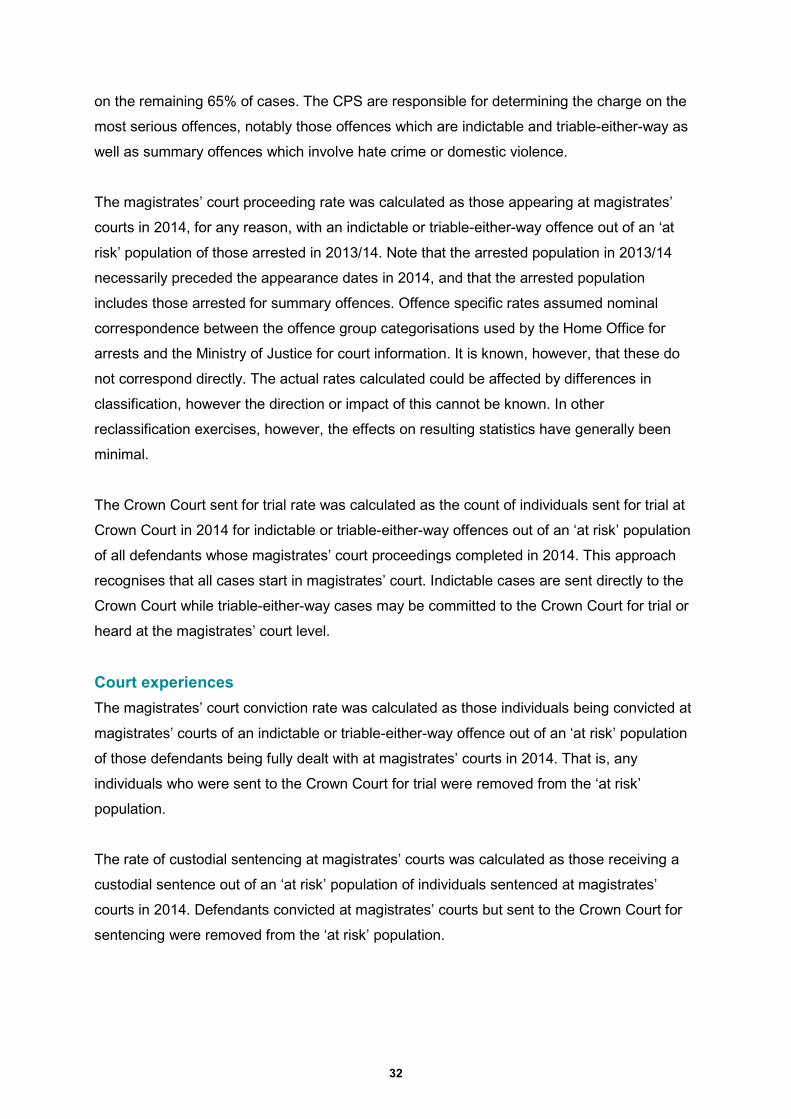
The magistrates’ court proceeding rate was calculated as those appearing at magistrates’
courts in 2014, for any reason, with an indictable or triable-either-way offence out of an ‘at
risk’ population of those arrested in 2013/14. Note that the arrested population in 2013/14
necessarily preceded the appearance dates in 2014, and that the arrested population
includes those arrested for summary offences. Offence specific rates assumed nominal
correspondence between the offence group categorisations used by the Home Office for
arrests and the Ministry of Justice for court information. It is known, however, that these do
not correspond directly. The actual rates calculated could be affected by differences in
classification, however the direction or impact of this cannot be known. In other
reclassification exercises, however, the effects on resulting statistics have generally been
minimal.
The Crown Court sent for trial rate was calculated as the count of individuals sent for trial at
Crown Court in 2014 for indictable or triable-either-way offences out of an ‘at risk’ population
of all defendants whose magistrates’ court proceedings completed in 2014. This approach
recognises that all cases start in magistrates’ court. Indictable cases are sent directly to the
Crown Court while triable-either-way cases may be committed to the Crown Court for trial or
heard at the magistrates’ court level.
Court experiences The magistrates’ court conviction rate was calculated as those individuals being convicted at
magistrates’ courts of an indictable or triable-either-way offence out of an ‘at risk’ population
of those defendants being fully dealt with at magistrates’ courts in 2014. That is, any
individuals who were sent to the Crown Court for trial were removed from the ‘at risk’
population.
The rate of custodial sentencing at magistrates’ courts was calculated as those receiving a
custodial sentence out of an ‘at risk’ population of individuals sentenced at magistrates’
courts in 2014. Defendants convicted at magistrates’ courts but sent to the Crown Court for
sentencing were removed from the ‘at risk’ population.
32
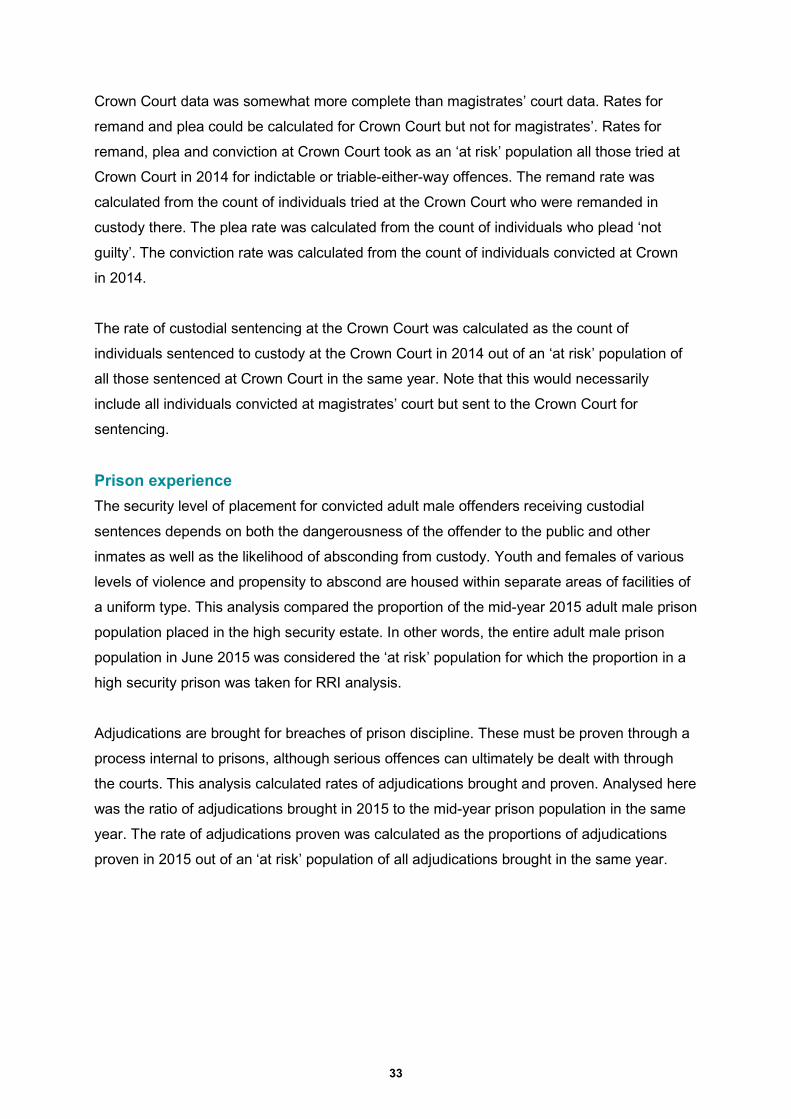
Crown Court data was somewhat more complete than magistrates’ court data. Rates for
remand and plea could be calculated for Crown Court but not for magistrates’. Rates for
remand, plea and conviction at Crown Court took as an ‘at risk’ population all those tried at
Crown Court in 2014 for indictable or triable-either-way offences. The remand rate was
calculated from the count of individuals tried at the Crown Court who were remanded in
custody there. The plea rate was calculated from the count of individuals who plead ‘not
guilty’. The conviction rate was calculated from the count of individuals convicted at Crown
in 2014.
The rate of custodial sentencing at the Crown Court was calculated as the count of
individuals sentenced to custody at the Crown Court in 2014 out of an ‘at risk’ population of
all those sentenced at Crown Court in the same year. Note that this would necessarily
include all individuals convicted at magistrates’ court but sent to the Crown Court for
sentencing.
Prison experience The security level of placement for convicted adult male offenders receiving custodial
sentences depends on both the dangerousness of the offender to the public and other
inmates as well as the likelihood of absconding from custody. Youth and females of various
levels of violence and propensity to abscond are housed within separate areas of facilities of
a uniform type. This analysis compared the proportion of the mid-year 2015 adult male prison
population placed in the high security estate. In other words, the entire adult male prison
population in June 2015 was considered the ‘at risk’ population for which the proportion in a
high security prison was taken for RRI analysis.
Adjudications are brought for breaches of prison discipline. These must be proven through a
process internal to prisons, although serious offences can ultimately be dealt with through
the courts. This analysis calculated rates of adjudications brought and proven. Analysed here
was the ratio of adjudications brought in 2015 to the mid-year prison population in the same
year. The rate of adjudications proven was calculated as the proportions of adjudications
proven in 2015 out of an ‘at risk’ population of all adjudications brought in the same year.
33
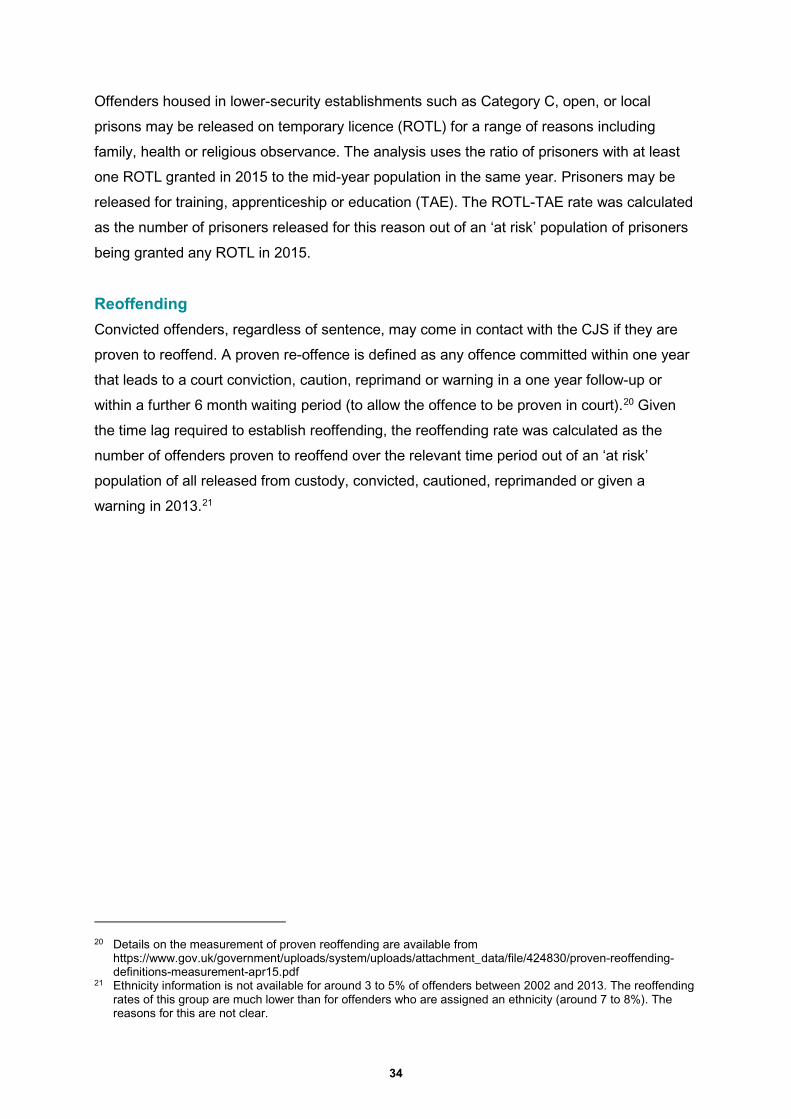
Offenders housed in lower-security establishments such as Category C, open, or local
prisons may be released on temporary licence (ROTL) for a range of reasons including
family, health or religious observance. The analysis uses the ratio of prisoners with at least
one ROTL granted in 2015 to the mid-year population in the same year. Prisoners may be
released for training, apprenticeship or education (TAE). The ROTL-TAE rate was calculated
as the number of prisoners released for this reason out of an ‘at risk’ population of prisoners
being granted any ROTL in 2015.
Reoffending Convicted offenders, regardless of sentence, may come in contact with the CJS if they are
proven to reoffend. A proven re-offence is defined as any offence committed within one year
that leads to a court conviction, caution, reprimand or warning in a one year follow-up or
within a further 6 month waiting period (to allow the offence to be proven in court).20 Given
the time lag required to establish reoffending, the reoffending rate was calculated as the
number of offenders proven to reoffend over the relevant time period out of an ‘at risk’
population of all released from custody, convicted, cautioned, reprimanded or given a
warning in 2013.21
20 Details on the measurement of proven reoffending are available from https://www.gov.uk/government/uploads/system/uploads/attachment_data/file/424830/proven-reoffending-definitions-measurement-apr15.pdf
21 Ethnicity information is not available for around 3 to 5% of offenders between 2002 and 2013. The reoffending rates of this group are much lower than for offenders who are assigned an ethnicity (around 7 to 8%). The reasons for this are not clear.
34

Table A1.1. Rates calculated for comparison, their definition and data sources
Calculated Rate Event or Outcome At Risk Population Event/Outcome Data Source At Risk Population Data Source Arrest Rate Arrest 1000 population Arrest data, 2013/14a ONS 2011 census data toolb CPS Charge Rate CPS decision to
charge 100 serious offences requiring a CPS decision
CPS Casework Management System / Management Information System )
CPS Casework Management System / Management Information System )
Magistrate's Court Proceeding Rate
Appearance at Mags
100 arrests Prosecutions, convictions and remands data tool, 2014 datac
Arrest data, 2013/14a
Magistrate's Court Conviction Rate
Convicted at Mags 100 individuals fully dealt with at the proceeded at Mags
Prosecutions, convictions and remands data tool, 2014 datac
Prosecutions, convictions and remands data tool, 2014 datac
Magistrate's Custodial Sentencing Rate
Receives custody at Mags
100 individuals sentenced at Mags
Sentencing data tool, 2014 datac Sentencing data tool, 2014 datac
Crown Court Trial Rate Appearance at Crown
100 completed at magistrates’ court
Prosecutions, convictions and remands data tool, 2014 datac
Prosecutions, convictions and remands data tool, 2014 datac
Crown Court Not Guilty Plea Rate
Plead "Not Guilty" 100 individuals tried at Crown
Prosecutions, convictions and remands data tool, 2014 datac
Prosecutions, convictions and remands data tool, 2014 datac
Crown Court Custodial Remand Rate
Remanded in custody
100 individuals tried at Crown
Prosecutions, convictions and remands data tool, 2014 datac
Prosecutions, convictions and remands data tool, 2014 datac
Crown Court Conviction Rate Convicted at Crown 100 individuals tried at Crown
Prosecutions, convictions and remands data tool, 2014 datac
Prosecutions, convictions and remands data tool, 2014 datac
Crown Court Custodial Sentencing Rate
Receives custody at Crown
100 sentenced at Crown
Sentencing data tool, 2014 datac Sentencing data tool, 2014 datac
High Security Prison Rate Placement in High Security Establishment
100 prisoners Prison population, 30 June 2015, extract P-NOMIS
Prison population, 30 June 2015, extract P-NOMIS
Rate of Adjudications Brought Adjudication brought
100 prisoners Adjudications, 2010-2015, extract: P-NOMIS
Adjudications, 2010-2015, extract: P-NOMIS
Rate of Adjudications Proven Adjudication proven 100 adjudications brought
Adjudications, 2010-2015, extract: P-NOMIS
Adjudications, 2010-2015, extract: P-NOMIS
35

Calculated Rate Event or Outcome At Risk Population Event/Outcome Data Source At Risk Population Data Source Release on Temporary License (ROTL) Rate
Any receipt of ROTL
100 prisoners Release on Temporary Licence extract, P-NOMIS, 2015
Prison population, 30 June 2015, extract P-NOMIS
Rate of ROTL for training, apprenticeship or employment (TAE)
Receipt of ROTL for TAE
100 ROTL receipts Release on Temporary Licence, extract P-NOMIS, 2015
Release on Temporary Licence, extract P-NOMIS, 2015
Proven reoffending rate Proven reoffending 100 prisoners released
Proven reoffending overview data tool, July 2013 to June 2015d
Proven reoffending overview data tool, July 2013 to June 2015d
Data sources:
a https://www.gov.uk/government/statistics/police-powers-and-procedures-england-and-wales-year-ending-31-march-2014
b https://www.nomisweb.co.uk/census/2011/dc2101ew
c https://www.gov.uk/government/statistics/criminal-justice-system-statistics-quarterly-december-2015
d https://www.gov.uk/government/statistics/proven-reoffending-statistics-quarterly-july-2013-to-june-2014
36
Appendix 2 RRI assessment of court processes by detailed age, sex, ethnicity and offence group
Table A2.1. Relative Rate Index, 2014, court experience of black young males relative to white young males (aged 10 to 17)
Arrests
Proceeded against at
mags’ Convicted
at mags’
Custodial Sentence at mags’
Tried at Crown
Plead not guilty at Crown
Convicted at Crown
Custodial sentence at Crown
01 Violence against the person 2.41 * 1.16 * 0.81 * 1.73 * 1.76 * 1.44 * 0.92 1.32 02 Sexual offences 2.08 * 1.39 * 0.96 -- 1.19 -- -- -- 03 Robbery 10.49 * 1.07 * 0.98 0.78 0.74 * 1.27 0.96 0.86 04 Theft offences 2.07 * 0.76 * 0.86 * 0.74 1.21 -- -- -- 05 Criminal damage and arson 0.98 1.13 * 0.96 -- -- -- -- -- 06 Drug offences 5.03 * 1.62 * 1.01 1.10 1.45 * -- 1.10 -- 07 Possession of weapons 1.06 1.45 1.42 -- -- -- 08 Public order offences 1.04 -- 1.34 -- -- -- 09 Miscellaneous crimes against society 0.85 * -- -- -- -- -- 10 Fraud offences 4.99 * 1.41 * -- -- -- -- -- -- All offence types 2.77 * 1.22 * 0.97 * 1.23 * 1.56 * 1.28 * 0.95 1.15
Notes: * indicates a statistically significant difference; ‘--’ means too few in the ‘at risk’ population or experiencing the event to be analysed
37

Table A2.2. Relative Rate Index, 2014, court experience of Asian young males relative to white young males (aged 10 to 17)
Arrests
Proceeded against at
mags’ Convicted
at mags’
Custodial sentence at mags’
Tried at Crown
Plead not guilty at Crown
Convicted at Crown
Custodial sentence at Crown
01 Violence against the person 0.66 * 1.49 * 0.93 -- 1.73 * 1.40 0.94 0.96 02 Sexual offences 0.66 * 0.84 * -- -- 1.20 -- -- -- 03 Robbery 1.61 * 1.23 * 1.07 0.86 1.05 1.20 1.02 0.68 * 04 Theft offences 0.53 * 0.68 * 1.02 -- 1.58 -- -- -- 05 Criminal damage and arson 0.31 * 0.98 0.97 -- -- -- -- -- 06 Drug offences 1.25 * 1.10 * 1.01 -- 2.99 * -- -- -- 07 Possession of weapons 1.08 -- 3.21 * -- -- -- 08 Public order offences 1.11 -- 2.25 * -- -- -- 09 Miscellaneous crimes against society 1.20 * -- 3.90 * -- -- -- 10 Fraud offences 1.68 * 1.18 * -- -- -- -- -- -- All offence types 0.66 * 1.01 1.04 1.04 2.44 * 1.28 * 1.01 0.91
Notes: * indicates a statistically significant difference; ‘--’ means too few in the ‘at risk’ population or experiencing the event to be analysed
38

Table A2.3. Relative Rate Index, 2014, court experience of mixed ethnic young males relative to white young males (aged 10 to17)
Arrests
Proceeded against at
mags’ Convicted
at mags’
Custodial sentence at mags’
Tried at Crown
Plead not guilty at Crown
Convicted at Crown
Custodial sentence at Crown
01 Violence against the person 1.39 * 1.14 * 0.99 -- 1.50 * -- -- -- 02 Sexual offences 0.94 1.48 * -- -- 1.12 -- -- -- 03 Robbery 4.21 * 1.10 * 0.90 0.77 0.81 1.64 * 0.77 * -- 04 Theft offences 1.11 * 0.96 * 0.95 1.35 1.00 -- -- -- 05 Criminal damage and arson 0.85 * 1.12 * 0.96 -- -- -- -- -- 06 Drug offences 2.29 * 1.39 * 1.03 -- 1.12 -- -- -- 07 Possession of weapons 1.06 -- 1.11 -- -- -- 08 Public order offences 0.90 -- 1.49 -- -- -- 09 Miscellaneous crimes against society 0.81 * -- -- -- -- -- 10 Fraud offences 1.63 * -- -- -- -- -- -- -- All offence types 1.44 * 1.17 * 0.97 * 1.35 * 1.38 * 1.46 * 0.88 0.91
Notes: * indicates a statistically significant difference; ‘--’ means too few in the ‘at risk’ population or experiencing the event to be analysed
39

Table A2.4. Relative Rate Index, 2014, court experience of Chinese and other ethnic young males relative to white young males (aged 10 to 17)
Arrests
Proceeded against at
mags’ Convicted
at mags’
Custodial sentence at mags’
Tried at Crown
Plead not guilty at Crown
Convicted at Crown
Custodial sentence at Crown
01 Violence against the person 0.75 * 1.28 * -- -- -- -- -- -- 02 Sexual offences 0.87 -- -- -- -- -- -- -- 03 Robbery 2.30 * 1.34 * 1.06 -- -- -- -- -- 04 Theft offences 1.16 * 0.55 * 0.98 -- -- -- -- -- 05 Criminal damage and arson 0.40 * 1.43 * -- -- -- -- -- -- 06 Drug offences 1.79 * 1.02 -- -- 5.74 * -- -- -- 07 Possession of weapons -- -- -- -- -- -- 08 Public order offences -- -- -- -- -- -- 09 Miscellaneous crimes against society -- -- -- -- -- -- 10 Fraud offences 2.51 * -- -- -- -- -- -- -- All offence types 1.01 1.04 * 0.94 -- 2.09 * -- -- --
Notes: * indicates a statistically significant difference; ‘--’ means too few in the ‘at risk’ population or experiencing the event to be analysed
40

Table A2.5 Relative Rate Index, 2014, court experience of black young females relative to white young females (aged 10 to 17)
Arrests
Proceeded against at
mags’ Convicted
at mags’
Custodial sentence at mags’
Tried at Crown
Plead not guilty at Crown
Convicted at Crown
Custodial sentence at Crown
01 Violence against the person 1.36 * 0.84 * -- -- -- -- -- -- 02 Sexual offences 0.99 -- -- -- -- -- -- -- 03 Robbery 5.10 * 1.18 * 0.94 -- -- -- -- -- 04 Theft offences 2.00 * 0.86 * 0.94 -- -- -- -- -- 05 Criminal damage and arson 1.05 1.01 -- -- -- -- -- -- 06 Drug offences 1.68 * 1.71 * -- -- -- -- -- -- 07 Possession of weapons -- -- -- -- -- -- 08 Public order offences -- -- -- -- -- -- 09 Miscellaneous crimes against society -- -- -- -- -- -- 10 Fraud offences 3.60 * -- -- -- -- -- -- -- All offence types 1.67 * 1.17 * 0.93 -- 0.62 -- -- --
Notes: * indicates a statistically significant difference; ‘--' means too few in the ‘at risk’ population or experiencing the event to be analysed
41
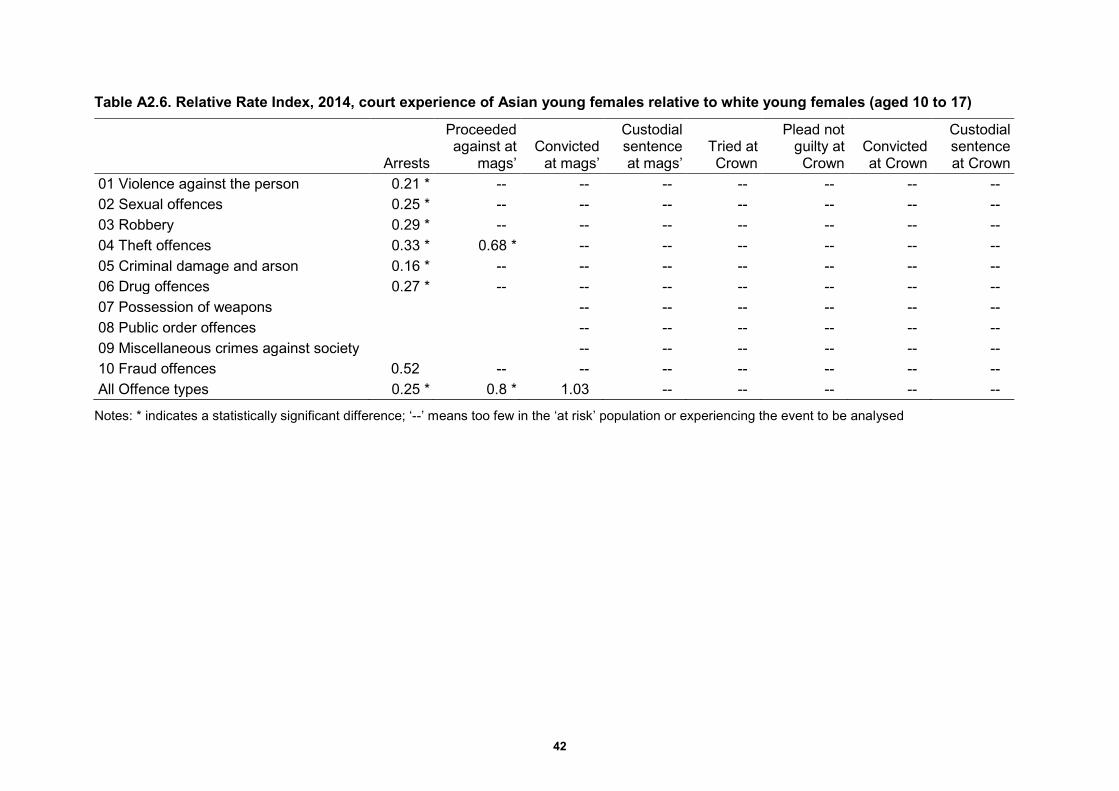
Table A2.6. Relative Rate Index, 2014, court experience of Asian young females relative to white young females (aged 10 to 17)
Arrests
Proceeded against at
mags’ Convicted
at mags’
Custodial sentence at mags’
Tried at Crown
Plead not guilty at Crown
Convicted at Crown
Custodial sentence at Crown
01 Violence against the person 0.21 * -- -- -- -- -- -- -- 02 Sexual offences 0.25 * -- -- -- -- -- -- -- 03 Robbery 0.29 * -- -- -- -- -- -- -- 04 Theft offences 0.33 * 0.68 * -- -- -- -- -- -- 05 Criminal damage and arson 0.16 * -- -- -- -- -- -- -- 06 Drug offences 0.27 * -- -- -- -- -- -- -- 07 Possession of weapons -- -- -- -- -- -- 08 Public order offences -- -- -- -- -- -- 09 Miscellaneous crimes against society -- -- -- -- -- -- 10 Fraud offences 0.52 -- -- -- -- -- -- -- All Offence types 0.25 * 0.8 * 1.03 -- -- -- -- --
Notes: * indicates a statistically significant difference; ‘--’ means too few in the ‘at risk’ population or experiencing the event to be analysed
42

Table A2.7. Relative Rate Index, 2014, court experience of mixed ethnic young females relative to white young females (aged 10 to 17)
Arrests
Proceeded against at
mags’ Convicted
at mags’
Custodial sentence at mags’
Tried at Crown
Plead not guilty at Crown
Convicted at Crown
Custodial Sentence at Crown
01 Violence against the person 1.12 * 1.37 * -- -- -- -- -- -- 02 Sexual offences 1.06 -- -- -- -- -- -- -- 03 Robbery 2.34 * 2.07 * -- -- -- -- -- -- 04 Theft offences 1.11 1.17 * 1.10 -- -- -- -- -- 05 Criminal damage and arson 1.01 0.81 * -- -- -- -- -- -- 06 Drug offences 1.72 * -- -- -- -- -- -- -- 07 Possession of weapons -- -- -- -- -- -- 08 Public order offences -- -- -- -- -- -- 09 Miscellaneous crimes against society -- -- -- -- -- -- 10 Fraud offences 1.85 * -- -- -- -- -- -- -- All offence types 1.17 * 1.27 * 1.03 -- 1.28 -- -- --
Notes: * indicates a statistically significant difference; ‘--' means too few in the ‘at risk’ population or experiencing the event to be analysed
43

Table A2.8. Relative Rate Index, 2014, court experience of Chinese and other ethnic young females relative to white young females (aged 10 to 17)
Arrests
Proceeded against at
mags’ Convicted
at mags’
Custodial sentence at mags’
Tried at Crown
Plead not guilty at Crown
Convicted at Crown
Custodial sentence at Crown
01 Violence against the person 0.48 * -- -- -- -- -- -- -- 02 Sexual offences 2.12 -- -- -- -- -- -- -- 03 Robbery 1.22 -- -- -- -- -- -- -- 04 Theft offences 1.39 * 0.79 * -- -- -- -- -- -- 05 Criminal damage and arson 0.21 * -- -- -- -- -- -- -- 06 Drug offences 1.22 -- -- -- -- -- -- -- 07 Possession of weapons -- -- -- -- -- -- 08 Public order offences -- -- -- -- -- -- 09 Miscellaneous crimes against society -- -- -- -- -- -- 10 Fraud offences 1.24 -- -- -- -- -- -- -- All offence types 0.77 * 1.30 * -- -- -- -- -- --
Notes: * indicates a statistically significant difference; ‘--' means too few in the ‘at risk’ population or experiencing the event to be analysed
44

Table A2.9. Relative Rate Index, 2014, court experience of black men relative to white men (aged 18 and over)
Arrests
Proceeded against at
mags’ Convicted
at mags’
Custodial sentence at mags’
Tried at Crown
Remand in custody at
Crown
Plead not guilty at Crown
Convicted at Crown
Custodial sentence at Crown
01 Violence against the person 3.11 * 0.95 * 1.65 * 1.00 1.30 * 1.30 * 1.76 * 0.85 * 1.15 * 02 Sexual offences 3.71 * 0.94 * 1.15 2.08 * 1.03 1.34 * 1.44 * 0.68 * 1.07 03 Robbery 8.37 * 0.93 * -- -- 0.99 * 0.95 * 1.67 * 0.86 * 0.96 * 04 Theft offences 2.14 * 0.91 * 1.25 * 1.13 * 1.44 * 1.06 * 1.88 * 0.89 * 0.95 * 05 Criminal damage and arson 2.02 * 0.98 * 1.27 * 1.11 0.83 1.05 1.29 0.96 0.93 06 Drug offences 5.39 * 1.24 * 0.90 0.71 * 1.15 * 1.83 * 2.16 * 0.95 * 1.41 * 07 Possession of weapons 1.20 * 1.16 1.16 * 1.36 * 1.62 * 0.91 * 1.33 * 08 Public order offences 1.02 1.10 1.26 * 1.23 * 1.68 * 0.90 * 1.05 09 Miscellaneous crimes against society 1.03 1.07 1.33 * 1.29 * 1.67 * 0.93 * 1.19 * 10 Fraud offences 7.67 * 0.75 * 0.98 0.88 1.12 * 1.21 * 1.11 1.00 0.97 All offence types 3.28 * 0.99 1.04 0.83 * 1.40 * 1.26 * 1.58 * 0.91 * 1.12 *
Notes: * indicates a statistically significant difference; ‘--' means too few in the ‘at risk’ population or experiencing the event to be analysed
45
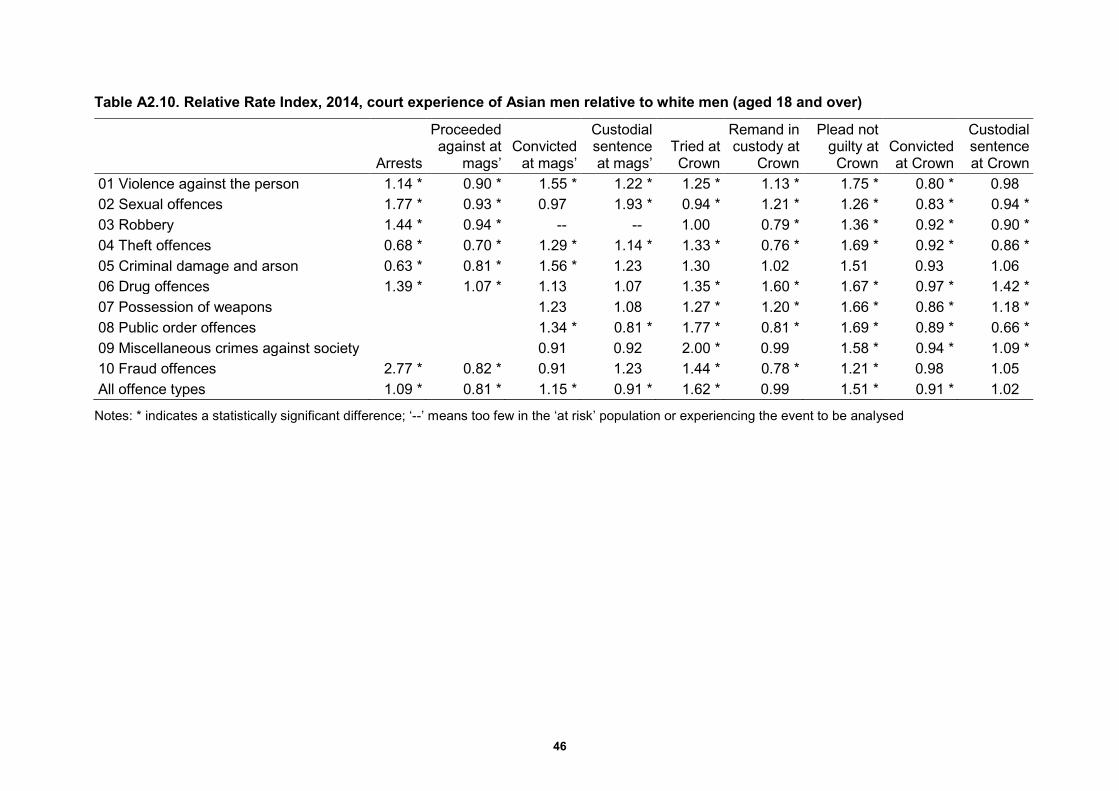
Table A2.10. Relative Rate Index, 2014, court experience of Asian men relative to white men (aged 18 and over)
Arrests
Proceeded against at
mags’ Convicted
at mags’
Custodial sentence at mags’
Tried at Crown
Remand in custody at
Crown
Plead not guilty at Crown
Convicted at Crown
Custodial sentence at Crown
01 Violence against the person 1.14 * 0.90 * 1.55 * 1.22 * 1.25 * 1.13 * 1.75 * 0.80 * 0.98 02 Sexual offences 1.77 * 0.93 * 0.97 1.93 * 0.94 * 1.21 * 1.26 * 0.83 * 0.94 * 03 Robbery 1.44 * 0.94 * -- -- 1.00 0.79 * 1.36 * 0.92 * 0.90 * 04 Theft offences 0.68 * 0.70 * 1.29 * 1.14 * 1.33 * 0.76 * 1.69 * 0.92 * 0.86 * 05 Criminal damage and arson 0.63 * 0.81 * 1.56 * 1.23 1.30 1.02 1.51 0.93 1.06 06 Drug offences 1.39 * 1.07 * 1.13 1.07 1.35 * 1.60 * 1.67 * 0.97 * 1.42 * 07 Possession of weapons 1.23 1.08 1.27 * 1.20 * 1.66 * 0.86 * 1.18 * 08 Public order offences 1.34 * 0.81 * 1.77 * 0.81 * 1.69 * 0.89 * 0.66 * 09 Miscellaneous crimes against society 0.91 0.92 2.00 * 0.99 1.58 * 0.94 * 1.09 * 10 Fraud offences 2.77 * 0.82 * 0.91 1.23 1.44 * 0.78 * 1.21 * 0.98 1.05 All offence types 1.09 * 0.81 * 1.15 * 0.91 * 1.62 * 0.99 1.51 * 0.91 * 1.02
Notes: * indicates a statistically significant difference; ‘--’ means too few in the ‘at risk’ population or experiencing the event to be analysed
46
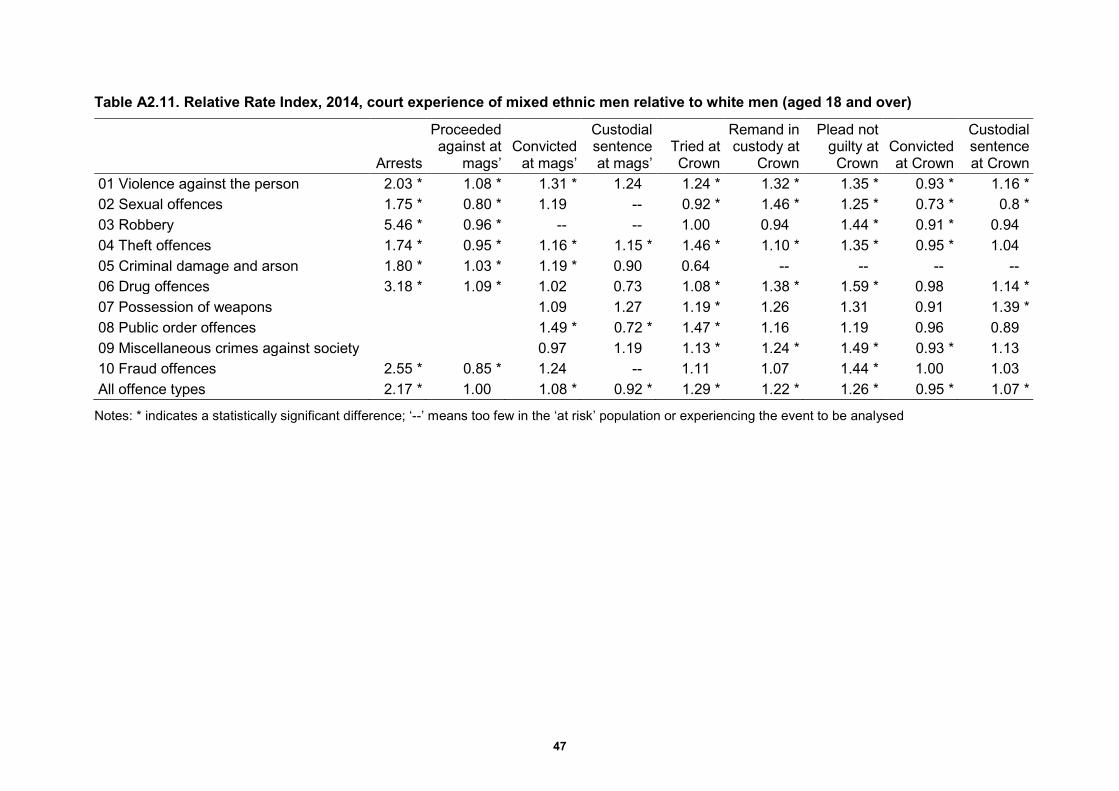
Table A2.11. Relative Rate Index, 2014, court experience of mixed ethnic men relative to white men (aged 18 and over)
Arrests
Proceeded against at
mags’ Convicted
at mags’
Custodial sentence at mags’
Tried at Crown
Remand in custody at
Crown
Plead not guilty at Crown
Convicted at Crown
Custodial sentence at Crown
01 Violence against the person 2.03 * 1.08 * 1.31 * 1.24 1.24 * 1.32 * 1.35 * 0.93 * 1.16 * 02 Sexual offences 1.75 * 0.80 * 1.19 -- 0.92 * 1.46 * 1.25 * 0.73 * 0.8 * 03 Robbery 5.46 * 0.96 * -- -- 1.00 0.94 1.44 * 0.91 * 0.94 04 Theft offences 1.74 * 0.95 * 1.16 * 1.15 * 1.46 * 1.10 * 1.35 * 0.95 * 1.04 05 Criminal damage and arson 1.80 * 1.03 * 1.19 * 0.90 0.64 -- -- -- -- 06 Drug offences 3.18 * 1.09 * 1.02 0.73 1.08 * 1.38 * 1.59 * 0.98 1.14 * 07 Possession of weapons 1.09 1.27 1.19 * 1.26 1.31 0.91 1.39 * 08 Public order offences 1.49 * 0.72 * 1.47 * 1.16 1.19 0.96 0.89 09 Miscellaneous crimes against society 0.97 1.19 1.13 * 1.24 * 1.49 * 0.93 * 1.13 10 Fraud offences 2.55 * 0.85 * 1.24 -- 1.11 1.07 1.44 * 1.00 1.03 All offence types 2.17 * 1.00 1.08 * 0.92 * 1.29 * 1.22 * 1.26 * 0.95 * 1.07 *
Notes: * indicates a statistically significant difference; ‘--’ means too few in the ‘at risk’ population or experiencing the event to be analysed
47

Table A2.12. Relative Rate Index, 2014, court experience of Chinese and other ethnic men relative to white men (aged 18 and over)
Arrests
Proceeded against at
mags’ Convicted
at mags’
Custodial sentence at mags’
Tried at Crown
Remand in custody at
Crown
Plead not guilty at Crown
Convicted at Crown
Custodial sentence at Crown
01 Violence against the person 1.36 * 0.86 * 1.59 * 0.97 1.13 * 0.94 1.94 * 0.74 * 0.94 02 Sexual offences 2.17 * 0.93 * 1.24 -- 0.91 * 1.15 1.34 * 0.72 * 1.00 03 Robbery 1.90 * 0.93 * -- -- 0.99 1.05 1.85 * 0.88 * 0.95 04 Theft offences 1.40 * 0.62 * 1.35 * 1.18 * 1.05 1.01 1.78 * 0.92 * 1.00 05 Criminal damage and arson 0.88 * 0.91 * 0.86 -- 1.53 -- -- -- -- 06 Drug offences 1.66 * 0.95 * 1.08 1.42 1.40 * 2.18 * 1.83 * 0.96 * 1.58 * 07 Possession of weapons 1.00 -- 1.14 1.21 1.65 * 0.89 1.07 08 Public order offences 1.97 * 1.44 * 1.50 * 1.19 2.09 * 0.91 1.14 09 Miscellaneous crimes against society 0.93 1.87 * 1.64 * 1.49 * 1.61 * 0.94 * 1.27 * 10 Fraud offences 3.58 * 0.63 * -- 2.08 * 1.24 1.18 1.33 0.98 1.08 All offence types 1.51 * 0.77 * 1.14 * 1.15 * 1.39 * 1.20 * 1.61 * 0.90 * 1.13 *
Notes: * indicates a statistically significant difference; ‘--’ means too few in the ‘at risk’ population or experiencing the event to be analysed
48
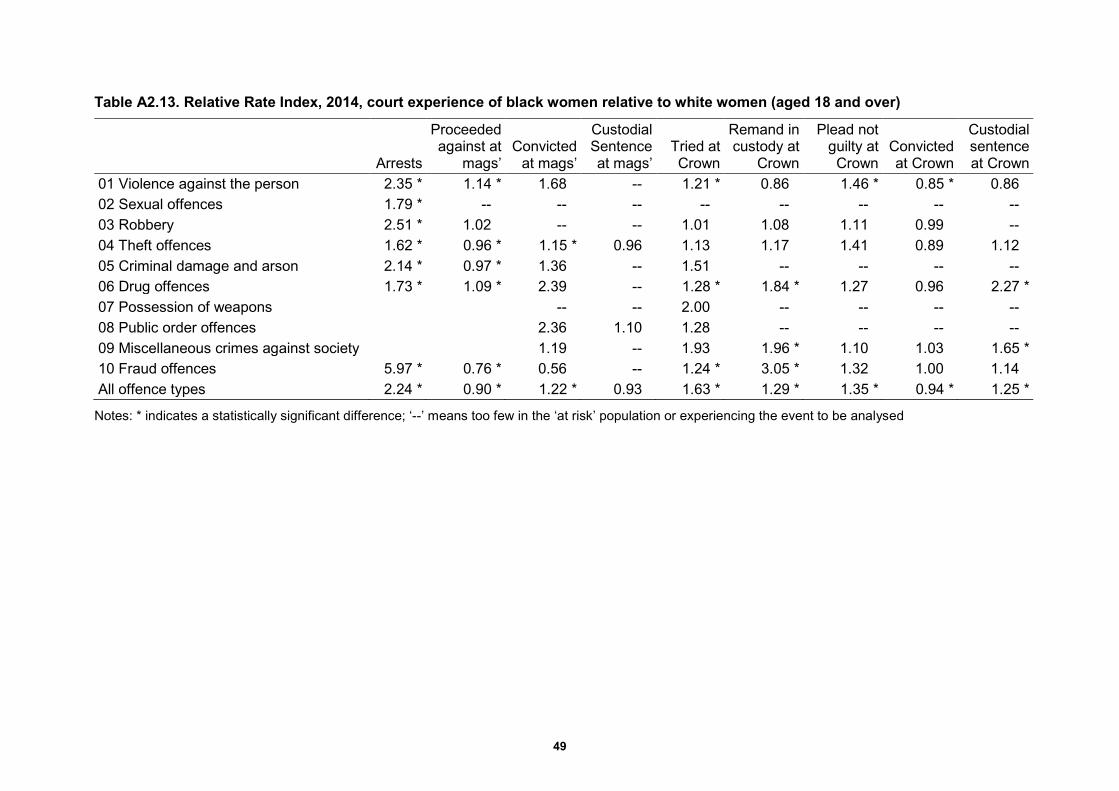
Table A2.13. Relative Rate Index, 2014, court experience of black women relative to white women (aged 18 and over)
Arrests
Proceeded against at
mags’ Convicted
at mags’
Custodial Sentence at mags’
Tried at Crown
Remand in custody at
Crown
Plead not guilty at Crown
Convicted at Crown
Custodial sentence at Crown
01 Violence against the person 2.35 * 1.14 * 1.68 -- 1.21 * 0.86 1.46 * 0.85 * 0.86 02 Sexual offences 1.79 * -- -- -- -- -- -- -- -- 03 Robbery 2.51 * 1.02 -- -- 1.01 1.08 1.11 0.99 -- 04 Theft offences 1.62 * 0.96 * 1.15 * 0.96 1.13 1.17 1.41 0.89 1.12 05 Criminal damage and arson 2.14 * 0.97 * 1.36 -- 1.51 -- -- -- -- 06 Drug offences 1.73 * 1.09 * 2.39 -- 1.28 * 1.84 * 1.27 0.96 2.27 * 07 Possession of weapons -- -- 2.00 -- -- -- -- 08 Public order offences 2.36 1.10 1.28 -- -- -- -- 09 Miscellaneous crimes against society 1.19 -- 1.93 1.96 * 1.10 1.03 1.65 * 10 Fraud offences 5.97 * 0.76 * 0.56 -- 1.24 * 3.05 * 1.32 1.00 1.14 All offence types 2.24 * 0.90 * 1.22 * 0.93 1.63 * 1.29 * 1.35 * 0.94 * 1.25 *
Notes: * indicates a statistically significant difference; ‘--’ means too few in the ‘at risk’ population or experiencing the event to be analysed
49

Table A2.14. Relative Rate Index, 2014, court experience of Asian women relative to white women (aged 18 and over)
Arrests
Proceeded against at
mags’ Convicted
at mags’
Custodial sentence at mags’
Tried at Crown
Remand in custody at
Crown
Plead not guilty at Crown
Convicted at Crown
Custodial sentence at Crown
01 Violence against the person 0.55 * 0.87 * 2.03 -- 1.29 * 1.01 1.24 0.89 1.05 02 Sexual offences 0.30 * -- -- -- -- -- -- -- -- 03 Robbery 0.36 * 1.40 * -- -- -- -- -- -- -- 04 Theft offences 0.41 * 0.57 * 1.36 * 0.65 * 1.60 * -- 1.59 * 0.85 -- 05 Criminal damage and arson 0.34 * 0.79 * 1.99 * -- -- -- -- -- -- 06 Drug offences 0.30 * 0.85 * -- -- 1.60 * 2.36 * 1.89 * 0.71 * -- 07 Possession of weapons -- -- -- -- -- -- -- 08 Public order offences -- -- 1.46 -- -- -- -- 09 Miscellaneous crimes against society 1.29 -- 2.72 0.80 1.77 * 0.75 * 1.37 10 Fraud offences 1.26 * 0.80 * 1.06 -- 1.28 * -- 1.34 0.94 0.98 All offence types 0.51 * 0.64 * 1.42 * 0.76 2.08 * 0.88 1.51 * 0.83 * 1.07
Notes: * indicates a statistically significant difference; ‘--’ means too few in the ‘at risk’ population or experiencing the event to be analysed
50

Table A2.15. Relative Rate Index, 2014, court experience of mixed ethnic women relative to white women (aged 18 and over)
Arrests
Proceeded Against at
mags’ Convicted
at mags’
Custodial Sentence at mags’
Tried at Crown
Remand in custody at
Crown
Plead not guilty at Crown
Convicted at Crown
Custodial sentence at Crown
01 Violence against the person 2.00 * 1.23 * 1.73 -- 1.05 0.99 1.28 0.79 * -- 02 Sexual offences 1.83 * -- -- -- -- -- -- -- -- 03 Robbery 2.80 * 1.43 * -- -- -- -- -- -- -- 04 Theft offences 1.79 * 1.02 0.99 1.32 * 1.43 * 1.18 -- 1.18 * 0.91 05 Criminal damage and arson 2.61 * 0.93 * 1.29 -- 1.82 * -- -- -- -- 06 Drug offences 2.48 * 1.22 * -- -- 1.10 -- 1.42 0.91 -- 07 Possession of weapons -- -- -- -- -- -- -- 08 Public order offences -- -- 1.53 -- -- -- -- 09 Miscellaneous crimes against society 1.37 -- 1.34 -- 1.09 0.96 -- 10 Fraud offences 2.63 * 1.09 * -- -- 1.14 -- -- -- -- All offence types 2.11 * 1.02 1.11 1.12 1.36 * 1.04 1.21 * 0.94 0.83
Notes: * indicates a statistically significant difference; ‘--’ means too few in the ‘at risk’ population or experiencing the event to be analysed
51
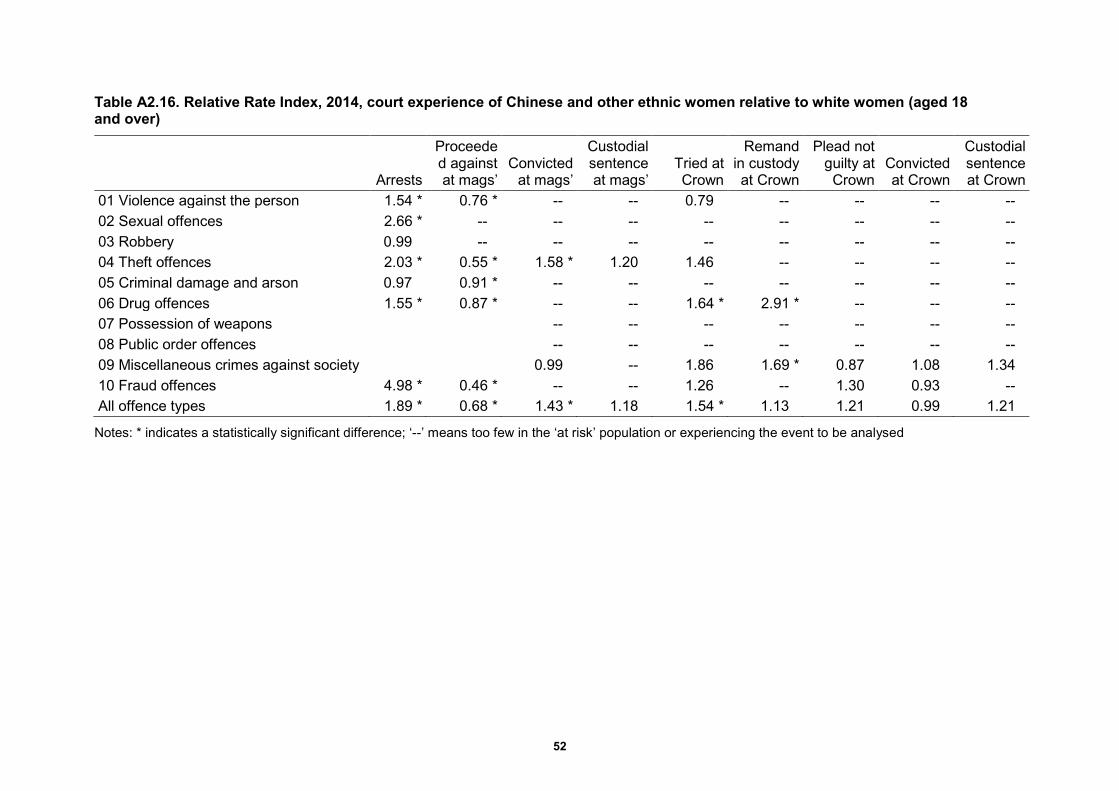
Table A2.16. Relative Rate Index, 2014, court experience of Chinese and other ethnic women relative to white women (aged 18 and over)
Arrests
Proceeded against at mags’
Convicted at mags’
Custodial sentence at mags’
Tried at Crown
Remand in custody at Crown
Plead not guilty at Crown
Convicted at Crown
Custodial sentence at Crown
01 Violence against the person 1.54 * 0.76 * -- -- 0.79 -- -- -- -- 02 Sexual offences 2.66 * -- -- -- -- -- -- -- -- 03 Robbery 0.99 -- -- -- -- -- -- -- -- 04 Theft offences 2.03 * 0.55 * 1.58 * 1.20 1.46 -- -- -- -- 05 Criminal damage and arson 0.97 0.91 * -- -- -- -- -- -- -- 06 Drug offences 1.55 * 0.87 * -- -- 1.64 * 2.91 * -- -- -- 07 Possession of weapons -- -- -- -- -- -- -- 08 Public order offences -- -- -- -- -- -- -- 09 Miscellaneous crimes against society 0.99 -- 1.86 1.69 * 0.87 1.08 1.34 10 Fraud offences 4.98 * 0.46 * -- -- 1.26 -- 1.30 0.93 -- All offence types 1.89 * 0.68 * 1.43 * 1.18 1.54 * 1.13 1.21 0.99 1.21
Notes: * indicates a statistically significant difference; ‘--’ means too few in the ‘at risk’ population or experiencing the event to be analysed
52