Embed Size (px)
Citation preview

Teacher and Teaching Effects on Students’ Attitudes and Behaviors
David Blazar
Harvard Graduate School of Education
Matthew A. Kraft
Brown University
March 2016
Abstract
Research has focused predominantly on how teachers affect students’ achievement on tests
despite evidence that a broad range of attitudes and behaviors are equally important to their long-
term success. We find that upper-elementary teachers have large effects on self-reported
measures of students’ self-efficacy in math, and happiness and behavior in class. Students’
attitudes and behaviors are predicted by teaching practices most proximal to these measures,
including teachers’ emotional support and classroom organization. However, teachers who are
effective at improving math test scores often are not equally effective at improving students’
attitudes and behaviors. These findings lend evidence to well-established theory on the
multidimensional nature of teaching and the need to identify strategies for improving the full
range of teachers’ skills.
Keywords: teacher effectiveness, instruction, non-cognitive outcomes, self-efficacy, happiness,
behavior
Suggested Citation:
Blazar, D. & Kraft, M. (2015). Teacher and teaching effects on students’ attitudes and behaviors.
Harvard University Working Paper.

1
1. Introduction
Empirical research on the education production function traditionally has examined how
teachers and their background characteristics contribute to students’ performance on
standardized tests (Todd & Wolpin, 2003; Hanushek & Rivkin, 2010). However, a substantial
body of evidence indicates that student learning is multidimensional, with many factors beyond
their core academic knowledge as important contributors to both short- and long-term success.1
For example, psychologists find that emotion and personality influence the quality of one’s
thinking (Baron, 1982) and how much a child learns in school (Duckworth, Quinn, &
Tsukayama, 2012). Longitudinal studies document the strong predictive power of measures of
childhood self-control, emotional stability, persistence, and motivation on health and labor
market outcomes in adulthood (Borghans, Duckworth, Heckman, & Ter Weel, 2008; Chetty et
al., 2011; Moffitt et. al., 2011). In fact, these sorts of attitudes and behaviors are stronger
predictors of some long-term outcomes than test scores (Chetty et al., 2011).
Consistent with these findings, decades worth of theory also have characterized teaching
as multidimensional. High-quality teachers are thought and expected not only to raise test scores
but also to provide emotionally supportive environments that contribute to students’ social and
emotional development, to manage classroom behaviors, to deliver accurate content, and to
support critical thinking (Cohen, 2011; Lampert, 2001; Pianta & Hamre, 2009). In recent years,
two research traditions have emerged to test this theory using empirical evidence. The first
tradition has focused on observations of classrooms as a means of identifying unique domains of
teaching practice (Authors, 2015; Hamre et al., 2013). Several of these domains, including
1 Although student outcomes beyond test scores often are referred to as “non-cognitive” skills, our preference, like
others (Duckworth & Yeager, 2015; Farrington et al., 2012), is to refer to each competency by name. For brevity, we
refer to them as “attitudes and behaviors.” We adopt these terms because they most closely characterize the measure
we focus on in this paper.

2
teachers’ interactions with students, classroom organization, and emphasis on critical thinking
within specific content areas, aim to support students’ development in areas beyond their core
academic skill. The second research tradition has focused on estimating internally valid estimates
of teachers’ contribution to student outcomes, often referred to as “teacher effects” (Chetty
Friedman, & Rockoff, 2014; Hanushek & Rivkin, 2010). These studies have found that, as with
test scores, teachers vary considerably in their ability to impact students’ social and emotional
development and a variety of observed school behaviors (Authors, 2016; Backes & Hansen,
2015; Gershenson, 2016; Jackson, 2012; Jennings & DiPrete, 2010; Koedel, 2008; Ladd &
Sorensen, 2015; Ruzek et al., 2014). Further, weak to moderate correlations between teacher
effects on different student outcomes suggest that test scores alone cannot identify teachers’ skill
in the classroom (Authors, 2016; Gershenson, 2016; Jackson, 2012; Jennings & DiPrete, 2010).
Our study is among the first to integrate these two research traditions, which largely have
developed in isolation. Working at the intersection of these traditions, we aim both to maximize
internal validity and to open up the “black box” of teacher effects by examining whether certain
dimensions of teaching practice predict students’ attitudes and behaviors. We refer to these
relationships between teaching practice and student outcomes as “teaching effects.” Specifically,
we ask three research questions:
(1) To what extent do teachers impact students’ attitudes and behaviors in class?
(2) To what extent do specific teaching practices impact students’ attitudes and
behaviors in class?
(3) Are teachers who are effective at raising test-score outcomes equally effective at
developing positive attitudes and behaviors in class?

3
To answer our research questions, we draw on a rich dataset from Blinded Project of
upper-elementary teachers’ math instruction that collected teacher-student links, observations of
teaching practice on two established observation instruments, students’ math performance on
both high- and low-stakes tests, and a student survey that captured their attitudes and behaviors
in class. We used this survey to construct our three primary outcomes: students’ self-reported
self-efficacy in math, happiness in class, and behavior in class. Although the specific attitudes
and behaviors we examine are limited to those available in Blinded Project data, they are
important outcomes of interest to researchers, policymakers, and parents (Borghans et al., 2008;
Chetty et al., 2011; Farrington et al., 2012). They also align with theories linking teachers and
teaching practice to outcomes beyond students’ core academic skills (Bandura, Barbaranelli,
Caprara, & Pastorelli, 1996; Pianta & Hamre, 2009), allowing us to test these theories explicitly.
We find that upper-elementary teachers in our sample have substantive impacts on
students’ self-reported attitudes and behaviors in addition to their math performance. We
estimate that the variation in teacher effects on students’ self-efficacy in math and behavior in
class is of similar magnitude to the variation in teacher effects on math test scores. Teacher
effects on students’ happiness in class are even larger than those for test-based outcomes.
Further, these outcomes are predicted by teaching practices most proximal to these measures,
thus aligning with theory and providing important face and construct validity to these measures.
Specifically, teachers’ emotional support for students is related both to their self-efficacy in math
and their happiness in class. Teachers’ classroom organization predicts students’ reports of their
own behavior in class. Errors in teachers’ presentation of mathematical content are negatively
related to students’ self-efficacy in math and happiness in class, as well as students’ math
performance. Finally, we find that teachers are not equally effective at improving all outcomes.

4
Compared to an unadjusted correlation between teacher effects on our two math achievement
tests of 0.64, the strongest unadjusted correlation between teacher effects on students’ math
achievement and effects on their attitudes or behavior is 0.19.
Together, these findings add further evidence for the multidimensional nature of teaching
and, thus, the need for researchers, policymakers, and practitioners to identify strategies for
improving these skills. In our conclusion, we discuss several ways in which policymakers and
practitioners may start to do so, including through the design and implementation of teacher
evaluation systems, teacher recruitment policies, and strategic teacher assignments.
2. Review of Related Research
Theories of teaching and learning have long emphasized the important role teachers play
in supporting students’ development in areas beyond their core academic skill. For example, in
their conceptualization of high-quality teaching, Pianta and Hamre (2009) describe a set of
emotional supports and organizational techniques that are equally important to learners as
teachers’ instructional methods. They posit that, by providing “emotional support and a
predictable, consistent, and safe environment” (p. 113), teachers can help students become more
self-reliant, motivated to learn, and willing to take risks. Further, by modeling strong
organizational and management structures, teachers can help build students’ own ability to self-
regulate. Content-specific views of teaching also highlight the importance of teacher behaviors
that develop students’ attitudes and behaviors in ways that may not directly impact test scores. In
mathematics, which is the focus of this paper, researchers and professional organizations have
advocated for teaching practices that emphasize critical thinking and problem solving around
authentic tasks (Lampert, 2001; National Council of Teachers of Mathematics [NCTM], 1989,
2014). Understanding the considerable stresses that this content can create for students, others

5
have pointed to teachers’ equally important role of developing students’ self-efficacy and
decreasing their anxiety in math (Bandura et al., 1996; Usher & Pajares, 2008; Wigfield &
Meece, 1988).
In recent years, development and use of observation instruments that capture the quality
of teachers’ instruction have provided a unique opportunity to examine these theories
empirically. One instrument in particular, the Classroom Assessment Scoring System (CLASS),
is organized around “meaningful patterns of [teacher] behavior…tied to underlying
developmental processes [in students]” (Pianta & Hamre, 2009, p. 112). Factor analyses of data
collected by this instrument have identified several unique aspects of teachers’ instruction:
teachers’ social and emotional interactions with students, their ability to organize and manage the
classroom environment, and their instructional supports in the delivery of content (Hafen et al.,
2015; Hamre et al., 2013). A number of studies from developers of the CLASS instrument and
their colleagues have described relationships between these dimensions and closely related
student attitudes and behaviors. For example, teachers’ interactions with students predicts
students’ social competence, engagement, and risk-taking; teachers’ classroom organization
predicts students’ engagement and behavior in class (Burchinal et al., 2008; Downer, Rimm-
Kaufman, & Pianta, 2007; Hamre, Hatfield, Pianta, & Jamil, 2014; Hamre & Pianta, 2001;
Luckner & Pianta, 2011; Mashburn et al., 2008; Pianta, La Paro, Payne, Cox, & Bradley, 2002).
With only a few exceptions (see Downer et al., 2007; Hamre & Pianta, 2001; Luckner & Pianta,
2011), these studies have focused on pre-kindergarten settings. Further, none of the studies can
rule out the possibility of omitted variables bias – that is, that teachers who have strong
interactions with students or behavior management techniques might also engage in additional
practices that are responsible for higher student outcomes.

6
Additional content-specific observation instruments highlight several other teaching
competencies with links to students’ attitudes and behaviors. For example, in this study we draw
on the Mathematical Quality of Instruction (MQI) to capture math-specific dimensions of
teachers’ classroom practice. Factor analyses of data captured both by this instrument and the
CLASS identified two teaching skills in addition to those described above: the cognitive demand
of math activities that teachers provide to students and the precision with which they deliver this
content (Authors, 2015). Validity evidence for the MQI has focused on the relationship between
these teaching practices and students’ math test scores (Author, 2015; Kane & Staiger, 2012),
which makes sense given the theoretical link between teachers’ content knowledge, delivery of
this content in the classroom, and students’ own understanding of the content (Hill et al., 2008).
However, as noted above, professional organizations and researchers also describe theoretical
links between the sorts of teaching practices captured on the MQI and student outcomes beyond
test scores (e.g., critical thinking, self-efficacy in math; Bandura et al., 1996; Lampert, 2001;
NCTM, 1989, 2014; Usher & Pajares, 2008; Wigfield & Meece, 1988) that, to our knowledge,
have not been tested.
In a separate line of research, several recent studies have borrowed from the literature on
teachers’ “value-added” to student test scores in order to document the magnitude of teacher
effects on a range of other outcomes. Consistent with the teacher effectiveness literature more
broadly, these studies attempt to isolate the unique effect of teachers on non-tested outcomes
from factors outside of teachers’ control (e.g., students’ prior achievement, race, gender,
socioeconomic status) and to limit any bias due to non-random sorting. In one of the first studies
of this kind, Jennings and DiPrete (2010) used the Early Childhood Longitudinal Study –
Kindergarten Cohort (ECLS-K) to estimate the role that teachers play in a composite measure of

7
kindergarten and first-grade students’ social and behavioral outcomes. They found teacher
effects on social and behavioral outcomes that were even larger (0.35 standard deviations [sd])
than effects on academic achievement. In a study of 35 middle school math teachers, Ruzek et al.
(2014) found small but meaningful teacher effects on motivation between 0.03 sd and 0.08 sd
among seventh graders. Authors (2016) found teacher effects on students’ self-reported measures
of grit, growth mindset and effort in class ranging between 0.14 and 0.17 sd. Additional studies
identified teacher effects on observed school behaviors, including absences, suspensions, grades,
grade progression, and graduation (Backes & Hansen, 2015; Gershenson, 2016; Jackson, 2012;
Koedel, 2008; Ladd & Sorensen, 2015).
To date, evidence is mixed on the extent to which teachers who improve test scores also
improve other outcomes. Four of the studies described above found weak relationships between
teacher effects on students’ academic performance and effects on other outcome measures.
Compared to a correlation of 0.42 between teacher effects on math achievement versus effects on
reading achievement, Jennings and DiPrete (2010) found correlations of 0.15 between teacher
effects on students’ social and behavioral outcomes and effects on either math or reading
achievement. Authors (2016) found correlations between teacher effects on achievement
outcomes and multiple social-emotional competencies were sometimes non-existent and never
greater than 0.23. Similarly, Gershenson (2016) and Jackson (2012) found weak or null
relationships between teacher effects on students’ academic performance and effects on observed
schools behaviors. However, correlations from two other studies were larger. Ruzek et al. (2014)
estimated a correlation of 0.50 between teacher effects on achievement versus effects on
students’ motivation in math class. Drawing on data from the MET project, Mihaly, McCaffrey,

8
Staiger, and Lockwood (2013) found a correlation of 0.57 between middle school teacher effects
on students’ self-reported effort versus effects on math test scores.
Our analyses extend this body of research in several ways. First, we estimate teacher
effects on additional attitudes and behaviors captured by students in upper-elementary grades.
We also are able to leverage data that offer the unique combination of a moderately sized sample
of teachers and students with lagged survey measures. Second, we utilize similar econometric
approaches to test the relationship between teaching practice and these same attitudes and
behaviors. These analyses allow us to examine the face and construct validity of our teacher
effect estimates and the extent to which they align with theory. Finally, we examine teacher and
teaching effects in the context of mathematics, which is essential for policy given a growing
focus of education reform on STEM education (Duncan, 2010; U.S. Department of Education,
2010).
3. Data and Sample
Beginning in the 2010-2011 school year, the Blinded Project engaged in a three-year data
collection process. Data came from participating fourth- and fifth-grade teachers (N = 310) in
four anonymous, urban school districts on the East coast of the United States who agreed to have
their classes videotaped, complete a teacher questionnaire, and help collect a set of student
outcomes. Teachers were clustered within 52 schools, with an average of six teachers per school.
Teacher-student links were verified for all study participants based on class rosters provided by
teachers. While this study focused on teachers’ math instruction, participants were generalists
who taught all subject areas. This is important, as it allowed us to consider the contribution of
individual teachers to students’ attitudes and behaviors that was not confounded by the influence
of multiple teachers in the same year. Despite having a non-random sample of teachers, evidence

9
from these same data indicated that teachers who participated in the study did not differ on their
effectiveness at improving students’ math test scores as those who did not participate (Authors,
in press). We describe this sample in more depth below.
3.1. Students’ Attitudes and Behaviors
As part of the expansive data collection effort, researchers administered a student survey
with items (N = 18) that were adapted from other large-scale surveys including the TRIPOD
survey project, the MET project, the National Assessment of Educational Progress (NAEP), and
the Trends in International Mathematics and Science Study (TIMSS) (see Appendix Table 1 for a
full list of items). Items were selected based on a review of the research literature and
identification of constructs thought most likely to be influenced by upper-elementary teachers
and math-specific teaching practices. Students rated all items on a five-point Likert scale where 1
= Totally Untrue and 5 = Totally True. We reverse coded items with negative valence in order to
form composites with other items.
Researchers and policymakers have raised several concerns about the use of self-reported
survey data to capture students’ underlying attitudes and behaviors. Students – and elementary
students in particular – may not be accurate reporters of their own attitudes and behaviors. Their
responses can be prone to “social desirability bias,” in which students “provide answers that are
desirable but not accurate” (Duckworth & Yeager, 2015, p. 239). Different frames of reference
also can bias responses. For example, school-wide norms around behavior and effort may change
the implicit standards of comparison that students use to judge their own behavior and effort
(Authors, 2016). In response to these concerns, we describe validity evidence both from our own
and other studies as we present each of our student outcomes below. We also attempted to
minimize the potential threat posed by reference bias through our modeling strategy.

10
Specifically, we restricted comparisons to teachers and students in the same school, which helps
limit potential differences in reference groups and social norms across schools that could
confound our analyses.
We identified a parsimonious set of three outcome measures based on a combination of
theory and exploratory factor analyses (see Appendix Table 1).2 The first outcome, which we call
Self-Efficacy in Math (10 items), is a variation on well-known constructs related to students’
effort, initiative, and perception that they can complete tasks. In other datasets focused on
elementary students, academic self-efficacy is correlated with math achievement around 0.21
(Multon, Brown, & Lent, 1991), which is quite close to the correlation we find between Self-
Efficacy in Math and the two math test scores (r = 0.25 and 0.22; see Table 1). These similarities
provide important validity evidence for our construct. The second related outcome measure is
Happiness in Class (5 items), which was collected in the second and third years of the study.
Exploratory factor analyses suggested that these items clustered together with those from Self-
Efficacy in Math to form a single construct. However, post-hoc review of these items against the
psychology literature from which they were derived suggests that they can be divided into a
separate domain. As above, this measure is a school-specific version of well-known scales that
capture students’ affect and enjoyment (Diener, 2000). Both Self-Efficacy in Math and Happiness
in Class have relatively high internal consistency reliabilities (0.76 and 0.82, respectively) that
are similar to those of self-reported attitudes and behaviors explored in other studies (Duckworth
2 We conducted factor analyses separately by year, given that there were fewer items in the first year. The Blinded
Project project added additional items in subsequent years to help increase reliability. In the second and third years,
each of the two factors has an eigenvalue above one, a conventionally used threshold for selecting factors (Kline,
1994). Even though the second factor consists of three items that also have loadings on the first factor between 0.35
and 0.48 – often taken as the minimum acceptable factor loading (Field, 2013; Kline, 1994) – this second factor
explains roughly 20% more of the variation across teachers and, therefore, has strong support for a substantively
separate construct (Field, 2013; Tabachnick & Fidell, 2001). In the first year of the study, the eigenvalue on this
second factor is less strong (0.78), and the two items that load onto it also load onto the first factor.

11
et al., 2007; John & Srivastava, 1999; Tsukayama et al., 2013). Further, self-reported measures
of similar constructs have been linked to long-term outcomes, including academic engagement
and earnings in adulthood, even conditioning on cognitive ability (King, McInerney, Ganotice, &
Villarosa, 2015; Lyubomirsky, King, & Diener, 2005).
The third and final construct consists of three items that were meant to hold together and
which we call Behavior in Class (internal consistency reliability is 0.74). Higher scores reflect
better, less disruptive behavior. Teacher reports of students’ classroom behavior have been found
to relate to antisocial behaviors in adolescence, criminal behavior in adulthood, and earnings
(Chetty et al., 2011; Segal, 2013; Moffitt et al., 2011; Tremblay et al., 1992). Our analysis differs
from these other studies in the self-reported nature of the behavior outcome. That said, other
studies also drawing on elementary school students found correlations between self-reported and
either parent- or teacher-reported measures of behavior that were similar in magnitude to
correlations between parent and teacher reports of student behavior (Achenbach, McConaughy,
& Howell, 1987; Goodman, 2001). Further, other studies have found correlations between
teacher-reported behavior of elementary school students and either reading or math achievement
(r = 0.22 to 0.28; Miles & Stipek, 2006; Tremblay et al., 1992) similar to the correlation we find
between students’ self-reported Behavior in Class and our two math test scores (r = 0.24 and
0.26; see Table 1). Together, this evidence provides both convergent and consequential validity
evidence for this outcome measure.
For all three of these outcomes, we created final scales by averaging raw student
responses across all available items and standardizing measures to have a mean of zero and a

12
standard deviation of one within each school year.3 We standardized within years, given that, for
some measures, the set of survey items varied across years.
3.2. Student Demographic and Test Score Information
Student demographic and achievement data came from district administrative records.
Demographic data include gender, race/ethnicity, free- or reduced-price lunch (FRPL) eligibility,
limited English proficiency (LEP) status, and special education (SPED) status. These records
also included current- and prior-year test scores in math and English Language Arts (ELA) on
state assessments, which we standardized within districts by grade, subject, and year using the
entire sample of students in each district, grade, subject, and year.
The project also administered a low-stakes mathematics assessment to all students in the
study. Validity evidence indicates internal consistency reliability of 0.82 or higher for each form
across grade levels and school years (Hickman, Fu, & Hill, 2012). We used this assessment in
addition to high-stakes tests given that teacher effects on two outcomes that aim to capture
similar underlying constructs (i.e., math achievement) provide a unique point of comparison
when examining the relationship between teacher effects on student outcomes that are less
closely related (i.e., math achievement versus attitudes and behaviors). Indeed, students’ high-
and low-stake math test scores are correlated more strongly (r = 0.70) than any other two
outcomes (see Table 1). Coding of items from both the low- and high-stakes tests also identify a
large degree of overlap in terms of content coverage and cognitive demand (Authors, 2015). All
tests focused most on numbers and operations (40% to 60%), followed by geometry (roughly
15%), and algebra (15% to 20%). By asking students to provide explanations of their thinking
solve non-routine problems such as identifying patterns, the low-stakes test also was similar to
3 Depending on the outcome, between 4% and 8% of students were missing a subset of items from survey scales. In
these instances, we created final scores by averaging across all available information.
13
the high-stakes tests in two districts; in the other two districts, items often asked students to
execute basic procedures.
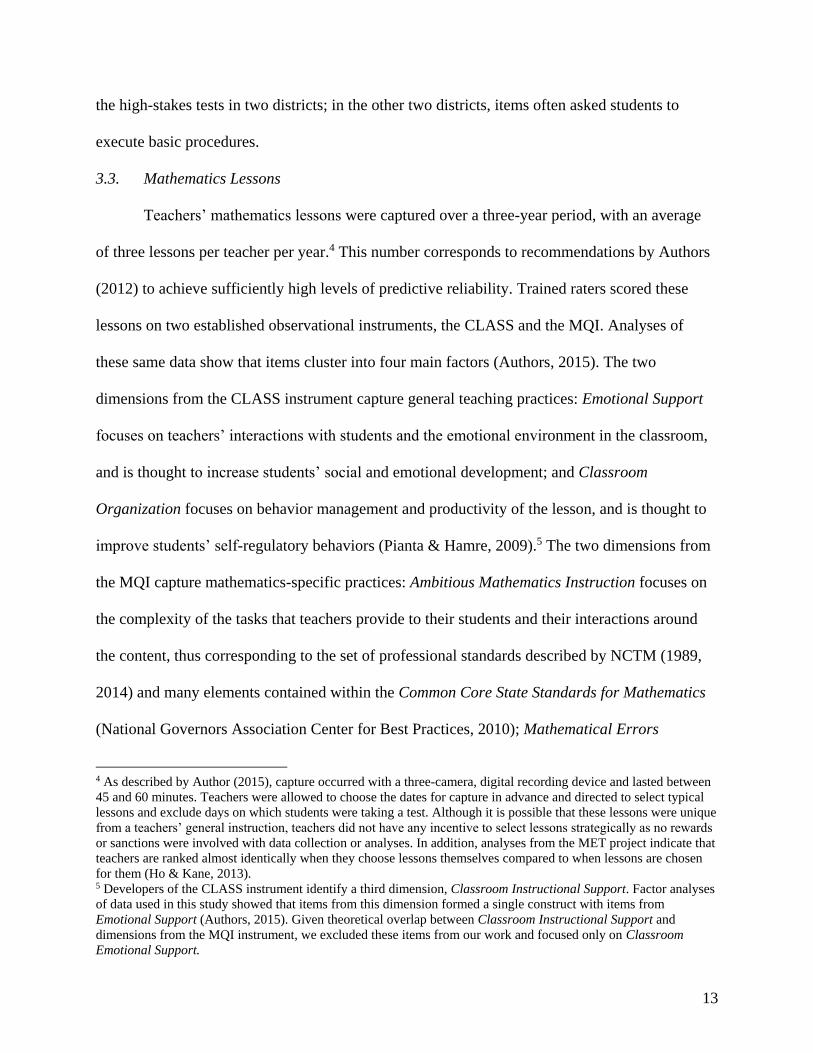
3.3. Mathematics Lessons
Teachers’ mathematics lessons were captured over a three-year period, with an average
of three lessons per teacher per year.4 This number corresponds to recommendations by Authors
(2012) to achieve sufficiently high levels of predictive reliability. Trained raters scored these
lessons on two established observational instruments, the CLASS and the MQI. Analyses of
these same data show that items cluster into four main factors (Authors, 2015). The two
dimensions from the CLASS instrument capture general teaching practices: Emotional Support
focuses on teachers’ interactions with students and the emotional environment in the classroom,
and is thought to increase students’ social and emotional development; and Classroom
Organization focuses on behavior management and productivity of the lesson, and is thought to
improve students’ self-regulatory behaviors (Pianta & Hamre, 2009).5 The two dimensions from
the MQI capture mathematics-specific practices: Ambitious Mathematics Instruction focuses on
the complexity of the tasks that teachers provide to their students and their interactions around
the content, thus corresponding to the set of professional standards described by NCTM (1989,
2014) and many elements contained within the Common Core State Standards for Mathematics
(National Governors Association Center for Best Practices, 2010); Mathematical Errors
4 As described by Author (2015), capture occurred with a three-camera, digital recording device and lasted between
45 and 60 minutes. Teachers were allowed to choose the dates for capture in advance and directed to select typical
lessons and exclude days on which students were taking a test. Although it is possible that these lessons were unique
from a teachers’ general instruction, teachers did not have any incentive to select lessons strategically as no rewards
or sanctions were involved with data collection or analyses. In addition, analyses from the MET project indicate that
teachers are ranked almost identically when they choose lessons themselves compared to when lessons are chosen
for them (Ho & Kane, 2013). 5 Developers of the CLASS instrument identify a third dimension, Classroom Instructional Support. Factor analyses
of data used in this study showed that items from this dimension formed a single construct with items from
Emotional Support (Authors, 2015). Given theoretical overlap between Classroom Instructional Support and
dimensions from the MQI instrument, we excluded these items from our work and focused only on Classroom
Emotional Support.

14
identifies any mathematical errors or imprecisions the teacher introduces into the lesson. Both
dimensions from the MQI are linked to teachers’ mathematical knowledge for teaching and, in
turn, to students’ math achievement (Author, 2015; Hill et al., 2008; Hill, Schilling, & Ball,
2004).
We estimate reliability for these metrics by calculating the amount of variance in teacher
scores that is attributable to the teacher (the intraclass correlation [ICC]), adjusted for the modal
number of lessons. These estimates are: 0.53, 0.63, 0.74, and 0.56 for Emotional Support,
Classroom Organization, Ambitious Mathematics Instruction, and Mathematical Errors,
respectively (see Table 2). Though some of these estimates are lower than conventionally
acceptable levels (0.7), they are consistent with those generated from similar studies (Kane &
Staiger, 2012). Correlations between dimensions range from roughly 0 (between Emotional
Support and Mathematical Errors) to 0.46 (between Emotional Support and Classroom
Organization). Given that teachers contributed different number of lessons to the project, which
could lead to noise in these observational measures, we utilized empirical Bayes estimation to
shrink scores back to the mean based on their precision (see below for more details). We
standardized final scores within the full sample of teachers to have a mean of zero and a standard
deviation of one.
3.4. Sample Restrictions
In choosing our analysis sample, we faced a tradeoff between precision and internal
validity. Including all possible teachers would maximize the precision of our estimates. At the
same time, we lacked critical data for some students and teachers that could have been used to
guard against potential sources of bias. Thus, we chose to make two important restrictions to our
original sample of teachers in order to strengthen the internal validity of our findings. First, for

15
all analyses predicting students’ attitudes and behaviors, we only included fifth grade teachers
who happened to have students who also had been part of the project in the fourth grade and,
therefore, took the survey in the prior year. This group included between 51 and 111 teachers and
between 548 and 1,529 students. For analyses predicting test score outcomes, we were able to
maintain the full sample of 310 teachers, whose 10,575 students all had test scores in the
previous year. Second, in analyses relating domains of teaching practice to student outcomes, we
further restricted our sample to teachers who themselves were part of the study for more than one
year, which allowed us to use out-of-year observation scores that were not confounded with the
specific set of students in the classroom. This reduced our analysis samples to between 47 and 93
teachers and between 517 and 1,362 students when predicting students’ attitudes and behaviors,
and 196 teachers and 8,660 students when predicting math test scores. We describe the rationale
for these restrictions in more detail below.
In Table 3, we present descriptive statistics on teachers and their students in the full
sample (column 1), as well as those who were ever in any of our analyses predicting students’
attitudes and behaviors (column 2).6 We find that teachers look relatively similar across these
two analytic samples, with no statistically significant differences on any observable
characteristics.7 Sixteen percent of teachers were male and 65% were white. Eight percent
received their teaching certification through an alternative pathway. The average number of
6 Information on teachers’ background and knowledge were captured on a questionnaire administered in the fall of
each year. Survey items included gender, race/ethnicity, years teaching math, route to certification, and amount of
undergraduate or graduate coursework in math and math courses for teaching (scored on a Likert scale from 1 to 4).
For simplicity, we averaged these last two items to form one construct capturing teachers’ mathematics coursework.
Further, the survey included a test of teachers’ mathematical content knowledge, with items from both the
Mathematical Knowledge for Teaching assessment (Hill, Schilling, & Ball, 2004), which captures math-specific
pedagogical knowledge, and the Massachusetts Test for Educator Licensure. Teacher scores were generated by
IRTPro software and standardized in these models, with a reliability of 0.92. (For more information about these
constructs, see Authors, 2015.) 7 Descriptive statistics and formal comparisons of other samples show similar patterns and are available upon
request.

16
years of teaching experience was roughly 10. Value-added scores on state math tests were right
around the mean for each district (0.01 sd). Authors (in press) tested formally for differences in
these value-added scores between project teachers and the full population of teachers in each
district and found none, lending important external validity to our findings
We do observe some statistically significant differences between student characteristics
in the full sample versus the subsample. For example, the percentage of students identified as
limited English proficient was 20% in the full sample compared to 14% in the sample of students
who ever were part of analyses drawing on our survey measures. Average prior achievement
scores were 0.10 sd and 0.09 sd in math and ELA in the full sample, respectively, compared to
0.18 sd and 0.20 sd in the subsample. Although variation in samples could result in dissimilar
estimates across models, the overall character of our findings is unlikely to be driven by these
modest differences. Further, students in our samples look similar to those in many urban districts
in the United States, where roughly 68% are eligible for free or reduced-price lunch, 14% are
classified as in need of special education services, and 16% are identified as limited English
proficient; roughly 31% are African American, 39% are Hispanic, and 28% are white (Council of
the Great City Schools, 2013).
4. Empirical Strategy
4.1. Estimating Teacher Effects on Students’ Attitudes and Behaviors
Like others who aim to examine the contribution of individual teachers to student
outcomes, we began by specifying an education production function model of each outcome for
student i in district d, school s, grade g, class c with teacher j at time t:
(1) 𝑂𝑈𝑇𝐶𝑂𝑀𝐸𝑖𝑑𝑠𝑔𝑗𝑐𝑡 = 𝛼𝑓(𝐴𝑖𝑡−1) + 𝜋𝑋𝑖𝑡 + 𝜑�̅�𝑖𝑡𝑐 + 𝜏𝑑𝑔𝑡 + (𝜇𝑗 + 𝛿𝑗𝑐 + 휀𝑖𝑑𝑠𝑔𝑗𝑐𝑡)

17
𝑂𝑈𝑇𝐶𝑂𝑀𝐸𝑖𝑑𝑠𝑔𝑗𝑐𝑡 is used interchangeably for both math test scores and students’ attitudes and
behaviors, which we modeled in separate equations as a cubic function of students’ prior
achievement, 𝐴𝑖𝑡−1, in both math and ELA on the high-stakes district tests8; demographic
characteristics, 𝑋𝑖𝑡, including gender, race, FRPL eligibility, SPED status, and LEP status; these
same test-score variables and demographic characteristics averaged to the class level, �̅�𝑖𝑡𝑐 ; and
district-by-grade-by-year fixed effects, 𝜏𝑑𝑔𝑡, that account for scaling of high-stakes test scores at
this level. The error structure consists of both teacher- and class-level random effects, 𝜇𝑗 and 𝛿𝑗𝑐,
respectively, and a student-specific error term, 휀𝑖𝑑𝑠𝑔𝑗𝑐𝑡. Given our focus on elementary teachers,
over 97% of teachers in our sample worked with just one set of students in a given year. Thus,
class effects are estimated by observing teachers in multiple years and are analogous to teacher-
by-year effects.
The key identifying assumption of this model is that estimates are not biased by non-
random sorting of students to teachers. Recent experimental (Kane, McCaffrey, Miller, &
Staiger, 2013) and quasi-experimental (Chetty et al., 2014) analyses provide strong empirical
support for this claim when student achievement is the outcome of interest. However, much less
is known about bias and sorting mechanisms when other outcomes are used. For example, it is
quite possible that students were sorted to teachers based on their classroom behavior in ways
that were unrelated to their prior achievement. To address this possibility, we made two
modifications to equation (2). First, we included school fixed effects, 𝜎𝑠, to account for sorting of
8 We controlled for prior-year scores only on the high-stakes assessments and not on the low-stakes assessment for
three reasons. First, including prior low-stakes test scores would reduce our full sample by more than 2,200 students.
This is because the assessment was not given to students in District 4 in the first year of the study (N = 1,826
students). Further, an additional 413 students were missing fall test scores given that they were not present in class
on the day it was administered. Second, prior-year scores on the high- and low-stakes test are correlated at 0.71,
suggesting that including both would not help to explain substantively more variation in our outcomes. Third,
sorting of students to teachers is most likely to occur based on student performance on the high-stakes assessments
since it was readily observable to schools; achievement on the low-stakes test was not.

18
students and teachers across schools. This means that estimates rely only on between-school
variation, which has been common practice in the research literature when estimating teacher
effects on student achievement. In their review of this literature, Hanushek and Rivkin (2010)
propose ignoring the between-school component because it is “surprisingly small” and because
including this component leads to “potential sorting, testing, and other interpretative problems”
(p. 268). Other recent studies estimating teacher effects on student outcomes beyond test scores
have used this same approach (Backes & Hansen, 2015; Gershenson, 2016; Jackson, 2012; Ladd
& Sorensen, 2015). Another important benefit of within-school comparisons is that it minimizes
the possibility of reference bias in our self-reported measures (Authors, 2016; Duckworth &
Yeager, 2015). As a second modification for models that predict each of our three student survey
measures, we included 𝑂𝑈𝑇𝐶𝑂𝑀𝐸𝑖𝑡−1 on the right-hand side of the equation in addition to prior
achievement – that is, when predicting students’ Behavior in Class, we controlled for students’
self-reported Behavior in Class in the prior year.9 This strategy helps account for within-school
sorting on factors other than prior achievement.
Using equation (1), we estimated the variance of 𝜇𝑗, which is the stable component of
teacher effects. We report the standard deviation of these estimates across outcomes. This
parameter captures the magnitude of the variability of teacher effects. With the exception of
teacher effects on students’ Happiness in Class, where survey items were not available in the
first year of the study, we included 𝛿𝑗𝑐 in order to separate out the time-varying portion of
9 It is important to note that adding prior survey responses to the education production function is not entirely
analogous to doing so with prior achievement scores. While achievement outcomes have roughly the same reference
group across administrations, the surveys do not. This is because survey items often asked about students’
experiences “in this class.” All three Behavior in Class items and all five Happiness in Class items included this or
similar language, as did five of the 10 items from Self-Efficacy in Math. That said, moderate year-to-year
correlations of 0.39, 0.38, and 0.53 for Self-Efficacy in Math, Happiness in Class, and Behavior in Class,
respectively, suggest that these items do serve as important controls. Comparatively, year-to-year correlations for the
high- and low-stakes tests are 0.75 and 0.77.
19
teacher effects, combined with peer effects and any other class-level shocks. The fact that we are
able to separate class effects from teacher effects is an important extension of prior studies
examining teacher effects on outcomes beyond test scores, many of which only observed
teachers at one point in time. Because 𝜇𝑗 is measured imprecisely given typical class sizes,
unadjusted estimates would overstate the true variation in teacher effects. Thus, we utilized
empirical Bayes estimation to shrink each score for teacher j back toward the mean based on its
precision (Raudenbush & Bryk, 2002), where precision is a function of the number of students
attributed to each teacher or class. Like others interested in the variance of teacher effects (e.g.,
Chetty et al., 2011), we specified this parameter as a random effect, which provides unbiased
model-based estimates of the true population variance of teacher effects.10
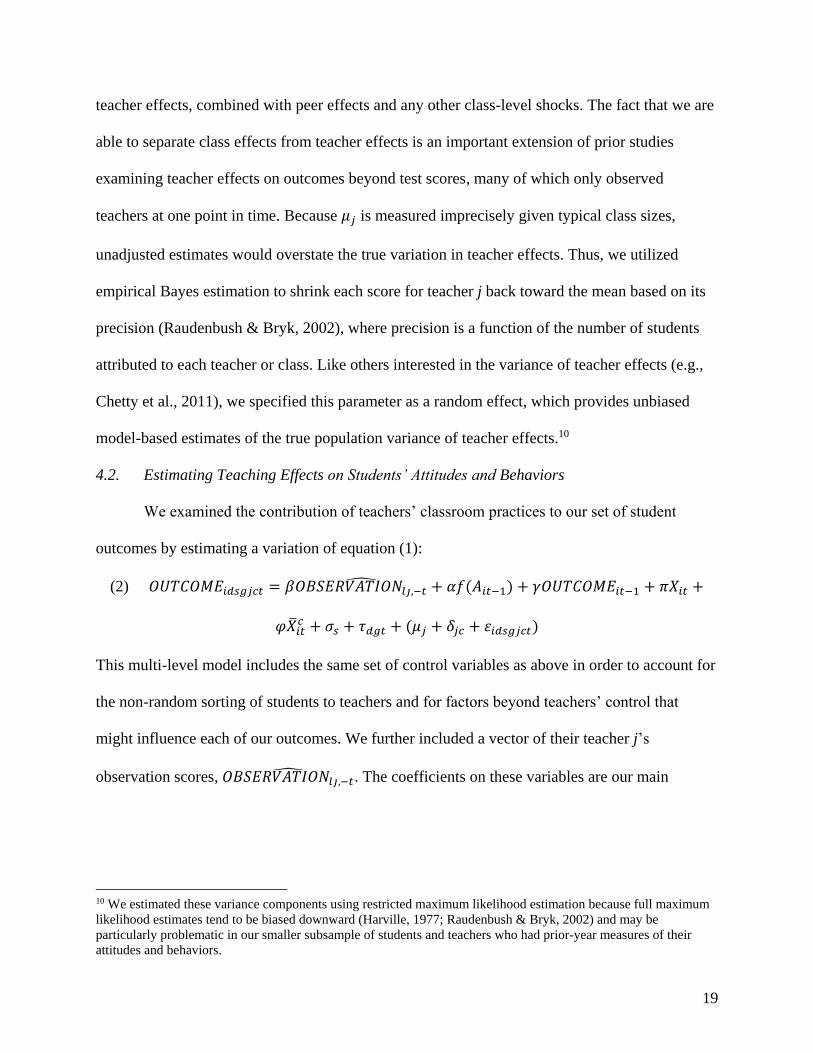
4.2. Estimating Teaching Effects on Students’ Attitudes and Behaviors
We examined the contribution of teachers’ classroom practices to our set of student
outcomes by estimating a variation of equation (1):
(2) 𝑂𝑈𝑇𝐶𝑂𝑀𝐸𝑖𝑑𝑠𝑔𝑗𝑐𝑡 = 𝛽𝑂𝐵𝑆𝐸𝑅𝑉𝐴𝑇𝐼𝑂𝑁𝑙𝑗,−𝑡̂ +𝛼𝑓(𝐴𝑖𝑡−1) + 𝛾𝑂𝑈𝑇𝐶𝑂𝑀𝐸𝑖𝑡−1 + 𝜋𝑋𝑖𝑡 +
𝜑�̅�𝑖𝑡𝑐 + 𝜎𝑠 + 𝜏𝑑𝑔𝑡 + (𝜇𝑗 + 𝛿𝑗𝑐 + 휀𝑖𝑑𝑠𝑔𝑗𝑐𝑡)
This multi-level model includes the same set of control variables as above in order to account for
the non-random sorting of students to teachers and for factors beyond teachers’ control that
might influence each of our outcomes. We further included a vector of their teacher j’s
observation scores, 𝑂𝐵𝑆𝐸𝑅𝑉𝐴𝑇𝐼𝑂𝑁𝑙𝑗,−𝑡̂ . The coefficients on these variables are our main
10 We estimated these variance components using restricted maximum likelihood estimation because full maximum
likelihood estimates tend to be biased downward (Harville, 1977; Raudenbush & Bryk, 2002) and may be
particularly problematic in our smaller subsample of students and teachers who had prior-year measures of their
attitudes and behaviors.

20
parameters of interest and can be interpreted as the change in standard deviation units for each
outcome associated with exposure to teaching practice one standard deviation above the mean.11
One concern when relating observation scores to student survey outcomes is that they
may capture the same behaviors. For example, teachers may receive credit on the Classroom
Organization domain when their students demonstrate orderly behavior. In this case, we would
have the same observed behaviors on both the left and right side of our equation relating
instructional quality to student outcomes, which would inflate our teaching effect estimates. A
related concern is that the specific students in the classroom may influence teachers’
instructional quality (Authors, 2015; Steinberg & Garrett, in press; Whitehurst, Chingos, &
Lindquist, 2014).12 While the direction of bias is not as clear here – as either lesser- or higher-
quality teachers could be sorted to harder to educate classrooms – this possibility also could lead
to incorrect estimates. To avoid these sources of bias, we only included lessons captured in years
other than those in which student outcomes were measured, denoted by –t in the subscript of
𝑂𝐵𝑆𝐸𝑅𝑉𝐴𝑇𝐼𝑂𝑁𝑙𝑗,−𝑡̂ . As noted above, these are predicted estimates that aim to reduce
measurement error in our observation measures.13 To the extent that instructional quality varies
11 Models were fit using full maximum likelihood, given our focus in this analysis on the fixed rather than the
stochastic portion of the model; full maximum likelihood allows us to compare estimates from the fixed portion of
the equation between nested models (Harville, 1977; Raudenbush & Bryk, 2002). 12 In our dataset, observable classroom characteristics do not appear to influence teachers’ observation ratings.
Correlations between observation scores adjusted for classroom characteristics, including gender, race, free or
reduced-price lunch eligibility, special education status, limited English proficiency, and prior achievement in both
math and English language arts – and unadjusted scores range from 0.93 (for Classroom Organization) to 0.97 (for
Mathematical Errors). Further, patterns of results in our teaching effect estimates are almost identical when we use
adjusted versus unadjusted scores. Below, we present findings with unadjusted scores. 13 To estimate these scores, we specified the following hierarchical linear model separately for each school year:
𝑂𝐵𝑆𝐸𝑅𝑉𝐴𝑇𝐼𝑂𝑁𝑙𝑗,−𝑡 = 𝛾𝑗 + 휀𝑙𝑗𝑡
The outcome is the observation score for lesson l from teacher j in years other than t; 𝛾𝑗 is a random effect for each
teacher, and 휀𝑙𝑗𝑡 is the residual. For each domain of teaching practice and school year, we utilized standardized
estimates of the teacher-level residual as each teacher’s observation score in that year. Thus, scores vary across time.
In the main text, we refer to these teacher-level residual as 𝑂𝐵𝑆𝐸𝑅𝑉𝐴𝑇𝐼𝑂𝑁𝑙𝑗,−𝑡̂ rather than 𝛾�̂� for ease of
interpretation for readers.

21
across years, using out-of-year observation scores creates a lower-bound estimate of the true
relationship between instructional quality and student outcomes. We consider this an important
tradeoff to minimize potential bias.
An additional concern for identification is the endogeneity of observed classroom quality.
Our preferred analytic approach attempted to account for potential sources of bias by
conditioning estimates of the relationship between one dimension of teaching practice and
student outcomes on the three other dimensions.14 An important caveat here is that we only
observed teachers’ instruction during math lessons and, thus, may not capture important
pedagogical practices teachers used with these students when teaching other subjects. Including
dimensions from the CLASS instrument, which are meant to capture instructional quality across
subject areas (Pianta & Hamre, 2009), helps account for some of this concern. However, given
that we were not able to isolate one dimension of teaching quality from all others, we consider
this approach as providing suggestive rather than conclusive evidence on the underlying causal
relationship between teaching practice and students’ attitudes and behaviors.
4.3. Estimating the Relationship Between Teacher Effects Across Multiple Student Outcomes
In our third and final set of analyses, we examined whether teachers who are effective at
raising math test scores are equally effective at developing students’ attitudes and behaviors. To
do so, we drew on equation (1) to estimate �̂�𝑗 for each outcome and teacher j. These estimates
capture the residual variation in each outcome attributable to each teacher, or their “value-added”
14 For our main analyses, we chose not to control for other observable characteristics of teachers (e.g., teaching
experience, math content knowledge, certification pathway, education), as these factors may be tied directly to
teachers’ practices. From a policy perspective, we are less interested in where and how teachers picked up good
practices, so long as they have them. That said, in separate analyses (available upon request), we re-ran models
controlling for the four background characteristics listed above and found that patterns of results were unchanged.
None of these teacher characteristics predicted student outcomes when also controlling for dimensions of teaching
quality.
22
score. Then, we generated a correlation matrix of these teacher effect estimates. For consistency,
we continued to specify this parameter as a random effect rather than fixed effects.
Despite attempts to increase the precision of these estimates through empirical Bayes
estimation, estimates of individual teacher effects are measured with error that will attenuate
these correlations (Spearman, 1904). Thus, if we were to find weak to moderate correlations
between different measures of teacher effectiveness, this could identify multidimensionality or
could result from measurement challenges, including the validity and reliability of individual
constructs (Chin & Goldhaber, 2015). For example, prior research suggests that different tests of
students’ academic performance can lead to different teacher rankings, even when those tests
measure similar underlying constructs (Lockwood et al., 2007; Papay, 2011). To address this
concern, we focus our discussion on relative rankings in correlations between teacher effect
estimates rather than their absolute magnitudes. Specifically, we examine how correlations
between teacher effects on two closely related student outcomes (e.g., two math achievement
tests) compare with correlations between teacher effects on outcomes that aim to capture
different underlying constructs. In light of research highlighted above, we did not expect the
correlation between teacher effects on high- and low-stakes math tests to be 1 (or, for that matter,
close to 1). However, we hypothesized that these relationships should be stronger than the
relationship between teacher effects on students’ math performance and effects on their attitudes
and behaviors. We also present disattenuated correlations in an online appendix to confirm that
the conclusions we draw from these comparisons are not a product of differential measurement
properties across outcomes.
5. Results
5.1. Do Teachers Impact Students’ Attitudes and Behaviors?

23
We begin by presenting results of the magnitude of teacher effects in Table 4. Here, we
observe sizable teacher effects on students’ attitudes and behaviors that are similar to teacher
effects on students’ academic performance. Starting first with teacher effects on students’
academic performance, we find that a one standard deviation difference in teacher effectiveness
is equivalent to a 0.17 sd or 0.18 sd difference in students’ math achievement. In other words,
relative to an average teacher, teachers at the 84th percentile of the distribution of effectiveness
move the medium student up to roughly the 57th percentile of math achievement. Notably, these
findings are similar to those from other studies that also estimate within-school teacher effects in
large administrative datasets (Hanushek & Rivkin, 2010). This suggests that our use of school
fixed effects with a more limited number of teachers observed within a given school does not
appear to overly restrict our identifying variation.15 Estimated teacher effects on students’ self-
reported Self-Efficacy in Math and Behavior in Class are 0.14 sd and 0.15 sd, respectively. The
largest teacher effects we observe are on students’ Happiness in Class, of 0.31 sd. Given that we
do not have multiple years of data to separate out class effects for this measure, we interpret this
estimate as the upward bound of true teacher effects on Happiness in Class. Rescaling this
estimate by the ratio of teacher effects with and without class effects for Self-Efficacy in Math
(0.14/0.19 = 0.74) produces an estimate of stable teacher effects on Happiness in Class of 0.23
sd, still larger than effects for other outcomes.16
5.2. Do Specific Teaching Practices Impact Students’ Attitudes and Behaviors?
15 The variation in teacher effects on each outcome is similar in models that exclude school fixed effects.
Specifically, these estimates are 0.19 sd for teacher effects on the high-stakes math test, 0.20 sd for teacher effects
on the low-stakes math test, 0.15 sd for teacher effects on Self-Efficacy in Math, 0.33 sd for teacher effects on
Happiness in Class, and 0.15 sd for teacher effects on Behavior in Class. Results are almost identical when we
control for observable school characteristics. 16 We find that teacher effects from models that exclude class effects are between 13% to 36% larger in magnitude
than effects from models that include these class effects. This suggests that analyses that do not take into account
classroom level shocks likely produce upwardly biased estimates of stable teacher effects.

24
Next, we examine whether certain characteristics of teachers’ instructional practice help
explain the sizable teacher effects described above (see Table 5). We present unconditional
estimates in Panel A, where the relationship between one dimension of teaching practice and
student outcomes is estimated without controlling for the other three dimensions. Thus, cells
contain estimates from separate regression models. In Panel B, we present conditional estimates,
where all four dimensions of teaching quality are included in the same regression model. Here,
columns contain estimates from separate regression models. In all models, we control for student
and class characteristics, and school fixed effects. We present all estimates as standardized effect
sizes, which allows us to make comparisons across models and outcome measures. With one
exception, which we highlight below, unconditional and conditional estimates are quite similar.
Therefore, we focus on discussion on our preferred conditional estimates.
We find that students’ attitudes and behaviors are predicted by both general and content-
specific teaching practices in ways that generally align with theory. For example, teachers’
Emotional Support is positively associated with the two closely related student constructs, Self-
Efficacy in Math and Happiness in Class. Specifically, a one standard deviation increase in
teachers’ Emotional Support is associated with a 0.14 sd increase in students’ Self-Efficacy in
Math and a 0.37 sd increase in students’ Happiness in Class. These finding makes sense given
that Emotional Support captures teacher behaviors such as their sensitivity to students, regard for
students’ perspective, and the extent to which they create a positive climate in the classroom. We
also find that Classroom Organization, which captures teachers’ behavior management skills and
productivity in delivering content, is positively related to students’ reports of their own Behavior
in Class (0.08 sd). This suggests that teachers who create an orderly classroom likely create a
model for students’ own ability to self-regulate. Despite this positive relationship, we find that

25
Classroom Organization is negatively associated with Happiness in Class (-0.23 sd), suggesting
that classrooms that are overly focused on routines and management are negatively related to
students’ enjoyment in class. At the same time, this is the one instance where our estimate is
sensitive to other teaching characteristics included in the model; when we estimate the
relationship between teachers’ Classroom Organization and students’ Happiness in Class
without controlling for the three other dimensions of teaching quality, this estimate is roughly 0
sd and is not statistically significant. Finally, we find that the degree to which teachers commit
Mathematical Errors is negatively related to students’ Self-Efficacy in Math (-0.09 sd) and
Happiness in Class (-0.18 sd). These findings illuminate how a teacher’s ability to present
mathematics with clarity and without serious mistakes is related to their students’ perceptions
that they can complete math tasks and their enjoyment in class.17
Comparatively, when predicting scores on both math tests, we only find one marginally
significant relationship – between Mathematical Errors and the high-stakes math test (-0.02 sd).
For two other dimensions of teaching quality, Emotional Support and Ambitious Mathematics
Instruction, estimates are signed in the way we would expect and with similar magnitudes,
though they are not statistically significant. Given the consistency of estimates across the two
math tests and our restricted sample size, it is possible that non-significant results are due to
limited statistical power.18 At the same time, even if true relationships exist between these
17 When we adjusted p-values for estimates presented in Table 5 to account for multiple hypothesis testing using
both the Šidák and Bonferroni algorithms (Dunn, 1961; Šidák, 1967), relationships between Emotional Support and
both Self-Efficacy in Math and Happiness in Class, as well as between Mathematical Errors and Self-Efficacy in
Math remained statistically significant. 18 In similar analyses in a subset of the Blinded Project data, Author (2015) did find a statistically significant
relationship between Ambitious Mathematics Instruction and the low-stakes math test of 0.11 sd. The 95%
confidence interval around that point estimate overlaps with the 95% confidence interval relating Ambitious
Mathematics Instruction to the low-stakes math test in this analysis. Estimates of the relationship between the other
three domains of teaching practice and low-stakes math test scores were of smaller magnitude and not statistically
significant. Differences between the two studies likely emerge from the fact that we drew on a larger sample with an
additional year of data, as well as slight modifications to our identification strategy.

26
teaching practices and students’ math test scores, they are likely weaker than those between
teaching practices and students’ attitudes and behaviors. For example, we find that the 95%
confidence intervals relating Classroom Emotional Support to Self-Efficacy in Math [0.068,
0.202] and Happiness in Class [0.162, 0.544] do not overlap with the 95% confidence intervals
for any of the point estimates predicting math test scores. This suggests that, still, very little is
known about how specific classroom teaching practices are related to student achievement in
math.
5.3. Are Teachers Equally Effective at Raising Different Student Outcomes?
In Table 6, we present correlations between teacher effects on each of our student
outcomes. The fact that teacher effects are measured with error makes it difficult to estimate the
precise magnitude of these correlations. Instead, we describe relative differences in correlations,
focusing on the extent to which teacher effects within outcome type – i.e., teacher effects on the
two math achievement tests or effects on students’ attitudes and behaviors – are similar or
different from correlations between teacher effects across outcome type. We illustrate these
differences in Figure 1, where Panel A presents scatter plots of these relationships between
teacher effects within outcome type and Panel B does the same across outcome type.
Recognizing that not all of our survey outcomes are meant to capture the same underlying
construct, we also describe relative differences in correlations between teacher effects on these
different measures. We also note that even an extremely conservative adjustment that scales
correlations by the inverse of the square root reliabilities lead to a similar overall pattern of
results (see Appendix Table 2 for reliabilities and Appendix Table 3 for disattenuated
correlations).19
19 We estimated the reliability of our teacher effects estimate through the signal-to-noise ratio:

27
Examining the correlations of teacher effect estimates reveals that individual teachers
vary considerably in their ability to impact different students outcomes. As hypothesized, we
find the strongest correlations between teacher effects within outcome type. Similar to Corcoran,
Jennings, and Beveridge (2012), we estimate a correlation of 0.64 between teacher effects on our
high- and low-stakes math achievement tests. We also observe a strong correlation of 0.49
between teacher effects on two of the student survey measures, students’ Behavior in Class and
Self-Efficacy in Math. Comparatively, the correlations between teacher effects across outcome
type are much weaker. Examining the scatter plots in Figure 1, we observe much more
dispersion around the best-fit line in Panel B than in Panel A. The strongest relationship we
observe across outcome types is between teacher effects on the low-stakes math test and effects
on Self-Efficacy in Math (r = 0.19). The lower bound of the 95% confidence interval around the
correlation between teacher effects on the two achievement measures [0.56, 0.72] does not
overlap with the 95% confidence interval of the correlation between teacher effects on the low-
𝑉𝑎𝑟(𝜇𝑗)
𝑉𝑎𝑟(𝜇𝑗) + (∑ 𝑠𝑒𝑗
2𝑛𝑗=1
𝑛)
The numerator is the observed variance in the teacher effect, or the squared value of the standard deviation of 𝜇𝑗,
which is our main parameter of interest. The denominator is an estimate of the true teacher-level variance, which we
approximate as the sum of the estimated variance in the teacher effect and the average squared standard error of
individual teacher effect estimates. The number of teachers in the sample is detonated by n, and 𝑠𝑒𝑗 is the standard
error of the teacher effect for teacher j. See McCaffrey, Sass, Lockwood, & Mihaly (2009) for a similar approach.
In Appendix Table 2, we calculate two sets of estimates. The first calculates the precision of our main
teacher effect estimates, which we use to calculate disattenuated correlations in Appendix Table 3. Given that these
teacher effect estimates are derived from models with slightly different samples, which could impact reliability, we
also calculated these estimates of precision in a balanced sample of teachers and students who had complete data on
all measures (column 2; N = 51 teachers and 548 students). Here, we found that precision was quite comparable
across teacher effects, ranging from 0.50 (for teacher effects on Self Efficacy in Math) to 0.56 (for teacher effects on
Happiness in Class).
In Appendix Table 3, relative differences in disattenuated correlations are similar to those presented above.
We still observe much stronger relationships between teacher effects on the two math tests and between teacher
effects on Behavior in Class and Self-Efficacy in Math than between other outcome measures. In some cases, these
disattenuated correlations are close to 1, which we argue are unlikely to be the true relationships in the population.
Overcorrections likely are driven by moderate reliabilities and moderate sample sizes (Zimmerman & Williams,
1997).

28
stakes math test and effects on Self-Efficacy in Math [-0.01, 0.39], indicating that these two
correlations are substantively and statistically significantly different from each other. Using this
same approach, we also can distinguish the correlation describing the relationship between
teacher effects on the two math tests from all other correlations relating teacher effects on test
scores to effects on students’ attitudes and behaviors. We caution against placing too much
emphasis on the negative correlations between teacher effects on test scores and effects on
Happiness in Class (r = -0.09 and -0.21 for the high- and low-stakes tests, respectively). Given
limited precision of this relationship, we cannot reject the null hypothesis of no relationship or
rule out weak, positive or negative correlations among these measures.
Although it is useful to make comparisons between the strength of the relationships
between teacher effects on different measures of students’ attitudes and behaviors, measurement
error limits our ability to do so precisely. At face value, we find correlations between teacher
effects on Happiness in Class and effects on the two other survey measures (r = 0.26 for Self-
Efficacy in Math and 0.21 for Behavior in Class) that are weaker than the correlation between
teacher effects on Self-Efficacy in Math and effects on Behavior in Class described above (r =
0.49). One possible interpretation of these findings is that teachers who improve students’
Happiness in Class are not equally effective at raising other attitudes and behaviors. For
example, teachers might make students happy in class in unconstructive ways that do not also
benefit their self-efficacy or behavior. At the same time, these correlations between teacher
effects on Happiness in Class and the other two survey measures have large confidence intervals,
likely due to imprecision in our estimate of teacher effects on Happiness in Class. Thus, we are
not able to distinguish either correlation from the correlation between teacher effects on
Behavior in Class and effects on Self-Efficacy in Math.
29
6. Discussion and Conclusion
The teacher effectiveness literature has profoundly shaped education policy over the last
decade and has served as the catalyst for sweeping reforms around teacher recruitment,
evaluation, development, and retention. However, by and large, this literature has focused on
teachers’ contribution to students’ test scores. Even research studies such as the MET project and
new teacher evaluation systems that focus on “multiple measures” of teacher effectiveness
(Center on Great Teachers and Leaders, 2013; Kane et al., 2013) generally attempt to validate
other measures, such as observations of teaching practice, by examining their relationship to
students’ academic performance.
Our study extends an emerging body of research examining the effect of teachers on
student outcomes beyond test scores. In many ways, our findings align with conclusions drawn
from previous studies that also identify teacher effects on students’ attitudes and behaviors
(Authors, 2016; Jennings & DiPrete, 2010; Ruzek et al., 2014), as well as weak relationships
between different measures of teacher effectiveness (Gershenson, 2016; Jackson, 2012; Jennings
& DiPrete, 2010; Kane & Staiger, 2012). Although our study focuses on a small to moderate
sample of teachers, our rich dataset builds on prior work in several ways. To our knowledge, this
study is the first to identify teacher effects on measures of students’ self-efficacy in math and
happiness in class, as well as on a self-reported measure of student behavior. These findings
suggest that teachers can and do help develop attitudes and behaviors among their students that
are important for success in life. By interpreting teacher effects alongside teaching effects, we
also provide strong face and construct validity for our teacher effect estimates. We find that
improvements in upper-elementary students’ attitudes and behaviors are predicted by general
teaching practices in ways that align with hypotheses laid out by instrument developers (Pianta &

30
Hamre, 2009). Findings linking errors in teachers’ presentation of math content to students’ self-
efficacy in math, in addition to their math performance, also are consistent with theory (Bandura
et al., 1996). Finally, the broad data collection effort from Blinded Project allows us to examine
relative differences in relationships between measures of teacher effectiveness, thus avoiding
some concerns about how best to interpret correlations that differ substantively across studies
(Chin & Goldhaber, 2015). We find that correlations between teacher effects on student
outcomes that aim to capture different underlying constructs (e.g., math test scores and behavior
in class) are weaker than correlations between teacher effects on two outcomes that are much
more closely related (e.g., math achievement).
These findings can inform policy and practice in several key ways. Beginning first with
policy, growing evidence of teacher effects on students’ attitudes and behaviors may generate
interest among some policymakers to incorporate these estimates into high-stakes decisions. This
is be particularly relevant after passage of the Every Student Succeeds Act (ESSA), which
mandates that states select a nonacademic indicator with which to assess students’ success in
school (ESSA, 2015). Including measures of students’ attitudes and behaviors in accountability
or evaluation systems, even with very small associated weights, could serve as a strong signal
that schools and educators should value and attend to developing these skills in the classroom.
But, like other researchers (Duckworth & Yeager, 2015), we caution against a rush to
incorporate these measures into high-stakes decisions. Hastily adding these measures into
accountability systems without providing teachers with the training and support necessary to
expand their skillsets could lead to superficial and, ultimately, counterproductive efforts to
improve students’ attitudes and behaviors. Furthermore, the science behind developing measures
of students’ attitudes and behaviors is relatively new compared to the long history of developing

31
valid and reliable assessment of cognitive aptitude and content knowledge. Most existing
measures, including those used in this study, were developed for research purposes rather than
large-scale testing with repeated administrations. In particular, open questions remain about
whether reference bias substantially distorts comparisons across schools and about the
susceptibility of these measures to “survey” coaching when high-stakes incentives are attached.
Such incentives likely would render teacher assessments of their students’ attitudes and
behaviors inappropriate. Thus, there is a clear need for additional research on the reliability and
validity of self-report measures of students’ attitudes and behaviors, as well as the development
of objective performance-based measures that can capture these outcomes.
In light of these concerns, we make three specific recommendations for the design and
implementation of teacher performance evaluation systems. First, it is possible that measures of
teachers’ effectiveness at improving students’ attitudes and behaviors may be suitable for low-
stakes decision-making in schools. For example, these metrics could be used for early
intervention efforts that diagnose areas of weakness and connect teachers to targeted professional
development, which many argue should be the primary focus of teacher evaluation (Darling-
Hammond, 2013; Hill & Grossman, 2013; Papay, 2012). Second, an alternative approach to
incorporating teacher effects on students’ attitudes and behaviors into teacher evaluation may be
through observations of teaching practice. Our findings suggest that specific domains captured
on classroom observation instruments (i.e., Emotional Support and Classroom Organization
from the CLASS and Mathematical Errors from the MQI) may serve as indirect proxy measures
of improvements in students’ attitudes and behaviors. One benefit of this approach is that
districts commonly collect related measures as part of teacher evaluation systems (Center on
Great Teachers and Leaders, 2013), and such measures are not restricted to teachers who work in

32
tested grades and subjects. Third, performance evaluations – whether formative or summative –
should avoid placing teachers into a single performance category whenever possible. Although
many researchers and policymakers argue for creating a single weighted composite of different
measures of teachers’ effectiveness (Center on Great Teachers and Leaders, 2013; Kane et al.,
2013), doing so likely oversimplifies the complex nature of teaching. For example, a teacher who
excels at developing students’ core math content knowledge but struggles to promote joy in
learning or students’ own self-efficacy in math is a very different teacher than one who is
middling across all three measures. Looking at these two teachers’ composite scores would
suggest they are similarly effective. A single overall evaluation score lends itself to a
systematized process for making binary decisions such as whether to grant teachers tenure, but
such decisions would be better informed by recognizing the full complexity of classroom
practice.
Next, we consider the implications of our findings for the teaching profession more
broadly. While our findings lend empirical support to research on the multidimensional nature of
teaching (Cohen, 2011; Lampert, 2001; Pianta & Hamre, 2009), we also identify tensions
inherent in this sort of complexity and potential tradeoffs between some teaching practices. In
our primary analyses, we find that high-quality instruction around classroom organization is
positively related to students’ self-reported behavior in class but negatively related to their
happiness in class. Our results here are not conclusive, as the negative relationship between
classroom organization and students’ happiness in class is sensitive to model specification.
However, if there indeed is a causal relationship, further research will be critical to gain a better
understanding of how teachers can develop classroom environments that engender both
constructive classroom behavior and students’ happiness in class. Our findings also demonstrate

33
a need to integrate general and more content-specific perspectives on teaching, a historical
challenge in both research and practice (Grossman & McDonald, 2008; Hamre et al., 2013). We
find that both math-specific and general teaching practices predict a range of student outcomes.
Yet, particularly at the elementary level, teachers’ math training often is overlooked. Prospective
elementary teachers often gain licensure without taking college-level math classes; in many
states, they do not need to pass the math sub-section of their licensure exam in order to earn a
passing grade overall (Epstein & Miller, 2011). Striking the right balance between general and
content-specific teaching practices is not a trivial task, but it likely is a necessary one.
Finally, we see opportunities to maximize students’ exposure to the range of teaching
skills we examine through strategic teacher assignments. Creating a teacher workforce skilled in
most or all areas of teaching practice is, in our view, the ultimate goal. However, this goal likely
will require substantial changes to teacher preparation programs and curriculum materials, as
well as new policies around teacher recruitment, evaluation, and development. In middle and
high schools, content-area specialization or departmentalization often is used to ensure that
students have access to teachers with skills in distinct content areas. Some, including the
National Association of Elementary School Principals, also see this as a viable strategy at the
elementary level (Chan & Jarman, 2004). Similar approaches may be taken to expose students to
a collection of teachers who together can develop a range of academic skills, attitudes and
behaviors. For example, when configuring grade-level teams, principals may pair a math teacher
who excels in her ability to improve students’ behavior with an ELA or reading teacher who
excels in his ability to improve students’ happiness and engagement. Viewing teachers as
complements to each other may help maximize outcomes within existing resource constraints.

34
For decades, efforts to improve the quality of the teacher workforce have focused on
teachers’ abilities to raise students’ academic achievement. Our work further illustrates the
potential and importance of expanding this focus to include teachers’ abilities to promote
students’ attitudes and behaviors that are equally important for students’ long-term success.
Works Cited
Authors. (2012).
Author. (2015).
Authors. (2015).
Authors. (2015).
Authors. (2015).
Authors. (2016).
Authors. (In Press).
Achenbach, T. M., McConaughy, S. H., & Howell, C. T. (1987). Child/adolescent behavioral
and emotional problems: implications of cross-informant correlations for situational
specificity. Psychological Bulletin, 101(2), 213.
Backes, B., & Hansen, M. (2015). Teach for America impact estimates on nontested student
outcomes. Working Paper 146. Washington, D C: National Center for Analysis of
Longitudinal in Education Research. Retrieved from
http://www.caldercenter.org/sites/default/files/WP%20146.pdf
Bandura, A., Barbaranelli, C., Caprara, G. V., & Pastorelli, C. (1996). Multifaceted impact of
self-efficacy beliefs on academic functioning. Child Development, 1206-1222.
Baron, J. (1982). Personality and intelligence. In R. J. Sternberg (Ed.), Handbook of human
intelligence (pp. 308-351). New York: Cambridge University Press.
Borghans, L., Duckworth, A. L., Heckman, J. J., & Ter Weel, B. (2008). The economics and
psychology of personality traits. Journal of Human Resources, 43(4), 972-1059.
Burchinal, M., Howes, C., Pianta, R., Bryant, D., Early, D., Clifford, R., & Barbarin, O. (2008).
Predicting child outcomes at the end of kindergarten from the quality of pre-kindergarten
teacher-child interactions and instruction. Applied Developmental Science, 12(3), 140-153.
Center on Great Teachers and Leaders (2013). Databases on state teacher and principal policies.
Retrieved from: http:// http://resource.tqsource.org/stateevaldb.
Chan, T. C., & Jarman, D. (2004). Departmentalize elementary schools. Principal, 84(1), 70-72.
Chetty, R., Friedman, J. N., Hilger, N., Saez, E., Schanzenbach, D., & Yagan, D. (2011). How
does your kindergarten classroom affect your earnings? Evidence from Project STAR.
Quarterly Journal of Economics, 126(4), 1593-1660.
Chetty, R., Friedman, J. N., & Rockoff, J. E. (2014). Measuring the impacts of teachers I:
Evaluating Bias in Teacher Value-Added Estimates. American Economic Review, 104(9),
2593-2632.
Chin, M., & Goldhaber, D. (2015). Exploring explanations for the “weak” relationship between
value added and observation-based measures of teacher performance. Working Paper.
Cambridge, MA: National Center for Teacher Effectiveness. Retrieved from:

35
http://cepr.harvard.edu/files/cepr/files/sree2015_simulation_working_paper.pdf?m=143654
1369
Cohen, D. K. (2011). Teaching and its predicaments. Cambridge, MA: Harvard University Press.
Corcoran, S. P., Jennings, J. L., & Beveridge, A. A (2012). Teacher effectiveness on high- and
low-stakes tests. Unpublished manuscript. Retrieved from
http://citeseerx.ist.psu.edu/viewdoc/download?doi=10.1.1.269.5537&rep=rep1&type=pdf
Council of the Great City Schools. (2013). Beating the odds: Analysis of student performance on
state assessments results from the 2012-2013 school year. Washington, DC: Author
Darling-Hammond, L. (2013). Getting teacher evaluation right: What really matters for
effectiveness and improvement. New York: Teachers College Press.
Diener, E. (2000). Subjective well-being: The science of happiness and a proposal for a national
index. American Psychologist, 55(1), 34-43.
Downer, J. T., Rimm-Kaufman, S., & Pianta, R. C. (2007). How do classroom conditions and
children's risk for school problems contribute to children's behavioral engagement in
learning? School Psychology Review, 36(3), 413-432.
Duckworth, A. L., Peterson, C., Matthews, M. D., & Kelly, D. R. (2007). Grit: Perseverance and
passion for long-term goals. Journal of Personality and Social Psychology, 92(6), 1087-
1101.
Duckworth, A. L., Quinn, P. D., & Tsukayama, E. (2012). What No Child Left Behind leaves
behind: The roles of IQ and self-control in predicting standardized achievement test scores
and report card grades. Journal of Educational Psychology, 104(2), 439-451.
Duckworth, A. L., & Yeager, D. S. (2015). Measurement matters: Assessing personal qualities
other than cognitive ability for educational purposes. Educational Researcher, 44(4), 237-
251.
Duncan, A. (2010). Back to school: Enhancing U.S. education and competitiveness. Foreign
Affairs, 89(6), 65–74.
Dunn, O. J. (1961). Multiple comparisons among means. Journal of the American Statistical
Association, 56(293), 52-64.
Epstein, D., & Miller, R. T. (2011). Slow off the mark: Elementary school teachers and the crisis
in science, technology, engineering, and math education. Washington, DC: Center for
American Progress.
The Every Student Succeeds Act, Public Law 114-95, 114th Cong., 1st sess. (December 10,
2015), available at https://www.congress.gov/bill/114th-congress/senate-bill/1177/text.
Farrington, C. A., Roderick, M., Allensworth, E., Nagaoka, J., Keyes, T. S., Johnson, D. W., &
Beechum, N. O. (2012). Teaching adolescents to become learners: The role of non-
cognitive factors in shaping school performance, a critical literature review. Chicago:
University of Chicago Consortium on Chicago School Reform.
Field, A. (2013). Discovering statistics using IBM SPSS statistics (4th ed.). London: SAGE
publications.
Gershenson, S. (2016). Linking teacher quality, student attendance, and student
achievement. Education Finance and Policy, 11(2).
Goodman, R. (2001). Psychometric properties of the strengths and difficulties
questionnaire. Journal of the American Academy of Child & Adolescent
Psychiatry, 40(11), 1337-1345.

36
Gregory, A., Allen, J. P., Mikami, A. Y., Hafen, C. A., & Pianta, R. C. (2014). Effects of a
professional development program on behavioral engagement of students in middle and
high school. Psychology in the Schools, 51(2), 143-163.
Grossman, P., & McDonald, M. (2008). Back to the future: Directions for research in teaching
and teacher education. American Educational Research Journal, 45, 184-205.
Hafen, C. A., Hamre, B. K., Allen, J. P., Bell, C. A., Gitomer, D. H., & Pianta, R. C. (2015).
Teaching through interactions in secondary school classrooms: Revisiting the factor
structure and practical application of the classroom assessment scoring system–
secondary. The Journal of Early Adolescence, 35(5-6), 651-680.
Hamre, B., Hatfield, B., Pianta, R., & Jamil, F. (2014). Evidence for general and domain-specific
elements of teacher–child interactions: Associations with preschool children's
development. Child Development, 85(3), 1257-1274.
Hamre, B. K., & Pianta, R. C. (2001). Early teacher–child relationships and the trajectory of
children's school outcomes through eighth grade. Child Development, 72(2), 625-638.
Hamre, B. K., Pianta, R. C., Downer, J. T., DeCoster, J., Mashburn, A. J., Jones, S. M., ... &
Brackett, M. A. (2013). Teaching through interactions: Testing a developmental
framework of teacher effectiveness in over 4,000 classrooms. The Elementary School
Journal, 113(4), 461-487.
Hanushek, E. A., & Rivkin, S. G. (2010). Generalizations about using value-added measures of
teacher quality. American Economic Review, 100(2), 267-271.
Harville, D. A. (1977). Maximum likelihood approaches to variance component estimation and
to related problems. Journal of the American Statistical Association, 72(358), 320-338.
Hickman, J. J., Fu, J., & Hill, H. C. (2012). Technical report: Creation and dissemination of
upper-elementary mathematics assessment modules. Princeton, NJ: Educational Testing
Service.
Hill, H. C., Blunk, M. L., Charalambous, C. Y., Lewis, J. M., Phelps, G. C., Sleep, L., & Ball, D.
L. (2008). Mathematical knowledge for teaching and the mathematical quality of
instruction: An exploratory study. Cognition and Instruction, 26(4), 430-511.
Hill, H. C., & Grossman, P. (2013). Learning from teacher observations: Challenges and
opportunities posed by new teacher evaluation systems. Harvard Educational
Review, 83(2), 371-384.
Hill, H.C., Schilling, S.G., & Ball, D.L. (2004). Developing measures of teachers’ mathematics
knowledge for teaching. Elementary School Journal, 105, 11-30.
Ho, A. D., & Kane, T. J. (2013). The reliability of classroom observations by school personnel.
Seattle, WA: Measures of Effective Teaching Project, Bill and Melinda Gates Foundation.
Jackson, C. K. (2012). Non-cognitive ability, test scores, and teacher quality: Evidence from
ninth grade teachers in North Carolina. NBER Working Paper No. 18624. Cambridge,
MA: National Bureau for Economic Research.
Jennings, J. L. & DiPrete, T. A. (2010). Teacher effects on social and behavioral skills in early
elementary school. Sociology of Education, 83(2), 135-159.
John, O. P., & Srivastava, S. (1999). The Big Five trait taxonomy: History, measurement, and
theoretical perspectives. Handbook of personality: Theory and research, 2(1999), 102-138.
Kane, T. J., McCaffrey, D. F., Miller, T., & Staiger, D. O. (2013). Have we identified effective
teachers? Validating measures of effective teaching using random assignment. Seattle,
WA: Measures of Effective Teaching Project, Bill and Melinda Gates Foundation.

37
Kane, T. J., & Staiger, D. O. (2012). Gathering feedback for teaching. Seattle, WA: Measures of
Effective Teaching Project, Bill and Melinda Gates Foundation.
King, R. B., McInerney, D. M., Ganotice, F. A., & Villarosa, J. B. (2015). Positive affect
catalyzes academic engagement: Cross-sectional, longitudinal, and experimental
evidence. Learning and Individual Differences, 39, 64-72.
Kline, P. (1994). An easy guide to factor analysis. London: Routledge.
Koedel, C. (2008). Teacher quality and dropout outcomes in a large, urban school district.
Journal of Urban Economics, 64(3), 560-572.
Ladd, H. F., & Sorensen, L. C. (2015). Returns to teacher experience: Student achievement and
motivation in middle school. Working Paper No. 112. Washington, D C: National Center
for Analysis of Longitudinal in Education Research. Retrieved from
http://www.caldercenter.org/sites/default/files/WP%20112%20Update_0.pdf
Lampert, M. (2001). Teaching problems and the problems of teaching. Yale University Press.
Lockwood, J. R., McCaffrey, D. F., Hamilton, L. S., Stecher, B., Le V., & Martinez, J. F. (2007).
The sensitivity of value-added teacher effect estimates to different mathematics
achievement measures. Journal of Educational Measurement, 44(1), 47-67.
Luckner, A. E., & Pianta, R. C. (2011). Teacher-student interactions in fifth grade classrooms:
Relations with children's peer behavior. Journal of Applied Developmental Psychology,
32(5), 257-266.
Lyubomirsky, S., King, L., & Diener, E. (2005). The benefits of frequent positive affect: Does
happiness lead to success? Psychological Bulletin, 131(6), 803-855.
Mashburn, A. J., Pianta, R. C., Hamre, B. K., Downer, J. T., Barbarin, O. A., Bryant, D., . . .
Howes, C. (2008). Measures of classroom quality in prekindergarten and children's
development of academic, language, and social skills. Child Development, 79(3), 732-749.
McCaffrey, D. F., Sass, T. R., Lockwood, J. R., & Mihaly, K. (2009). The intertemporal
variability of teacher effect estimates. Education Finance and Policy, 4(4), 572-606.
Mihaly, K., McCaffrey, D. F., Staiger, D. O., & Lockwood, J. R. (2013). A composite estimator
of effective teaching. Seattle, WA: Measures of Effective Teaching Project, Bill and
Melinda Gates Foundation.
Miles, S. B., & Stipek, D. (2006). Contemporaneous and longitudinal associations between
social behavior and literacy achievement in a sample of low‐income elementary school
children. Child Development, 77(1), 103-117.
Moffitt, T.E., Arseneault, L., Belsky, D., Dickson, N., Hancox, R.J., Harrington, H., Houts, R.,
Poulton, R., Roberts, B.W., & Ross, S. (2011). A gradient of childhood self-control
predicts health, wealth, and public safety. Proceedings of the National Academy of
Sciences, 108(7), 2693-2698.
Multon, K. D., Brown, S. D., & Lent, R. W. (1991). Relation of self-efficacy beliefs to academic
outcomes: A meta-analytic investigation. Journal of Counseling Psychology, 38(1), 30.
National Council of Teachers of Mathematics. (1989). Curriculum and evaluation standards for
school mathematics. Reston, VA: Author.
National Council of Teachers of Mathematics (2014). Principles to actions: Ensuring
mathematical success for all. Reston, VA: Author.
National Governors Association Center for Best Practices. (2010). Common core state standards
for mathematics. Washington, DC: Author.

38
Papay, J. P. (2011). Different tests, different answers: The stability of teacher value-added
estimates across outcome measures. American Educational Research Journal, 48(1), 163-
193.
Papay, J. P. (2012). Refocusing the debate: Assessing the purposes and tools of teacher
evaluation. Harvard Educational Review, 82(1), 123-141.
Pianta, R. C., & Hamre, B. K. (2009). Conceptualization, measurement, and improvement of
classroom processes: Standardized observation can leverage capacity. Educational
Researcher, 38(2), 109-119.
Pianta, R., La Paro, K., Payne, C., Cox, M., & Bradley, R. (2002). The relation of kindergarten
classroom environment to teacher, family, and school characteristics and child outcomes.
Elementary School Journal, 102, 225–38.
Raudenbush, S. W., & Bryk, A. S. (2002). Hierarchical linear models: Applications and data
analysis methods. Second Edition. Thousand Oaks, CA: Sage Publications.
Ruzek, E. A., Domina, T., Conley, A. M., Duncan, G.J., & Karabenick, S. A. (2014). Using
value-added models to measure teacher effects on students’ motivation and achievement.
The Journal of Early Adolescence, 1-31.
Segal, C. (2013). Misbehavior, education, and labor market outcomes. Journal of the European
Economic Association, 11(4), 743-779.
Šidák, Z. (1967). Rectangular confidence regions for the means of multivariate normal
distributions. Journal of the American Statistical Association, 62(318), 626-633.
Spearman, C. (1904). “General Intelligence,” objectively determined and measured. The
American Journal of Psychology, 15(2), 201-292.
Steinberg, M. P., & Garrett, R. (In Press). Classroom composition and measured teacher
performance: What do teacher observation scores really measure? Educational Evaluation
and Policy Analysis.
Tabachnick, B. G., & Fidell, L. S. (2001). Using multivariate statistics (4th ed.). New York:
Harper Collins.
Todd, P. E., & Wolpin, K. I. (2003). On the specification and estimation of the production
function for cognitive achievement. The Economic Journal, 113(485), F3-F33.
Tremblay, R. E., Masse, B., Perron, D., LeBlanc, M., Schwartzman, A. E., & Ledingham, J. E.
(1992). Early disruptive behavior, poor school achievement, delinquent behavior, and
delinquent personality: Longitudinal analyses. Journal of Consulting and Clinical
Psychology, 60(1), 64.
Tsukayama, E., Duckworth, A.L., & Kim, B. (2013). Domain-specific impulsivity in school-age
children. Developmental Science, 16(6), 879-893.
U.S. Department of Education (2010). A blueprint for reform: Reauthorization of the elementary
and secondary education act. Washington, DC: U.S. Department of Education, Office of
Planning, Evaluation and Policy Development.
Usher, E. L., & Pajares, F. (2008). Sources of self-efficacy in school: Critical review of the
literature and future directions. Review of Educational Research,78(4), 751-796.
Whitehurst, G. J., Chingos, M. M., & Lindquist, K. M. (2014). Evaluating teachers with
classroom observations: Lessons learned in four districts. Report published by the Brown
Center on Education Policy at the Brookings Institute. Washington, DC. Retrieved from
Brookings Institute website:
http://www.brookings.edu/~/media/research/files/reports/2014/05/13-teacher-
evaluation/evaluating-teachers-with-classroom-observations.pdf

39
Wigfield, A., & Meece, J. L. (1988). Math anxiety in elementary and secondary school
students. Journal of Educational Psychology, 80(2), 210.
Zimmerman, D. W., & Williams, R. H. (1997). Properties of the Spearman correction for
attenuation for normal and realistic non-normal distributions. Applied Psychological
Measurement, 21(3), 253-270.
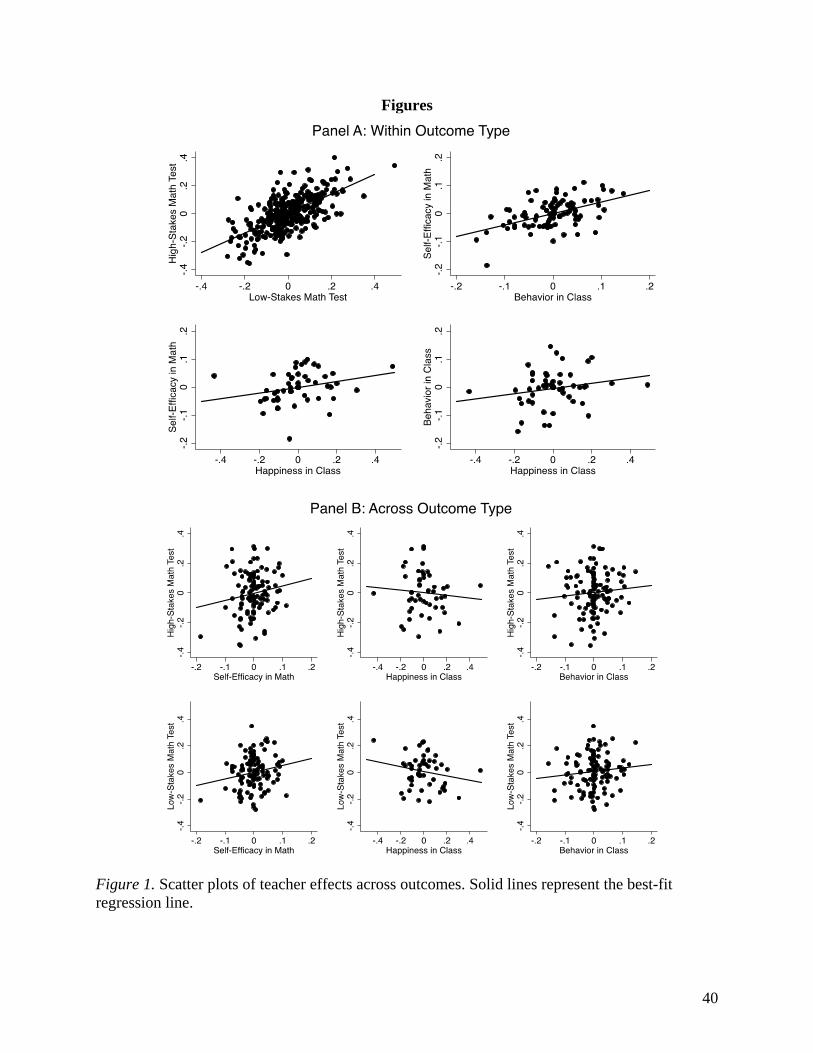
40
Figures
Figure 1. Scatter plots of teacher effects across outcomes. Solid lines represent the best-fit
regression line.
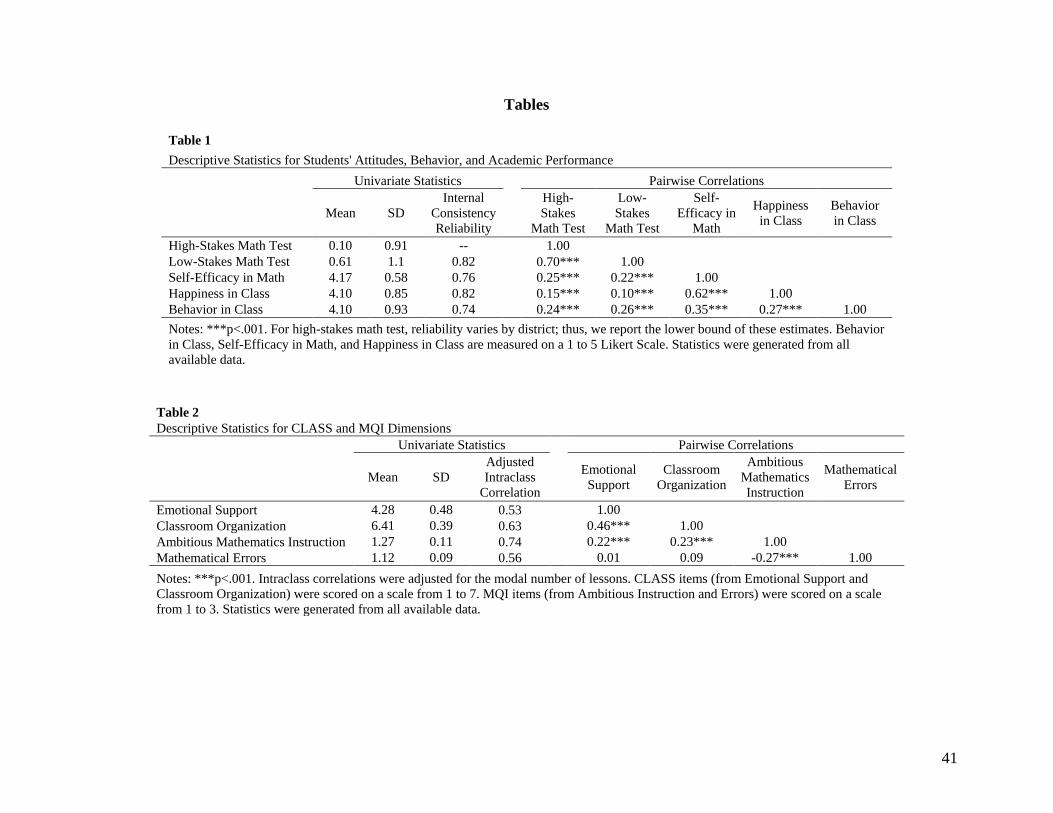
41
Tables
Table 1
Descriptive Statistics for Students' Attitudes, Behavior, and Academic Performance
Univariate Statistics Pairwise Correlations
Mean SD
Internal
Consistency
Reliability
High-
Stakes
Math Test
Low-
Stakes
Math Test
Self-
Efficacy in
Math
Happiness
in Class
Behavior
in Class
High-Stakes Math Test 0.10 0.91 -- 1.00
Low-Stakes Math Test 0.61 1.1 0.82 0.70*** 1.00
Self-Efficacy in Math 4.17 0.58 0.76 0.25*** 0.22*** 1.00
Happiness in Class 4.10 0.85 0.82 0.15*** 0.10*** 0.62*** 1.00
Behavior in Class 4.10 0.93 0.74 0.24*** 0.26*** 0.35*** 0.27*** 1.00
Notes: ***p<.001. For high-stakes math test, reliability varies by district; thus, we report the lower bound of these estimates. Behavior
in Class, Self-Efficacy in Math, and Happiness in Class are measured on a 1 to 5 Likert Scale. Statistics were generated from all
available data.
Table 2
Descriptive Statistics for CLASS and MQI Dimensions
Univariate Statistics Pairwise Correlations
Mean SD
Adjusted
Intraclass
Correlation
Emotional
Support
Classroom
Organization
Ambitious
Mathematics
Instruction
Mathematical
Errors
Emotional Support 4.28 0.48 0.53 1.00
Classroom Organization 6.41 0.39 0.63 0.46*** 1.00
Ambitious Mathematics Instruction 1.27 0.11 0.74 0.22*** 0.23*** 1.00
Mathematical Errors 1.12 0.09 0.56 0.01 0.09 -0.27*** 1.00
Notes: ***p<.001. Intraclass correlations were adjusted for the modal number of lessons. CLASS items (from Emotional Support and
Classroom Organization) were scored on a scale from 1 to 7. MQI items (from Ambitious Instruction and Errors) were scored on a scale
from 1 to 3. Statistics were generated from all available data.

42
Table 3
Participant Demographics
Full Sample
Attitudes and
Behaviors
Sample
P-Value on
Difference
Teachers
Male 0.16 0.16 0.949
African-American 0.22 0.22 0.972
Asian 0.03 0.00 0.087
Hispanic 0.03 0.03 0.904
White 0.65 0.66 0.829
Mathematics Coursework (1 to 4 Likert scale) 2.58 2.55 0.697
Mathematical Content Knowledge (standardized scale) 0.01 0.03 0.859
Alternative Certification 0.08 0.08 0.884
Teaching Experience (years) 10.29 10.61 0.677
Value Added on High-Stakes Math Test (standardized scale) 0.01 0.00 0.505
Observations 310 111
Students
Male 0.50 0.49 0.371
African American 0.40 0.40 0.421
Asian 0.08 0.07 0.640
Hispanic 0.23 0.20 0.003
White 0.24 0.28 <0.001
FRPL 0.64 0.59 0.000
SPED 0.11 0.09 0.008
LEP 0.20 0.14 <0.001
Prior Score on High-Stakes Math Test (standardized scale) 0.10 0.18 <0.001
Prior Score on High-Stakes ELA Test (standardized scale) 0.09 0.20 <0.001
Observations 10,575 1,529

43
Table 4
Teacher Effects on Students' Attitudes, Behavior, and Academic
Performance
Observations SD of
Teacher-
Level
Variance Teachers Students
High-Stakes Math Test 310 10,575 0.18
Low-Stakes Math Test 310 10,575 0.17
Self-Efficacy in Math 108 1,433 0.14
Happiness in Class 51 548 0.31
Behavior in Class 111 1,529 0.15
Notes: Cells contain estimates from separate multi-level regression models.
All non-zero effects are statistically significant at the 0.05 level.

44
Table 5
Teaching Effects on Students' Attitudes, Behavior, and Academic Performance
High-
Stakes
Math Test
Low-
Stakes
Math Test
Behavior in
Class
Self-
Efficacy in
Math
Happiness
in Class
Panel A: Unconditional Estimates
Emotional Support 0.012 0.018 0.039 0.142*** 0.279***
(0.013) (0.014) (0.027) (0.031) (0.082)
Classroom Organization -0.017 -0.010 0.081* 0.065~ 0.001
(0.014) (0.014) (0.033) (0.038) (0.090)
Ambitious Mathematics Instruction 0.017 0.021 0.004 0.077* 0.082
(0.015) (0.015) (0.032) (0.036) (0.068)
Mathematical Errors -0.027* -0.009 -0.027 -0.107*** -0.164*
(0.013) (0.014) (0.027) (0.030) (0.076)
Panel B: Conditional Estimates
Emotional Support 0.015 0.020 0.030 0.135*** 0.368***
(0.014) (0.015) (0.030) (0.034) (0.090)
Classroom Organization -0.022 -0.018 0.077* -0.020 -0.227*
(0.014) (0.015) (0.036) (0.042) (0.096)
Ambitious Mathematics Instruction 0.014 0.019 -0.034 -0.006 0.079
(0.015) (0.016) (0.036) (0.040) (0.068)
Mathematical Errors -0.024~ -0.005 -0.009 -0.094** -0.181*
(0.013) (0.014) (0.029) (0.033) (0.081)
Teacher Observations 196 196 93 90 47
Student Observations 8,660 8,660 1,362 1,275 517
Notes: ~ p<0.10, * p<0.05, ***p<0.001. In Panel A, cells contain estimates from separate regression
models. In Panel B, columns contain estimates from separate regression models, where estimates are
conditioned on other teaching practices. All models control for student and class characteristics, and include
school fixed effects and teacher random effects. Models predicting all outcomes except for Happiness in
Class also include class random effects.

45
Table 6
Correlations Between Teacher Effects on Students' Attitudes, Behavior, and Academic Performance
High-Stakes
Math Test
Low-Stakes
Math Test
Self-
Efficacy in
Math
Happiness
in Class
Behavior in
Class
High-Stakes Math Test 1.00
--
Low-Stakes Math Test 0.64*** 1.00
(0.04) --
Self-Efficacy in Math 0.16~ 0.19* 1.00
(0.10) (0.10) --
Happiness in Class -0.09 -0.21 0.26~ 1.00
(0.14) (0.14) (0.14) --
Behavior in Class 0.10 0.12 0.49*** 0.21~ 1.00
(0.10) (0.10) (0.08) (0.14) --
Notes: ~ p<0.10, * p<0.05, ***p<0.001. Standard errors in parentheses. See Table 4 for sample sizes
used to calculate teacher effect estimates. The sample for each correlation is the minimum number of
teachers between the two measures.

46
Appendices
Appendix Table 1
Factor Loadings for Items from the Student Survey
Year 1 Year 2 Year 3
Factor 1 Factor 2 Factor 1 Factor 2 Factor 1 Factor 2
Eigenvalue 2.13 0.78 4.84 1.33 5.44 1.26
Proportion of Variance Explained 0.92 0.34 0.79 0.22 0.82 0.19
Self-Efficacy in Math
I have pushed myself hard to completely understand math in this class 0.32 0.18 0.43 0.00 0.44 -0.03
If I need help with math, I make sure that someone gives me the help I need. 0.34 0.25 0.42 0.09 0.49 0.01
If a math problem is hard to solve, I often give up before I solve it. -0.46 0.01 -0.38 0.28 -0.42 0.25
Doing homework problems helps me get better at doing math. 0.30 0.31 0.54 0.24 0.52 0.18
In this class, math is too hard. -0.39 -0.03 -0.38 0.22 -0.42 0.16
Even when math is hard, I know I can learn it. 0.47 0.35 0.56 0.05 0.64 0.02
I can do almost all the math in this class if I don't give up. 0.45 0.35 0.51 0.05 0.60 0.05
I'm certain I can master the math skills taught in this class. 0.53 0.01 0.56 0.03
When doing work for this math class, focus on learning not time work takes. 0.58 0.09 0.62 0.06
I have been able to figure out the most difficult work in this math class. 0.51 0.10 0.57 0.04
Happiness in Class
This math class is a happy place for me to be. 0.67 0.18 0.68 0.20
Being in this math class makes me feel sad or angry. -0.50 0.15 -0.54 0.16
The things we have done in math this year are interesting. 0.56 0.24 0.57 0.27
Because of this teacher, I am learning to love math. 0.67 0.26 0.67 0.28
I enjoy math class this year. 0.71 0.21 0.75 0.26
Behavior in Class
My behavior in this class is good. 0.60 -0.18 0.47 -0.42 0.48 -0.37
My behavior in this class sometimes annoys the teacher. -0.58 0.40 -0.35 0.59 -0.37 0.61
My behavior is a problem for the teacher in this class. -0.59 0.39 -0.38 0.60 -0.36 0.57
Notes: Estimates drawn from all available data. Loadings of roughly 0.4 or higher are highlighted to identify patterns.

47
Appendix Table 2
Signal-to-Noise Ratio of Teacher Effect Estimates
Original
Sample
Common
Sample
High-Stakes Math Test 0.67 0.54
Low-Stakes Math Test 0.64 0.50
Self-Efficacy 0.53 0.50
Happiness in Class 0.56 0.56
Behavior in Class 0.55 0.52
Notes: See Table 4 for sample sizes across outcomes in
the original samples. The common sample includes 51
teachers and 548 students.
Appendix Table 3
Disattenuated Correlations Between Teacher Effects on Students' Attitudes, Behavior, and
Academic Performance
High-
Stakes
Math Test
Low-
Stakes
Math Test
Self-
Efficacy in
Math
Happiness
in Class
Behavior in
Class
High-Stakes Math Test 1.00
Low-Stakes Math Test 0.98 1.00
Self-Efficacy in Math 0.27 0.33 1.00
Happiness in Class -0.15 -0.35 0.48 1.00
Behavior in Class 0.17 0.20 0.91 0.38 1.00