Embed Size (px)
Citation preview
2
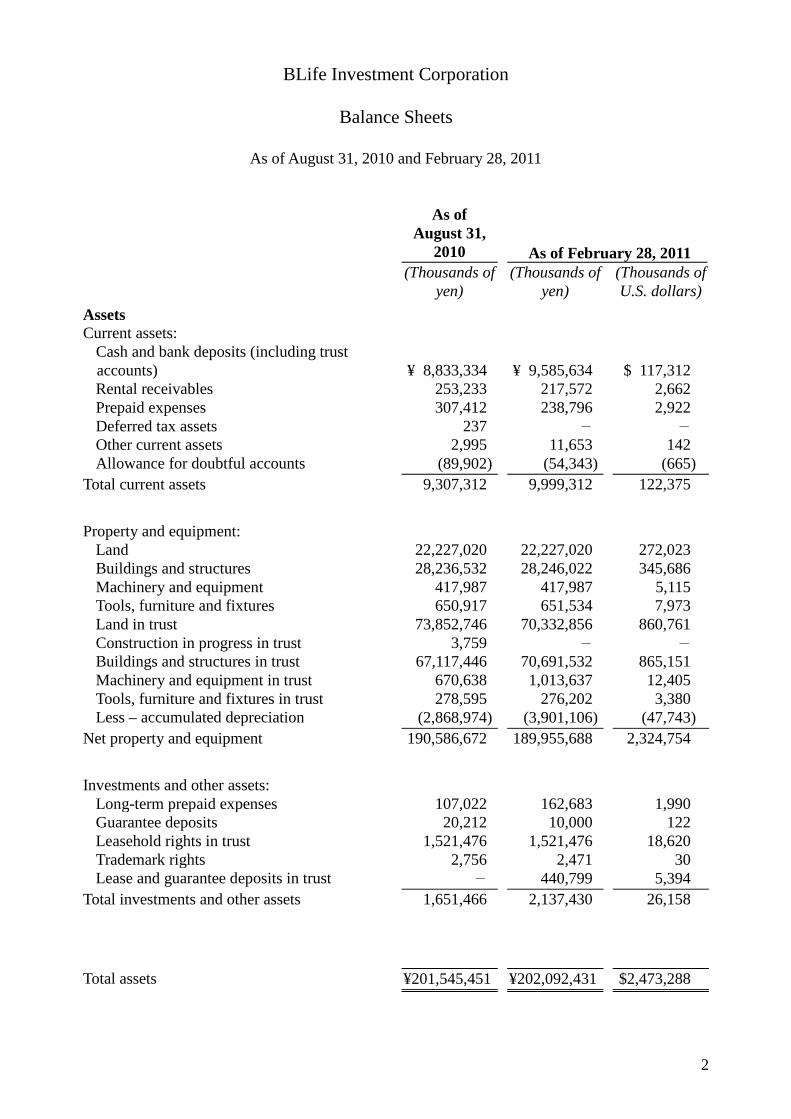
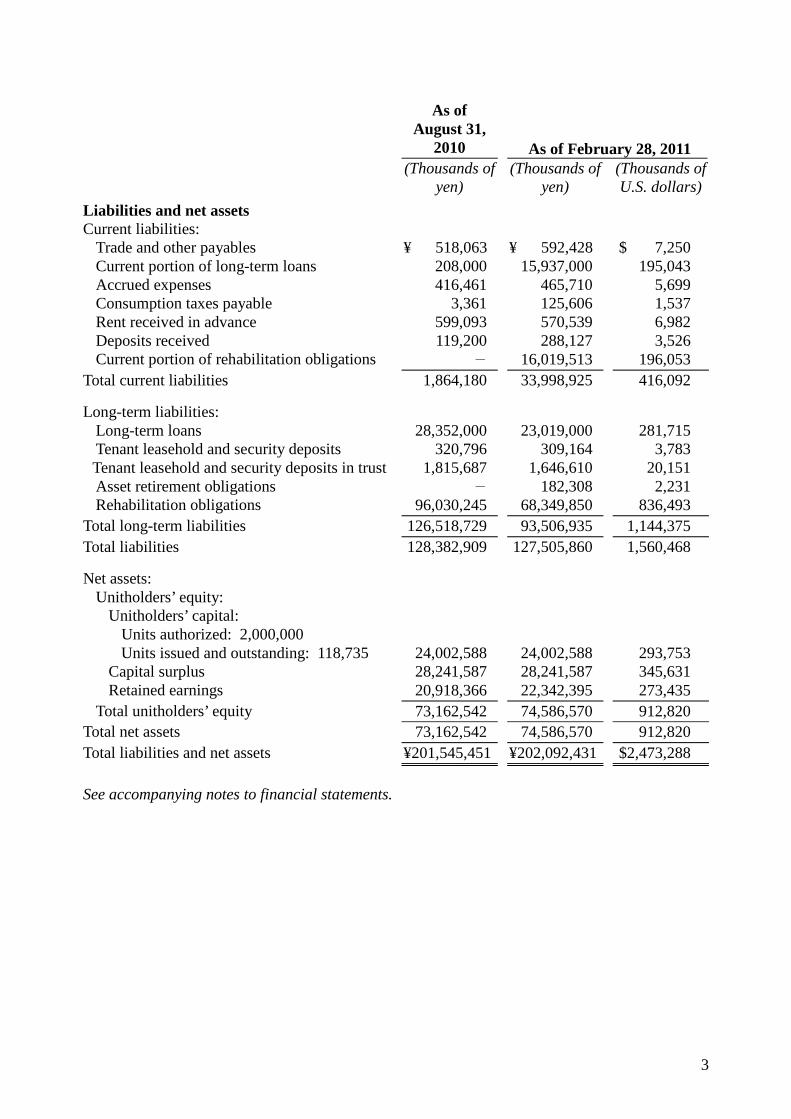
BLife Investment Corporation
Balance Sheets
As of August 31, 2010 and February 28, 2011
As of August 31,
2010 As of February 28, 2011
(Thousands of
yen) (Thousands of
yen) (Thousands of U.S. dollars)
Assets Current assets:
Cash and bank deposits (including trust accounts) ¥ 8,833,334 ¥ 9,585,634 $ 117,312 Rental receivables 253,233 217,572 2,662 Prepaid expenses 307,412 238,796 2,922 Deferred tax assets 237 - - Other current assets 2,995 11,653 142 Allowance for doubtful accounts (89,902) (54,343) (665)
Total current assets 9,307,312 9,999,312 122,375
Property and equipment:
Land 22,227,020 22,227,020 272,023 Buildings and structures 28,236,532 28,246,022 345,686 Machinery and equipment 417,987 417,987 5,115 Tools, furniture and fixtures 650,917 651,534 7,973 Land in trust 73,852,746 70,332,856 860,761 Construction in progress in trust 3,759 - - Buildings and structures in trust 67,117,446 70,691,532 865,151 Machinery and equipment in trust 670,638 1,013,637 12,405 Tools, furniture and fixtures in trust 278,595 276,202 3,380 Less – accumulated depreciation (2,868,974) (3,901,106) (47,743)
Net property and equipment 190,586,672 189,955,688 2,324,754
Investments and other assets:
Long-term prepaid expenses 107,022 162,683 1,990 Guarantee deposits 20,212 10,000 122 Leasehold rights in trust 1,521,476 1,521,476 18,620 Trademark rights 2,756 2,471 30 Lease and guarantee deposits in trust - 440,799 5,394
Total investments and other assets 1,651,466 2,137,430 26,158
Total assets ¥201,545,451 ¥202,092,431 $2,473,288
3
As of August 31,
2010 As of February 28, 2011 (Thousands of
yen) (Thousands of
yen) (Thousands of U.S. dollars)
Liabilities and net assets Current liabilities:
Trade and other payables ¥ 518,063 ¥ 592,428 $ 7,250 Current portion of long-term loans 208,000 15,937,000 195,043 Accrued expenses 416,461 465,710 5,699 Consumption taxes payable 3,361 125,606 1,537 Rent received in advance 599,093 570,539 6,982 Deposits received 119,200 288,127 3,526 Current portion of rehabilitation obligations - 16,019,513 196,053
Total current liabilities 1,864,180 33,998,925 416,092
Long-term liabilities: Long-term loans 28,352,000 23,019,000 281,715 Tenant leasehold and security deposits 320,796 309,164 3,783 Tenant leasehold and security deposits in trust 1,815,687 1,646,610 20,151 Asset retirement obligations - 182,308 2,231 Rehabilitation obligations 96,030,245 68,349,850 836,493
Total long-term liabilities 126,518,729 93,506,935 1,144,375 Total liabilities 128,382,909 127,505,860 1,560,468
Net assets: Unitholders’ equity:
Unitholders’ capital: Units authorized: 2,000,000 Units issued and outstanding: 118,735 24,002,588 24,002,588 293,753
Capital surplus 28,241,587 28,241,587 345,631 Retained earnings 20,918,366 22,342,395 273,435
Total unitholders’ equity 73,162,542 74,586,570 912,820 Total net assets 73,162,542 74,586,570 912,820 Total liabilities and net assets ¥201,545,451 ¥202,092,431 $2,473,288 See accompanying notes to financial statements.
4
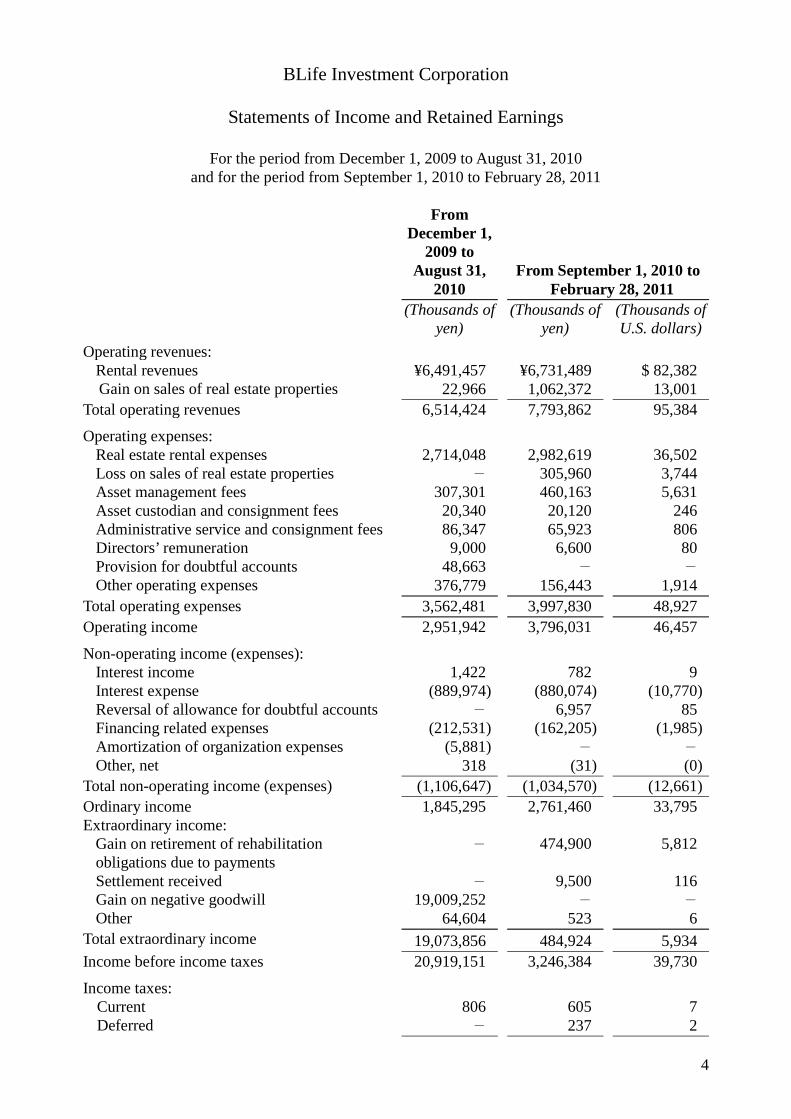
BLife Investment Corporation
Statements of Income and Retained Earnings
For the period from December 1, 2009 to August 31, 2010 and for the period from September 1, 2010 to February 28, 2011
From December 1,
2009 to August 31,
2010 From September 1, 2010 to
February 28, 2011 (Thousands of
yen) (Thousands of
yen) (Thousands of U.S. dollars)
Operating revenues: Rental revenues ¥6,491,457 ¥6,731,489 $ 82,382
Gain on sales of real estate properties 22,966 1,062,372 13,001 Total operating revenues 6,514,424 7,793,862 95,384
Operating expenses:
Real estate rental expenses 2,714,048 2,982,619 36,502 Loss on sales of real estate properties - 305,960 3,744 Asset management fees 307,301 460,163 5,631 Asset custodian and consignment fees 20,340 20,120 246 Administrative service and consignment fees 86,347 65,923 806 Directors’ remuneration 9,000 6,600 80 Provision for doubtful accounts 48,663 - - Other operating expenses 376,779 156,443 1,914
Total operating expenses 3,562,481 3,997,830 48,927 Operating income 2,951,942 3,796,031 46,457
Non-operating income (expenses):
Interest income 1,422 782 9 Interest expense (889,974) (880,074) (10,770) Reversal of allowance for doubtful accounts - 6,957 85 Financing related expenses (212,531) (162,205) (1,985) Amortization of organization expenses (5,881) - - Other, net 318 (31) (0)
Total non-operating income (expenses) (1,106,647) (1,034,570) (12,661) Ordinary income 1,845,295 2,761,460 33,795 Extraordinary income:
Gain on retirement of rehabilitation obligations due to payments
- 474,900 5,812
Settlement received - 9,500 116 Gain on negative goodwill 19,009,252 - - Other 64,604 523 6
Total extraordinary income 19,073,856 484,924 5,934 Income before income taxes 20,919,151 3,246,384 39,730
Income taxes:
Current 806 605 7 Deferred - 237 2
5
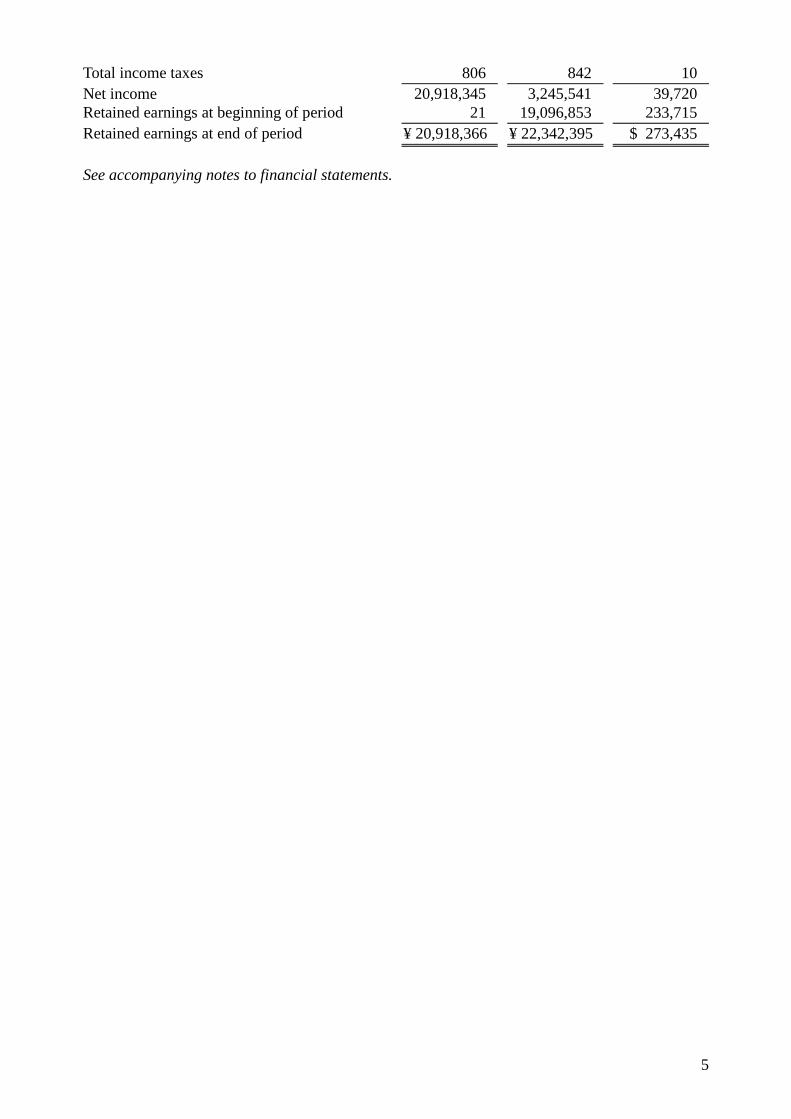
Total income taxes 806 842 10 Net income 20,918,345 3,245,541 39,720 Retained earnings at beginning of period 21 19,096,853 233,715 Retained earnings at end of period ¥ 20,918,366 ¥ 22,342,395 $ 273,435 See accompanying notes to financial statements.
6
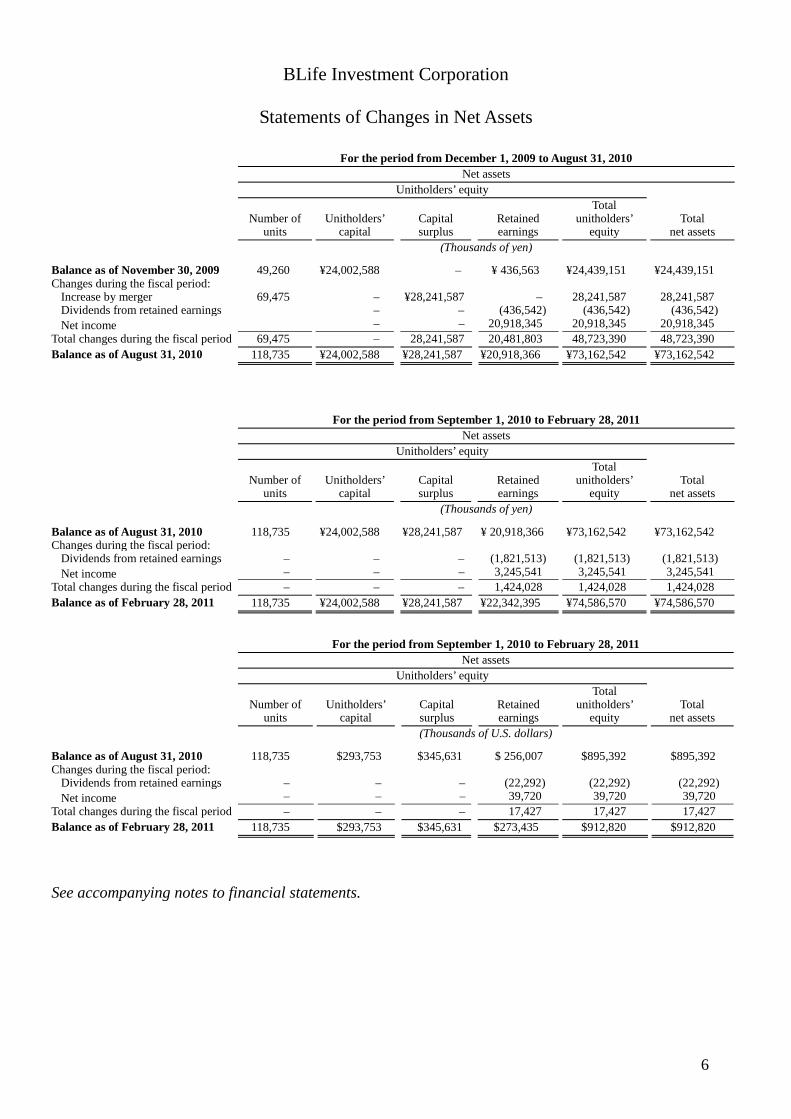
BLife Investment Corporation
Statements of Changes in Net Assets
For the period from December 1, 2009 to August 31, 2010 Net assets Unitholders’ equity
Number of
units Unitholders’
capital
Capital surplus
Retained earnings
Total unitholders’
equity Total
net assets (Thousands of yen)
Balance as of November 30, 2009 49,260 ¥24,002,588 – ¥ 436,563 ¥24,439,151 ¥24,439,151 Changes during the fiscal period:
Increase by merger 69,475 – ¥28,241,587 – 28,241,587 28,241,587 Dividends from retained earnings – – (436,542) (436,542) (436,542) Net income – – 20,918,345 20,918,345 20,918,345
Total changes during the fiscal period 69,475 – 28,241,587 20,481,803 48,723,390 48,723,390 Balance as of August 31, 2010 118,735 ¥24,002,588 ¥28,241,587 ¥20,918,366 ¥73,162,542 ¥73,162,542
For the period from September 1, 2010 to February 28, 2011 Net assets Unitholders’ equity
Number of
units Unitholders’
capital
Capital surplus
Retained earnings
Total unitholders’
equity Total
net assets (Thousands of yen)
Balance as of August 31, 2010 118,735 ¥24,002,588 ¥28,241,587 ¥ 20,918,366 ¥73,162,542 ¥73,162,542 Changes during the fiscal period:
Dividends from retained earnings – – – (1,821,513) (1,821,513) (1,821,513) Net income – – – 3,245,541 3,245,541 3,245,541
Total changes during the fiscal period – – – 1,424,028 1,424,028 1,424,028 Balance as of February 28, 2011 118,735 ¥24,002,588 ¥28,241,587 ¥22,342,395 ¥74,586,570 ¥74,586,570
For the period from September 1, 2010 to February 28, 2011 Net assets Unitholders’ equity
Number of
units Unitholders’
capital
Capital surplus
Retained earnings
Total unitholders’
equity Total
net assets (Thousands of U.S. dollars)
Balance as of August 31, 2010 118,735 $293,753 $345,631 $ 256,007 $895,392 $895,392 Changes during the fiscal period:
Dividends from retained earnings – – – (22,292) (22,292) (22,292) Net income – – – 39,720 39,720 39,720
Total changes during the fiscal period – – – 17,427 17,427 17,427 Balance as of February 28, 2011 118,735 $293,753 $345,631 $273,435 $912,820 $912,820
See accompanying notes to financial statements.
7
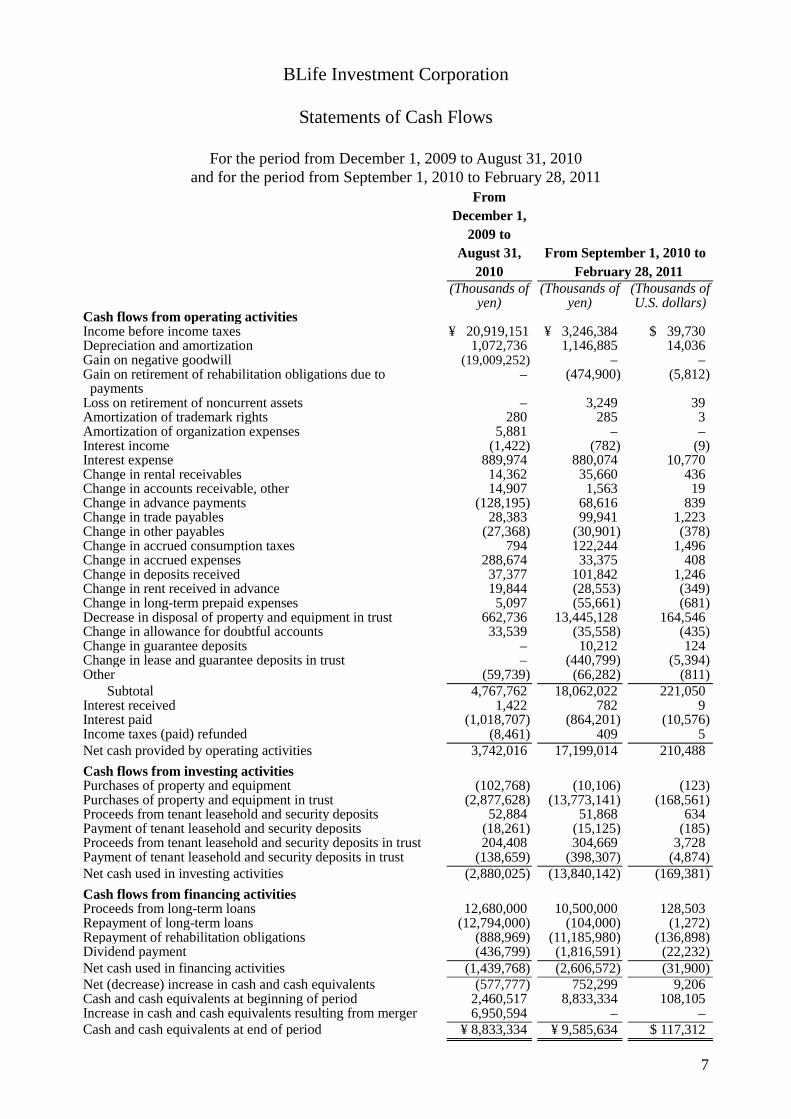
BLife Investment Corporation
Statements of Cash Flows
For the period from December 1, 2009 to August 31, 2010 and for the period from September 1, 2010 to February 28, 2011
From December 1,
2009 to August 31,
2010 From September 1, 2010 to
February 28, 2011 (Thousands of
yen) (Thousands of
yen) (Thousands of U.S. dollars)
Cash flows from operating activities Income before income taxes ¥ 20,919,151 ¥ 3,246,384 $ 39,730 Depreciation and amortization 1,072,736 1,146,885 14,036 Gain on negative goodwill (19,009,252) – – Gain on retirement of rehabilitation obligations due to payments
– (474,900) (5,812)
Loss on retirement of noncurrent assets – 3,249 39 Amortization of trademark rights 280 285 3 Amortization of organization expenses 5,881 – – Interest income (1,422) (782) (9) Interest expense 889,974 880,074 10,770 Change in rental receivables 14,362 35,660 436 Change in accounts receivable, other 14,907 1,563 19 Change in advance payments (128,195) 68,616 839 Change in trade payables 28,383 99,941 1,223 Change in other payables (27,368) (30,901) (378) Change in accrued consumption taxes 794 122,244 1,496 Change in accrued expenses 288,674 33,375 408 Change in deposits received 37,377 101,842 1,246 Change in rent received in advance 19,844 (28,553) (349) Change in long-term prepaid expenses 5,097 (55,661) (681) Decrease in disposal of property and equipment in trust 662,736 13,445,128 164,546 Change in allowance for doubtful accounts 33,539 (35,558) (435) Change in guarantee deposits – 10,212 124 Change in lease and guarantee deposits in trust – (440,799) (5,394) Other (59,739) (66,282) (811)
Subtotal 4,767,762 18,062,022 221,050 Interest received 1,422 782 9 Interest paid (1,018,707) (864,201) (10,576) Income taxes (paid) refunded (8,461) 409 5 Net cash provided by operating activities 3,742,016 17,199,014 210,488 Cash flows from investing activities Purchases of property and equipment (102,768) (10,106) (123) Purchases of property and equipment in trust (2,877,628) (13,773,141) (168,561) Proceeds from tenant leasehold and security deposits 52,884 51,868 634 Payment of tenant leasehold and security deposits (18,261) (15,125) (185) Proceeds from tenant leasehold and security deposits in trust 204,408 304,669 3,728 Payment of tenant leasehold and security deposits in trust (138,659) (398,307) (4,874) Net cash used in investing activities (2,880,025) (13,840,142) (169,381) Cash flows from financing activities Proceeds from long-term loans 12,680,000 10,500,000 128,503 Repayment of long-term loans (12,794,000) (104,000) (1,272) Repayment of rehabilitation obligations (888,969) (11,185,980) (136,898) Dividend payment (436,799) (1,816,591) (22,232) Net cash used in financing activities (1,439,768) (2,606,572) (31,900) Net (decrease) increase in cash and cash equivalents (577,777) 752,299 9,206 Cash and cash equivalents at beginning of period 2,460,517 8,833,334 108,105 Increase in cash and cash equivalents resulting from merger 6,950,594 – – Cash and cash equivalents at end of period ¥ 8,833,334 ¥ 9,585,634 $ 117,312

8
See accompanying notes to financial statements.
9
BLife Investment Corporation
Notes to Financial Statements
For the period from December 1, 2009 to August 31, 2010 and for the period from September 1, 2010 to February 28, 2011
1. Organization and Basis of Presentation (a) Organization BLife Investment Corporation (“BLife”), a Japanese real estate investment corporation,
was established on June 7, 2005 with an initial capitalization of ¥300 million under the Law Concerning Investment Trusts and Investment Corporations of Japan, or the Investment Trust Law. BLife was formed to invest primarily in residential and retail properties in Japan. BLife is externally managed by a licensed asset management company, Daiwa House Morimoto Asset Management Co., Ltd.
BLife has concentrated on its beautiful life and residence vision by focusing its
investment efforts on real estate properties and aims to build a hybrid portfolio to secure stable revenues in the mid- to long-term periods. By selecting properties suitable for modern lifestyle that appeal to tenants and consumers both of residential and retail properties using strict but transparent and high standards such as by considering the area, building quality and amenities, BLife aims to gain steady growth for its portfolio and expand its primary investment income.
(b) Basis of presentation The accompanying financial statements have been prepared in accordance with the
provisions set forth in the Investment Trust Law, the Financial Instruments and Exchange Law of Japan and its related accounting regulations, and in conformity with accounting principles generally accepted in Japan (“Japanese GAAP”), which are different in certain respects as to the application and disclosure requirements of International Financial Reporting Standards.
The accompanying financial statements have been compiled and translated into English
(with certain reclassifications and expanded descriptions) from the financial statements of BLife prepared in accordance with Japanese GAAP and filed with the Kanto Local Finance Bureau of the Ministry of Finance as required by the Financial Instruments and Exchange Law.
In preparing the accompanying financial statements, relevant notes have been added
and certain reclassifications have been made to the financial statements issued domestically in order to present them in a form that is more familiar to readers outside Japan. BLife’s fiscal period is a six-month period which ends at the end of February or August of each year. BLife has not prepared consolidated financial statements as it has no subsidiaries.
10
1. Organization and Basis of Presentation (continued) From December 1, 2009, the fiscal period-end dates changed from the last day of May
and November to the last day of February and August. Accordingly, the previous fiscal period commenced on December 1, 2009 and ended on August 31, 2010, a period of nine months.
The U.S. dollar amounts in the accompanying financial statements have been translated from yen amounts solely for the convenience of readers outside Japan and, as a matter of arithmetic computation only, at ¥81.71 = U.S.$1.00, the rate of exchange prevailing on February 28, 2011. This translation should not be construed as a representation that yen amounts have been, could have been, or could in the future be, converted into U.S. dollars at the above or any other rate.
11
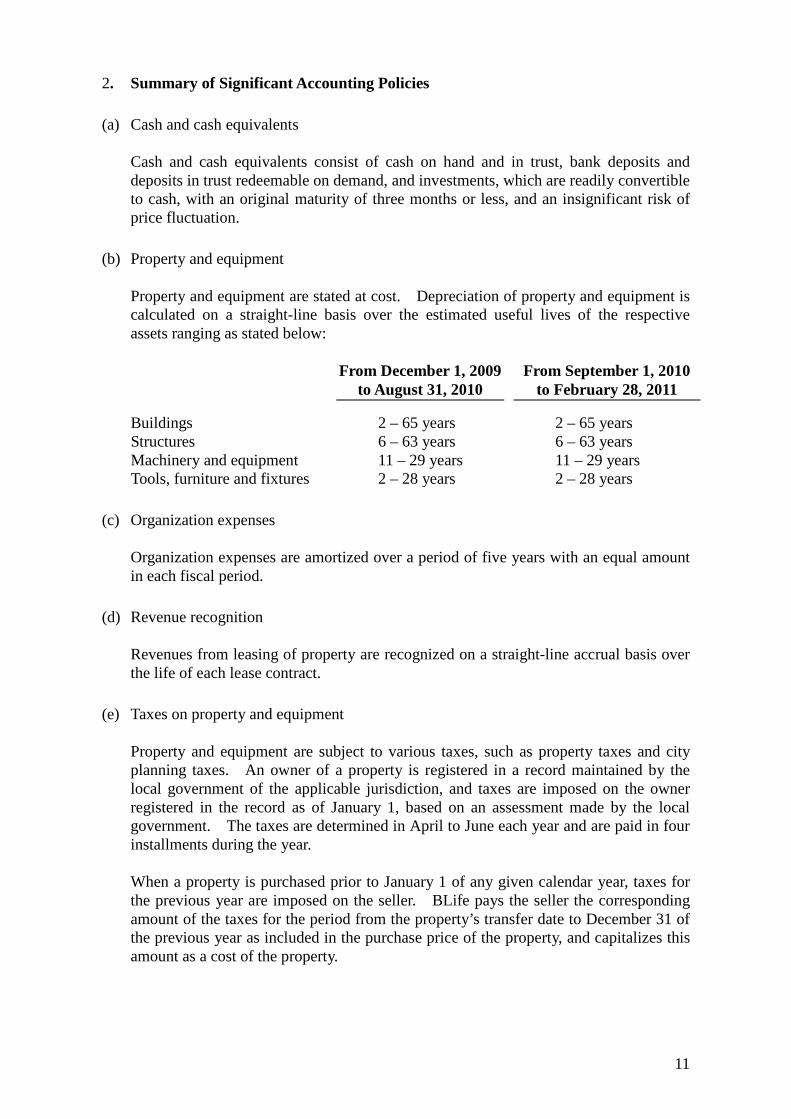
2. Summary of Significant Accounting Policies (a) Cash and cash equivalents Cash and cash equivalents consist of cash on hand and in trust, bank deposits and
deposits in trust redeemable on demand, and investments, which are readily convertible to cash, with an original maturity of three months or less, and an insignificant risk of price fluctuation.
(b) Property and equipment Property and equipment are stated at cost. Depreciation of property and equipment is
calculated on a straight-line basis over the estimated useful lives of the respective assets ranging as stated below:
From December 1, 2009
to August 31, 2010 From September 1, 2010
to February 28, 2011
Buildings 2 – 65 years 2 – 65 years Structures 6 – 63 years 6 – 63 years Machinery and equipment 11 – 29 years 11 – 29 years Tools, furniture and fixtures 2 – 28 years 2 – 28 years
(c) Organization expenses Organization expenses are amortized over a period of five years with an equal amount
in each fiscal period. (d) Revenue recognition Revenues from leasing of property are recognized on a straight-line accrual basis over
the life of each lease contract. (e) Taxes on property and equipment Property and equipment are subject to various taxes, such as property taxes and city
planning taxes. An owner of a property is registered in a record maintained by the local government of the applicable jurisdiction, and taxes are imposed on the owner registered in the record as of January 1, based on an assessment made by the local government. The taxes are determined in April to June each year and are paid in four installments during the year.
When a property is purchased prior to January 1 of any given calendar year, taxes for
the previous year are imposed on the seller. BLife pays the seller the corresponding amount of the taxes for the period from the property’s transfer date to December 31 of the previous year as included in the purchase price of the property, and capitalizes this amount as a cost of the property.
12
2. Summary of Significant Accounting Policies (continued) (Changes in Accounting Policy) Until the six-month period ended November 30, 2009, BLife had expensed the taxes imposed on properties as property-related expenses every calendar year when paid. Effective the nine-month period ended August 31, 2010, BLife allocated the yearly property taxes assessed and imposed proportionally to the related period in which they are incurred and ensuing periods. This change was made to present periodic profit and loss more properly because the variation of periodic profits and losses became larger after the change in BLife’s accounting periods to those ending the last days of February and August, while there were no large variations when calculated for the prior accounting periods ending May and November. Based on the adoption of this change, operating income, ordinary income, and income before income taxes for the nine months ended August 31, 2010 decreased by ¥100,397 thousand compared with the amounts that would have been recorded under the prior method.
(f) Income taxes Deferred tax assets and liabilities are computed based on the differences between the
financial reporting and income tax bases of assets and liabilities using the enacted tax rates.
(g) Allowance for doubtful accounts Allowance for doubtful accounts is provided at the amount considered sufficient to
cover possible losses on collection. (h) Consumption taxes Consumption taxes withheld and consumption taxes paid are not included in the
accompanying statements of income and retained earnings. Non-deductible consumption taxes for acquisition of assets are added on to the acquisition cost of each asset.
(i) Trust beneficiary interests For trust beneficiary interests in real estate, each of the trust assets and liabilities as
well as all income generated and expenses incurred in trusts are recorded in the relevant balance sheet and income statement accounts.
(j) Derivatives and hedge accounting BLife utilizes interest-rate cap agreements as derivative financial instruments solely for
the purpose of hedging its exposure to fluctuation in interest rates. BLife deferred recognition of gains and losses resulting from changes in the fair value of interest-rate caps because its interest-rate agreements met the criteria for deferred hedge accounting.
13
3. Changes in Accounting Policies (1) Effective the nine-month period ended August 31, 2010, BLife adopted “Accounting
Standard for Business Combinations” (ASBJ Statement No. 21, December 26, 2008) and “Guidance on Accounting Standard for Business Combinations and Accounting Standard for Business Divestitures” (ASBJ Guidance No. 10, December 26, 2008).
(2) Effective the six-month period ended February 28, 2011, BLife adopted “Accounting
Standard for Asset Retirement Obligations” (ASBJ Statement No. 18, March 31, 2008) and “Guidance on Accounting Standard for Asset Retirement Obligations” (ASBJ Guidance No. 21, March 31, 2008). This change had no significant impact on operating results of BLife for the period.
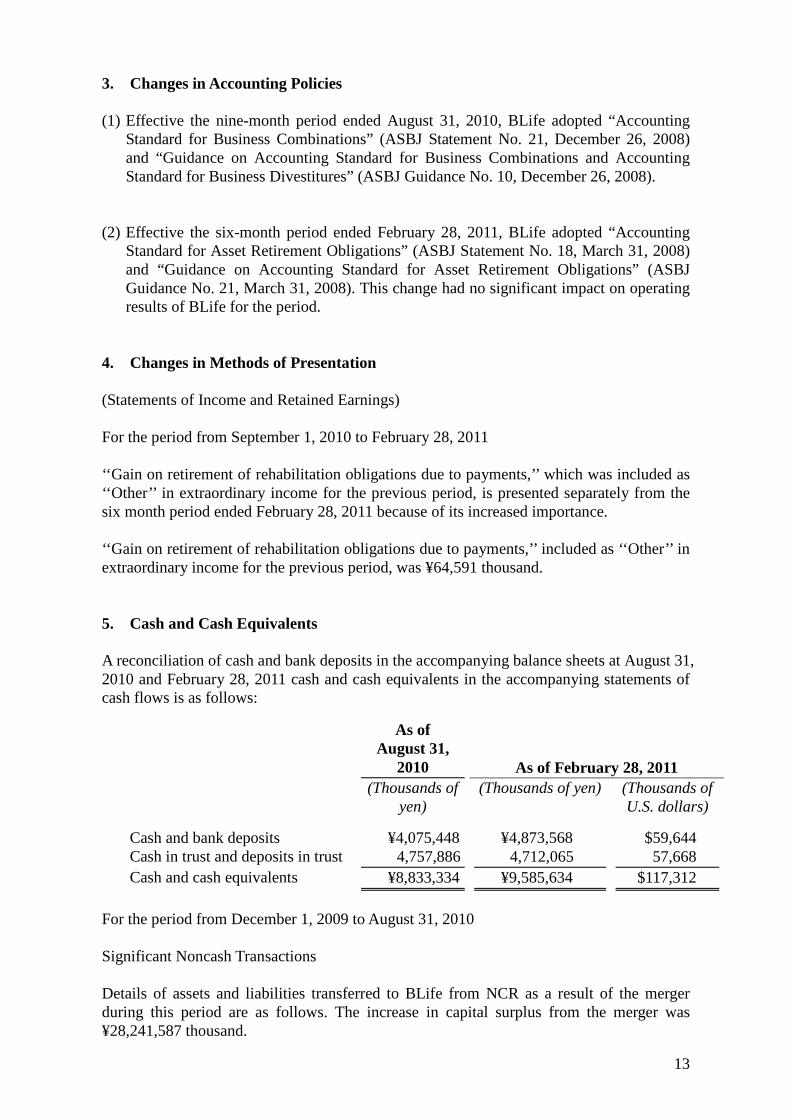
4. Changes in Methods of Presentation (Statements of Income and Retained Earnings) For the period from September 1, 2010 to February 28, 2011 ‘‘Gain on retirement of rehabilitation obligations due to payments,’’ which was included as ‘‘Other’’ in extraordinary income for the previous period, is presented separately from the six month period ended February 28, 2011 because of its increased importance. ‘‘Gain on retirement of rehabilitation obligations due to payments,’’ included as ‘‘Other’’ in extraordinary income for the previous period, was ¥64,591 thousand. 5. Cash and Cash Equivalents A reconciliation of cash and bank deposits in the accompanying balance sheets at August 31, 2010 and February 28, 2011 cash and cash equivalents in the accompanying statements of cash flows is as follows:
As of August 31,
2010 As of February 28, 2011 (Thousands of
yen) (Thousands of yen) (Thousands of
U.S. dollars)
Cash and bank deposits ¥4,075,448 ¥4,873,568 $59,644 Cash in trust and deposits in trust 4,757,886 4,712,065 57,668 Cash and cash equivalents ¥8,833,334 ¥9,585,634 $117,312
For the period from December 1, 2009 to August 31, 2010 Significant Noncash Transactions Details of assets and liabilities transferred to BLife from NCR as a result of the merger during this period are as follows. The increase in capital surplus from the merger was ¥28,241,587 thousand.
14
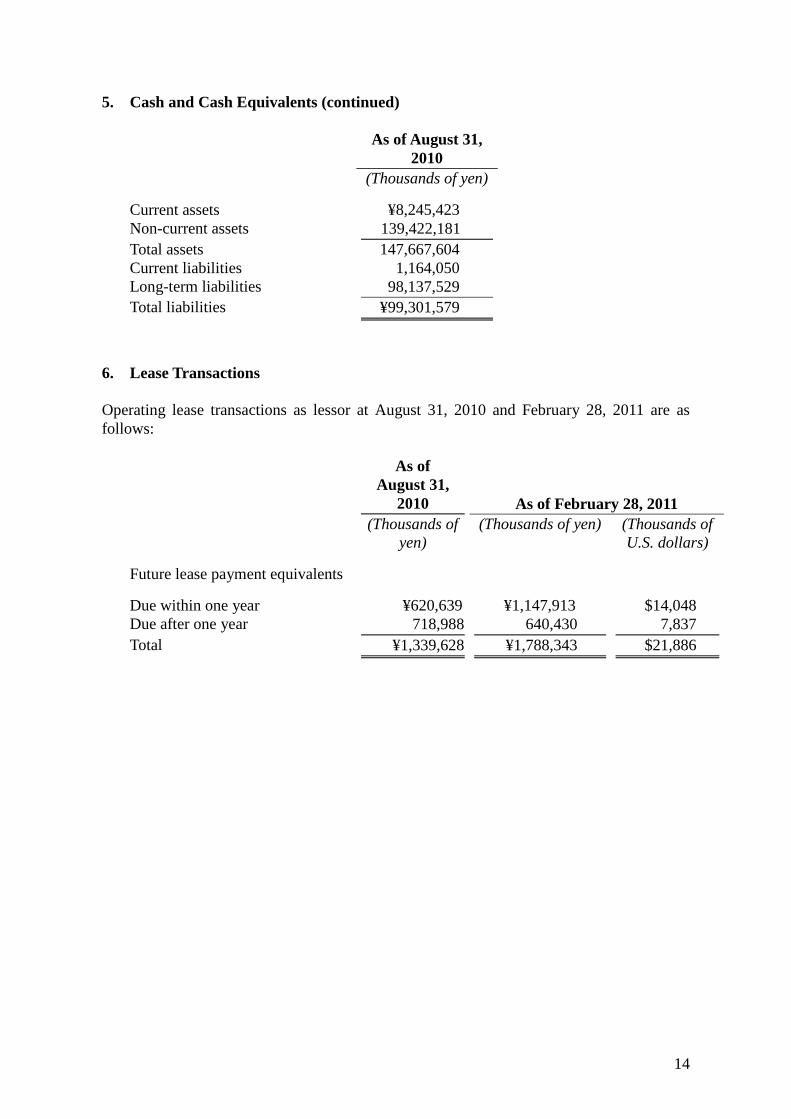
5. Cash and Cash Equivalents (continued)
As of August 31,
2010 (Thousands of yen)
Current assets ¥8,245,423 Non-current assets 139,422,181 Total assets 147,667,604 Current liabilities 1,164,050 Long-term liabilities 98,137,529 Total liabilities ¥99,301,579
6. Lease Transactions Operating lease transactions as lessor at August 31, 2010 and February 28, 2011 are as follows:
As of August 31,
2010 As of February 28, 2011 (Thousands of
yen) (Thousands of yen) (Thousands of
U.S. dollars)
Future lease payment equivalents
Due within one year ¥620,639 ¥1,147,913 $14,048 Due after one year 718,988 640,430 7,837 Total ¥1,339,628 ¥1,788,343 $21,886
15
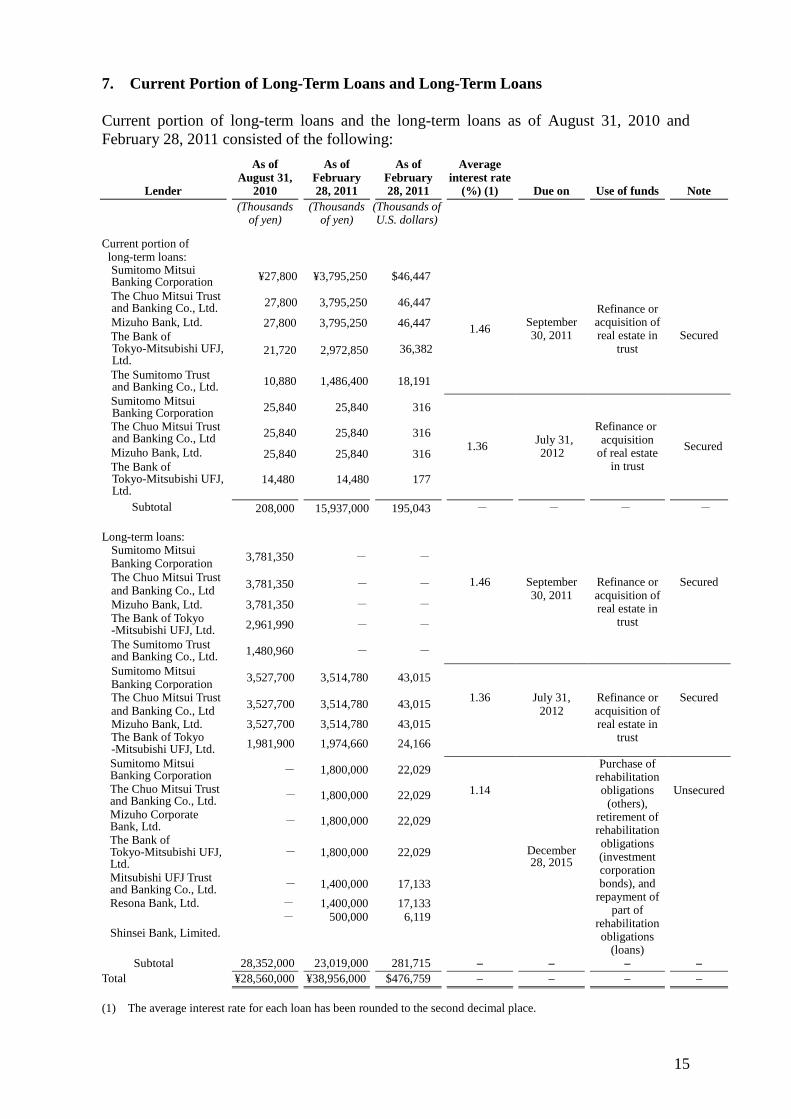
7. Current Portion of Long-Term Loans and Long-Term Loans Current portion of long-term loans and the long-term loans as of August 31, 2010 and February 28, 2011 consisted of the following:
Lender
As of August 31,
2010
As of February 28, 2011
As of February 28, 2011
Average interest rate
(%) (1) Due on Use of funds Note (Thousands
of yen) (Thousands
of yen) (Thousands of U.S. dollars)
Current portion of long-term loans:
Sumitomo Mitsui Banking Corporation ¥27,800 ¥3,795,250 $46,447
1.46 September 30, 2011
Refinance or acquisition of real estate in
trust
Secured
The Chuo Mitsui Trust and Banking Co., Ltd. 27,800 3,795,250 46,447
Mizuho Bank, Ltd. 27,800 3,795,250 46,447 The Bank of Tokyo-Mitsubishi UFJ, Ltd.
21,720
2,972,850 36,382
The Sumitomo Trust and Banking Co., Ltd. 10,880 1,486,400 18,191
Sumitomo Mitsui Banking Corporation 25,840 25,840 316
1.36 July 31, 2012
Refinance or acquisition
of real estate in trust
Secured
The Chuo Mitsui Trust and Banking Co., Ltd 25,840 25,840 316
Mizuho Bank, Ltd. 25,840 25,840 316 The Bank of Tokyo-Mitsubishi UFJ, Ltd.
14,480 14,480 177
Subtotal 208,000 15,937,000 195,043 - - - -
Long-term loans: Sumitomo Mitsui Banking Corporation 3,781,350 - -
1.46 September 30, 2011
Refinance or acquisition of real estate in
trust
Secured
The Chuo Mitsui Trust and Banking Co., Ltd 3,781,350 - -
Mizuho Bank, Ltd. 3,781,350 - - The Bank of Tokyo -Mitsubishi UFJ, Ltd. 2,961,990 - -
The Sumitomo Trust and Banking Co., Ltd. 1,480,960 - -
Sumitomo Mitsui Banking Corporation 3,527,700 3,514,780 43,015
1.36
July 31, 2012
Refinance or acquisition of real estate in
trust
Secured The Chuo Mitsui Trust and Banking Co., Ltd 3,527,700 3,514,780 43,015
Mizuho Bank, Ltd. 3,527,700 3,514,780 43,015 The Bank of Tokyo -Mitsubishi UFJ, Ltd. 1,981,900 1,974,660 24,166
Sumitomo Mitsui Banking Corporation - 1,800,000 22,029
1.14
December 28, 2015
Purchase of rehabilitation obligations
(others), retirement of rehabilitation obligations (investment corporation bonds), and
repayment of part of
rehabilitation obligations
(loans)
Unsecured The Chuo Mitsui Trust and Banking Co., Ltd. - 1,800,000 22,029 Mizuho Corporate Bank, Ltd. - 1,800,000 22,029 The Bank of Tokyo-Mitsubishi UFJ, Ltd.
- 1,800,000 22,029
Mitsubishi UFJ Trust and Banking Co., Ltd. - 1,400,000 17,133 Resona Bank, Ltd. - 1,400,000 17,133
Shinsei Bank, Limited. - 500,000 6,119
Subtotal 28,352,000 23,019,000 281,715 – – – – Total ¥28,560,000 ¥38,956,000 $476,759 – – – –
(1) The average interest rate for each loan has been rounded to the second decimal place.

16
8. Collateral Pledged and Secured Liabilities
As of August 31,
2010 As of February 28, 2011 (Thousands of
yen) (Thousands of
yen) (Thousands of U.S. dollars)
Pledged assets: Cash in trust and deposits in trust ¥2,863,714 ¥2,952,225 $36,130 Buildings in trust 36,375,894 37,374,810 457,408 Structures in trust 255,525 271,746 3,325 Machinery and equipment in trust 323,191 320,793 3,925 Tools, furniture and fixtures in trust 93,667 99,074 1,212 Land in trust 42,425,169 43,807,346 536,132 Leasehold rights in trust 954,737 954,737 11,684
Total ¥83,291,900 ¥85,780,733 $1,049,819
As of August 31,
2010 As of February 28, 2011 (Thousands of
yen) (Thousands of
yen) (Thousands of U.S. dollars)
Secured liabilities: Current portion of long-term loans ¥ 208,000 ¥ 15,937,000 $195,043 Long-term loans 28,352,000 12,519,000 153,212 Rehabilitation obligations 16,019,513 – – Current portion of rehabilitation obligations
–
16,019,513
196,053
Total ¥44,579,513 ¥44,475,513 $544,309
17
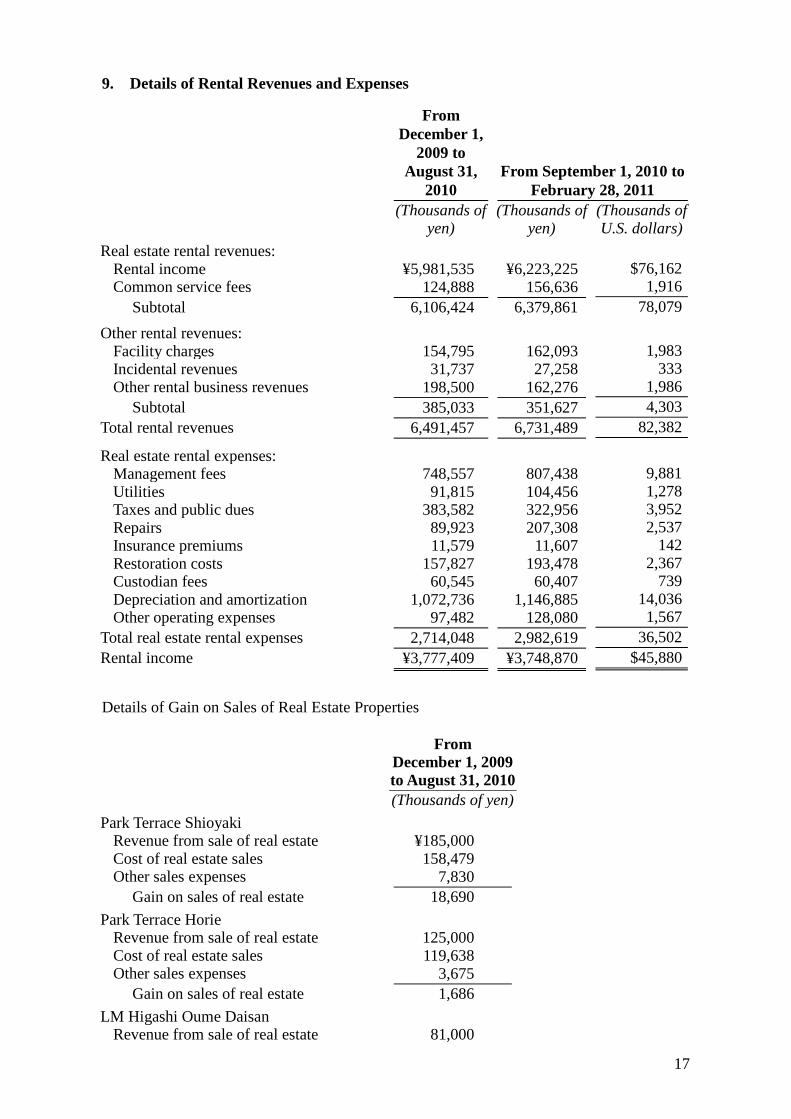
9. Details of Rental Revenues and Expenses
From December 1,
2009 to August 31,
2010
From September 1, 2010 to February 28, 2011
(Thousands of yen)
(Thousands of yen)
(Thousands of U.S. dollars)
Real estate rental revenues: Rental income ¥5,981,535 ¥6,223,225 $76,162 Common service fees 124,888 156,636 1,916
Subtotal 6,106,424 6,379,861 78,079
Other rental revenues:
Facility charges 154,795 162,093 1,983 Incidental revenues 31,737 27,258 333 Other rental business revenues 198,500 162,276 1,986
Subtotal 385,033 351,627 4,303 Total rental revenues 6,491,457 6,731,489 82,382
Real estate rental expenses:
Management fees 748,557 807,438 9,881 Utilities 91,815 104,456 1,278 Taxes and public dues 383,582 322,956 3,952 Repairs 89,923 207,308 2,537 Insurance premiums 11,579 11,607 142 Restoration costs 157,827 193,478 2,367 Custodian fees 60,545 60,407 739 Depreciation and amortization 1,072,736 1,146,885 14,036 Other operating expenses 97,482 128,080 1,567
Total real estate rental expenses 2,714,048 2,982,619 36,502 Rental income ¥3,777,409 ¥3,748,870 $45,880
Details of Gain on Sales of Real Estate Properties From
December 1, 2009 to August 31, 2010
(Thousands of yen) Park Terrace Shioyaki
Revenue from sale of real estate ¥185,000 Cost of real estate sales 158,479 Other sales expenses 7,830
Gain on sales of real estate 18,690 Park Terrace Horie
Revenue from sale of real estate 125,000 Cost of real estate sales 119,638 Other sales expenses 3,675
Gain on sales of real estate 1,686 LM Higashi Oume Daisan
Revenue from sale of real estate 81,000
18
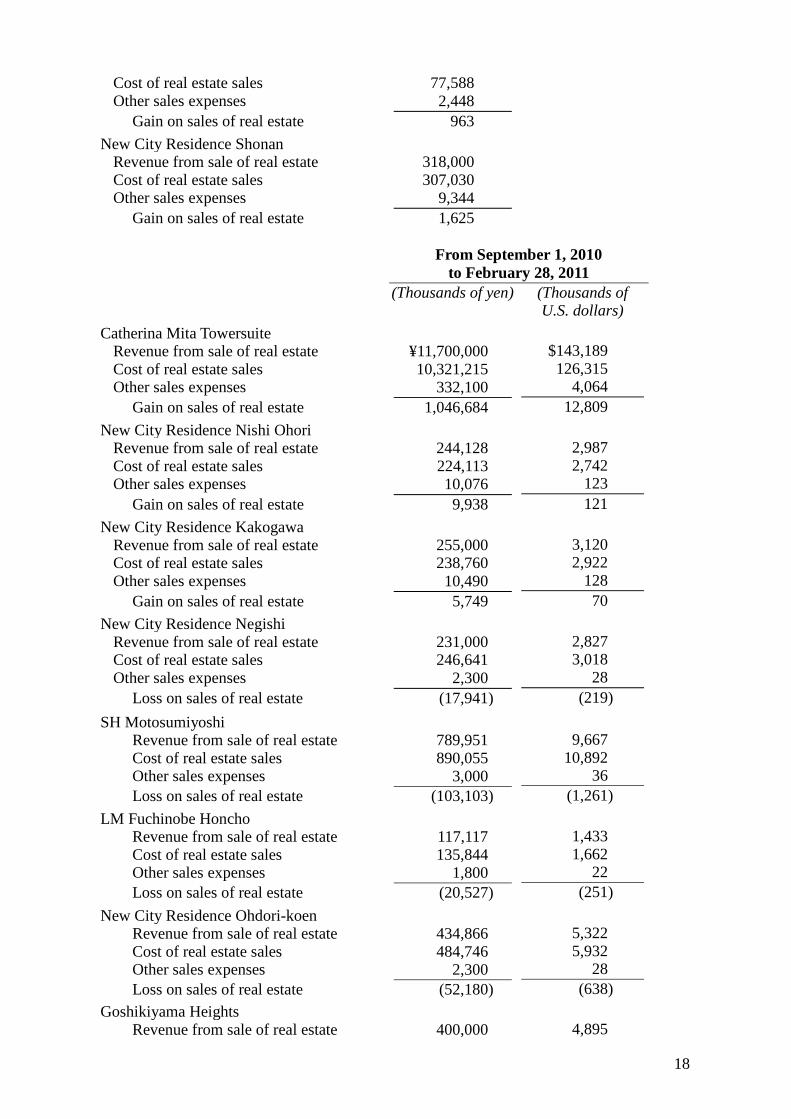
Cost of real estate sales 77,588 Other sales expenses 2,448
Gain on sales of real estate 963 New City Residence Shonan
Revenue from sale of real estate 318,000 Cost of real estate sales 307,030 Other sales expenses 9,344
Gain on sales of real estate 1,625 From September 1, 2010
to February 28, 2011 (Thousands of yen) (Thousands of
U.S. dollars) Catherina Mita Towersuite
Revenue from sale of real estate ¥11,700,000 $143,189 Cost of real estate sales 10,321,215 126,315 Other sales expenses 332,100 4,064
Gain on sales of real estate 1,046,684 12,809 New City Residence Nishi Ohori
Revenue from sale of real estate 244,128 2,987 Cost of real estate sales 224,113 2,742 Other sales expenses 10,076 123
Gain on sales of real estate 9,938 121 New City Residence Kakogawa
Revenue from sale of real estate 255,000 3,120 Cost of real estate sales 238,760 2,922 Other sales expenses 10,490 128
Gain on sales of real estate 5,749 70 New City Residence Negishi
Revenue from sale of real estate 231,000 2,827 Cost of real estate sales 246,641 3,018 Other sales expenses 2,300 28
Loss on sales of real estate (17,941) (219) SH Motosumiyoshi
Revenue from sale of real estate 789,951 9,667 Cost of real estate sales 890,055 10,892 Other sales expenses 3,000 36 Loss on sales of real estate (103,103) (1,261)
LM Fuchinobe Honcho Revenue from sale of real estate 117,117 1,433 Cost of real estate sales 135,844 1,662 Other sales expenses 1,800 22 Loss on sales of real estate (20,527) (251)
New City Residence Ohdori-koen Revenue from sale of real estate 434,866 5,322 Cost of real estate sales 484,746 5,932 Other sales expenses 2,300 28 Loss on sales of real estate (52,180) (638)
Goshikiyama Heights Revenue from sale of real estate 400,000 4,895
19
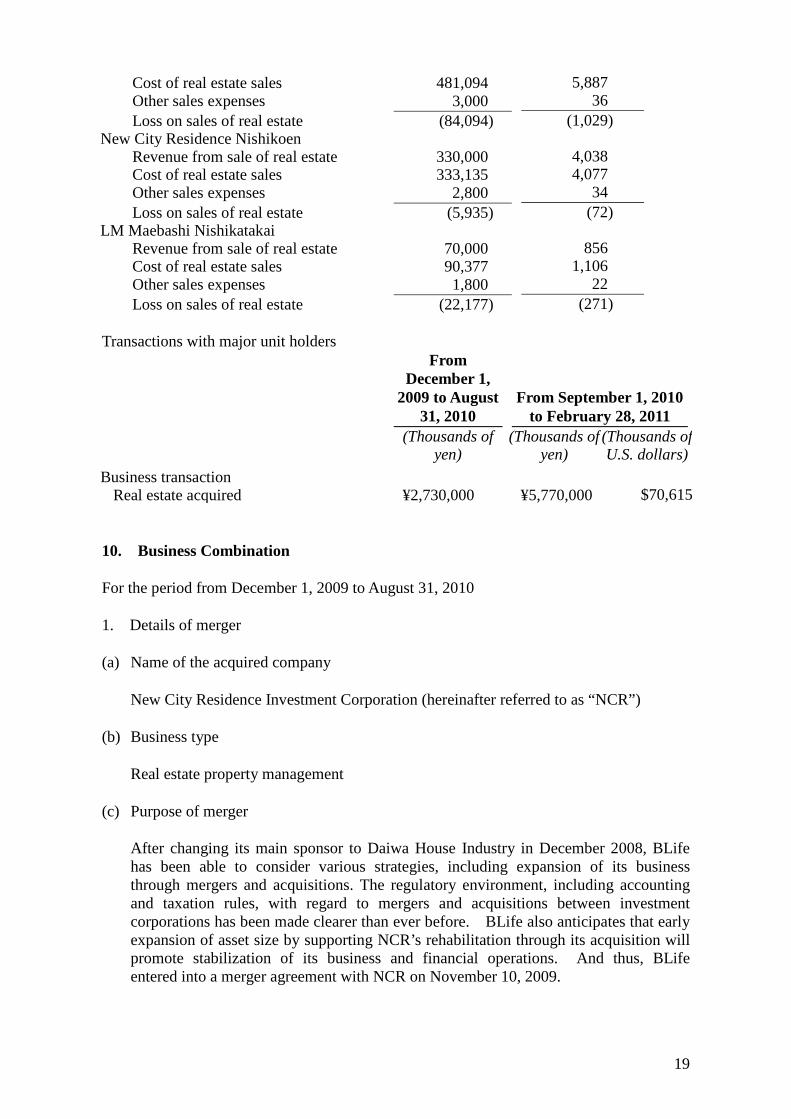
Cost of real estate sales 481,094 5,887 Other sales expenses 3,000 36 Loss on sales of real estate (84,094) (1,029)
New City Residence Nishikoen Revenue from sale of real estate 330,000 4,038 Cost of real estate sales 333,135 4,077 Other sales expenses 2,800 34 Loss on sales of real estate (5,935) (72)
LM Maebashi Nishikatakai Revenue from sale of real estate 70,000 856 Cost of real estate sales 90,377 1,106 Other sales expenses 1,800 22 Loss on sales of real estate (22,177) (271)
Transactions with major unit holders
From December 1,
2009 to August 31, 2010
From September 1, 2010 to February 28, 2011
(Thousands of yen)
(Thousands of yen)
(Thousands of U.S. dollars)
Business transaction Real estate acquired ¥2,730,000 ¥5,770,000 $70,615
10. Business Combination For the period from December 1, 2009 to August 31, 2010 1. Details of merger (a) Name of the acquired company
New City Residence Investment Corporation (hereinafter referred to as “NCR”) (b) Business type
Real estate property management (c) Purpose of merger
After changing its main sponsor to Daiwa House Industry in December 2008, BLife has been able to consider various strategies, including expansion of its business through mergers and acquisitions. The regulatory environment, including accounting and taxation rules, with regard to mergers and acquisitions between investment corporations has been made clearer than ever before. BLife also anticipates that early expansion of asset size by supporting NCR’s rehabilitation through its acquisition will promote stabilization of its business and financial operations. And thus, BLife entered into a merger agreement with NCR on November 10, 2009.
20
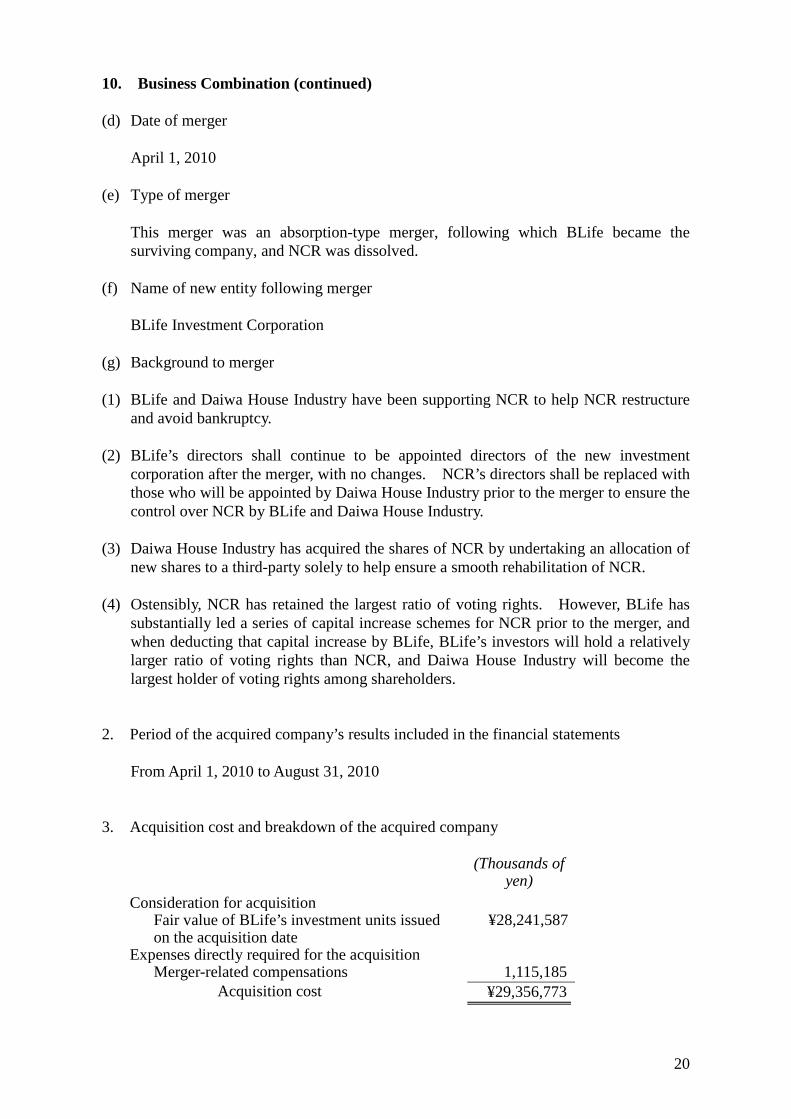
10. Business Combination (continued) (d) Date of merger
April 1, 2010 (e) Type of merger
This merger was an absorption-type merger, following which BLife became the surviving company, and NCR was dissolved.
(f) Name of new entity following merger
BLife Investment Corporation (g) Background to merger (1) BLife and Daiwa House Industry have been supporting NCR to help NCR restructure
and avoid bankruptcy. (2) BLife’s directors shall continue to be appointed directors of the new investment
corporation after the merger, with no changes. NCR’s directors shall be replaced with those who will be appointed by Daiwa House Industry prior to the merger to ensure the control over NCR by BLife and Daiwa House Industry.
(3) Daiwa House Industry has acquired the shares of NCR by undertaking an allocation of
new shares to a third-party solely to help ensure a smooth rehabilitation of NCR. (4) Ostensibly, NCR has retained the largest ratio of voting rights. However, BLife has
substantially led a series of capital increase schemes for NCR prior to the merger, and when deducting that capital increase by BLife, BLife’s investors will hold a relatively larger ratio of voting rights than NCR, and Daiwa House Industry will become the largest holder of voting rights among shareholders.
2. Period of the acquired company’s results included in the financial statements
From April 1, 2010 to August 31, 2010 3. Acquisition cost and breakdown of the acquired company
(Thousands of yen)
Consideration for acquisition Fair value of BLife’s investment units issued on the acquisition date
¥28,241,587
Expenses directly required for the acquisition Merger-related compensations 1,115,185
Acquisition cost ¥29,356,773
21
10. Business Combination (continued) 4. Basis of merger ratio calculation (a) Investment unit exchange ratio
BLife issued 0.23 of an investment unit for each NCR investment unit. (b) Calculation basis (1) The merger ratio was reviewed based primarily on the following valuations, including
comparative company analysis, discounted cash flow (DCF) analysis, market net asset value analysis, and EPS accretion/dilution analysis.
(2) The merger ratio was mutually agreed upon by BLife and NCR, following
consultations based on the report on merger ratio calculation submitted by the financial advisor, Morgan Stanley Japan Securities Co., Ltd., to BLife’s asset management company, appointed by BLife and based on advice by Citi Group Global Markets Japan Inc., appointed by NCR as its financial advisor.
(c) Number of investment units issued
69,475 units
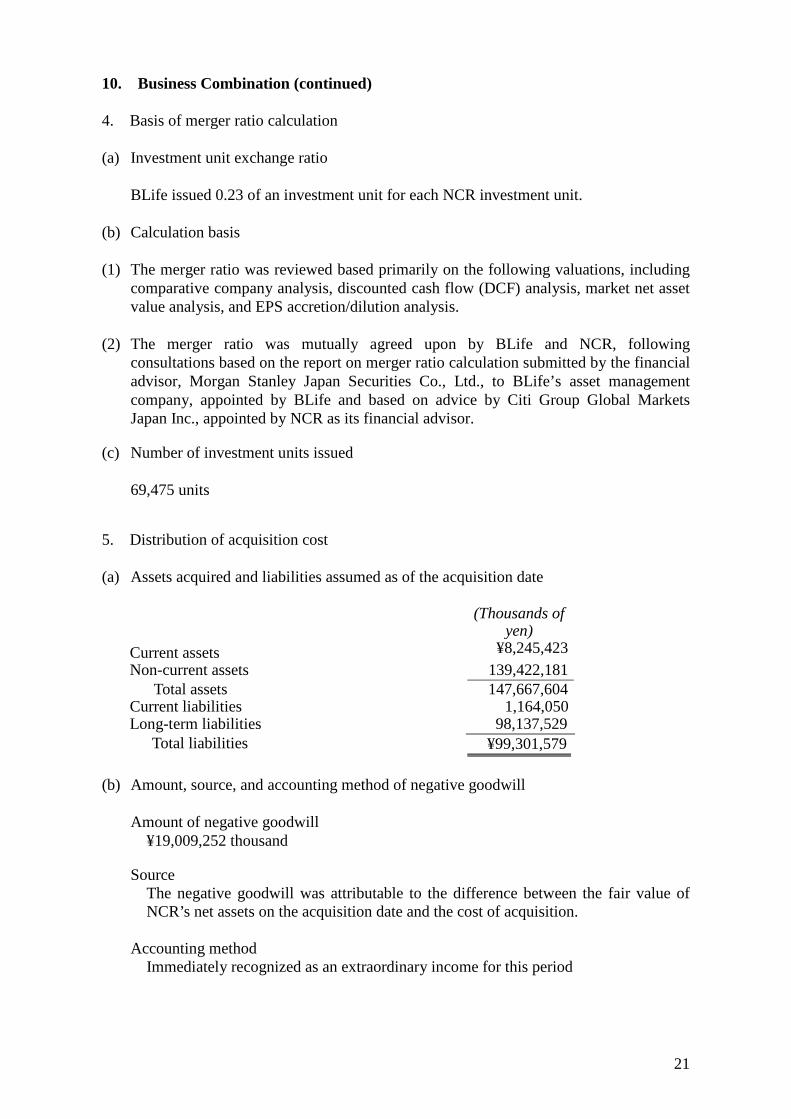
5. Distribution of acquisition cost (a) Assets acquired and liabilities assumed as of the acquisition date
(Thousands of yen)
Current assets ¥8,245,423 Non-current assets 139,422,181
Total assets 147,667,604 Current liabilities 1,164,050 Long-term liabilities 98,137,529
Total liabilities ¥99,301,579 (b) Amount, source, and accounting method of negative goodwill
Amount of negative goodwill ¥19,009,252 thousand
Source The negative goodwill was attributable to the difference between the fair value of NCR’s net assets on the acquisition date and the cost of acquisition.
Accounting method Immediately recognized as an extraordinary income for this period
22
10. Business Combination (continued)
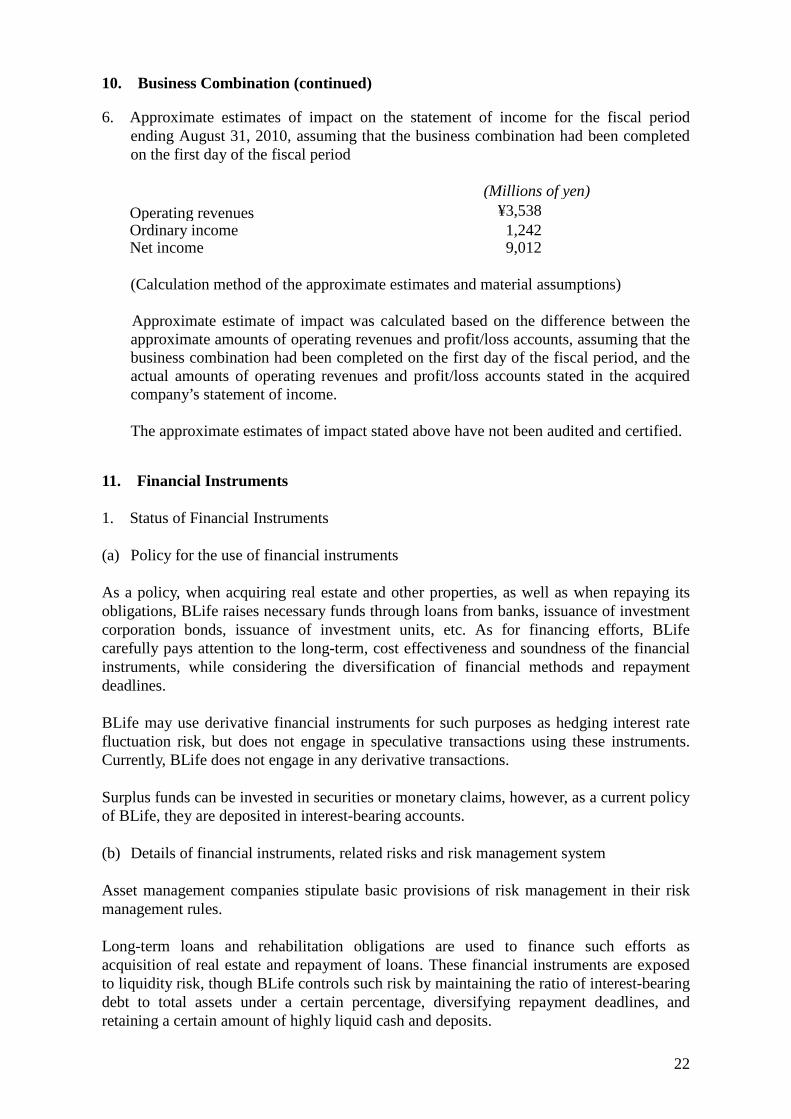
6. Approximate estimates of impact on the statement of income for the fiscal period ending August 31, 2010, assuming that the business combination had been completed on the first day of the fiscal period
(Millions of yen) Operating revenues ¥3,538 Ordinary income 1,242 Net income 9,012 (Calculation method of the approximate estimates and material assumptions) Approximate estimate of impact was calculated based on the difference between the approximate amounts of operating revenues and profit/loss accounts, assuming that the business combination had been completed on the first day of the fiscal period, and the actual amounts of operating revenues and profit/loss accounts stated in the acquired company’s statement of income. The approximate estimates of impact stated above have not been audited and certified.
11. Financial Instruments 1. Status of Financial Instruments (a) Policy for the use of financial instruments As a policy, when acquiring real estate and other properties, as well as when repaying its obligations, BLife raises necessary funds through loans from banks, issuance of investment corporation bonds, issuance of investment units, etc. As for financing efforts, BLife carefully pays attention to the long-term, cost effectiveness and soundness of the financial instruments, while considering the diversification of financial methods and repayment deadlines. BLife may use derivative financial instruments for such purposes as hedging interest rate fluctuation risk, but does not engage in speculative transactions using these instruments. Currently, BLife does not engage in any derivative transactions. Surplus funds can be invested in securities or monetary claims, however, as a current policy of BLife, they are deposited in interest-bearing accounts. (b) Details of financial instruments, related risks and risk management system Asset management companies stipulate basic provisions of risk management in their risk management rules. Long-term loans and rehabilitation obligations are used to finance such efforts as acquisition of real estate and repayment of loans. These financial instruments are exposed to liquidity risk, though BLife controls such risk by maintaining the ratio of interest-bearing debt to total assets under a certain percentage, diversifying repayment deadlines, and retaining a certain amount of highly liquid cash and deposits.
23
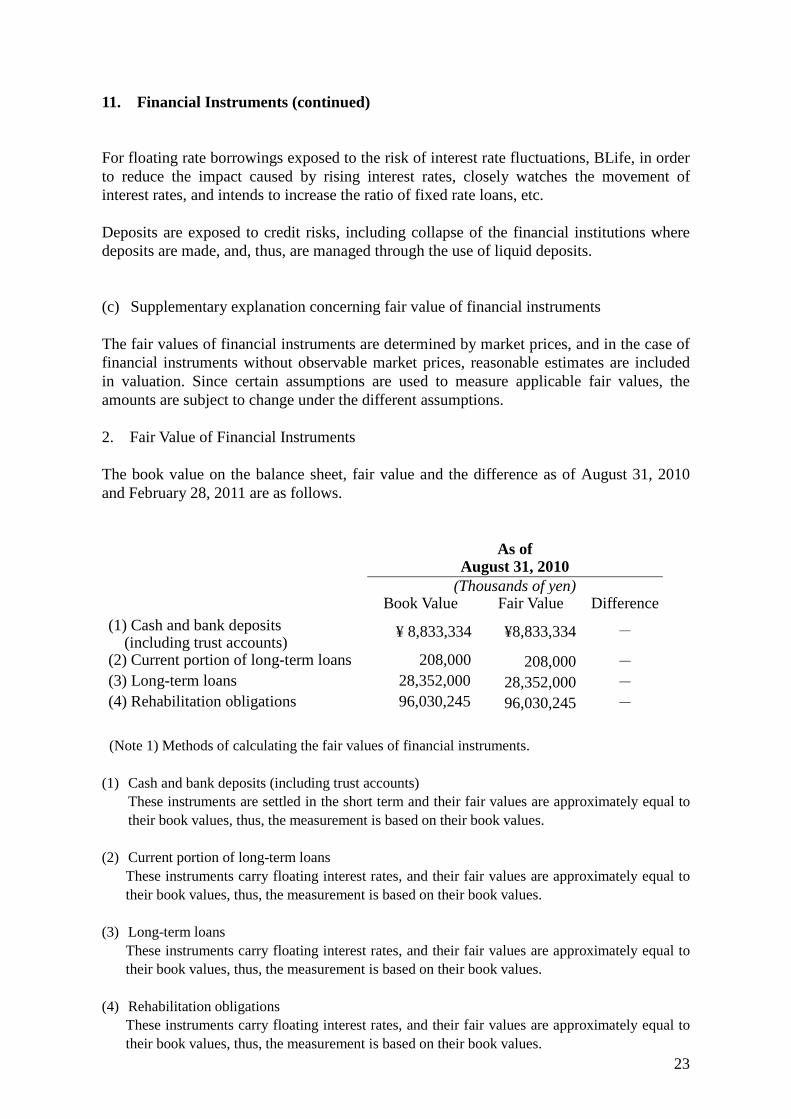
11. Financial Instruments (continued) For floating rate borrowings exposed to the risk of interest rate fluctuations, BLife, in order to reduce the impact caused by rising interest rates, closely watches the movement of interest rates, and intends to increase the ratio of fixed rate loans, etc. Deposits are exposed to credit risks, including collapse of the financial institutions where deposits are made, and, thus, are managed through the use of liquid deposits. (c) Supplementary explanation concerning fair value of financial instruments The fair values of financial instruments are determined by market prices, and in the case of financial instruments without observable market prices, reasonable estimates are included in valuation. Since certain assumptions are used to measure applicable fair values, the amounts are subject to change under the different assumptions. 2. Fair Value of Financial Instruments The book value on the balance sheet, fair value and the difference as of August 31, 2010 and February 28, 2011 are as follows.
As of
August 31, 2010 (Thousands of yen) Book Value Fair Value Difference (1) Cash and bank deposits (including trust accounts)
¥ 8,833,334 ¥8,833,334 -
(2) Current portion of long-term loans 208,000 208,000 - (3) Long-term loans 28,352,000 28,352,000 - (4) Rehabilitation obligations 96,030,245 96,030,245 -
(Note 1) Methods of calculating the fair values of financial instruments. (1) Cash and bank deposits (including trust accounts)
These instruments are settled in the short term and their fair values are approximately equal to their book values, thus, the measurement is based on their book values.
(2) Current portion of long-term loans These instruments carry floating interest rates, and their fair values are approximately equal to their book values, thus, the measurement is based on their book values.
(3) Long-term loans These instruments carry floating interest rates, and their fair values are approximately equal to their book values, thus, the measurement is based on their book values.
(4) Rehabilitation obligations These instruments carry floating interest rates, and their fair values are approximately equal to their book values, thus, the measurement is based on their book values.
24
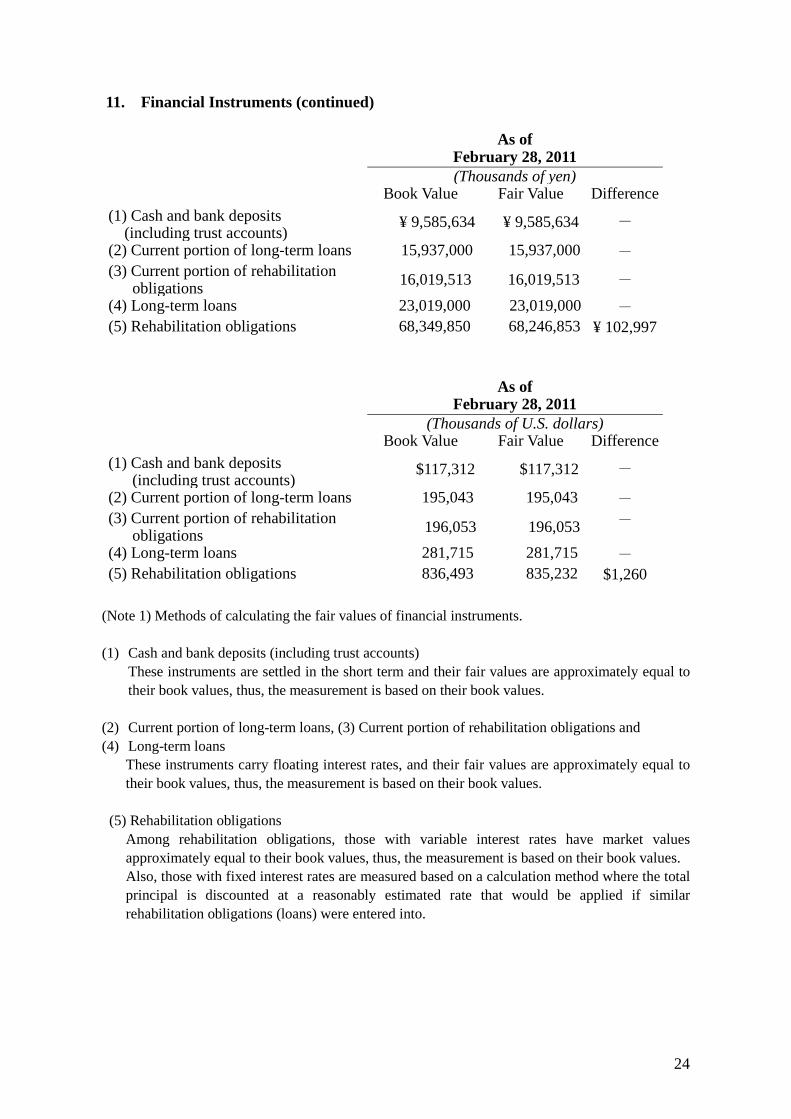
11. Financial Instruments (continued) As of
February 28, 2011 (Thousands of yen) Book Value Fair Value Difference (1) Cash and bank deposits (including trust accounts)
¥ 9,585,634 ¥ 9,585,634 -
(2) Current portion of long-term loans 15,937,000 15,937,000 - (3) Current portion of rehabilitation
obligations 16,019,513 16,019,513 - (4) Long-term loans 23,019,000 23,019,000 - (5) Rehabilitation obligations 68,349,850 68,246,853 ¥ 102,997
As of
February 28, 2011 (Thousands of U.S. dollars) Book Value Fair Value Difference (1) Cash and bank deposits
(including trust accounts) $117,312 $117,312 -
(2) Current portion of long-term loans 195,043 195,043 - (3) Current portion of rehabilitation
obligations 196,053 196,053 -
(4) Long-term loans 281,715 281,715 - (5) Rehabilitation obligations 836,493 835,232 $1,260
(Note 1) Methods of calculating the fair values of financial instruments. (1) Cash and bank deposits (including trust accounts)
These instruments are settled in the short term and their fair values are approximately equal to their book values, thus, the measurement is based on their book values.
(2) Current portion of long-term loans, (3) Current portion of rehabilitation obligations and (4) Long-term loans
These instruments carry floating interest rates, and their fair values are approximately equal to their book values, thus, the measurement is based on their book values.
(5) Rehabilitation obligations Among rehabilitation obligations, those with variable interest rates have market values approximately equal to their book values, thus, the measurement is based on their book values. Also, those with fixed interest rates are measured based on a calculation method where the total principal is discounted at a reasonably estimated rate that would be applied if similar rehabilitation obligations (loans) were entered into.
25
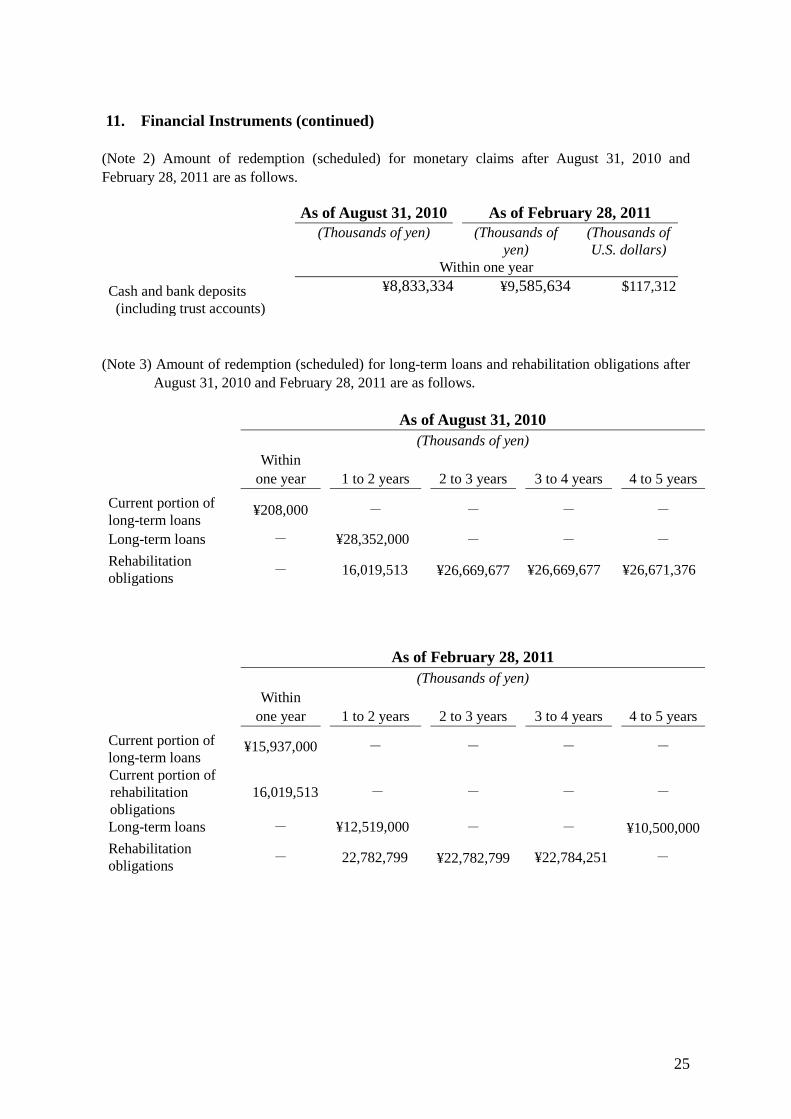
11. Financial Instruments (continued)
(Note 2) Amount of redemption (scheduled) for monetary claims after August 31, 2010 and February 28, 2011 are as follows.
As of August 31, 2010 As of February 28, 2011 (Thousands of yen) (Thousands of
yen) (Thousands of U.S. dollars)
Within one year Cash and bank deposits (including trust accounts)
¥8,833,334 ¥9,585,634 $117,312
(Note 3) Amount of redemption (scheduled) for long-term loans and rehabilitation obligations after
August 31, 2010 and February 28, 2011 are as follows.
As of August 31, 2010 (Thousands of yen) Within
one year 1 to 2 years 2 to 3 years 3 to 4 years 4 to 5 years Current portion of long-term loans
¥208,000 - - - -
Long-term loans - ¥28,352,000 - - - Rehabilitation obligations - 16,019,513 ¥26,669,677 ¥26,669,677 ¥26,671,376
As of February 28, 2011 (Thousands of yen) Within
one year 1 to 2 years 2 to 3 years 3 to 4 years 4 to 5 years Current portion of long-term loans
¥15,937,000 - - - -
Current portion of rehabilitation obligations
16,019,513 - - - -
Long-term loans - ¥12,519,000 - - ¥10,500,000 Rehabilitation obligations - 22,782,799 ¥22,782,799 ¥22,784,251 -
26
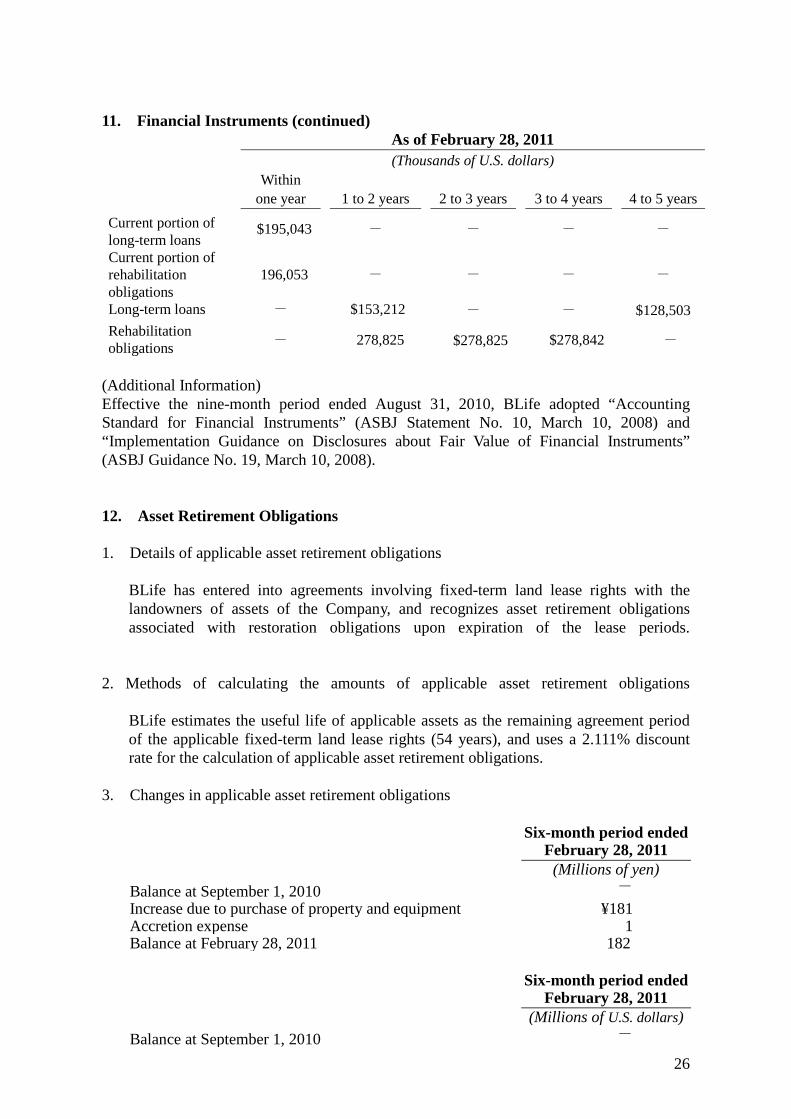
11. Financial Instruments (continued) As of February 28, 2011 (Thousands of U.S. dollars) Within
one year 1 to 2 years 2 to 3 years 3 to 4 years 4 to 5 years Current portion of long-term loans
$195,043 - - - -
Current portion of rehabilitation obligations
196,053 - - - -
Long-term loans - $153,212 - - $128,503 Rehabilitation obligations - 278,825 $278,825 $278,842 -
(Additional Information) Effective the nine-month period ended August 31, 2010, BLife adopted “Accounting Standard for Financial Instruments” (ASBJ Statement No. 10, March 10, 2008) and “Implementation Guidance on Disclosures about Fair Value of Financial Instruments” (ASBJ Guidance No. 19, March 10, 2008). 12. Asset Retirement Obligations 1. Details of applicable asset retirement obligations
BLife has entered into agreements involving fixed-term land lease rights with the landowners of assets of the Company, and recognizes asset retirement obligations associated with restoration obligations upon expiration of the lease periods.
2. Methods of calculating the amounts of applicable asset retirement obligations
BLife estimates the useful life of applicable assets as the remaining agreement period of the applicable fixed-term land lease rights (54 years), and uses a 2.111% discount rate for the calculation of applicable asset retirement obligations.
3. Changes in applicable asset retirement obligations
Six-month period ended
February 28, 2011 (Millions of yen) Balance at September 1, 2010 - Increase due to purchase of property and equipment ¥181 Accretion expense 1 Balance at February 28, 2011 182
Six-month period ended
February 28, 2011 (Millions of U.S. dollars) Balance at September 1, 2010 -
27
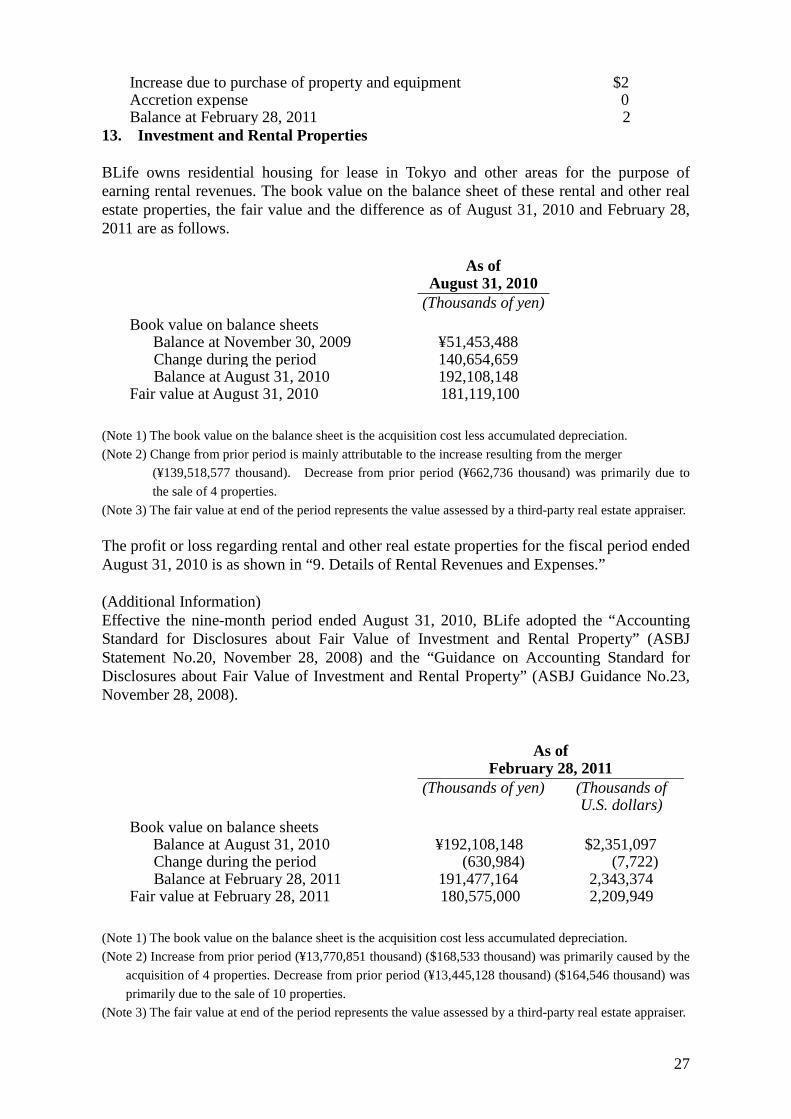
Increase due to purchase of property and equipment $2 Accretion expense 0 Balance at February 28, 2011 2
13. Investment and Rental Properties BLife owns residential housing for lease in Tokyo and other areas for the purpose of earning rental revenues. The book value on the balance sheet of these rental and other real estate properties, the fair value and the difference as of August 31, 2010 and February 28, 2011 are as follows.
As of August 31, 2010
(Thousands of yen) Book value on balance sheets
Balance at November 30, 2009 ¥51,453,488 Change during the period 140,654,659 Balance at August 31, 2010 192,108,148
Fair value at August 31, 2010 181,119,100
(Note 1) The book value on the balance sheet is the acquisition cost less accumulated depreciation. (Note 2) Change from prior period is mainly attributable to the increase resulting from the merger
(¥139,518,577 thousand). Decrease from prior period (¥662,736 thousand) was primarily due to the sale of 4 properties.
(Note 3) The fair value at end of the period represents the value assessed by a third-party real estate appraiser. The profit or loss regarding rental and other real estate properties for the fiscal period ended August 31, 2010 is as shown in “9. Details of Rental Revenues and Expenses.” (Additional Information) Effective the nine-month period ended August 31, 2010, BLife adopted the “Accounting Standard for Disclosures about Fair Value of Investment and Rental Property” (ASBJ Statement No.20, November 28, 2008) and the “Guidance on Accounting Standard for Disclosures about Fair Value of Investment and Rental Property” (ASBJ Guidance No.23, November 28, 2008).
As of February 28, 2011
(Thousands of yen) (Thousands of U.S. dollars)
Book value on balance sheets Balance at August 31, 2010 ¥192,108,148 $2,351,097 Change during the period (630,984) (7,722) Balance at February 28, 2011 191,477,164 2,343,374
Fair value at February 28, 2011 180,575,000 2,209,949
(Note 1) The book value on the balance sheet is the acquisition cost less accumulated depreciation. (Note 2) Increase from prior period (¥13,770,851 thousand) ($168,533 thousand) was primarily caused by the
acquisition of 4 properties. Decrease from prior period (¥13,445,128 thousand) ($164,546 thousand) was primarily due to the sale of 10 properties.
(Note 3) The fair value at end of the period represents the value assessed by a third-party real estate appraiser.
28
The profit or loss regarding rental and other real estate properties for the fiscal period ended February 28, 2011 is as shown in “9. Details of Rental Revenues and Expenses.” 14. Segment Information, For the period from September 1, 2010 to February 28, 2011 1. Segment Information Since BLife has been engaged in a single segment of the real estate leasing business, and
there is no other business segment for disclosure, segment information has been omitted. 2. Related Information (1) Information about products and services Since operating revenues from external customers for a single segment of product and
service account for over 90% of total operating revenues in BLife’s statements of income and retained earnings, information about products and services has been omitted.
(2) Information about geographic areas (a) Operating revenues Since operating revenues from external customers within Japan account for over 90% of
total operating revenues in BLife’s statement of income and retained earnings for the period ended February 28, 2011, information about geographic areas has been omitted.
(b) Property and equipment Since over 90% of total property and equipment on the balance sheet as of February 28,
2011 is located within Japan, information about geographic areas on such property and equipment has been omitted.
(3) Information about major customers Since no single external client represents 10% or more of total operating revenues in
BLife’s statement of income and retained earnings for the period ended February 28, 2011, information about major client has been omitted.
(Additional Information) From this fiscal period, BLife has adopted “Revised Accounting Standard for
Disclosures about Segments of an Enterprise and Related Information” (ASBJ Statement Revised, March 27, 2009) and “Guidance on Accounting Standard for Disclosures about Segments of an Enterprise and Related Information” (ASBJ Guidance No. 20, March 21, 2008). Moreover, since BLife has been engaged in a single segment of the real estate leasing business, segment information for the previous period, in accordance with said accounting standards, has been omitted.
.
29
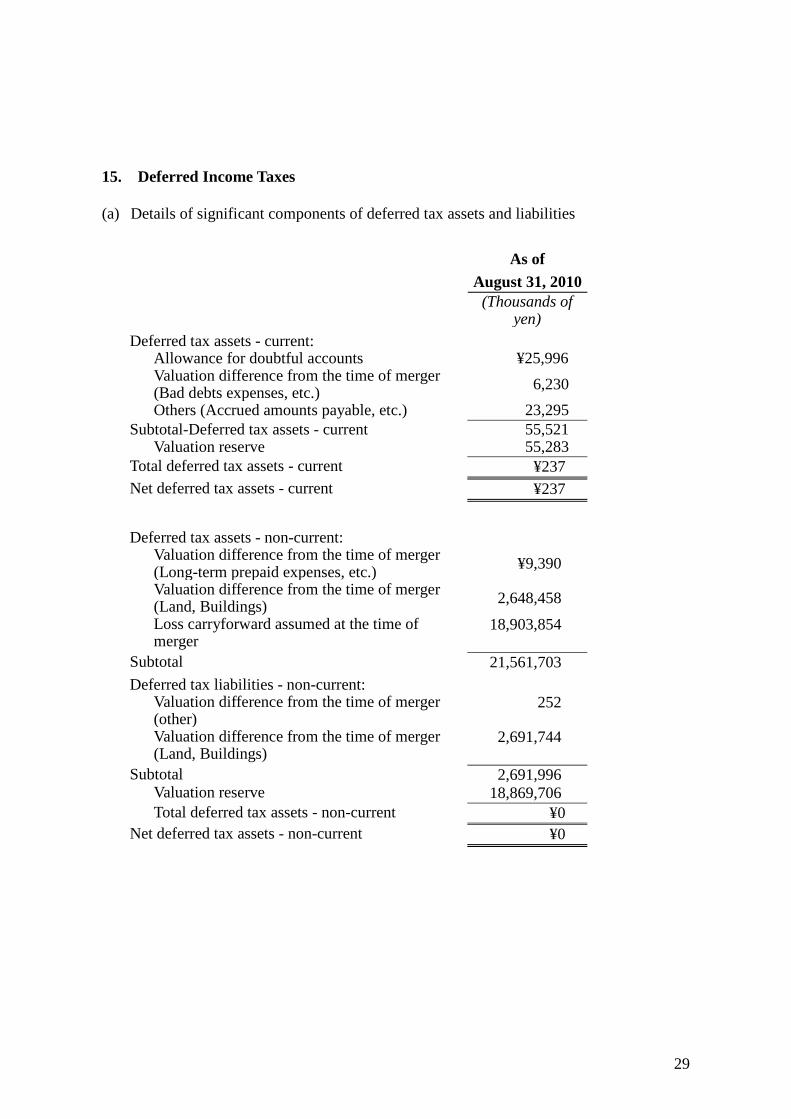
15. Deferred Income Taxes (a) Details of significant components of deferred tax assets and liabilities
As of August 31, 2010
(Thousands of yen)
Deferred tax assets - current: Allowance for doubtful accounts ¥25,996 Valuation difference from the time of merger (Bad debts expenses, etc.) 6,230 Others (Accrued amounts payable, etc.) 23,295
Subtotal-Deferred tax assets - current 55,521 Valuation reserve 55,283
Total deferred tax assets - current ¥237 Net deferred tax assets - current ¥237
Deferred tax assets - non-current: Valuation difference from the time of merger (Long-term prepaid expenses, etc.) ¥9,390 Valuation difference from the time of merger (Land, Buildings) 2,648,458 Loss carryforward assumed at the time of merger
18,903,854
Subtotal 21,561,703 Deferred tax liabilities - non-current:
Valuation difference from the time of merger (other)
252
Valuation difference from the time of merger (Land, Buildings)
2,691,744
Subtotal 2,691,996 Valuation reserve 18,869,706 Total deferred tax assets - non-current ¥0
Net deferred tax assets - non-current ¥0
30
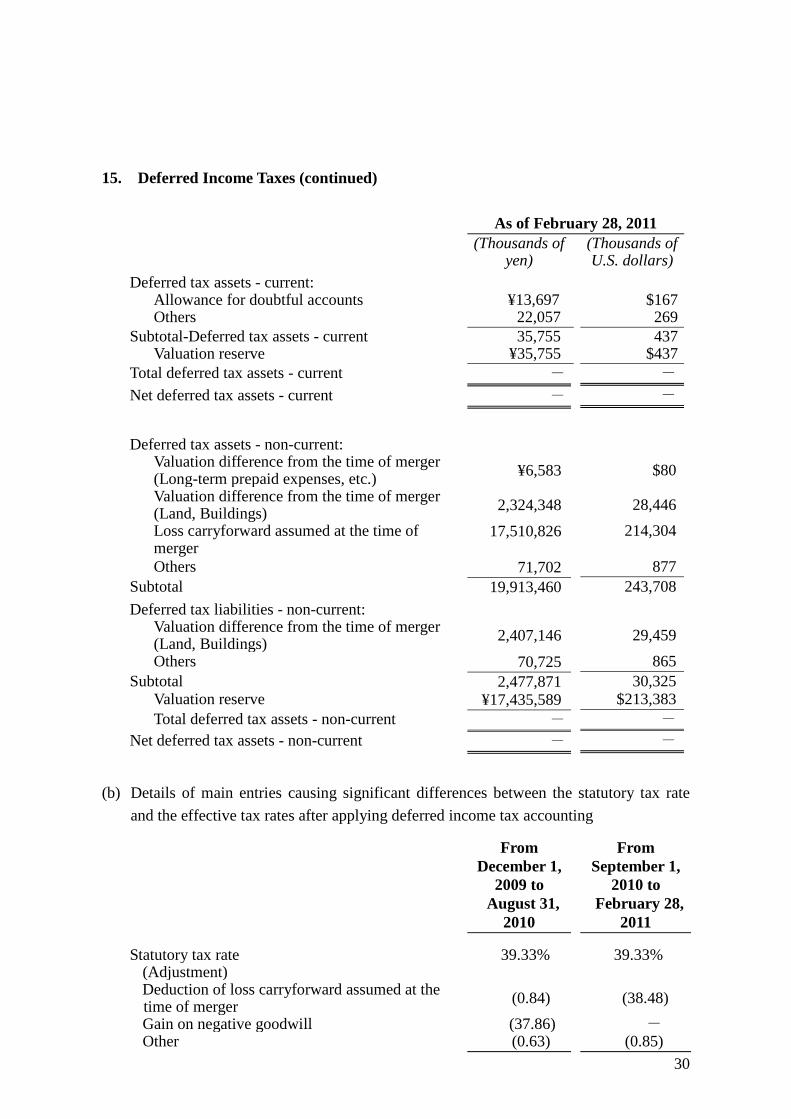
15. Deferred Income Taxes (continued)
As of February 28, 2011 (Thousands of
yen) (Thousands of U.S. dollars)
Deferred tax assets - current: Allowance for doubtful accounts ¥13,697 $167 Others 22,057 269
Subtotal-Deferred tax assets - current 35,755 437 Valuation reserve ¥35,755 $437
Total deferred tax assets - current - - Net deferred tax assets - current - -
Deferred tax assets - non-current: Valuation difference from the time of merger (Long-term prepaid expenses, etc.) ¥6,583 $80 Valuation difference from the time of merger (Land, Buildings) 2,324,348 28,446 Loss carryforward assumed at the time of merger
17,510,826
214,304
Others 71,702 877 Subtotal 19,913,460 243,708 Deferred tax liabilities - non-current:
Valuation difference from the time of merger (Land, Buildings) 2,407,146 29,459 Others 70,725 865
Subtotal 2,477,871 30,325 Valuation reserve ¥17,435,589 $213,383 Total deferred tax assets - non-current - -
Net deferred tax assets - non-current - -
(b) Details of main entries causing significant differences between the statutory tax rate
and the effective tax rates after applying deferred income tax accounting
From December 1,
2009 to August 31,
2010
From September 1,
2010 to February 28,
2011
Statutory tax rate 39.33% 39.33% (Adjustment) Deduction of loss carryforward assumed at the time of merger (0.84) (38.48) Gain on negative goodwill (37.86) - Other (0.63) (0.85)
31
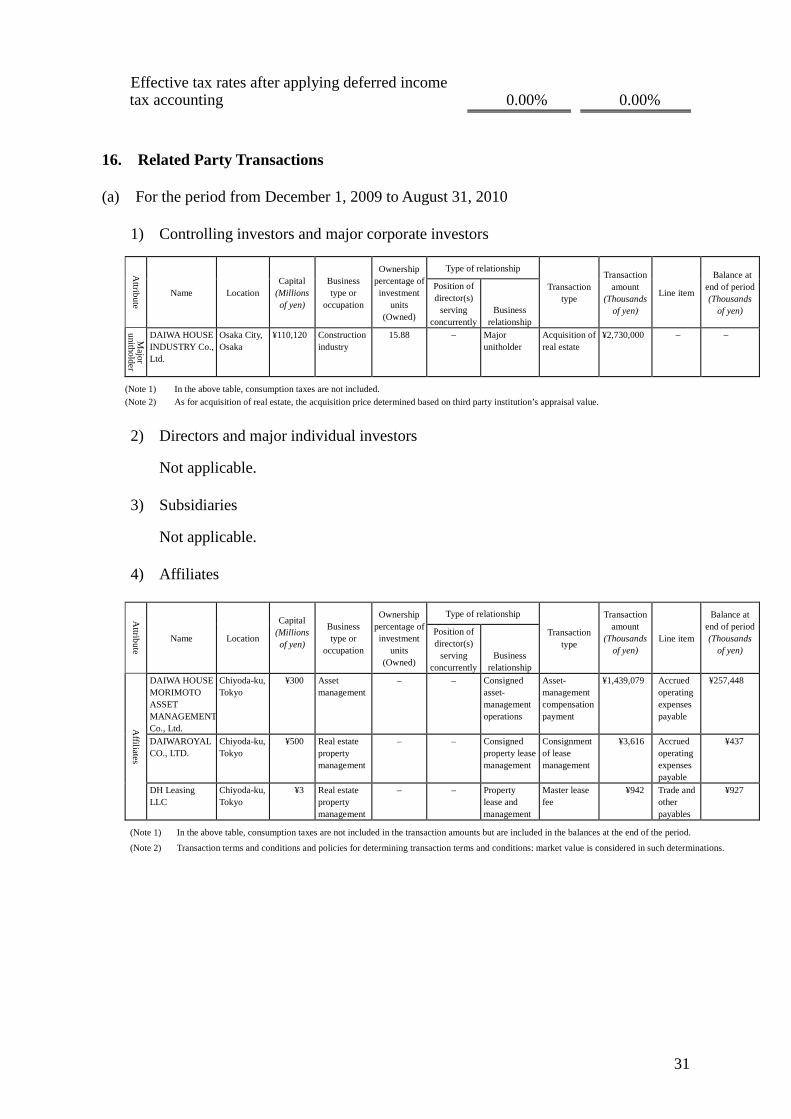
Effective tax rates after applying deferred income tax accounting
0.00%
0.00%
16. Related Party Transactions (a) For the period from December 1, 2009 to August 31, 2010
1) Controlling investors and major corporate investors
Attribute
Name Location Capital
(Millions of yen)
Business type or
occupation
Ownership percentage of investment
units (Owned)
Type of relationship
Transaction type
Transaction amount
(Thousands of yen)
Line item
Balance at end of period (Thousands
of yen)
Position of director(s)
serving concurrently
Business relationship
Major
unitholder
DAIWA HOUSE INDUSTRY Co., Ltd.
Osaka City, Osaka
¥110,120 Construction industry
15.88 – Major unitholder
Acquisition of real estate
¥2,730,000 – –
(Note 1) In the above table, consumption taxes are not included. (Note 2) As for acquisition of real estate, the acquisition price determined based on third party institution’s appraisal value. 2) Directors and major individual investors Not applicable. 3) Subsidiaries Not applicable. 4) Affiliates
Attribute
Name Location
Capital (Millions of yen)
Business type or
occupation
Ownership percentage of investment
units (Owned)
Type of relationship
Transaction type
Transaction amount
(Thousands of yen)
Line item
Balance at end of period (Thousands
of yen)
Position of director(s)
serving concurrently
Business relationship
Affiliates
DAIWA HOUSE MORIMOTO ASSET MANAGEMENT Co., Ltd.
Chiyoda-ku, Tokyo
¥300 Asset management
– – Consigned asset- management operations
Asset- management compensation payment
¥1,439,079 Accrued operating expenses payable
¥257,448
DAIWAROYAL CO., LTD.
Chiyoda-ku, Tokyo
¥500 Real estate property management
– – Consigned property lease management
Consignment of lease management
¥3,616 Accrued operating expenses payable
¥437
DH Leasing LLC
Chiyoda-ku, Tokyo
¥3 Real estate property management
– – Property lease and management
Master lease fee
¥942 Trade and other payables
¥927
(Note 1) In the above table, consumption taxes are not included in the transaction amounts but are included in the balances at the end of the period.
(Note 2) Transaction terms and conditions and policies for determining transaction terms and conditions: market value is considered in such determinations.
32
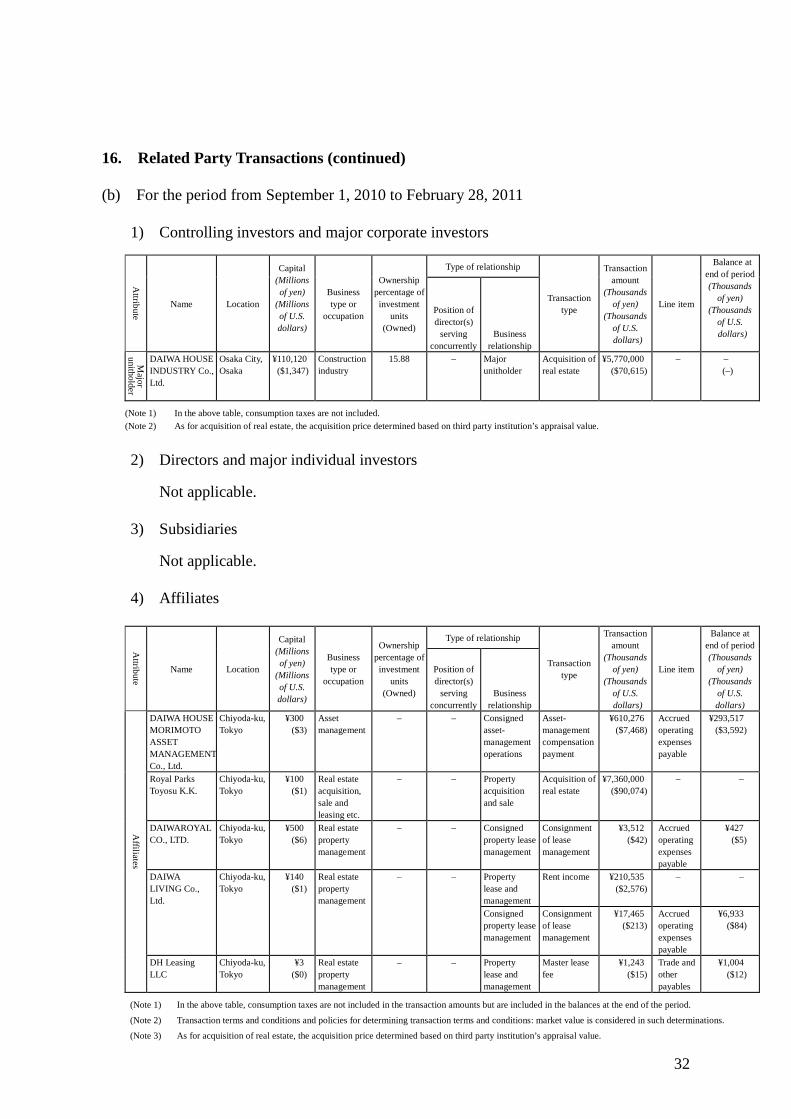
16. Related Party Transactions (continued) (b) For the period from September 1, 2010 to February 28, 2011
1) Controlling investors and major corporate investors
Attribute
Name Location
Capital (Millions of yen)
(Millions of U.S. dollars)
Business type or
occupation
Ownership percentage of investment
units (Owned)
Type of relationship
Transaction type
Transaction amount
(Thousands of yen)
(Thousands of U.S.
dollars)
Line item
Balance at end of period (Thousands
of yen) (Thousands
of U.S. dollars)
Position of director(s)
serving concurrently
Business relationship
Major
unitholder
DAIWA HOUSE INDUSTRY Co., Ltd.
Osaka City, Osaka
¥110,120 ($1,347)
Construction industry
15.88 – Major unitholder
Acquisition of real estate
¥5,770,000 ($70,615)
– – (–)
(Note 1) In the above table, consumption taxes are not included. (Note 2) As for acquisition of real estate, the acquisition price determined based on third party institution’s appraisal value.
2) Directors and major individual investors Not applicable. 3) Subsidiaries Not applicable. 4) Affiliates
Attribute
Name Location
Capital (Millions of yen)
(Millions of U.S. dollars)
Business type or
occupation
Ownership percentage of investment
units (Owned)
Type of relationship
Transaction type
Transaction amount
(Thousands of yen)
(Thousands of U.S.
dollars)
Line item
Balance at end of period (Thousands
of yen) (Thousands
of U.S. dollars)
Position of director(s)
serving concurrently
Business relationship
Affiliates
DAIWA HOUSE MORIMOTO ASSET MANAGEMENT Co., Ltd.
Chiyoda-ku, Tokyo
¥300 ($3)
Asset management
– – Consigned asset- management operations
Asset- management compensation payment
¥610,276 ($7,468)
Accrued operating expenses payable
¥293,517 ($3,592)
Royal Parks Toyosu K.K.
Chiyoda-ku, Tokyo
¥100 ($1)
Real estate acquisition, sale and leasing etc.
– – Property acquisition and sale
Acquisition of real estate
¥7,360,000 ($90,074)
– –
DAIWAROYAL CO., LTD.
Chiyoda-ku, Tokyo
¥500 ($6)
Real estate property management
– – Consigned property lease management
Consignment of lease management
¥3,512 ($42)
Accrued operating expenses payable
¥427 ($5)
DAIWA LIVING Co., Ltd.
Chiyoda-ku, Tokyo
¥140 ($1)
Real estate property management
– – Property lease and management
Rent income ¥210,535 ($2,576)
– –
Consigned property lease management
Consignment of lease management
¥17,465 ($213)
Accrued operating expenses payable
¥6,933 ($84)
DH Leasing LLC
Chiyoda-ku, Tokyo
¥3 ($0)
Real estate property management
– – Property lease and management
Master lease fee
¥1,243 ($15)
Trade and other payables
¥1,004 ($12)
(Note 1) In the above table, consumption taxes are not included in the transaction amounts but are included in the balances at the end of the period.
(Note 2) Transaction terms and conditions and policies for determining transaction terms and conditions: market value is considered in such determinations.
(Note 3) As for acquisition of real estate, the acquisition price determined based on third party institution’s appraisal value.
33
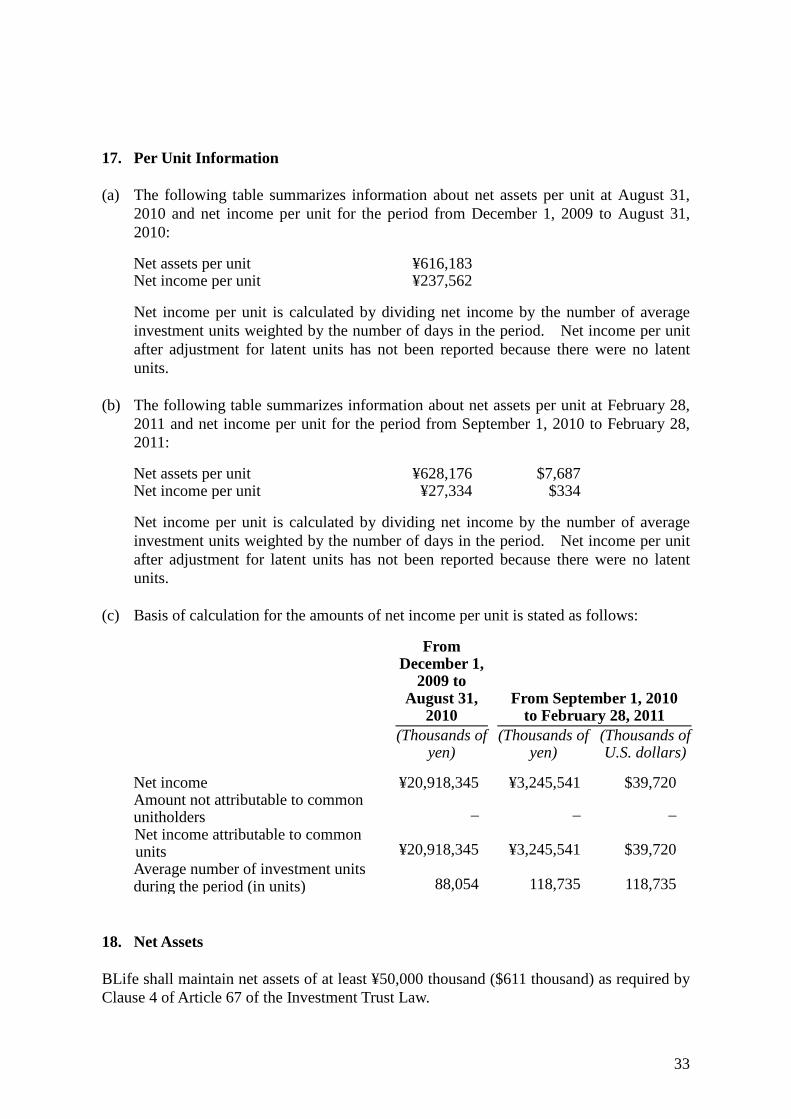
17. Per Unit Information (a) The following table summarizes information about net assets per unit at August 31,
2010 and net income per unit for the period from December 1, 2009 to August 31, 2010:
Net assets per unit ¥616,183 Net income per unit ¥237,562
Net income per unit is calculated by dividing net income by the number of average
investment units weighted by the number of days in the period. Net income per unit after adjustment for latent units has not been reported because there were no latent units.
(b) The following table summarizes information about net assets per unit at February 28,
2011 and net income per unit for the period from September 1, 2010 to February 28, 2011:
Net assets per unit ¥628,176 $7,687 Net income per unit ¥27,334 $334
Net income per unit is calculated by dividing net income by the number of average
investment units weighted by the number of days in the period. Net income per unit after adjustment for latent units has not been reported because there were no latent units.
(c) Basis of calculation for the amounts of net income per unit is stated as follows:
From December 1,
2009 to August 31,
2010 From September 1, 2010
to February 28, 2011 (Thousands of
yen) (Thousands of
yen) (Thousands of U.S. dollars)
Net income ¥20,918,345 ¥3,245,541 $39,720 Amount not attributable to common unitholders – – – Net income attributable to common units ¥20,918,345 ¥3,245,541 $39,720 Average number of investment units during the period (in units) 88,054 118,735 118,735
18. Net Assets BLife shall maintain net assets of at least ¥50,000 thousand ($611 thousand) as required by Clause 4 of Article 67 of the Investment Trust Law.
34
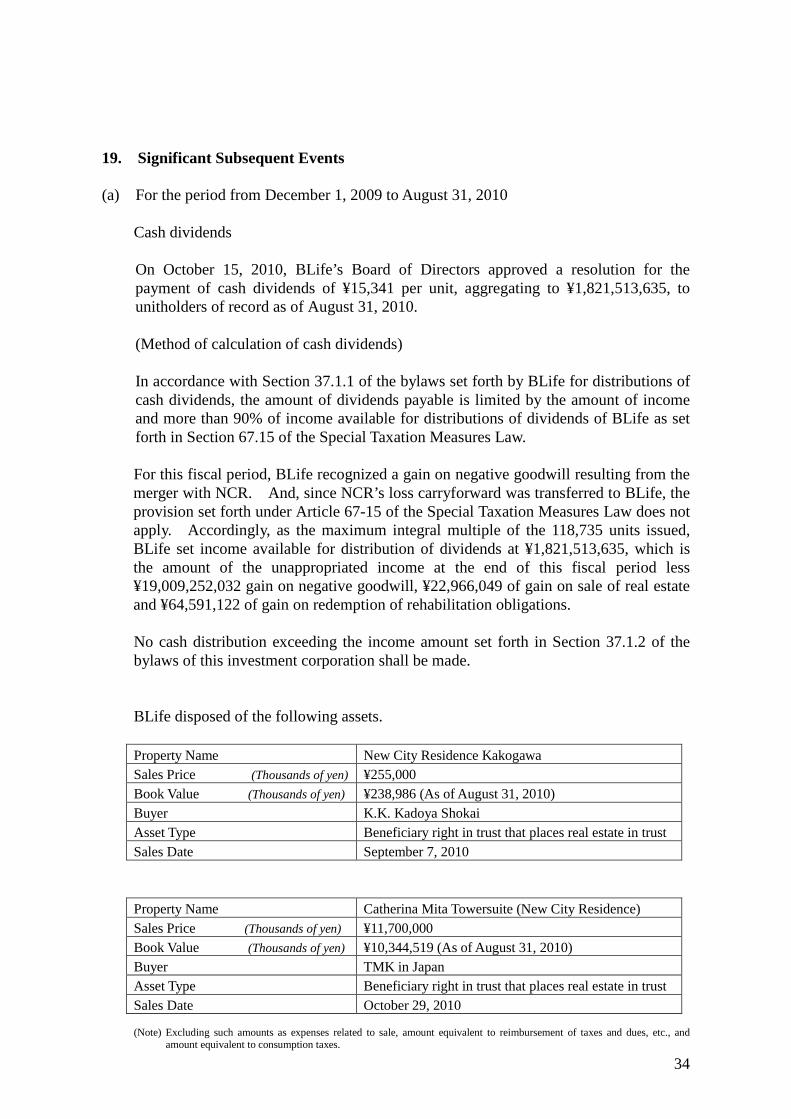
19. Significant Subsequent Events (a) For the period from December 1, 2009 to August 31, 2010
Cash dividends On October 15, 2010, BLife’s Board of Directors approved a resolution for the payment of cash dividends of ¥15,341 per unit, aggregating to ¥1,821,513,635, to unitholders of record as of August 31, 2010.
(Method of calculation of cash dividends) In accordance with Section 37.1.1 of the bylaws set forth by BLife for distributions of
cash dividends, the amount of dividends payable is limited by the amount of income and more than 90% of income available for distributions of dividends of BLife as set forth in Section 67.15 of the Special Taxation Measures Law.
For this fiscal period, BLife recognized a gain on negative goodwill resulting from the merger with NCR. And, since NCR’s loss carryforward was transferred to BLife, the provision set forth under Article 67-15 of the Special Taxation Measures Law does not apply. Accordingly, as the maximum integral multiple of the 118,735 units issued, BLife set income available for distribution of dividends at ¥1,821,513,635, which is the amount of the unappropriated income at the end of this fiscal period less ¥19,009,252,032 gain on negative goodwill, ¥22,966,049 of gain on sale of real estate and ¥64,591,122 of gain on redemption of rehabilitation obligations. No cash distribution exceeding the income amount set forth in Section 37.1.2 of the bylaws of this investment corporation shall be made. BLife disposed of the following assets. Property Name New City Residence Kakogawa Sales Price (Thousands of yen) ¥255,000 Book Value (Thousands of yen) ¥238,986 (As of August 31, 2010) Buyer K.K. Kadoya Shokai Asset Type Beneficiary right in trust that places real estate in trust Sales Date September 7, 2010 Property Name Catherina Mita Towersuite (New City Residence) Sales Price (Thousands of yen) ¥11,700,000 Book Value (Thousands of yen) ¥10,344,519 (As of August 31, 2010) Buyer TMK in Japan Asset Type Beneficiary right in trust that places real estate in trust Sales Date October 29, 2010 (Note) Excluding such amounts as expenses related to sale, amount equivalent to reimbursement of taxes and dues, etc., and
amount equivalent to consumption taxes.
35
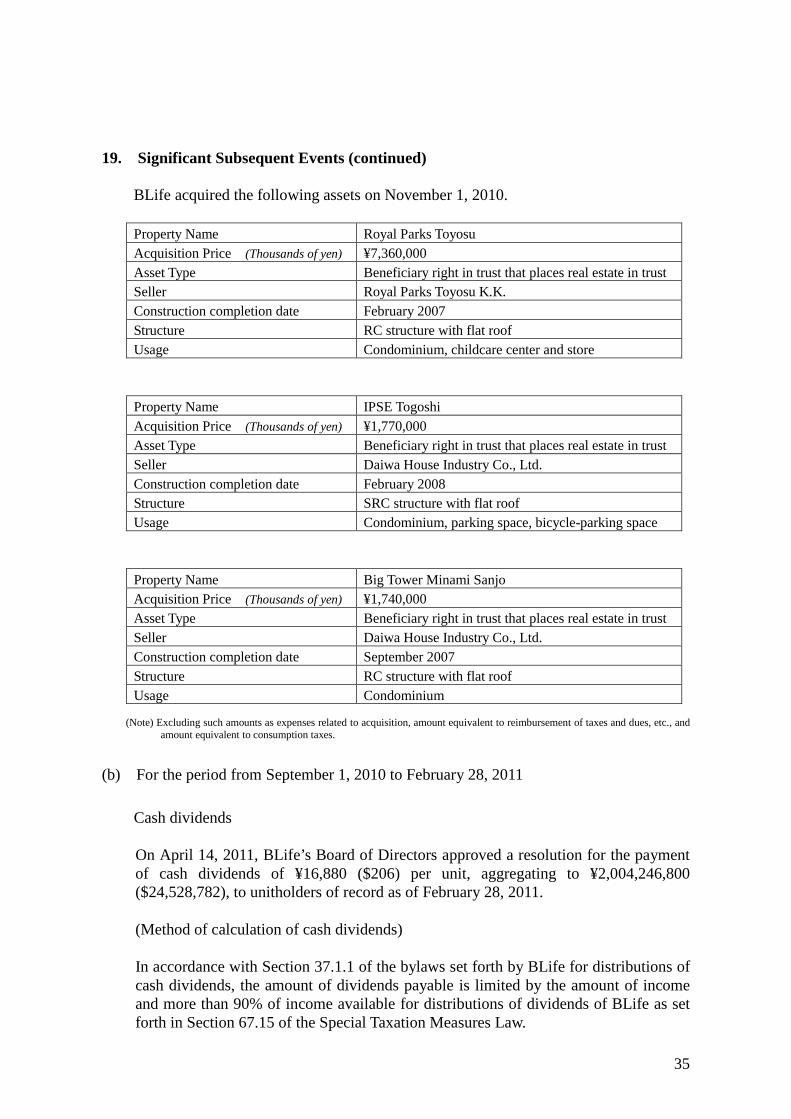
19. Significant Subsequent Events (continued)
BLife acquired the following assets on November 1, 2010. Property Name Royal Parks Toyosu Acquisition Price (Thousands of yen) ¥7,360,000 Asset Type Beneficiary right in trust that places real estate in trust Seller Royal Parks Toyosu K.K. Construction completion date February 2007 Structure RC structure with flat roof Usage Condominium, childcare center and store
Property Name IPSE Togoshi Acquisition Price (Thousands of yen) ¥1,770,000 Asset Type Beneficiary right in trust that places real estate in trust Seller Daiwa House Industry Co., Ltd. Construction completion date February 2008 Structure SRC structure with flat roof Usage Condominium, parking space, bicycle-parking space
Property Name Big Tower Minami Sanjo Acquisition Price (Thousands of yen) ¥1,740,000 Asset Type Beneficiary right in trust that places real estate in trust Seller Daiwa House Industry Co., Ltd. Construction completion date September 2007 Structure RC structure with flat roof Usage Condominium
(Note) Excluding such amounts as expenses related to acquisition, amount equivalent to reimbursement of taxes and dues, etc., and
amount equivalent to consumption taxes.
(b) For the period from September 1, 2010 to February 28, 2011
Cash dividends On April 14, 2011, BLife’s Board of Directors approved a resolution for the payment of cash dividends of ¥16,880 ($206) per unit, aggregating to ¥2,004,246,800 ($24,528,782), to unitholders of record as of February 28, 2011.
(Method of calculation of cash dividends) In accordance with Section 37.1.1 of the bylaws set forth by BLife for distributions of
cash dividends, the amount of dividends payable is limited by the amount of income and more than 90% of income available for distributions of dividends of BLife as set forth in Section 67.15 of the Special Taxation Measures Law.
36
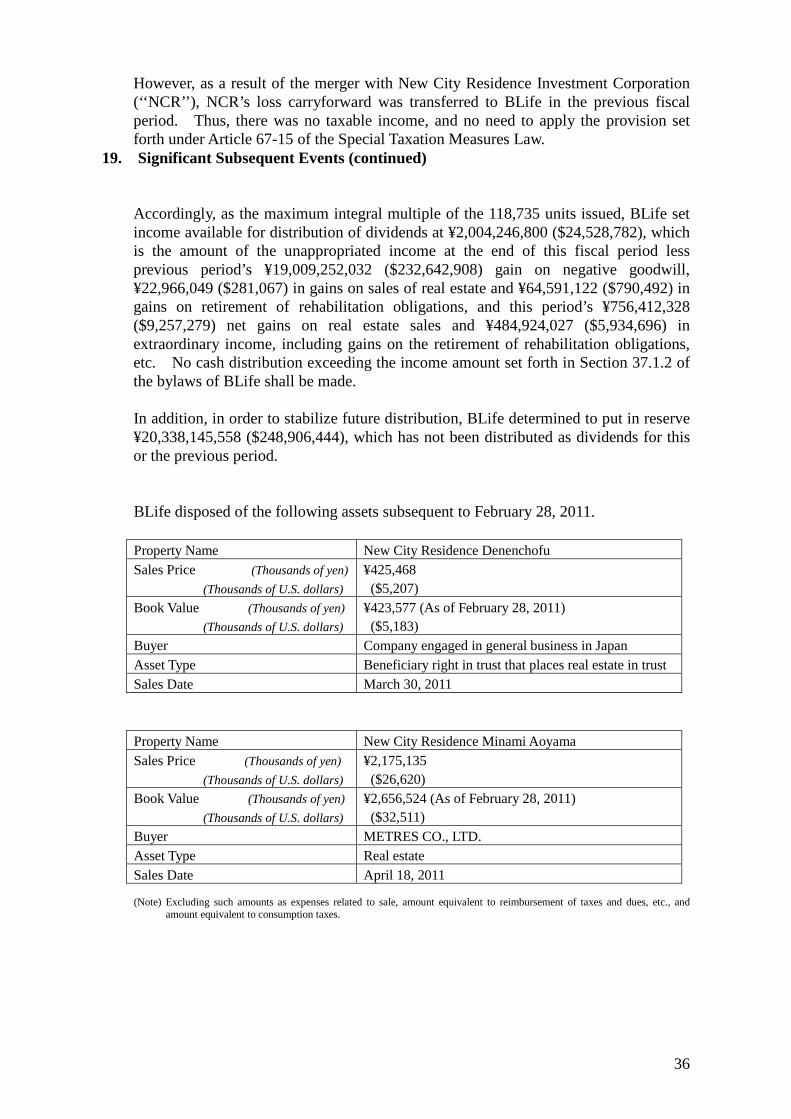
However, as a result of the merger with New City Residence Investment Corporation (‘‘NCR’’), NCR’s loss carryforward was transferred to BLife in the previous fiscal period. Thus, there was no taxable income, and no need to apply the provision set forth under Article 67-15 of the Special Taxation Measures Law.
19. Significant Subsequent Events (continued) Accordingly, as the maximum integral multiple of the 118,735 units issued, BLife set income available for distribution of dividends at ¥2,004,246,800 ($24,528,782), which is the amount of the unappropriated income at the end of this fiscal period less previous period’s ¥19,009,252,032 ($232,642,908) gain on negative goodwill, ¥22,966,049 ($281,067) in gains on sales of real estate and ¥64,591,122 ($790,492) in gains on retirement of rehabilitation obligations, and this period’s ¥756,412,328 ($9,257,279) net gains on real estate sales and ¥484,924,027 ($5,934,696) in extraordinary income, including gains on the retirement of rehabilitation obligations, etc. No cash distribution exceeding the income amount set forth in Section 37.1.2 of the bylaws of BLife shall be made. In addition, in order to stabilize future distribution, BLife determined to put in reserve ¥20,338,145,558 ($248,906,444), which has not been distributed as dividends for this or the previous period.
BLife disposed of the following assets subsequent to February 28, 2011. Property Name New City Residence Denenchofu Sales Price (Thousands of yen)
(Thousands of U.S. dollars) ¥425,468 ($5,207)
Book Value (Thousands of yen) (Thousands of U.S. dollars)
¥423,577 (As of February 28, 2011) ($5,183)
Buyer Company engaged in general business in Japan Asset Type Beneficiary right in trust that places real estate in trust Sales Date March 30, 2011 Property Name New City Residence Minami Aoyama Sales Price (Thousands of yen)
(Thousands of U.S. dollars) ¥2,175,135 ($26,620)
Book Value (Thousands of yen) (Thousands of U.S. dollars)
¥2,656,524 (As of February 28, 2011) ($32,511)
Buyer METRES CO., LTD. Asset Type Real estate Sales Date April 18, 2011 (Note) Excluding such amounts as expenses related to sale, amount equivalent to reimbursement of taxes and dues, etc., and
amount equivalent to consumption taxes.
37
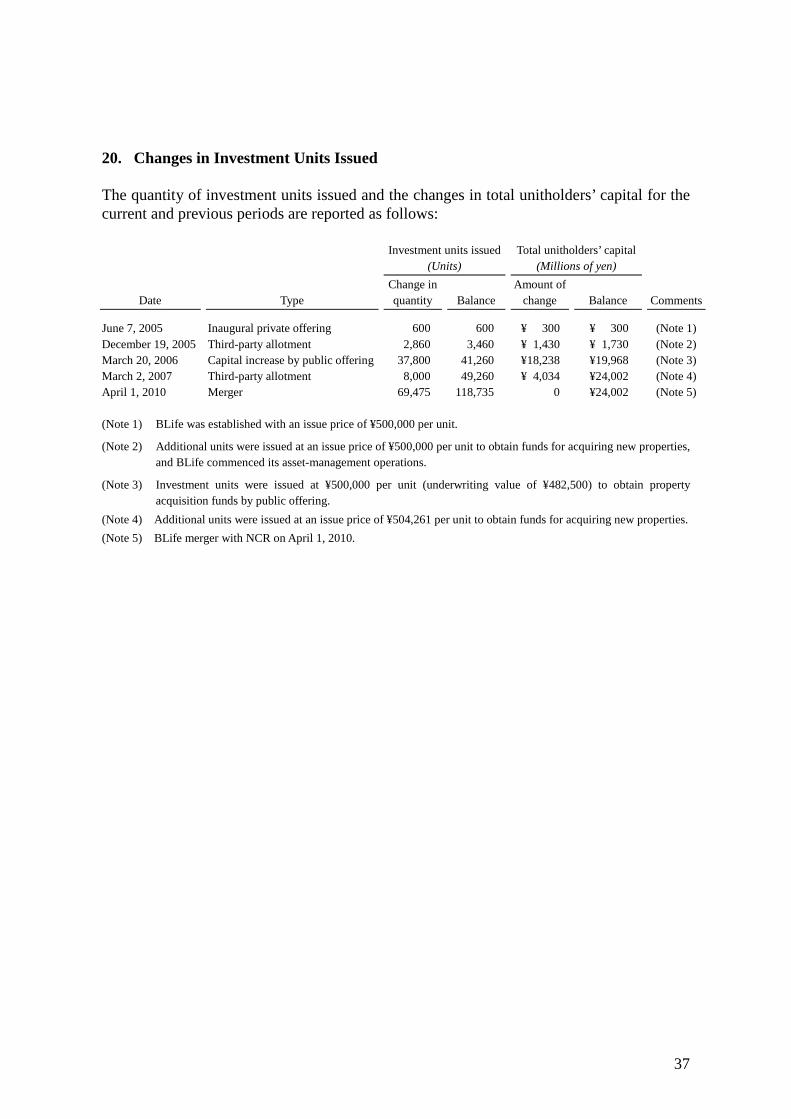
20. Changes in Investment Units Issued The quantity of investment units issued and the changes in total unitholders’ capital for the current and previous periods are reported as follows:
Investment units issued
(Units) Total unitholders’ capital
(Millions of yen)
Date Type Change in quantity Balance
Amount of change Balance Comments
June 7, 2005 Inaugural private offering 600 600 ¥ 300 ¥ 300 (Note 1) December 19, 2005 Third-party allotment 2,860 3,460 ¥ 1,430 ¥ 1,730 (Note 2) March 20, 2006 Capital increase by public offering 37,800 41,260 ¥18,238 ¥19,968 (Note 3) March 2, 2007 Third-party allotment 8,000 49,260 ¥ 4,034 ¥24,002 (Note 4) April 1, 2010 Merger 69,475 118,735 0 ¥24,002 (Note 5) (Note 1) BLife was established with an issue price of ¥500,000 per unit.
(Note 2) Additional units were issued at an issue price of ¥500,000 per unit to obtain funds for acquiring new properties, and BLife commenced its asset-management operations.
(Note 3) Investment units were issued at ¥500,000 per unit (underwriting value of ¥482,500) to obtain property acquisition funds by public offering.
(Note 4) Additional units were issued at an issue price of ¥504,261 per unit to obtain funds for acquiring new properties. (Note 5) BLife merger with NCR on April 1, 2010.
38
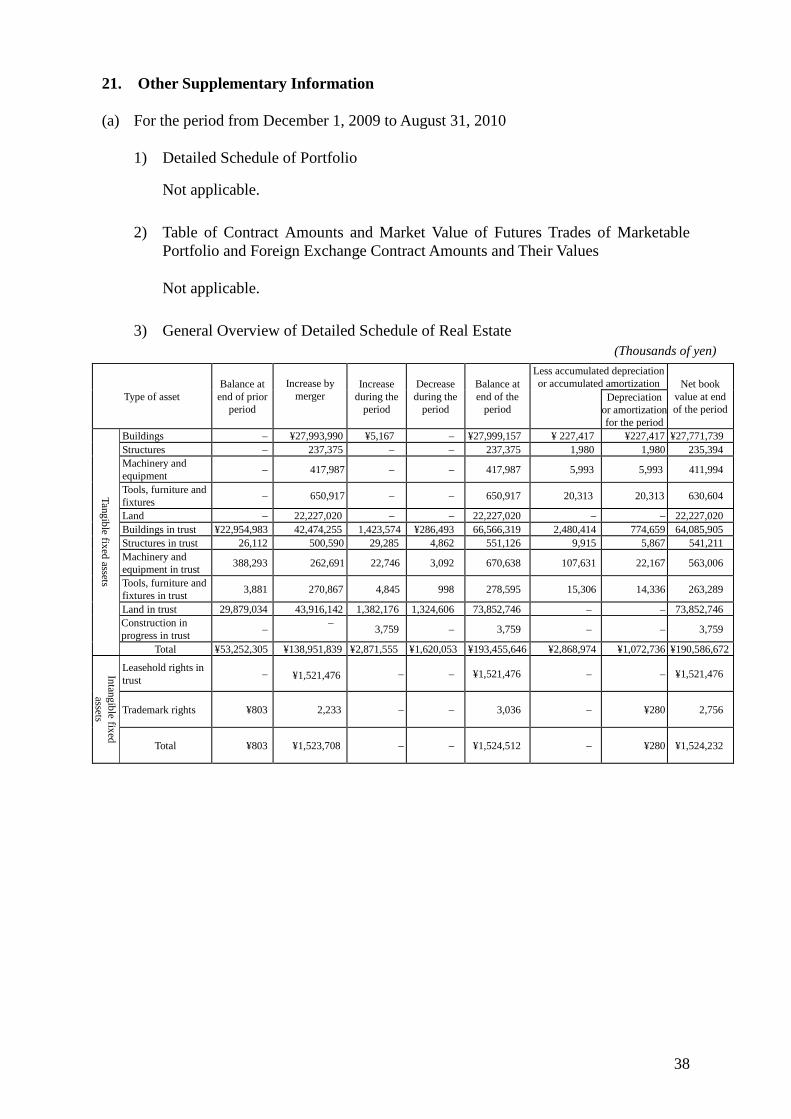
21. Other Supplementary Information (a) For the period from December 1, 2009 to August 31, 2010
1) Detailed Schedule of Portfolio Not applicable. 2) Table of Contract Amounts and Market Value of Futures Trades of Marketable
Portfolio and Foreign Exchange Contract Amounts and Their Values
Not applicable. 3) General Overview of Detailed Schedule of Real Estate
(Thousands of yen)
Type of asset Balance at
end of prior period
Increase by
merger Increase
during the period
Decrease during the
period
Balance at end of the
period
Less accumulated depreciation or accumulated amortization Net book
value at end of the period
Depreciation or amortization for the period
Tangible fixed assets
Buildings – ¥27,993,990 ¥5,167 – ¥27,999,157 ¥ 227,417 ¥227,417 ¥27,771,739 Structures – 237,375 – – 237,375 1,980 1,980 235,394 Machinery and equipment – 417,987 – – 417,987 5,993 5,993 411,994
Tools, furniture and fixtures – 650,917 – – 650,917 20,313 20,313 630,604
Land – 22,227,020 – – 22,227,020 – – 22,227,020 Buildings in trust ¥22,954,983 42,474,255 1,423,574 ¥286,493 66,566,319 2,480,414 774,659 64,085,905 Structures in trust 26,112 500,590 29,285 4,862 551,126 9,915 5,867 541,211 Machinery and equipment in trust 388,293 262,691 22,746 3,092 670,638 107,631 22,167 563,006
Tools, furniture and fixtures in trust 3,881 270,867 4,845 998 278,595 15,306 14,336 263,289
Land in trust 29,879,034 43,916,142 1,382,176 1,324,606 73,852,746 – – 73,852,746 Construction in progress in trust – – 3,759 – 3,759 – – 3,759
Total ¥53,252,305 ¥138,951,839 ¥2,871,555 ¥1,620,053 ¥193,455,646 ¥2,868,974 ¥1,072,736 ¥190,586,672
Intangible fixed assets
Leasehold rights in trust –
¥1,521,476 – – ¥1,521,476 – – ¥1,521,476
Trademark rights ¥803 2,233 – – 3,036 – ¥280 2,756
Total ¥803 ¥1,523,708 – – ¥1,524,512 – ¥280 ¥1,524,232
39
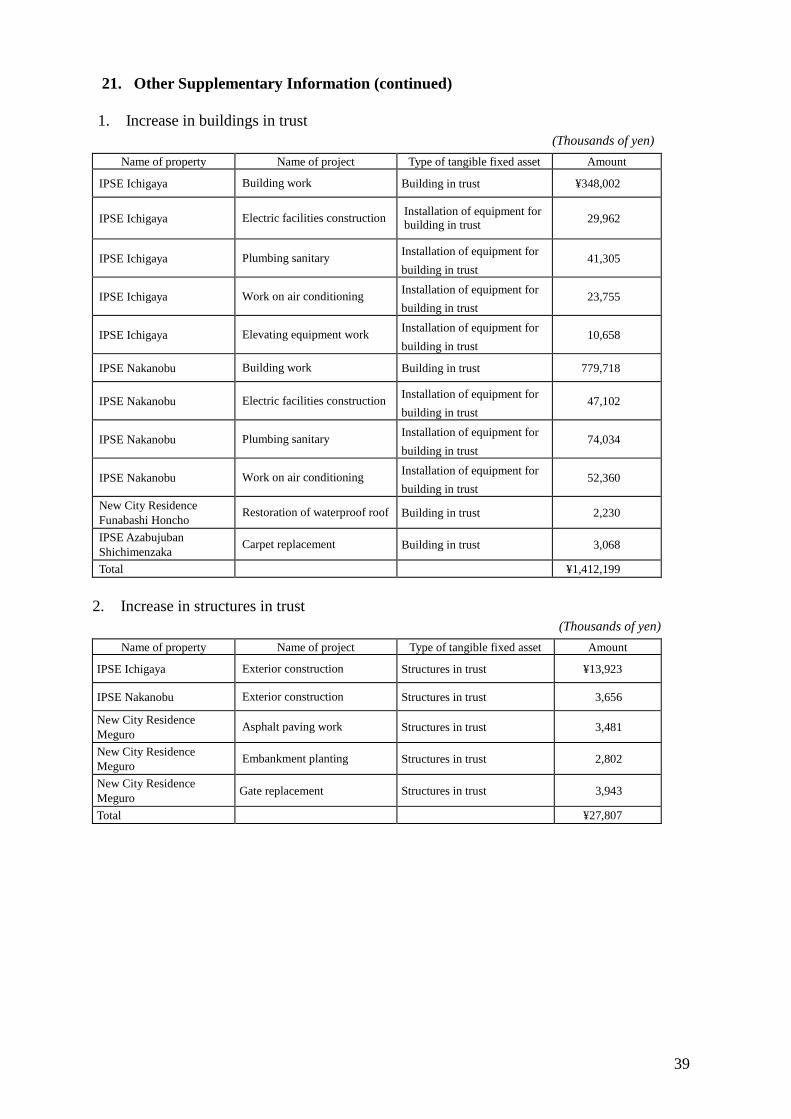
21. Other Supplementary Information (continued)
1. Increase in buildings in trust (Thousands of yen)
Name of property Name of project Type of tangible fixed asset Amount
IPSE Ichigaya Building work Building in trust ¥348,002
IPSE Ichigaya Electric facilities construction Installation of equipment for building in trust 29,962
IPSE Ichigaya Plumbing sanitary Installation of equipment for building in trust
41,305
IPSE Ichigaya Work on air conditioning Installation of equipment for building in trust
23,755
IPSE Ichigaya Elevating equipment work Installation of equipment for building in trust
10,658
IPSE Nakanobu Building work Building in trust 779,718
IPSE Nakanobu Electric facilities construction Installation of equipment for building in trust
47,102
IPSE Nakanobu Plumbing sanitary Installation of equipment for building in trust
74,034
IPSE Nakanobu Work on air conditioning Installation of equipment for building in trust
52,360
New City Residence Funabashi Honcho Restoration of waterproof roof Building in trust 2,230
IPSE Azabujuban Shichimenzaka Carpet replacement Building in trust 3,068
Total ¥1,412,199
2. Increase in structures in trust
(Thousands of yen) Name of property Name of project Type of tangible fixed asset Amount
IPSE Ichigaya Exterior construction Structures in trust ¥13,923
IPSE Nakanobu Exterior construction Structures in trust 3,656
New City Residence Meguro Asphalt paving work Structures in trust 3,481
New City Residence Meguro Embankment planting Structures in trust 2,802
New City Residence Meguro Gate replacement Structures in trust 3,943
Total ¥27,807
40
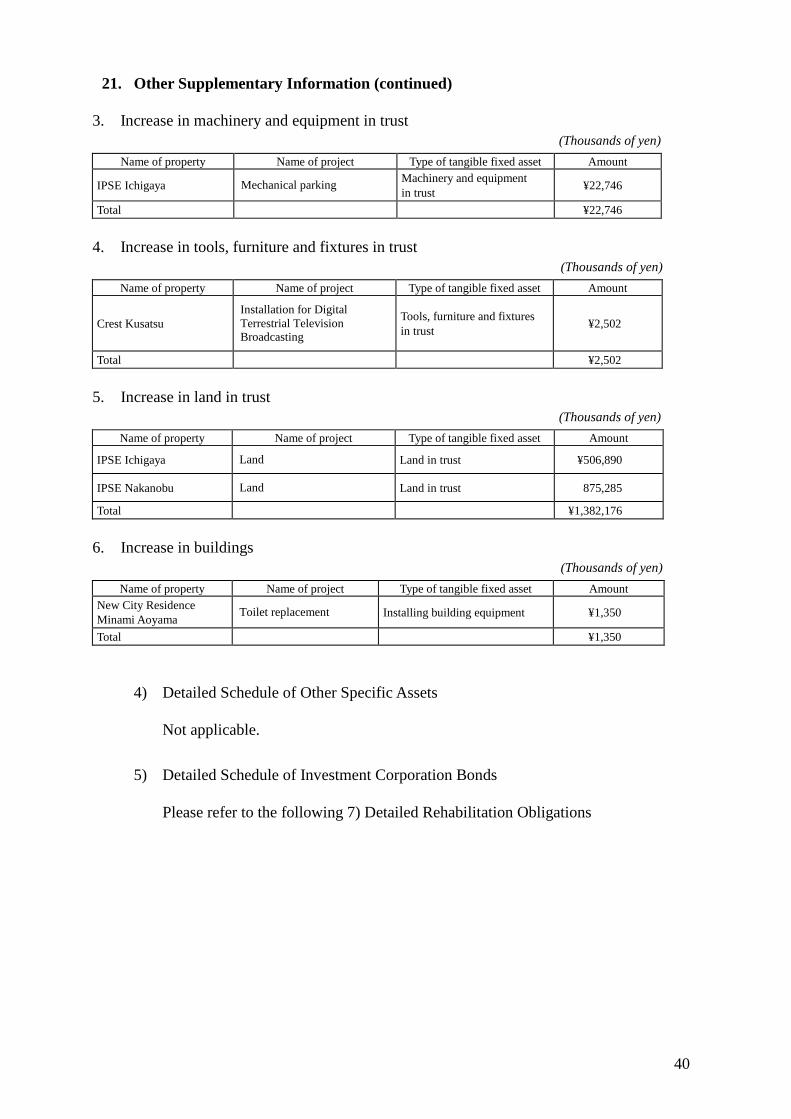
21. Other Supplementary Information (continued)
3. Increase in machinery and equipment in trust (Thousands of yen)
Name of property Name of project Type of tangible fixed asset Amount
IPSE Ichigaya Mechanical parking Machinery and equipment in trust ¥22,746
Total ¥22,746
4. Increase in tools, furniture and fixtures in trust (Thousands of yen)
Name of property Name of project Type of tangible fixed asset Amount
Crest Kusatsu Installation for Digital Terrestrial Television Broadcasting
Tools, furniture and fixtures in trust ¥2,502
Total ¥2,502
5. Increase in land in trust (Thousands of yen)
Name of property Name of project Type of tangible fixed asset Amount
IPSE Ichigaya Land Land in trust ¥506,890
IPSE Nakanobu Land Land in trust 875,285
Total ¥1,382,176
6. Increase in buildings (Thousands of yen)
Name of property Name of project Type of tangible fixed asset Amount New City Residence Minami Aoyama Toilet replacement Installing building equipment ¥1,350
Total ¥1,350
4) Detailed Schedule of Other Specific Assets Not applicable.
5) Detailed Schedule of Investment Corporation Bonds Please refer to the following 7) Detailed Rehabilitation Obligations

41
21. Other Supplementary Information (continued)
6) Detailed Schedule of Loans
Classification Balance at end of prior
period (Thousands of
yen)
Increase during the
period (Thousands of
yen)
Decrease during the
period (Thousands of
yen)
Balance at end of the
period (Thousands of
yen)
Average interest
rate (Note 1)
Repayment deadline
Purpose of use Comments
Lender
Current portion of long-term
loans
Sumitomo Mitsui Banking Corporation ¥4,228,000 – ¥4,228,000 –
1.18% March 31, 2010 (Note 2)
Secured without
warranty The Chuo Mitsui Trust and Banking Co., Ltd. 4,228,000 – 4,228,000 –
Mizuho Bank, Ltd. 4,228,000 – 4,228,000 – Sumitomo Mitsui Banking Corporation 27,800 ¥20,850 20,850 ¥27,800
1.55% September 30, 2011 (Note 2)
Secured without
warranty
The Chuo Mitsui Trust and Banking Co., Ltd. 27,800 20,850 20,850 27,800
Mizuho Bank, Ltd. 27,800 20,850 20,850 27,800 The Bank of Tokyo-Mitsubishi UFJ, Ltd.
21,720 16,290 16,290 21,720
The Sumitomo Trust and Banking Co., Ltd. 10,880 8,160 8,160 10,880
Sumitomo Mitsui Banking Corporation – 32,300 6,460 25,840
1.42% July 31, 2012 (Note 2)
Secured without
warranty
The Chuo Mitsui Trust and Banking Co., Ltd. – 32,300 6,460 25,840
Mizuho Bank, Ltd. – 32,300 6,460 25,840 The Bank of Tokyo-Mitsubishi UFJ, Ltd.
– 18,100 3,620 14,480
Subtotal 12,800,000 202,000 12,794,000 208,000 – – – –
Long-term loans
Sumitomo Mitsui Banking Corporation 3,802,200 – 20,850 3,781,350
1.55% September 30, 2011 (Note 2)
Secured without warranty
The Chuo Mitsui Trust and Banking Co., Ltd.
3,802,200 – 20,850 3,781,350
Mizuho Bank, Ltd. 3,802,200 – 20,850 3,781,350 The Bank of Tokyo-Mitsubishi UFJ, Ltd.
2,978,280 – 16,290 2,961,990
The Sumitomo Trust and Banking Co., Ltd.
1,489,120 – 8,160 1,480,960
Sumitomo Mitsui Banking Corporation – 3,560,000 32,300 3,527,700
1.42% July 31, 2012 (Note 2)
Secured without warranty
The Chuo Mitsui Trust and Banking Co., Ltd.
– 3,560,000 32,300 3,527,700
Mizuho Bank, Ltd. – 3,560,000 32,300 3,527,700 The Bank of Tokyo-Mitsubishi UFJ, Ltd.
– 2,000,000 18,100 1,981,900
Subtotal 15,874,000 12,680,000 202,000 28,352,000 – – – – Total ¥28,674,000 ¥12,882,000 ¥12,996,000 ¥28,560,000 – – – –
(Note 1) Average interest rates are loan interest rates (weighted average during the applicable term) of the corresponding lenders, and are rounded off to the nearest second decimal place.
(Note 2) To be used as acquisition funds for real estate properties in trust, or to refinance such funds.
(Note 3) Scheduled payment per year for long-term loans within a period of 5 years from the end of the fiscal period is as follows:
(Thousands of yen)
Classification 1 to 2 years 2 to 3 years 3 to 4 years 4 to 5 years
Long-term loans 28,352,000 – – –

42
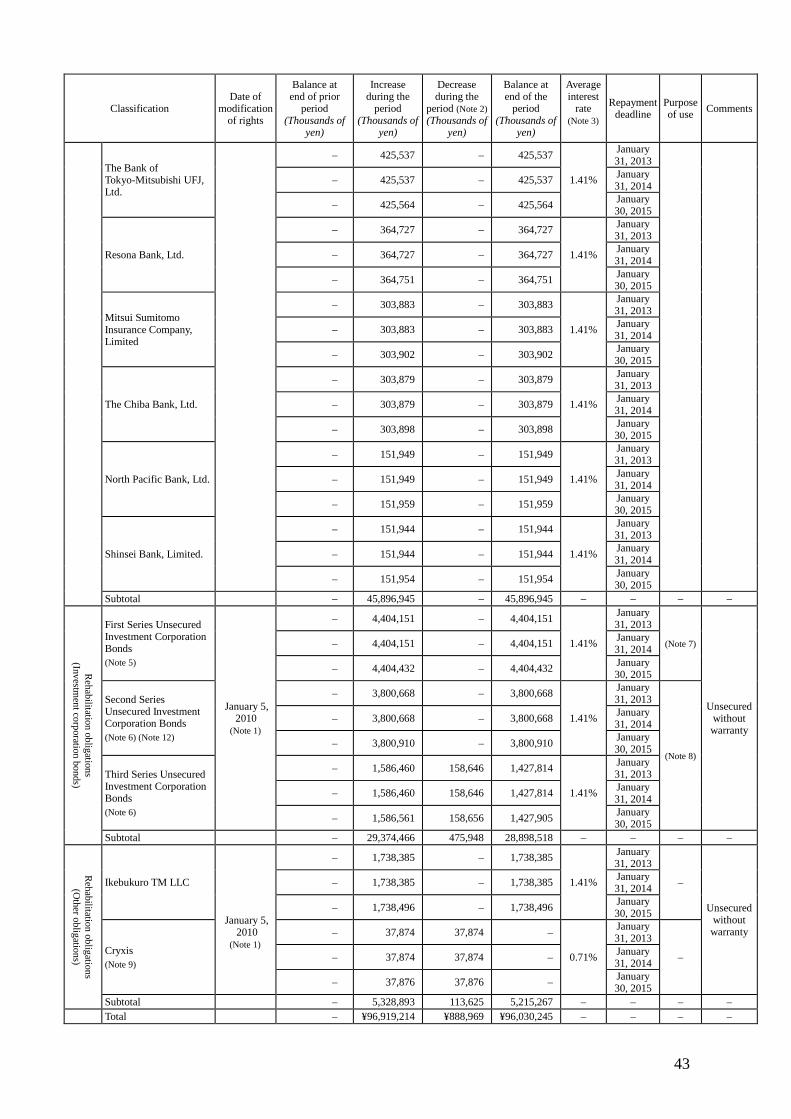
21. Other Supplementary Information (continued) 7) Detailed Schedule of Rehabilitation Obligations
Classification Date of
modification of rights
Balance at end of prior
period (Thousands of
yen)
Increase during the
period (Thousands of
yen)
Decrease during the
period (Note 2) (Thousands of
yen)
Balance at end of the
period (Thousands of
yen)
Average interest
rate (Note 3)
Repayment deadline
Purpose of use Comments
Rehabilitation obligations w
ith right of separate satisfaction
The Chuo Mitsui Trust and Banking Co., Ltd.
January 5, 2010
(Note 1)
– ¥4,381,929 ¥80,393 ¥4,301,536
1.51% January 31, 2012 (Note 4)
Secured without warranty
Aozora Bank, Ltd. – 4,306,378 79,007 4,227,371 The Sumitomo Trust and Banking Co., Ltd. – 2,342,065 42,968 2,299,096
Mitsubishi UFJ Trust and Banking Corporation
– 2,266,515 41,582 2,224,932
Resona Bank, Ltd. – 2,266,515 41,582 2,224,932 The Hyakugo Bank – 755,505 13,860 741,644 Subtotal – 16,318,908 299,395 16,019,513 – – – –
Rehabilitation obligations (Loans)
The Norinchukin Bank
January 5, 2010
(Note 1)
– 3,039,055 – 3,039,055
1.41%
January 31, 2013
(Note 4) Unsecured
without warranty
– 3,039,055 – 3,039,055 January 31, 2014
– 3,039,249 – 3,039,249 January 30, 2015
Aozora Bank, Ltd.
– 2,353,146 – 2,353,146
1.41%
January 31, 2013
– 2,353,146 – 2,353,146 January 31, 2014
– 2,353,296 – 2,353,296 January 30, 2015
The Chuo Mitsui Trust and Banking Co., Ltd.
– 2,124,156 – 2,124,156
1.41%
January 31, 2013
– 2,124,156 – 2,124,156 January 31, 2014
– 2,124,291 – 2,124,291 January 30, 2015
Sumitomo Mitsui Banking Corporation
– 1,883,861 – 1,883,861
1.41%
January 31, 2013
– 1,883,861 – 1,883,861 January 31, 2014
– 1,883,981 – 1,883,981 January 30, 2015
Mizuho Bank, Ltd.
– 1,215,486 – 1,215,486
1.41%
January 31, 2013
– 1,215,486 – 1,215,486 January 31, 2014
– 1,215,563 – 1,215,563 January 30, 2015
The Sumitomo Trust and Banking Co., Ltd.
– 1,093,835 – 1,093,835
1.41%
January 31, 2013
– 1,093,835 – 1,093,835 January 31, 2014
– 1,093,905 – 1,093,905 January 30, 2015
Mizuho Trust & Banking Co., Ltd.
– 914,707 – 914,707
1.41%
January 31, 2013
– 914,707 – 914,707 January 31, 2014
– 914,765 – 914,765 January 30, 2015
Development Bank of Japan Inc.
– 516,666 – 516,666
1.41%
January 31, 2013
– 516,666 – 516,666 January 31, 2014
– 516,699 – 516,699 January 30, 2015
Mitsubishi UFJ Trust and Banking Corporation
– 455,817 – 455,817
1.41%
January 31, 2013
– 455,817 – 455,817 January 31, 2014
– 455,846 – 455,846 January 30, 2015
43
Classification Date of
modification of rights
Balance at end of prior
period (Thousands of
yen)
Increase during the
period (Thousands of
yen)
Decrease during the
period (Note 2) (Thousands of
yen)
Balance at end of the
period (Thousands of
yen)
Average interest
rate (Note 3)
Repayment deadline
Purpose of use Comments
The Bank of Tokyo-Mitsubishi UFJ, Ltd.
– 425,537 – 425,537
1.41%
January 31, 2013
– 425,537 – 425,537 January 31, 2014
– 425,564 – 425,564 January 30, 2015
Resona Bank, Ltd.
– 364,727 – 364,727
1.41%
January 31, 2013
– 364,727 – 364,727 January 31, 2014
– 364,751 – 364,751 January 30, 2015
Mitsui Sumitomo Insurance Company, Limited
– 303,883 – 303,883
1.41%
January 31, 2013
– 303,883 – 303,883 January 31, 2014
– 303,902 – 303,902 January 30, 2015
The Chiba Bank, Ltd.
– 303,879 – 303,879
1.41%
January 31, 2013
– 303,879 – 303,879 January 31, 2014
– 303,898 – 303,898 January 30, 2015
North Pacific Bank, Ltd.
– 151,949 – 151,949
1.41%
January 31, 2013
– 151,949 – 151,949 January 31, 2014
– 151,959 – 151,959 January 30, 2015
Shinsei Bank, Limited.
– 151,944 – 151,944
1.41%
January 31, 2013
– 151,944 – 151,944 January 31, 2014
– 151,954 – 151,954 January 30, 2015
Subtotal – 45,896,945 – 45,896,945 – – – –
Rehabilitation obligations
(Investment corporation bonds)
First Series Unsecured Investment Corporation Bonds (Note 5)
January 5, 2010
(Note 1)
– 4,404,151 – 4,404,151
1.41%
January 31, 2013
(Note 7)
Unsecured without warranty
– 4,404,151 – 4,404,151 January 31, 2014
– 4,404,432 – 4,404,432 January 30, 2015
Second Series Unsecured Investment Corporation Bonds (Note 6) (Note 12)
– 3,800,668 – 3,800,668
1.41%
January 31, 2013
(Note 8)
– 3,800,668 – 3,800,668 January 31, 2014
– 3,800,910 – 3,800,910 January 30, 2015
Third Series Unsecured Investment Corporation Bonds (Note 6)
– 1,586,460 158,646 1,427,814
1.41%
January 31, 2013
– 1,586,460 158,646 1,427,814 January 31, 2014
– 1,586,561 158,656 1,427,905 January 30, 2015
Subtotal – 29,374,466 475,948 28,898,518 – – – –
Rehabilitation obligations
(Other obligations)
Ikebukuro TM LLC
January 5, 2010
(Note 1)
– 1,738,385 – 1,738,385
1.41%
January 31, 2013
–
Unsecured without warranty
– 1,738,385 – 1,738,385 January 31, 2014
– 1,738,496 – 1,738,496 January 30, 2015
Cryxis (Note 9)
– 37,874 37,874 –
0.71%
January 31, 2013
– – 37,874 37,874 – January 31, 2014
– 37,876 37,876 – January 30, 2015
Subtotal – 5,328,893 113,625 5,215,267 – – – – Total – ¥96,919,214 ¥888,969 ¥96,030,245 – – – –
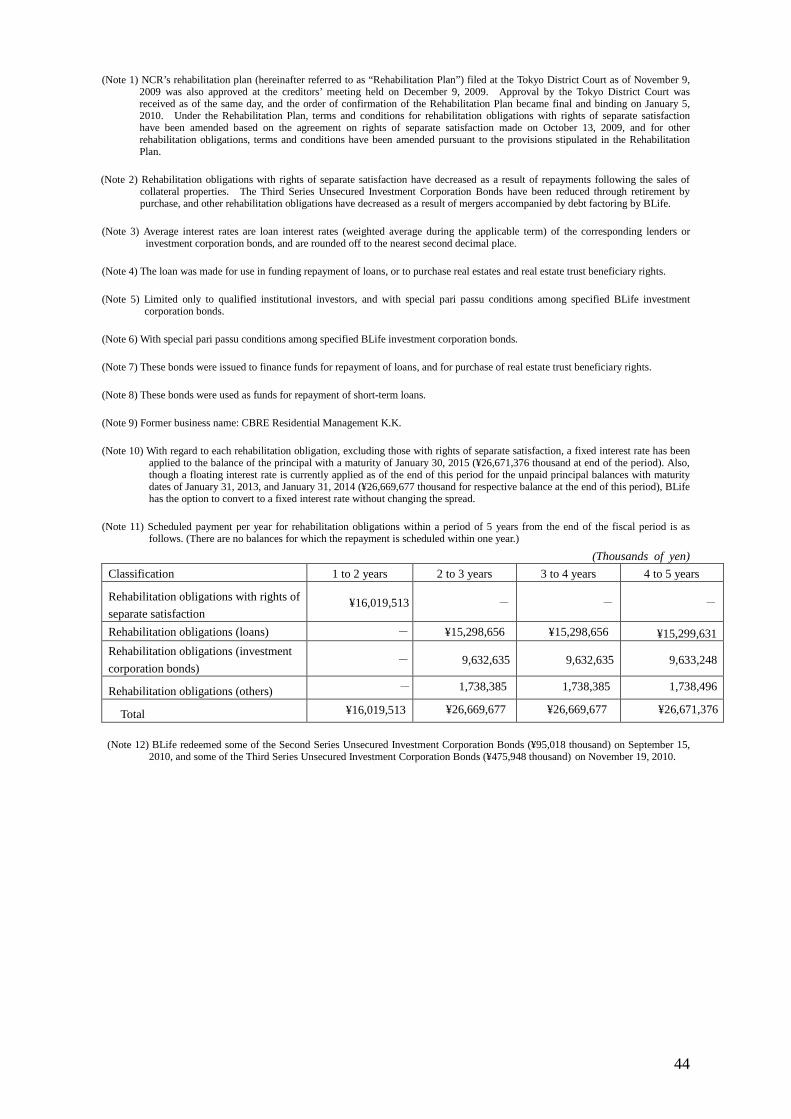
44
(Note 1) NCR’s rehabilitation plan (hereinafter referred to as “Rehabilitation Plan”) filed at the Tokyo District Court as of November 9, 2009 was also approved at the creditors’ meeting held on December 9, 2009. Approval by the Tokyo District Court was received as of the same day, and the order of confirmation of the Rehabilitation Plan became final and binding on January 5, 2010. Under the Rehabilitation Plan, terms and conditions for rehabilitation obligations with rights of separate satisfaction have been amended based on the agreement on rights of separate satisfaction made on October 13, 2009, and for other rehabilitation obligations, terms and conditions have been amended pursuant to the provisions stipulated in the Rehabilitation Plan.
(Note 2) Rehabilitation obligations with rights of separate satisfaction have decreased as a result of repayments following the sales of collateral properties. The Third Series Unsecured Investment Corporation Bonds have been reduced through retirement by purchase, and other rehabilitation obligations have decreased as a result of mergers accompanied by debt factoring by BLife.
(Note 3) Average interest rates are loan interest rates (weighted average during the applicable term) of the corresponding lenders or investment corporation bonds, and are rounded off to the nearest second decimal place.
(Note 4) The loan was made for use in funding repayment of loans, or to purchase real estates and real estate trust beneficiary rights.
(Note 5) Limited only to qualified institutional investors, and with special pari passu conditions among specified BLife investment corporation bonds.
(Note 6) With special pari passu conditions among specified BLife investment corporation bonds.
(Note 7) These bonds were issued to finance funds for repayment of loans, and for purchase of real estate trust beneficiary rights.
(Note 8) These bonds were used as funds for repayment of short-term loans.
(Note 9) Former business name: CBRE Residential Management K.K.
(Note 10) With regard to each rehabilitation obligation, excluding those with rights of separate satisfaction, a fixed interest rate has been applied to the balance of the principal with a maturity of January 30, 2015 (¥26,671,376 thousand at end of the period). Also, though a floating interest rate is currently applied as of the end of this period for the unpaid principal balances with maturity dates of January 31, 2013, and January 31, 2014 (¥26,669,677 thousand for respective balance at the end of this period), BLife has the option to convert to a fixed interest rate without changing the spread.
(Note 11) Scheduled payment per year for rehabilitation obligations within a period of 5 years from the end of the fiscal period is as follows. (There are no balances for which the repayment is scheduled within one year.)
(Thousands of yen) Classification 1 to 2 years 2 to 3 years 3 to 4 years 4 to 5 years
Rehabilitation obligations with rights of separate satisfaction
¥16,019,513 - - -
Rehabilitation obligations (loans) - ¥15,298,656 ¥15,298,656 ¥15,299,631 Rehabilitation obligations (investment corporation bonds)
- 9,632,635 9,632,635 9,633,248
Rehabilitation obligations (others) - 1,738,385 1,738,385 1,738,496
Total ¥16,019,513 ¥26,669,677 ¥26,669,677 ¥26,671,376
(Note 12) BLife redeemed some of the Second Series Unsecured Investment Corporation Bonds (¥95,018 thousand) on September 15, 2010, and some of the Third Series Unsecured Investment Corporation Bonds (¥475,948 thousand) on November 19, 2010.
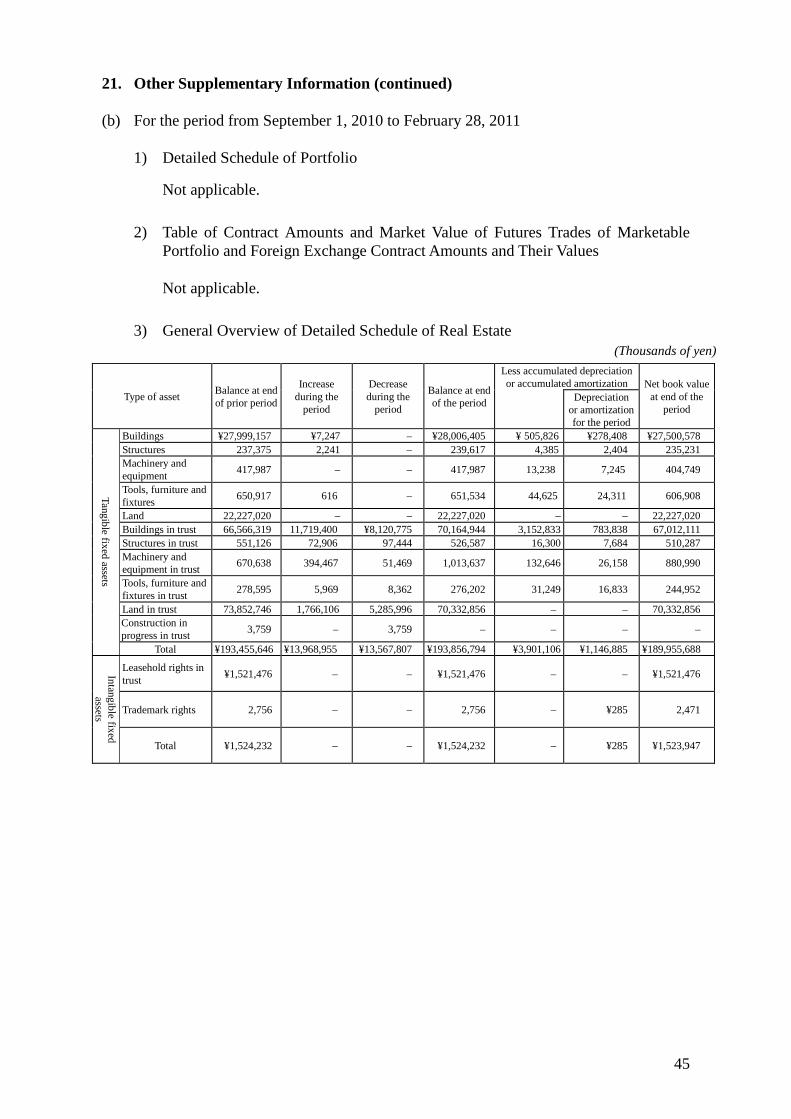
45
21. Other Supplementary Information (continued) (b) For the period from September 1, 2010 to February 28, 2011
1) Detailed Schedule of Portfolio Not applicable. 2) Table of Contract Amounts and Market Value of Futures Trades of Marketable
Portfolio and Foreign Exchange Contract Amounts and Their Values
Not applicable. 3) General Overview of Detailed Schedule of Real Estate
(Thousands of yen)
Type of asset Balance at end of prior period
Increase during the
period
Decrease during the
period
Balance at end of the period
Less accumulated depreciation or accumulated amortization Net book value
at end of the period
Depreciation or amortization for the period
Tangible fixed assets
Buildings ¥27,999,157 ¥7,247 – ¥28,006,405 ¥ 505,826 ¥278,408 ¥27,500,578 Structures 237,375 2,241 – 239,617 4,385 2,404 235,231 Machinery and equipment 417,987 – – 417,987 13,238 7,245 404,749
Tools, furniture and fixtures 650,917 616 – 651,534 44,625 24,311 606,908
Land 22,227,020 – – 22,227,020 – – 22,227,020 Buildings in trust 66,566,319 11,719,400 ¥8,120,775 70,164,944 3,152,833 783,838 67,012,111 Structures in trust 551,126 72,906 97,444 526,587 16,300 7,684 510,287 Machinery and equipment in trust 670,638 394,467 51,469 1,013,637 132,646 26,158 880,990
Tools, furniture and fixtures in trust 278,595 5,969 8,362 276,202 31,249 16,833 244,952
Land in trust 73,852,746 1,766,106 5,285,996 70,332,856 – – 70,332,856 Construction in progress in trust 3,759 – 3,759 – – – –
Total ¥193,455,646 ¥13,968,955 ¥13,567,807 ¥193,856,794 ¥3,901,106 ¥1,146,885 ¥189,955,688
Intangible fixed assets
Leasehold rights in trust ¥1,521,476 – – ¥1,521,476 – – ¥1,521,476
Trademark rights 2,756 – – 2,756 – ¥285 2,471
Total ¥1,524,232 – – ¥1,524,232 – ¥285 ¥1,523,947
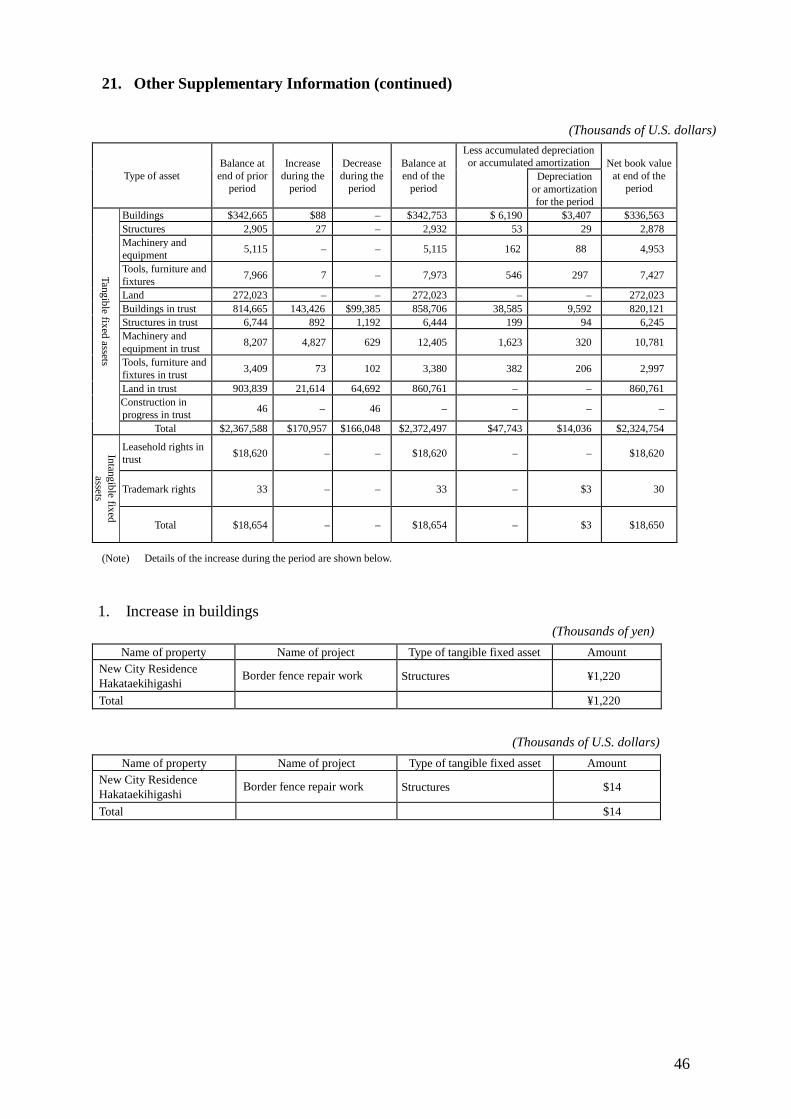
46
21. Other Supplementary Information (continued)
(Thousands of U.S. dollars)
Type of asset Balance at
end of prior period
Increase during the
period
Decrease during the
period
Balance at end of the
period
Less accumulated depreciation or accumulated amortization Net book value
at end of the period
Depreciation or amortization for the period
Tangible fixed assets
Buildings $342,665 $88 – $342,753 $ 6,190 $3,407 $336,563 Structures 2,905 27 – 2,932 53 29 2,878 Machinery and equipment 5,115 – – 5,115 162 88 4,953
Tools, furniture and fixtures 7,966 7 – 7,973 546 297 7,427
Land 272,023 – – 272,023 – – 272,023 Buildings in trust 814,665 143,426 $99,385 858,706 38,585 9,592 820,121 Structures in trust 6,744 892 1,192 6,444 199 94 6,245 Machinery and equipment in trust 8,207 4,827 629 12,405 1,623 320 10,781
Tools, furniture and fixtures in trust 3,409 73 102 3,380 382 206 2,997
Land in trust 903,839 21,614 64,692 860,761 – – 860,761 Construction in progress in trust 46 – 46 – – – –
Total $2,367,588 $170,957 $166,048 $2,372,497 $47,743 $14,036 $2,324,754
Intangible fixed assets
Leasehold rights in trust $18,620 – – $18,620 – – $18,620
Trademark rights 33 – – 33 – $3 30
Total $18,654 – – $18,654 – $3 $18,650
(Note) Details of the increase during the period are shown below.
1. Increase in buildings (Thousands of yen)
Name of property Name of project Type of tangible fixed asset Amount New City Residence Hakataekihigashi Border fence repair work Structures ¥1,220
Total ¥1,220
(Thousands of U.S. dollars)
Name of property Name of project Type of tangible fixed asset Amount New City Residence Hakataekihigashi Border fence repair work Structures $14
Total $14

47
21. Other Supplementary Information (continued)
2. Increase in buildings in trust (Thousands of yen)
Name of property Name of project Type of tangible fixed asset Amount
Royal Parks Toyosu Building work Building in trust ¥6,431,215
Royal Parks Toyosu Electric facilities construction Installation of equipment for building in trust 417,854
Royal Parks Toyosu Plumbing sanitary Installation of equipment for building in trust
378,760
Royal Parks Toyosu Work on air conditioning Installation of equipment for building in trust
219,473
IPSE Togoshi Building work Building in trust 830,072
IPSE Togoshi Electric facilities construction Installation of equipment for building in trust 58,791
IPSE Togoshi Plumbing sanitary Installation of equipment for building in trust
103,207
IPSE Togoshi Work on air conditioning Installation of equipment for building in trust
43,424
Big Tower Minami Sanjo Building work Building in trust 895,955
Big Tower Minami Sanjo Electric facilities construction Installation of equipment for building in trust 185,351
Big Tower Minami Sanjo Plumbing sanitary Installation of equipment for building in trust
199,470
Big Tower Minami Sanjo Work on air conditioning Installation of equipment for building in trust
102,328
Lexington Square Fushimi Building work Building in trust 1,183,449
Lexington Square Fushimi Electric facilities construction Installation of equipment for building in trust 116,014
Lexington Square Fushimi Plumbing sanitary Installation of equipment for building in trust
131,563
Lexington Square Fushimi Work on air conditioning Installation of equipment for building in trust
65,722
Total ¥11,362,648
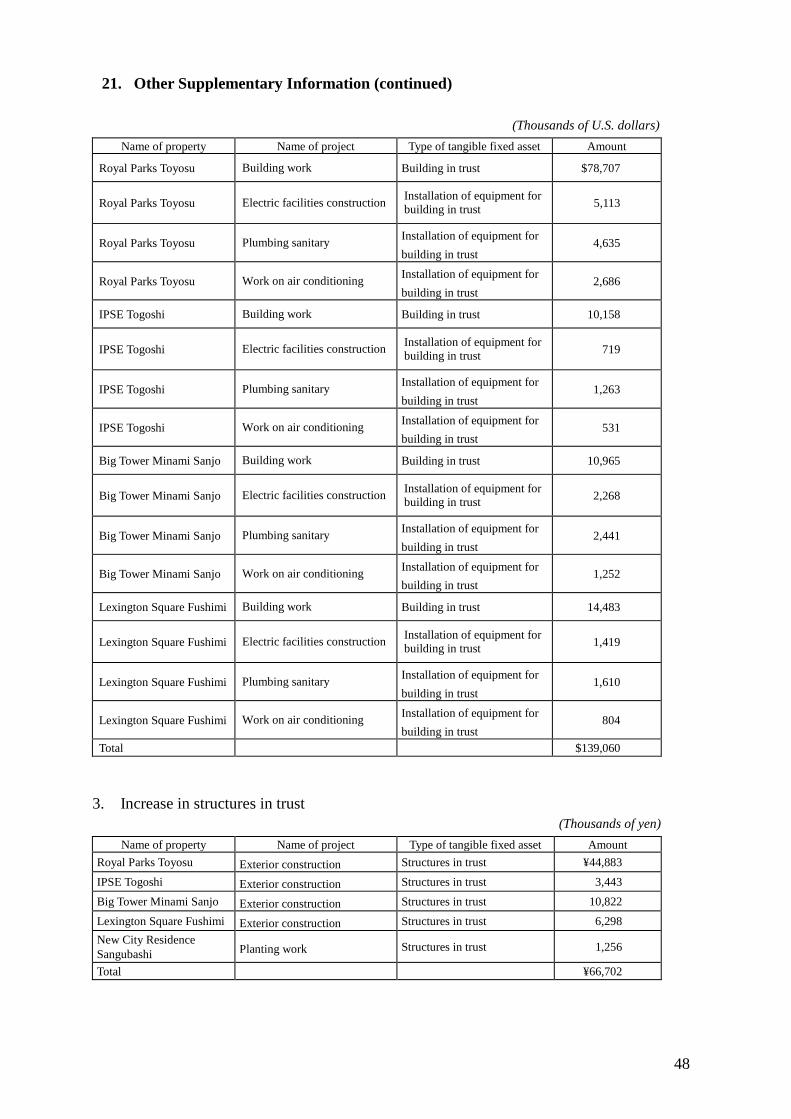
48
21. Other Supplementary Information (continued)
(Thousands of U.S. dollars) Name of property Name of project Type of tangible fixed asset Amount
Royal Parks Toyosu Building work Building in trust $78,707
Royal Parks Toyosu Electric facilities construction Installation of equipment for building in trust 5,113
Royal Parks Toyosu Plumbing sanitary Installation of equipment for building in trust
4,635
Royal Parks Toyosu Work on air conditioning Installation of equipment for building in trust
2,686
IPSE Togoshi Building work Building in trust 10,158
IPSE Togoshi Electric facilities construction Installation of equipment for building in trust 719
IPSE Togoshi Plumbing sanitary Installation of equipment for building in trust
1,263
IPSE Togoshi Work on air conditioning Installation of equipment for building in trust
531
Big Tower Minami Sanjo Building work Building in trust 10,965
Big Tower Minami Sanjo Electric facilities construction Installation of equipment for building in trust 2,268
Big Tower Minami Sanjo Plumbing sanitary Installation of equipment for building in trust
2,441
Big Tower Minami Sanjo Work on air conditioning Installation of equipment for building in trust
1,252
Lexington Square Fushimi Building work Building in trust 14,483
Lexington Square Fushimi Electric facilities construction Installation of equipment for building in trust 1,419
Lexington Square Fushimi Plumbing sanitary Installation of equipment for building in trust
1,610
Lexington Square Fushimi Work on air conditioning Installation of equipment for building in trust
804
Total $139,060
3. Increase in structures in trust (Thousands of yen)
Name of property Name of project Type of tangible fixed asset Amount Royal Parks Toyosu Exterior construction Structures in trust ¥44,883 IPSE Togoshi Exterior construction Structures in trust 3,443 Big Tower Minami Sanjo Exterior construction Structures in trust 10,822 Lexington Square Fushimi Exterior construction Structures in trust 6,298 New City Residence Sangubashi Planting work Structures in trust 1,256
Total ¥66,702
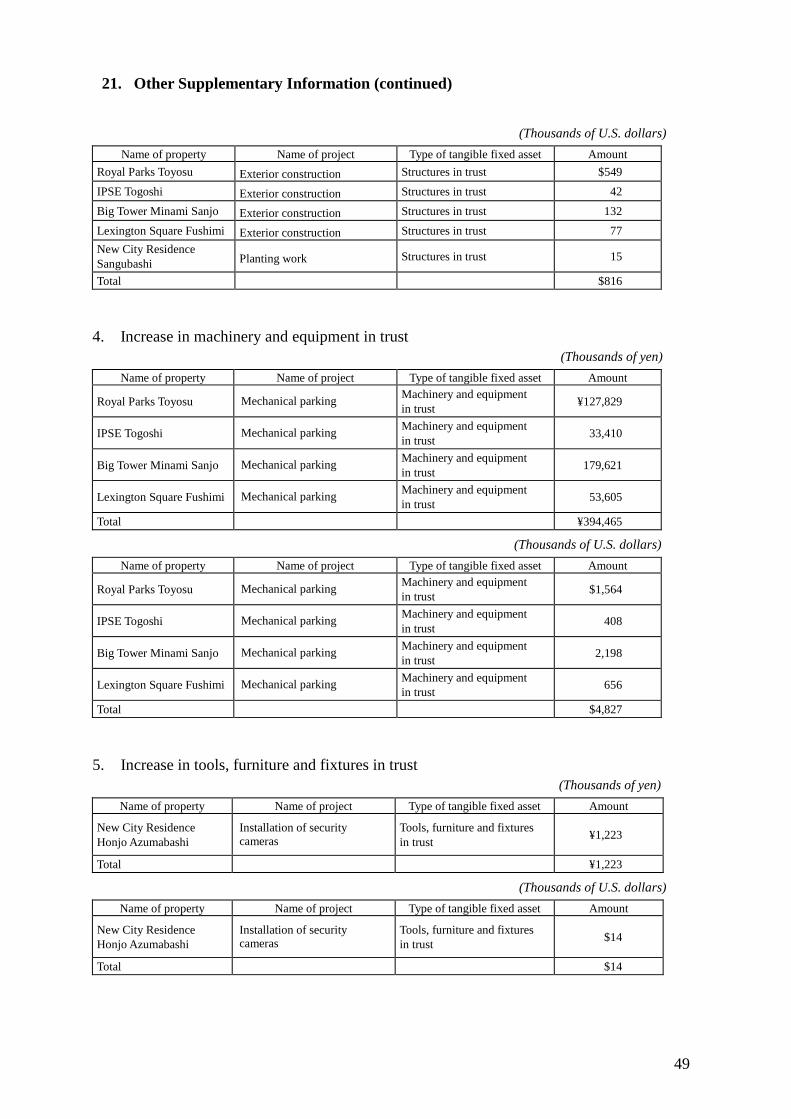
49
21. Other Supplementary Information (continued)
(Thousands of U.S. dollars) Name of property Name of project Type of tangible fixed asset Amount
Royal Parks Toyosu Exterior construction Structures in trust $549 IPSE Togoshi Exterior construction Structures in trust 42 Big Tower Minami Sanjo Exterior construction Structures in trust 132 Lexington Square Fushimi Exterior construction Structures in trust 77 New City Residence Sangubashi Planting work Structures in trust 15
Total $816
4. Increase in machinery and equipment in trust (Thousands of yen)
Name of property Name of project Type of tangible fixed asset Amount
Royal Parks Toyosu Mechanical parking Machinery and equipment in trust ¥127,829
IPSE Togoshi Mechanical parking Machinery and equipment in trust 33,410
Big Tower Minami Sanjo Mechanical parking Machinery and equipment in trust 179,621
Lexington Square Fushimi Mechanical parking Machinery and equipment in trust 53,605
Total ¥394,465
(Thousands of U.S. dollars) Name of property Name of project Type of tangible fixed asset Amount
Royal Parks Toyosu Mechanical parking Machinery and equipment in trust $1,564
IPSE Togoshi Mechanical parking Machinery and equipment in trust 408
Big Tower Minami Sanjo Mechanical parking Machinery and equipment in trust 2,198
Lexington Square Fushimi Mechanical parking Machinery and equipment in trust 656
Total $4,827
5. Increase in tools, furniture and fixtures in trust (Thousands of yen)
Name of property Name of project Type of tangible fixed asset Amount
New City Residence Honjo Azumabashi
Installation of security cameras
Tools, furniture and fixtures in trust ¥1,223
Total ¥1,223
(Thousands of U.S. dollars) Name of property Name of project Type of tangible fixed asset Amount
New City Residence Honjo Azumabashi
Installation of security cameras
Tools, furniture and fixtures in trust $14
Total $14
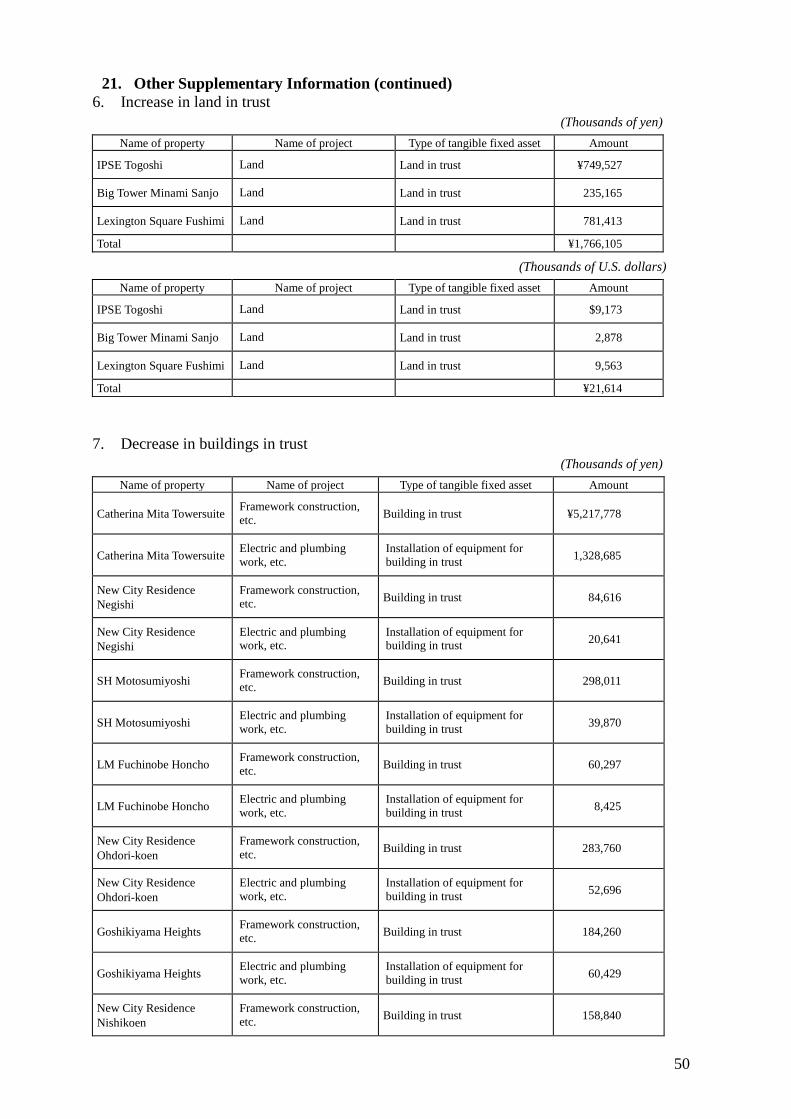
50
21. Other Supplementary Information (continued) 6. Increase in land in trust
(Thousands of yen) Name of property Name of project Type of tangible fixed asset Amount
IPSE Togoshi Land Land in trust ¥749,527
Big Tower Minami Sanjo Land Land in trust 235,165
Lexington Square Fushimi Land Land in trust 781,413
Total ¥1,766,105
(Thousands of U.S. dollars) Name of property Name of project Type of tangible fixed asset Amount
IPSE Togoshi Land Land in trust $9,173
Big Tower Minami Sanjo Land Land in trust 2,878
Lexington Square Fushimi Land Land in trust 9,563
Total ¥21,614
7. Decrease in buildings in trust (Thousands of yen)
Name of property Name of project Type of tangible fixed asset Amount
Catherina Mita Towersuite Framework construction, etc. Building in trust ¥5,217,778
Catherina Mita Towersuite Electric and plumbing work, etc.
Installation of equipment for building in trust 1,328,685
New City Residence Negishi
Framework construction, etc. Building in trust 84,616
New City Residence Negishi
Electric and plumbing work, etc.
Installation of equipment for building in trust 20,641
SH Motosumiyoshi Framework construction, etc. Building in trust 298,011
SH Motosumiyoshi Electric and plumbing work, etc.
Installation of equipment for building in trust 39,870
LM Fuchinobe Honcho Framework construction, etc. Building in trust 60,297
LM Fuchinobe Honcho Electric and plumbing work, etc.
Installation of equipment for building in trust 8,425
New City Residence Ohdori-koen
Framework construction, etc. Building in trust 283,760
New City Residence Ohdori-koen
Electric and plumbing work, etc.
Installation of equipment for building in trust 52,696
Goshikiyama Heights Framework construction, etc. Building in trust 184,260
Goshikiyama Heights Electric and plumbing work, etc.
Installation of equipment for building in trust 60,429
New City Residence Nishikoen
Framework construction, etc. Building in trust 158,840
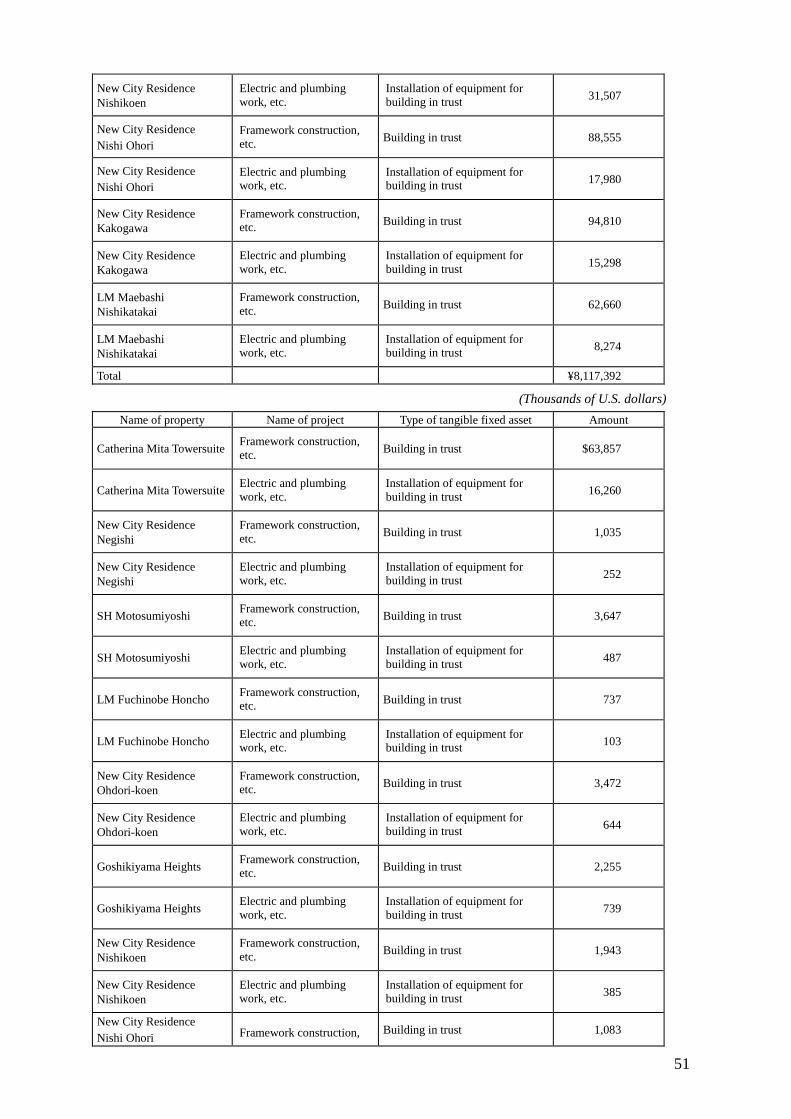
51
New City Residence Nishikoen
Electric and plumbing work, etc.
Installation of equipment for building in trust 31,507
New City Residence Nishi Ohori
Framework construction, etc. Building in trust 88,555
New City Residence Nishi Ohori
Electric and plumbing work, etc.
Installation of equipment for building in trust 17,980
New City Residence Kakogawa
Framework construction, etc. Building in trust 94,810
New City Residence Kakogawa
Electric and plumbing work, etc.
Installation of equipment for building in trust 15,298
LM Maebashi Nishikatakai
Framework construction, etc. Building in trust 62,660
LM Maebashi Nishikatakai
Electric and plumbing work, etc.
Installation of equipment for building in trust 8,274
Total ¥8,117,392
(Thousands of U.S. dollars) Name of property Name of project Type of tangible fixed asset Amount
Catherina Mita Towersuite Framework construction, etc. Building in trust $63,857
Catherina Mita Towersuite Electric and plumbing work, etc.
Installation of equipment for building in trust 16,260
New City Residence Negishi
Framework construction, etc. Building in trust 1,035
New City Residence Negishi
Electric and plumbing work, etc.
Installation of equipment for building in trust 252
SH Motosumiyoshi Framework construction, etc. Building in trust 3,647
SH Motosumiyoshi Electric and plumbing work, etc.
Installation of equipment for building in trust 487
LM Fuchinobe Honcho Framework construction, etc. Building in trust 737
LM Fuchinobe Honcho Electric and plumbing work, etc.
Installation of equipment for building in trust 103
New City Residence Ohdori-koen
Framework construction, etc. Building in trust 3,472
New City Residence Ohdori-koen
Electric and plumbing work, etc.
Installation of equipment for building in trust 644
Goshikiyama Heights Framework construction, etc. Building in trust 2,255
Goshikiyama Heights Electric and plumbing work, etc.
Installation of equipment for building in trust 739
New City Residence Nishikoen
Framework construction, etc. Building in trust 1,943
New City Residence Nishikoen
Electric and plumbing work, etc.
Installation of equipment for building in trust 385
New City Residence Nishi Ohori Framework construction, Building in trust 1,083
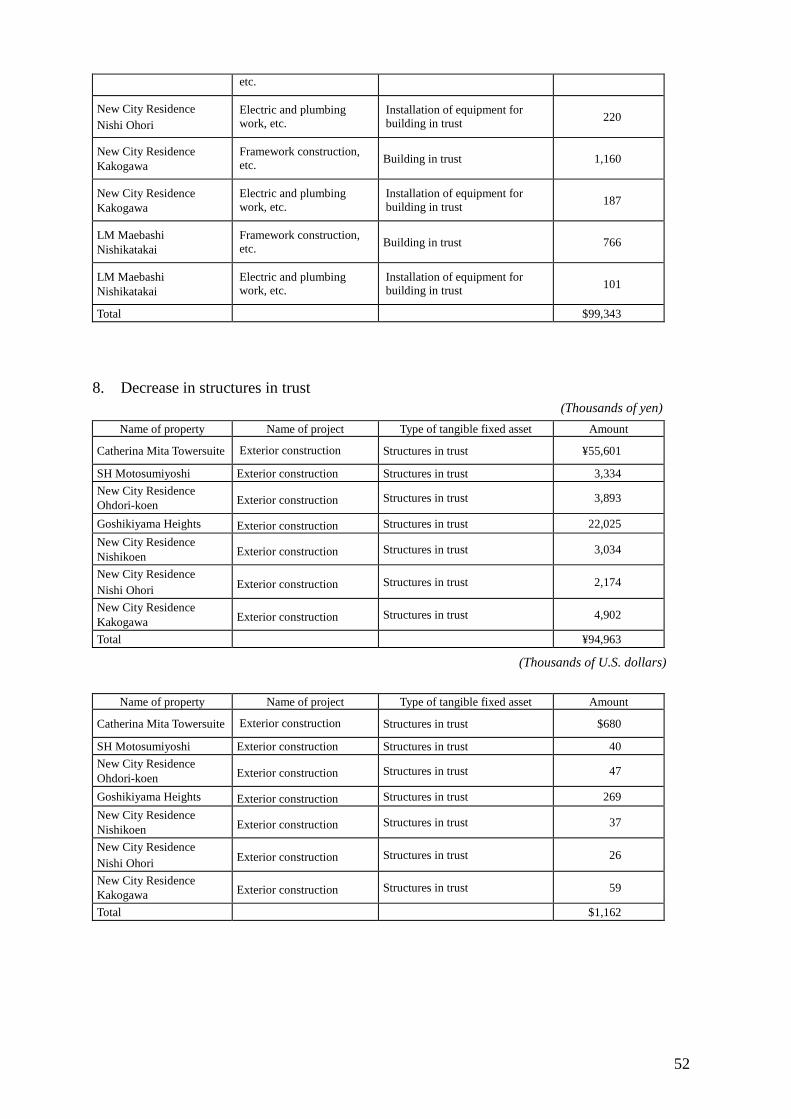
52
etc.
New City Residence Nishi Ohori
Electric and plumbing work, etc.
Installation of equipment for building in trust 220
New City Residence Kakogawa
Framework construction, etc. Building in trust 1,160
New City Residence Kakogawa
Electric and plumbing work, etc.
Installation of equipment for building in trust 187
LM Maebashi Nishikatakai
Framework construction, etc. Building in trust 766
LM Maebashi Nishikatakai
Electric and plumbing work, etc.
Installation of equipment for building in trust 101
Total $99,343
8. Decrease in structures in trust (Thousands of yen)
Name of property Name of project Type of tangible fixed asset Amount
Catherina Mita Towersuite Exterior construction Structures in trust ¥55,601
SH Motosumiyoshi Exterior construction Structures in trust 3,334 New City Residence Ohdori-koen Exterior construction Structures in trust 3,893
Goshikiyama Heights Exterior construction Structures in trust 22,025 New City Residence Nishikoen Exterior construction Structures in trust 3,034
New City Residence Nishi Ohori Exterior construction Structures in trust 2,174
New City Residence Kakogawa Exterior construction Structures in trust 4,902
Total ¥94,963
(Thousands of U.S. dollars)
Name of property Name of project Type of tangible fixed asset Amount
Catherina Mita Towersuite Exterior construction Structures in trust $680
SH Motosumiyoshi Exterior construction Structures in trust 40 New City Residence Ohdori-koen Exterior construction Structures in trust 47
Goshikiyama Heights Exterior construction Structures in trust 269 New City Residence Nishikoen Exterior construction Structures in trust 37
New City Residence Nishi Ohori Exterior construction Structures in trust 26
New City Residence Kakogawa Exterior construction Structures in trust 59
Total $1,162
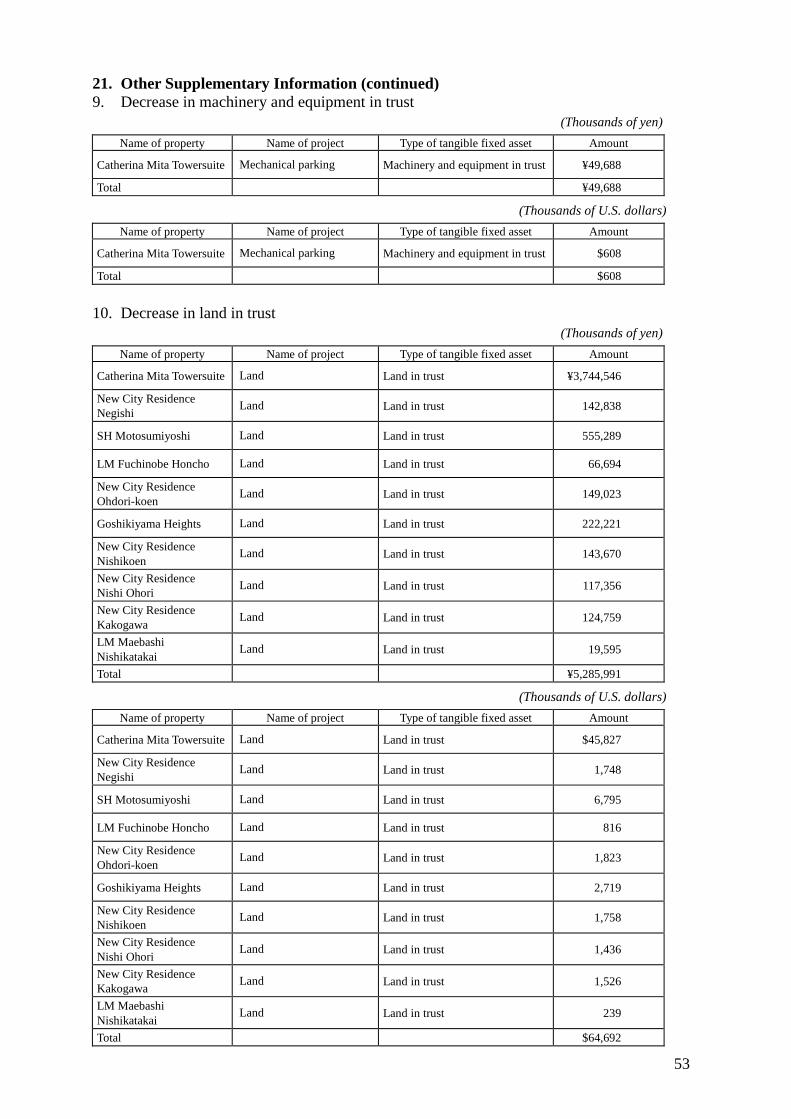
53
21. Other Supplementary Information (continued) 9. Decrease in machinery and equipment in trust
(Thousands of yen) Name of property Name of project Type of tangible fixed asset Amount
Catherina Mita Towersuite Mechanical parking Machinery and equipment in trust ¥49,688
Total ¥49,688
(Thousands of U.S. dollars) Name of property Name of project Type of tangible fixed asset Amount
Catherina Mita Towersuite Mechanical parking Machinery and equipment in trust $608
Total $608
10. Decrease in land in trust (Thousands of yen)
Name of property Name of project Type of tangible fixed asset Amount
Catherina Mita Towersuite Land Land in trust ¥3,744,546
New City Residence Negishi Land Land in trust 142,838
SH Motosumiyoshi Land Land in trust 555,289
LM Fuchinobe Honcho Land Land in trust 66,694
New City Residence Ohdori-koen Land Land in trust 149,023
Goshikiyama Heights Land Land in trust 222,221
New City Residence Nishikoen Land Land in trust 143,670
New City Residence Nishi Ohori Land Land in trust 117,356
New City Residence Kakogawa Land Land in trust 124,759
LM Maebashi Nishikatakai Land Land in trust 19,595
Total ¥5,285,991
(Thousands of U.S. dollars) Name of property Name of project Type of tangible fixed asset Amount
Catherina Mita Towersuite Land Land in trust $45,827
New City Residence Negishi Land Land in trust 1,748
SH Motosumiyoshi Land Land in trust 6,795
LM Fuchinobe Honcho Land Land in trust 816
New City Residence Ohdori-koen Land Land in trust 1,823
Goshikiyama Heights Land Land in trust 2,719
New City Residence Nishikoen Land Land in trust 1,758
New City Residence Nishi Ohori Land Land in trust 1,436
New City Residence Kakogawa Land Land in trust 1,526
LM Maebashi Nishikatakai Land Land in trust 239
Total $64,692
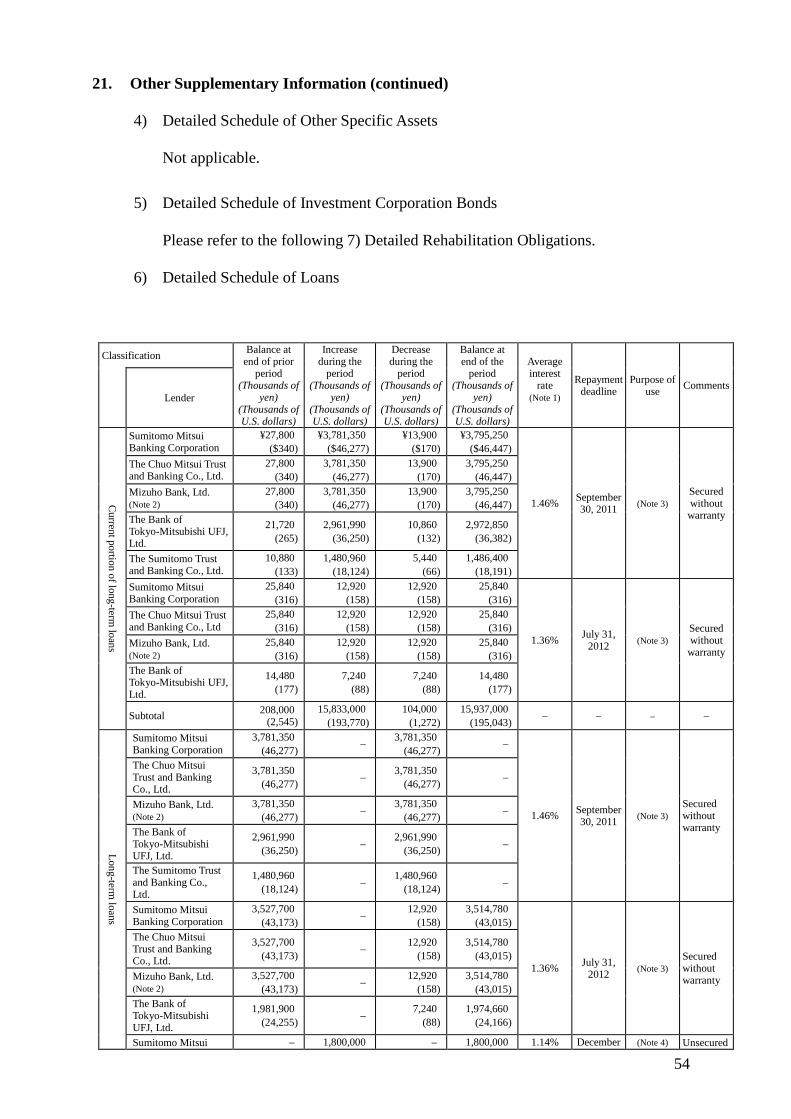
54
21. Other Supplementary Information (continued)
4) Detailed Schedule of Other Specific Assets Not applicable.
5) Detailed Schedule of Investment Corporation Bonds Please refer to the following 7) Detailed Rehabilitation Obligations.
6) Detailed Schedule of Loans
Classification Balance at end of prior
period (Thousands of
yen) (Thousands of U.S. dollars)
Increase during the
period (Thousands of
yen) (Thousands of U.S. dollars)
Decrease during the
period (Thousands of
yen) (Thousands of U.S. dollars)
Balance at end of the
period (Thousands of
yen) (Thousands of U.S. dollars)
Average interest
rate (Note 1)
Repayment deadline
Purpose of use Comments
Lender
Current portion of long-term
loans
Sumitomo Mitsui Banking Corporation
¥27,800 ($340)
¥3,781,350 ($46,277)
¥13,900 ($170)
¥3,795,250 ($46,447)
1.46% September 30, 2011 (Note 3)
Secured without
warranty
The Chuo Mitsui Trust and Banking Co., Ltd.
27,800 (340)
3,781,350 (46,277)
13,900 (170)
3,795,250 (46,447)
Mizuho Bank, Ltd. (Note 2)
27,800 (340)
3,781,350 (46,277)
13,900 (170)
3,795,250 (46,447)
The Bank of Tokyo-Mitsubishi UFJ, Ltd.
21,720 (265)
2,961,990 (36,250)
10,860 (132)
2,972,850 (36,382)
The Sumitomo Trust and Banking Co., Ltd.
10,880 (133)
1,480,960 (18,124)
5,440 (66)
1,486,400 (18,191)
Sumitomo Mitsui Banking Corporation
25,840 (316)
12,920 (158)
12,920 (158)
25,840 (316)
1.36% July 31, 2012 (Note 3)
Secured without
warranty
The Chuo Mitsui Trust and Banking Co., Ltd
25,840 (316)
12,920 (158)
12,920 (158)
25,840 (316)
Mizuho Bank, Ltd. (Note 2)
25,840 (316)
12,920 (158)
12,920 (158)
25,840 (316)
The Bank of Tokyo-Mitsubishi UFJ, Ltd.
14,480 (177)
7,240 (88)
7,240 (88)
14,480 (177)
Subtotal 208,000 (2,545)
15,833,000 (193,770)
104,000 (1,272)
15,937,000 (195,043) – – – –
Long-term loans
Sumitomo Mitsui Banking Corporation
3,781,350 (46,277) – 3,781,350
(46,277) –
1.46% September 30, 2011 (Note 3)
Secured without warranty
The Chuo Mitsui Trust and Banking Co., Ltd.
3,781,350 (46,277) – 3,781,350
(46,277) –
Mizuho Bank, Ltd. (Note 2)
3,781,350 (46,277) – 3,781,350
(46,277) –
The Bank of Tokyo-Mitsubishi UFJ, Ltd.
2,961,990 (36,250) – 2,961,990
(36,250) –
The Sumitomo Trust and Banking Co., Ltd.
1,480,960 (18,124) – 1,480,960
(18,124) –
Sumitomo Mitsui Banking Corporation
3,527,700 (43,173) – 12,920
(158) 3,514,780
(43,015)
1.36% July 31, 2012 (Note 3)
Secured without warranty
The Chuo Mitsui Trust and Banking Co., Ltd.
3,527,700 (43,173) – 12,920
(158) 3,514,780
(43,015)
Mizuho Bank, Ltd. (Note 2)
3,527,700 (43,173) – 12,920
(158) 3,514,780
(43,015) The Bank of Tokyo-Mitsubishi UFJ, Ltd.
1,981,900 (24,255) – 7,240
(88) 1,974,660
(24,166)
Sumitomo Mitsui – 1,800,000 – 1,800,000 1.14% December (Note 4) Unsecured
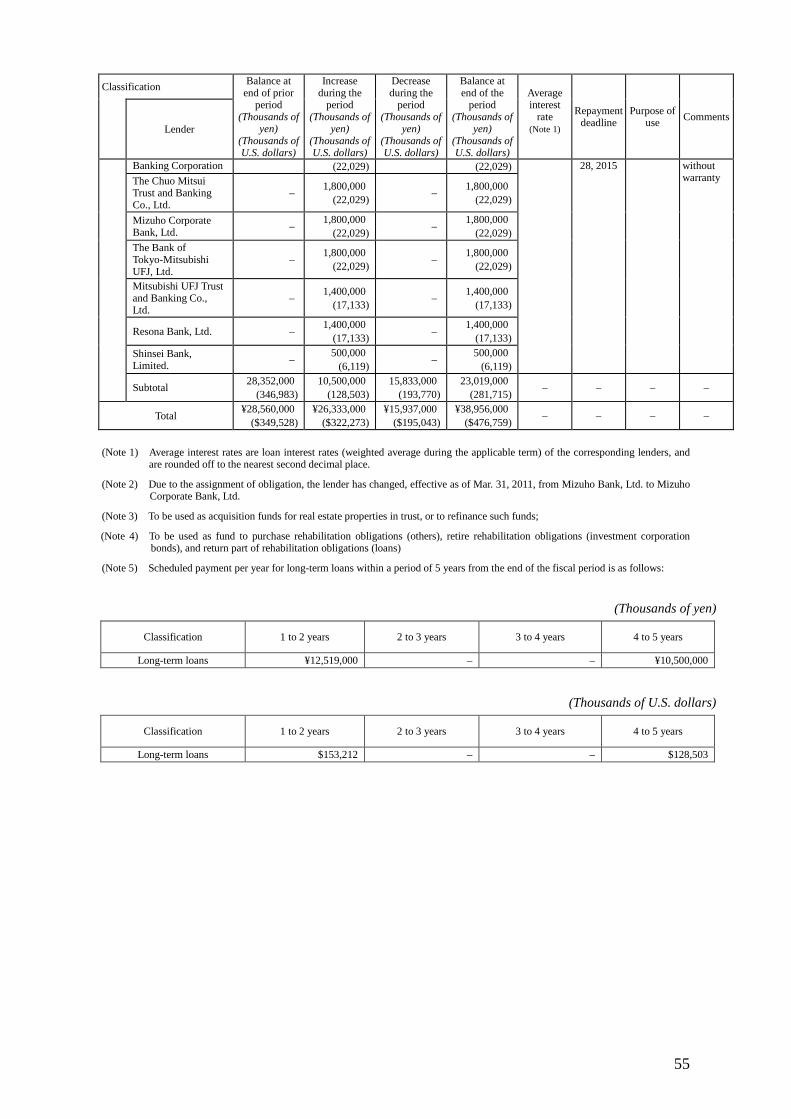
55
Classification Balance at end of prior
period (Thousands of
yen) (Thousands of U.S. dollars)
Increase during the
period (Thousands of
yen) (Thousands of U.S. dollars)
Decrease during the
period (Thousands of
yen) (Thousands of U.S. dollars)
Balance at end of the
period (Thousands of
yen) (Thousands of U.S. dollars)
Average interest
rate (Note 1)
Repayment deadline
Purpose of use Comments
Lender
Banking Corporation (22,029) (22,029) 28, 2015 without warranty The Chuo Mitsui
Trust and Banking Co., Ltd.
– 1,800,000 (22,029) – 1,800,000
(22,029)
Mizuho Corporate Bank, Ltd. – 1,800,000
(22,029) – 1,800,000 (22,029)
The Bank of Tokyo-Mitsubishi UFJ, Ltd.
– 1,800,000 (22,029) – 1,800,000
(22,029)
Mitsubishi UFJ Trust and Banking Co., Ltd.
– 1,400,000 (17,133) – 1,400,000
(17,133)
Resona Bank, Ltd. – 1,400,000 (17,133) – 1,400,000
(17,133) Shinsei Bank, Limited. – 500,000
(6,119) – 500,000 (6,119)
Subtotal 28,352,000 (346,983)
10,500,000 (128,503)
15,833,000 (193,770)
23,019,000 (281,715) – – – –
Total ¥28,560,000 ($349,528)
¥26,333,000 ($322,273)
¥15,937,000 ($195,043)
¥38,956,000 ($476,759) – – – –
(Note 1) Average interest rates are loan interest rates (weighted average during the applicable term) of the corresponding lenders, and are rounded off to the nearest second decimal place.
(Note 2) Due to the assignment of obligation, the lender has changed, effective as of Mar. 31, 2011, from Mizuho Bank, Ltd. to Mizuho Corporate Bank, Ltd.
(Note 3) To be used as acquisition funds for real estate properties in trust, or to refinance such funds;
(Note 4) To be used as fund to purchase rehabilitation obligations (others), retire rehabilitation obligations (investment corporation bonds), and return part of rehabilitation obligations (loans)
(Note 5) Scheduled payment per year for long-term loans within a period of 5 years from the end of the fiscal period is as follows:
(Thousands of yen)
Classification 1 to 2 years 2 to 3 years 3 to 4 years 4 to 5 years
Long-term loans ¥12,519,000 – – ¥10,500,000
(Thousands of U.S. dollars)
Classification 1 to 2 years 2 to 3 years 3 to 4 years 4 to 5 years
Long-term loans $153,212 – – $128,503
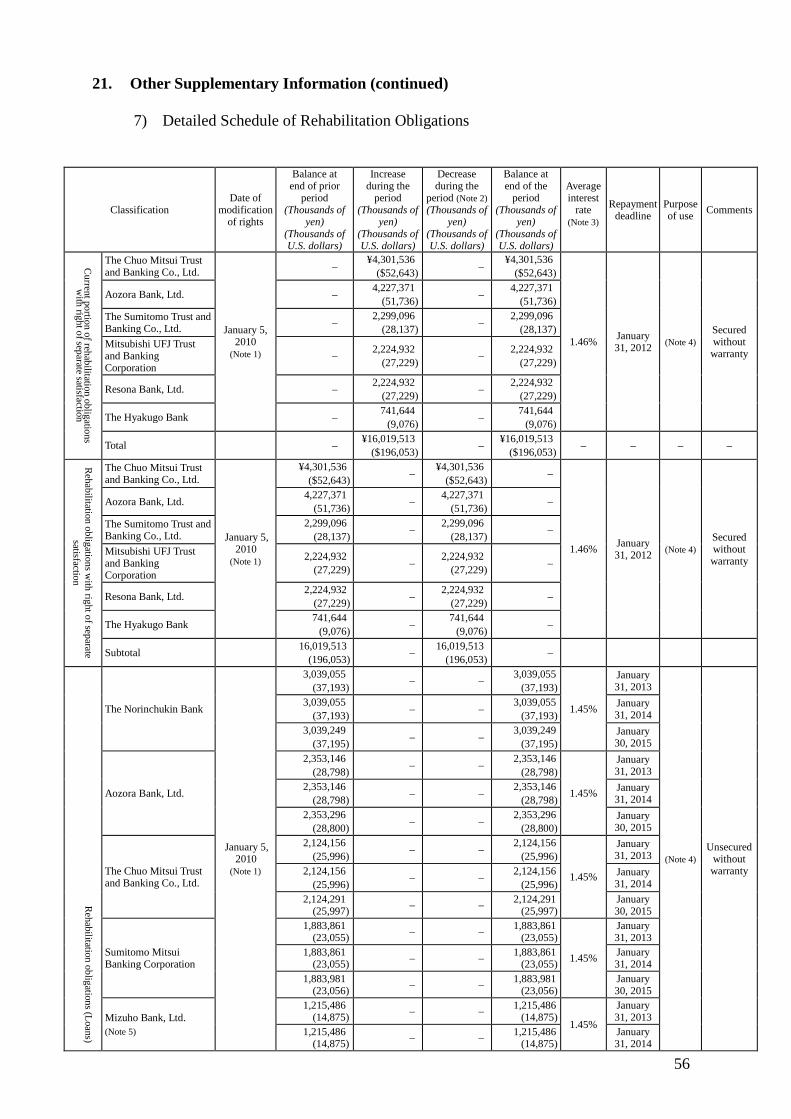
56
21. Other Supplementary Information (continued) 7) Detailed Schedule of Rehabilitation Obligations
Classification Date of
modification of rights
Balance at end of prior
period (Thousands of
yen) (Thousands of U.S. dollars)
Increase during the
period (Thousands of
yen) (Thousands of U.S. dollars)
Decrease during the
period (Note 2) (Thousands of
yen) (Thousands of U.S. dollars)
Balance at end of the
period (Thousands of
yen) (Thousands of U.S. dollars)
Average interest
rate (Note 3)
Repayment deadline
Purpose of use Comments
Current portion of rehabilitation obligations
with right of separate satisfaction
The Chuo Mitsui Trust and Banking Co., Ltd.
January 5, 2010
(Note 1)
– ¥4,301,536 ($52,643) – ¥4,301,536
($52,643)
1.46% January 31, 2012 (Note 4)
Secured without warranty
Aozora Bank, Ltd. – 4,227,371 (51,736) – 4,227,371
(51,736) The Sumitomo Trust and Banking Co., Ltd. – 2,299,096
(28,137) – 2,299,096 (28,137)
Mitsubishi UFJ Trust and Banking Corporation
– 2,224,932 (27,229) – 2,224,932
(27,229)
Resona Bank, Ltd. – 2,224,932 (27,229) – 2,224,932
(27,229)
The Hyakugo Bank – 741,644 (9,076) – 741,644
(9,076)
Total – ¥16,019,513 ($196,053) – ¥16,019,513
($196,053) – – – –
Rehabilitation obligations w
ith right of separate satisfaction
The Chuo Mitsui Trust and Banking Co., Ltd.
January 5, 2010
(Note 1)
¥4,301,536 ($52,643) – ¥4,301,536
($52,643) –
1.46% January 31, 2012 (Note 4)
Secured without warranty
Aozora Bank, Ltd. 4,227,371 (51,736) – 4,227,371
(51,736) –
The Sumitomo Trust and Banking Co., Ltd.
2,299,096 (28,137) – 2,299,096
(28,137) –
Mitsubishi UFJ Trust and Banking Corporation
2,224,932 (27,229) – 2,224,932
(27,229) –
Resona Bank, Ltd. 2,224,932 (27,229) – 2,224,932
(27,229) –
The Hyakugo Bank 741,644 (9,076) – 741,644
(9,076) –
Subtotal 16,019,513 (196,053) – 16,019,513
(196,053) –
Rehabilitation obligations (Loans)
The Norinchukin Bank
January 5, 2010
(Note 1)
3,039,055 (37,193) – – 3,039,055
(37,193)
1.45%
January 31, 2013
(Note 4) Unsecured
without warranty
3,039,055 (37,193) – – 3,039,055
(37,193) January 31, 2014
3,039,249 (37,195) – – 3,039,249
(37,195) January 30, 2015
Aozora Bank, Ltd.
2,353,146 (28,798) – – 2,353,146
(28,798)
1.45%
January 31, 2013
2,353,146 (28,798) – – 2,353,146
(28,798) January 31, 2014
2,353,296 (28,800) – – 2,353,296
(28,800) January 30, 2015
The Chuo Mitsui Trust and Banking Co., Ltd.
2,124,156 (25,996) – – 2,124,156
(25,996)
1.45%
January 31, 2013
2,124,156 (25,996) – – 2,124,156
(25,996) January 31, 2014
2,124,291 (25,997) – – 2,124,291
(25,997) January 30, 2015
Sumitomo Mitsui Banking Corporation
1,883,861 (23,055) – – 1,883,861
(23,055)
1.45%
January 31, 2013
1,883,861 (23,055) – – 1,883,861
(23,055) January 31, 2014
1,883,981 (23,056) – – 1,883,981
(23,056) January 30, 2015
Mizuho Bank, Ltd. (Note 5)
1,215,486 (14,875) – – 1,215,486
(14,875) 1.45%
January 31, 2013
1,215,486 (14,875) – – 1,215,486
(14,875) January 31, 2014
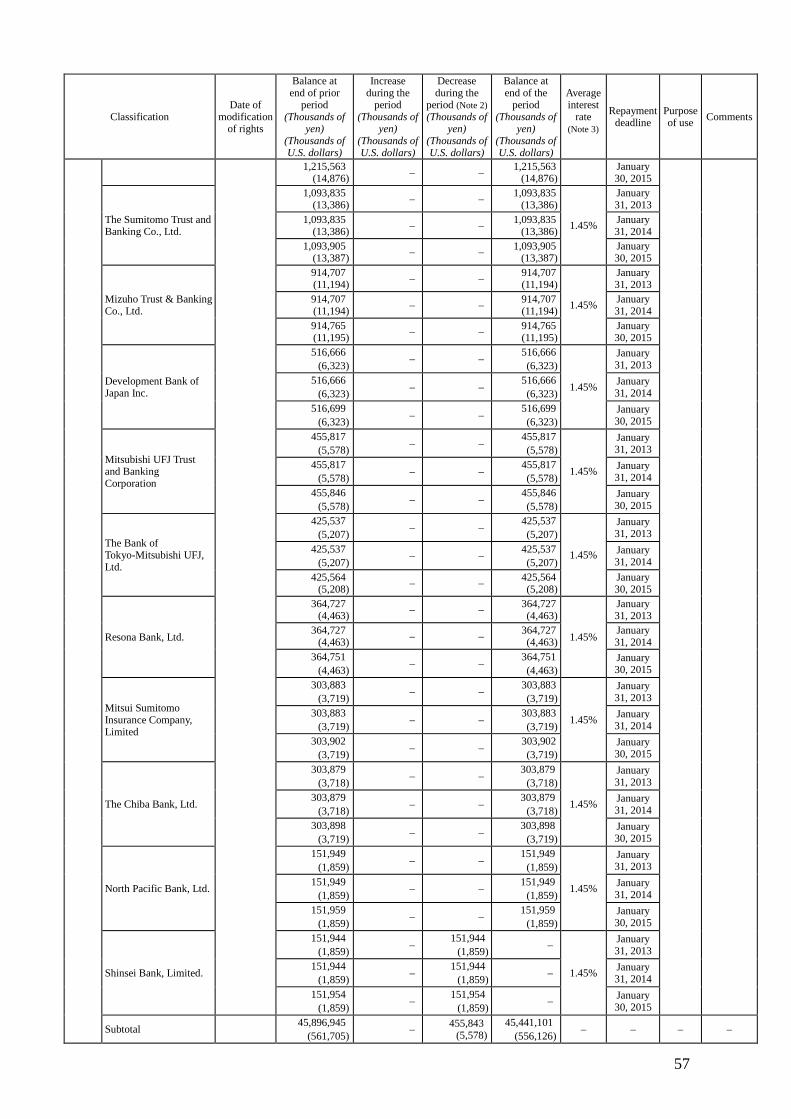
57
Classification Date of
modification of rights
Balance at end of prior
period (Thousands of
yen) (Thousands of U.S. dollars)
Increase during the
period (Thousands of
yen) (Thousands of U.S. dollars)
Decrease during the
period (Note 2) (Thousands of
yen) (Thousands of U.S. dollars)
Balance at end of the
period (Thousands of
yen) (Thousands of U.S. dollars)
Average interest
rate (Note 3)
Repayment deadline
Purpose of use Comments
1,215,563 (14,876) – – 1,215,563
(14,876) January 30, 2015
The Sumitomo Trust and Banking Co., Ltd.
1,093,835 (13,386) – – 1,093,835
(13,386)
1.45%
January 31, 2013
1,093,835 (13,386) – – 1,093,835
(13,386) January 31, 2014
1,093,905 (13,387) – – 1,093,905
(13,387) January 30, 2015
Mizuho Trust & Banking Co., Ltd.
914,707 (11,194) – – 914,707
(11,194)
1.45%
January 31, 2013
914,707 (11,194) – – 914,707
(11,194) January 31, 2014
914,765 (11,195) – – 914,765
(11,195) January 30, 2015
Development Bank of Japan Inc.
516,666 (6,323) – – 516,666
(6,323)
1.45%
January 31, 2013
516,666 (6,323) – – 516,666
(6,323) January 31, 2014
516,699 (6,323) – – 516,699
(6,323) January 30, 2015
Mitsubishi UFJ Trust and Banking Corporation
455,817 (5,578) – – 455,817
(5,578)
1.45%
January 31, 2013
455,817 (5,578) – – 455,817
(5,578) January 31, 2014
455,846 (5,578) – – 455,846
(5,578) January 30, 2015
The Bank of Tokyo-Mitsubishi UFJ, Ltd.
425,537 (5,207) – – 425,537
(5,207)
1.45%
January 31, 2013
425,537 (5,207) – – 425,537
(5,207) January 31, 2014
425,564 (5,208) – – 425,564
(5,208) January 30, 2015
Resona Bank, Ltd.
364,727 (4,463) – – 364,727
(4,463)
1.45%
January 31, 2013
364,727 (4,463) – – 364,727
(4,463) January 31, 2014
364,751 (4,463) – – 364,751
(4,463) January 30, 2015
Mitsui Sumitomo Insurance Company, Limited
303,883 (3,719) – – 303,883
(3,719)
1.45%
January 31, 2013
303,883 (3,719) – – 303,883
(3,719) January 31, 2014
303,902 (3,719) – – 303,902
(3,719) January 30, 2015
The Chiba Bank, Ltd.
303,879 (3,718) – – 303,879
(3,718)
1.45%
January 31, 2013
303,879 (3,718) – – 303,879
(3,718) January 31, 2014
303,898 (3,719) – – 303,898
(3,719) January 30, 2015
North Pacific Bank, Ltd.
151,949 (1,859) – – 151,949
(1,859)
1.45%
January 31, 2013
151,949 (1,859) – – 151,949
(1,859) January 31, 2014
151,959 (1,859) – – 151,959
(1,859) January 30, 2015
Shinsei Bank, Limited.
151,944 (1,859) – 151,944
(1,859) –
1.45%
January 31, 2013
151,944 (1,859) – 151,944
(1,859) – January 31, 2014
151,954 (1,859) – 151,954
(1,859) – January 30, 2015
Subtotal 45,896,945 (561,705) – 455,843
(5,578) 45,441,101
(556,126) – – – –
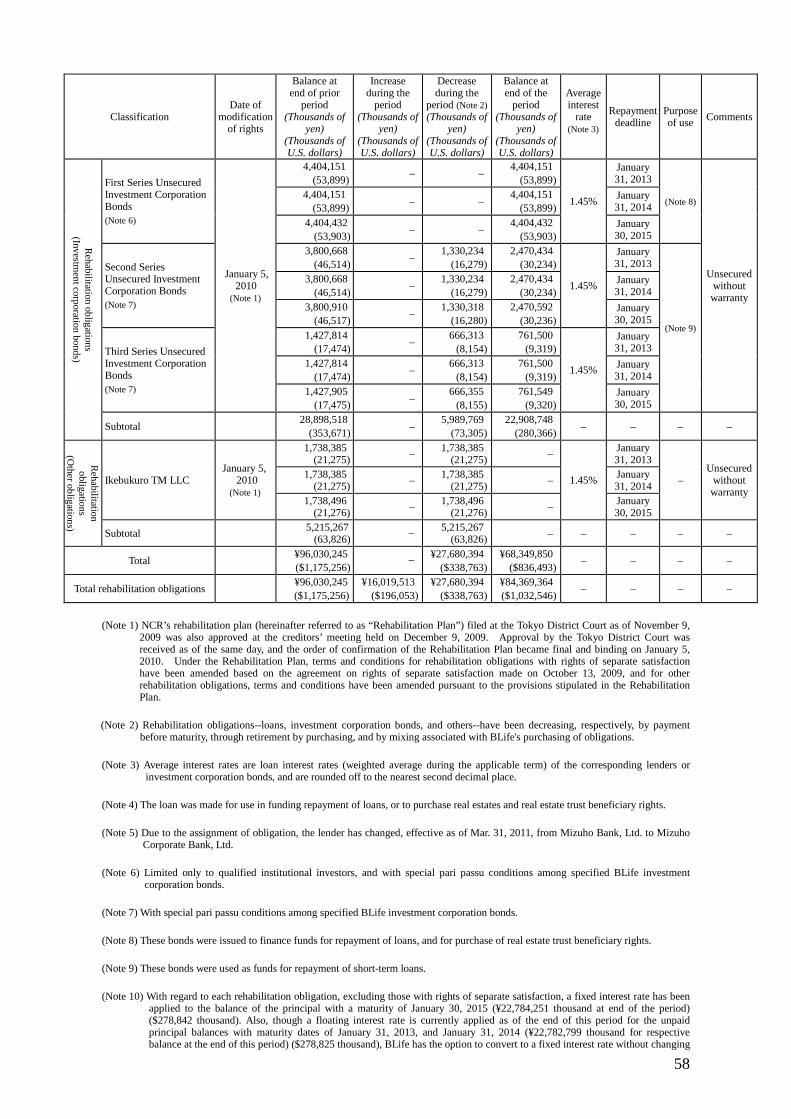
58
Classification Date of
modification of rights
Balance at end of prior
period (Thousands of
yen) (Thousands of U.S. dollars)
Increase during the
period (Thousands of
yen) (Thousands of U.S. dollars)
Decrease during the
period (Note 2) (Thousands of
yen) (Thousands of U.S. dollars)
Balance at end of the
period (Thousands of
yen) (Thousands of U.S. dollars)
Average interest
rate (Note 3)
Repayment deadline
Purpose of use Comments
Rehabilitation obligations
(Investment corporation bonds)
First Series Unsecured Investment Corporation Bonds (Note 6)
January 5, 2010
(Note 1)
4,404,151 (53,899) – – 4,404,151
(53,899)
1.45%
January 31, 2013
(Note 8)
Unsecured without warranty
4,404,151 (53,899) – – 4,404,151
(53,899) January 31, 2014
4,404,432 (53,903) – – 4,404,432
(53,903) January 30, 2015
Second Series Unsecured Investment Corporation Bonds (Note 7)
3,800,668 (46,514) – 1,330,234
(16,279) 2,470,434 (30,234)
1.45%
January 31, 2013
(Note 9)
3,800,668 (46,514) – 1,330,234
(16,279) 2,470,434 (30,234)
January 31, 2014
3,800,910 (46,517) – 1,330,318
(16,280) 2,470,592 (30,236)
January 30, 2015
Third Series Unsecured Investment Corporation Bonds (Note 7)
1,427,814 (17,474) – 666,313
(8,154) 761,500 (9,319)
1.45%
January 31, 2013
1,427,814 (17,474) – 666,313
(8,154) 761,500 (9,319)
January 31, 2014
1,427,905 (17,475) – 666,355
(8,155) 761,549 (9,320)
January 30, 2015
Subtotal 28,898,518 (353,671) – 5,989,769
(73,305) 22,908,748 (280,366) – – – –
Rehabilitation obligations
(Other obligations)
Ikebukuro TM LLC January 5,
2010 (Note 1)
1,738,385 (21,275) – 1,738,385
(21,275) –
1.45%
January 31, 2013
– Unsecured
without warranty
1,738,385 (21,275) – 1,738,385
(21,275) – January 31, 2014
1,738,496 (21,276) – 1,738,496
(21,276) – January 30, 2015
Subtotal 5,215,267 (63,826) – 5,215,267
(63,826) – – – – –
Total ¥96,030,245 ($1,175,256)
– ¥27,680,394 ($338,763)
¥68,349,850 ($836,493) – – – –
Total rehabilitation obligations ¥96,030,245 ($1,175,256)
¥16,019,513 ($196,053)
¥27,680,394 ($338,763)
¥84,369,364 ($1,032,546) – – – –
(Note 1) NCR’s rehabilitation plan (hereinafter referred to as “Rehabilitation Plan”) filed at the Tokyo District Court as of November 9, 2009 was also approved at the creditors’ meeting held on December 9, 2009. Approval by the Tokyo District Court was received as of the same day, and the order of confirmation of the Rehabilitation Plan became final and binding on January 5, 2010. Under the Rehabilitation Plan, terms and conditions for rehabilitation obligations with rights of separate satisfaction have been amended based on the agreement on rights of separate satisfaction made on October 13, 2009, and for other rehabilitation obligations, terms and conditions have been amended pursuant to the provisions stipulated in the Rehabilitation Plan.
(Note 2) Rehabilitation obligations--loans, investment corporation bonds, and others--have been decreasing, respectively, by payment before maturity, through retirement by purchasing, and by mixing associated with BLife's purchasing of obligations.
(Note 3) Average interest rates are loan interest rates (weighted average during the applicable term) of the corresponding lenders or investment corporation bonds, and are rounded off to the nearest second decimal place.
(Note 4) The loan was made for use in funding repayment of loans, or to purchase real estates and real estate trust beneficiary rights.
(Note 5) Due to the assignment of obligation, the lender has changed, effective as of Mar. 31, 2011, from Mizuho Bank, Ltd. to Mizuho Corporate Bank, Ltd.
(Note 6) Limited only to qualified institutional investors, and with special pari passu conditions among specified BLife investment corporation bonds.
(Note 7) With special pari passu conditions among specified BLife investment corporation bonds.
(Note 8) These bonds were issued to finance funds for repayment of loans, and for purchase of real estate trust beneficiary rights.
(Note 9) These bonds were used as funds for repayment of short-term loans.
(Note 10) With regard to each rehabilitation obligation, excluding those with rights of separate satisfaction, a fixed interest rate has been applied to the balance of the principal with a maturity of January 30, 2015 (¥22,784,251 thousand at end of the period) ($278,842 thousand). Also, though a floating interest rate is currently applied as of the end of this period for the unpaid principal balances with maturity dates of January 31, 2013, and January 31, 2014 (¥22,782,799 thousand for respective balance at the end of this period) ($278,825 thousand), BLife has the option to convert to a fixed interest rate without changing
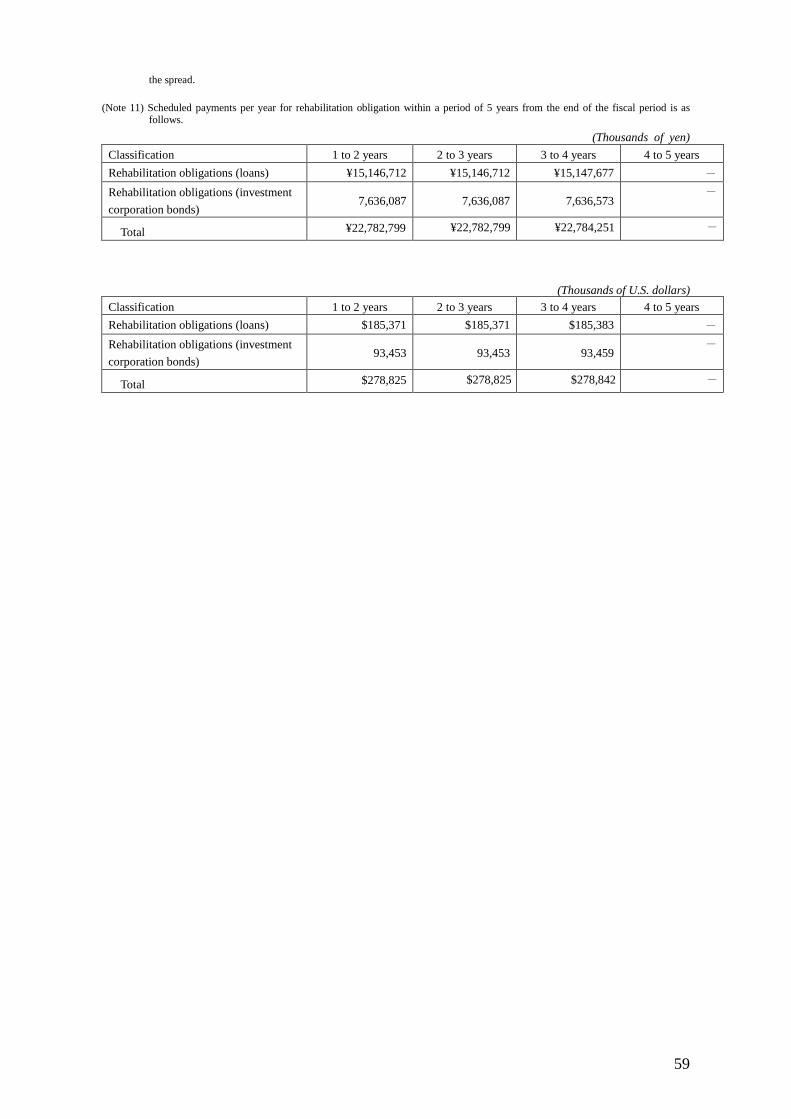
59
the spread.
(Note 11) Scheduled payments per year for rehabilitation obligation within a period of 5 years from the end of the fiscal period is as follows.
(Thousands of yen) Classification 1 to 2 years 2 to 3 years 3 to 4 years 4 to 5 years Rehabilitation obligations (loans) ¥15,146,712 ¥15,146,712 ¥15,147,677 - Rehabilitation obligations (investment corporation bonds)
7,636,087 7,636,087 7,636,573 -
Total ¥22,782,799 ¥22,782,799 ¥22,784,251 -
(Thousands of U.S. dollars) Classification 1 to 2 years 2 to 3 years 3 to 4 years 4 to 5 years Rehabilitation obligations (loans) $185,371 $185,371 $185,383 - Rehabilitation obligations (investment corporation bonds)
93,453 93,453 93,459 -
Total $278,825 $278,825 $278,842 -