Embed Size (px)
Citation preview
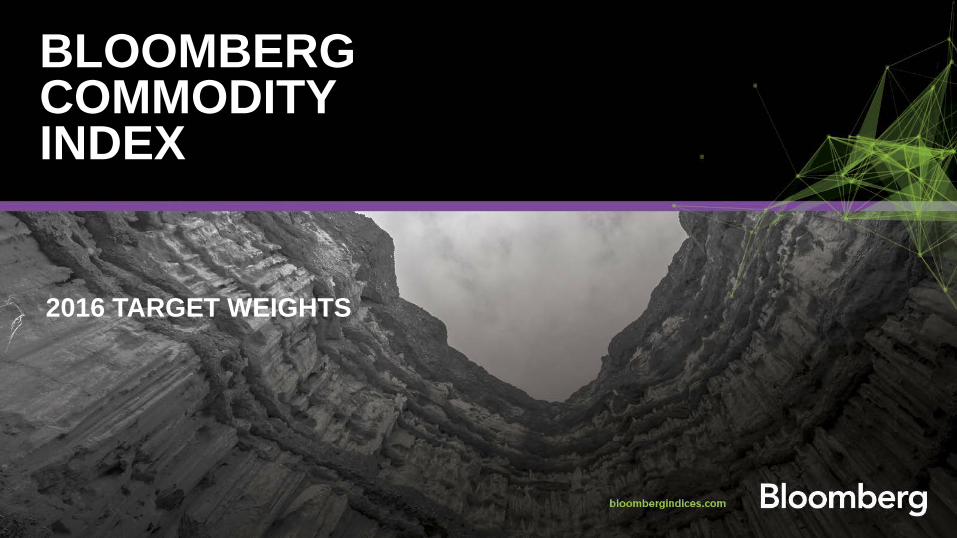
BLOOMBERG COMMODITY INDEX
2016 TARGET WEIGHTS
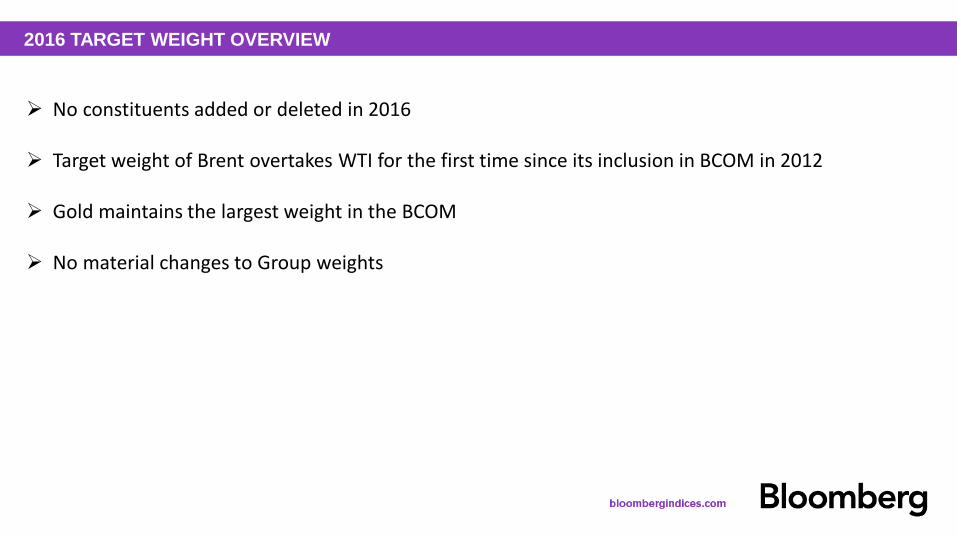
2016 TARGET WEIGHT OVERVIEW
No constituents added or deleted in 2016 Target weight of Brent overtakes WTI for the first time since its inclusion in BCOM in 2012
Gold maintains the largest weight in the BCOM
No material changes to Group weights

26 CONTRACTS TESTED FOR INCLUSION
Group Commodity
Energy
1. WTI Crude Oil (CL) 2. Brent Crude Oil (ICO) 3. ULS Diesel (HO) 4. Natural Gas (NG) 5. Unleaded Gasoline (XB)
Precious Metals 6. Gold (GC) 7. Platinum (PL) 8. Silver (SI)
Industrial Metals
9. Aluminum (LA) 10. Copper (HG) 11. Lead (LA) 12. Nickel (LN) 13. Tin (LT) 14. Zinc (LX)
Livestock 15. Live Cattle (LC) 16. Lean Hogs (LH)
Grains
17. Corn (C) 18. Soybeans (S) 19. Soybean Oil (BO) 20. Soybean Meal (SM) 21. Chicago Wheat (W) 22. KC Hard Red Wheat (KW)
Softs
23. Cocoa (CC) 24. Coffee (KC) 25. Cotton (CT) 26. Sugar (SB)

Liquidity Averaging Period 2010 to 2014
(Prices/Volume)
Production Averaging Period 2008 to 2012
(Prices/Production)
Commodity Liquidity and Production Percentages
& World
Production Data
Lead Contract Prices
FIA Volume
Data
Lead Contract Prices
&
STEPS TO COMPUTE 2016 TARGET WEIGHTS

Commodity Commodity
Liquidity Percentage
Commodity Production Percentage
Interim Commodity Index Percentage (B) 0.4% Threshold Test
Brent Crude 23.1170458% 25.0459493% 23.7600136% PASS Crude Oil 22.9312741% 24.8446767% 23.5690750% PASS Gold 10.3328292% 2.3467541% 7.6708042% PASS ULS Diesel (HO) 6.1027308% 6.6119472% 6.2724696% PASS Unleaded Gasoline 5.9140227% 6.4074932% 6.0785129% PASS Natural Gas 4.8521217% 4.0453467% 4.5831967% PASS Copper 4.0593084% 3.1661915% 3.7616027% PASS Soybeans 4.7360224% 1.6797364% 3.7172604% PASS Corn 3.1819291% 4.1153148% 3.4930577% PASS Live Cattle 1.0190339% 5.0141820% 2.3507499% PASS Silver 3.1661509% 0.4021297% 2.2448105% PASS Wheat (Chicago) 1.3428994% 3.0667835% 1.9175274% PASS
Aluminum 1.6328412% 2.0746005% 1.7800943% PASS Lean Hogs 0.5891810% 4.0164499% 1.7316040% PASS Sugar 1.0363576% 1.5527774% 1.2084975% PASS Soy Meal 1.0932651% 0.3877510% 0.8580937% PASS Soybean Oil 1.0842001% 0.3845359% 0.8509787% PASS Coffee 0.6555209% 0.7235540% 0.6781986% PASS Nickel 0.6741072% 0.6800707% 0.6760950% PASS Zinc 0.7221805% 0.5612604% 0.6685405% PASS Cotton 0.4266259% 1.0374973% 0.6302497% PASS Wheat (KC HRW) 0.3294686% 0.7524085% 0.4704486% PASS
Lead 0.3414801% 0.4519176% 0.3782926% ELIMINATE
Platinum 0.3086303% 0.2126063% 0.2766223% ELIMINATE Cocoa 0.2375543% 0.2695271% 0.2482119% ELIMINATE Tin 0.1132186% 0.1485382% 0.1249918% ELIMINATE
Allocate 2/3 Liquidity & 1/3 Production to determine Interim Commodity Index Percentage (ICIP) Eliminate all Commodities under 0.4%
STEPS TO COMPUTE 2016 TARGET WEIGHTS
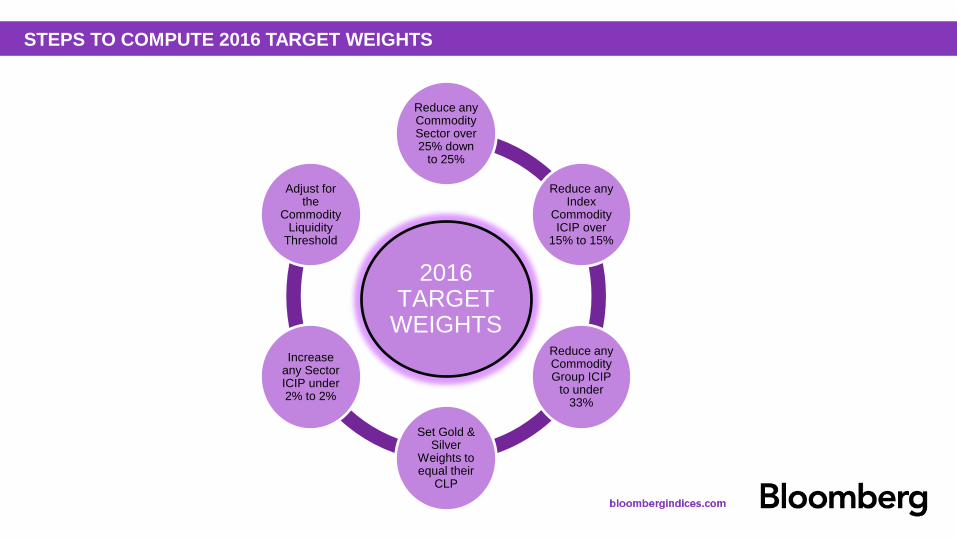
2016 TARGET
WEIGHTS
Reduce any Commodity Sector over 25% down
to 25%
Reduce any Index
Commodity ICIP over
15% to 15%
Reduce any Commodity Group ICIP
to under 33%
Set Gold & Silver
Weights to equal their
CLP
Increase any Sector ICIP under 2% to 2%
Adjust for the
Commodity Liquidity
Threshold
STEPS TO COMPUTE 2016 TARGET WEIGHTS

2016 TARGET WEIGHTS
Sector Commodity Name Ticker 2016
Target Weight Group Weight
Energy
Natural Gas NG 8.4488420%
31.03% WTI Crude Oil CL 7.4697630% Brent Crude Oil CO 7.5302370% ULS Diesel HO 3.8290390% Unleaded Gasoline XB 3.7478780%
Grains
Corn C 7.3587030%
23.22%
Soybeans S 5.7038300% Wheat W 3.3268340% Soybean Oil BO 2.8375480% Soybean Meal SM 2.8446630% HRW Wheat KW 1.1531400%
Industrial Metals
Copper HG 7.6272480%
17.11% Aluminum LA 4.5987080% Zinc LX 2.5276320% Nickel LN 2.3593750%
Precious Metals Gold GC 11.3798610%
15.59% Silver SI 4.2131830%
Softs Sugar SB 3.6272510%
7.41% Coffee KC 2.2943230% Cotton CT 1.4931910%
Livestock Live Cattle LC 3.5666190%
5.63% Lean Hogs LH 2.0621330%

YEAR OVER YEAR TARGET WEIGHT COMPARISON
Commodity Name
Bloomberg Tickers 2016 CIP 2015 CIP YoY % Change
Nickel LN 2.3593750% 2.1193960% 11.32% Live Cattle LC 3.5666190% 3.3273920% 7.19% Lean Hogs LH 2.0621330% 1.9397640% 6.31% Brent Crude CO 7.5302370% 7.1565050% 5.22% Zinc LX 2.5276320% 2.4041340% 5.14% Coffee KC 2.2943230% 2.2121760% 3.71% Soy Meal SM 2.8446630% 2.7453110% 3.62% ULS Diesel (HO) HO 3.8290390% 3.7609190% 1.81% Corn C 7.3587030% 7.2463450% 1.55% Unleaded Gasoline XB 3.7478780% 3.6928490% 1.49% Copper HG 7.6272480% 7.5375780% 1.19% Soybean Oil BO 2.8375480% 2.8129680% 0.87% Soybeans S 5.7038300% 5.6812590% 0.40% Aluminum LA 4.5987080% 4.5931580% 0.12% Wheat (Chicago) W 3.3268340% 3.3276410% -0.02% Cotton CT 1.4931910% 1.5129990% -1.31% Silver SI 4.2131830% 4.2760540% -1.47% Wheat (KC HRW) KW 1.1531400% 1.1705090% -1.48% Natural Gas NG 8.4488420% 8.7397550% -3.33% Gold GC 11.3798610% 11.9041430% -4.40%
Crude Oil CL 7.4697630% 7.8434950% -4.76% Sugar SB 3.6272510% 3.9956530% -9.22%

CURRENT BCOM WEIGHTS VS 2016 TARGET WEIGHTS
Commodity Name Ticker BCOM Weights
as of 10/28/15 2016 Target
Weights Differences
Gold GC 12.8604612% 11.3798610% 1.5178717% Sugar SB 4.4045512% 3.6272510% 0.7591297% WTI Crude Oil CL 8.3212234% 7.4697630% 0.4638005% Corn C 7.6469505% 7.3587030% 0.4604743% Silver SI 4.6833263% 4.2131830% 0.4001597% Cotton CT 1.7450041% 1.4931910% 0.2630357% Natural Gas NG 8.3490478% 8.4488420% 0.2386518% Unleaded Gasoline XB 4.0087300% 3.7478780% 0.1353358% Wheat W 3.2313518% 3.3268340% -0.0364863% ULS Deisel HO 3.8163740% 3.8290390% -0.1117521% HRW Wheat KW 1.0193492% 1.1531400% -0.1164937% Soybean Oil BO 2.6811743% 2.8375480% -0.1448907% Soybean Meal SM 2.5839304% 2.8446630% -0.1902088% Brent Crude Oil CO 7.6018926% 7.5302370% -0.1908736% Soybeans S 5.2803936% 5.7038300% -0.3114151% Zinc LX 2.1801353% 2.5276320% -0.3183666% Aluminum LA 4.2524802% 4.5987080% -0.3194057% Copper HG 7.1792876% 7.6272480% -0.3650773%
Lean Hogs LH 1.6697747% 2.0621330% -0.3768508% Live Cattle LC 3.2030427% 3.5666190% -0.3936149% Coffee KC 1.6738634% 2.2943230% -0.6263719% Nickel LN 1.6076558% 2.3593750% -0.7366527%

GROUP WEIGHT COMPARISON (2015 – 2016)
5.2671560%
7.7208280%
16.6542660%
16.1801970%
22.9840330%
31.1935230%
5.6287520%
7.4147650%
17.1129630%
15.5930440%
23.2247180%
31.0257590%
Livestock
Softs
Industrial Metals
Precious Metals
Grains
Energy
2016
2015

HISTORICAL TARGET WEIGHTS
0.00%2.00%4.00%6.00%8.00%
10.00%12.00%14.00%16.00%
1999
2001
2002
2003
2005
2006
2007
2009
2010
2011
2013
2014
2015
Wei
ghts
Energy
WTI Crude Oil
Brent Crude Oil
ULS Diesel
Unleaded Gas
Natural Gas 0.00%1.00%2.00%3.00%4.00%5.00%6.00%7.00%8.00%9.00%
1999
2001
2002
2003
2005
2006
2007
2009
2010
2011
2013
2014
2015
Wei
ghts
Industrial Metals
Copper (HG)
Aluminum
Nickel
Zinc
*Brent Crude Oil Included In 2012

HISTORICAL TARGET WEIGHTS
0.00%1.00%2.00%3.00%4.00%5.00%6.00%7.00%8.00%9.00%
10.00%
1999
2001
2002
2004
2005
2007
2008
2010
2011
2013
2014
2016
Wei
ghts
Grains
Soybean Oil
Soybean
Soybean Meal
Corn
Chicago Wheat
Kansas City Wheat
0.00%
0.50%
1.00%
1.50%
2.00%
2.50%
3.00%
3.50%
4.00%
4.50%
1999
2001
2002
2003
2004
2005
2006
2008
2009
2010
2011
2012
2013
2015
2016
Wei
ghts
Softs
Cocoa
Cotton
Coffee
Sugar
*Cocoa Excluded In 2005 *Soybean Meal & Kansas City Wheat Included In 2013

HISTORICAL TARGET WEIGHTS
0.00%
1.00%
2.00%
3.00%
4.00%
5.00%
6.00%
7.00%
1999
2001
2002
2003
2004
2005
2006
2007
2008
2009
2010
2011
2012
2014
2015
Wei
ghts
Livestock
Live Cattle
Lean Hogs
0.00%
2.00%
4.00%
6.00%
8.00%
10.00%
12.00%
14.00%
1999
2001
2002
2003
2004
2005
2006
2007
2008
2009
2010
2011
2012
2014
2015
2016
Wei
ghts
Precious Metals
Gold
Silver

FIA VOLUME DATA
Commodity 2010 2011 2012 2013 2014 % Change 2013-2014
Nickel 2,441,740 2,685,474 3,721,483 4,559,497 6,026,366 32.17% Live Cattle 11,332,739 13,532,554 13,985,374 12,463,043 13,599,292 9.12% Corn 69,841,420 79,004,801 73,184,337 64,322,600 69,437,304 7.95% Wheat 5,549,842 6,342,782 5,302,197 5,452,437 5,868,153 7.62% Soybeans 36,933,960 45,143,755 52,041,615 46,721,081 49,169,361 5.24% ULS Diesel 26,970,106 31,838,626 36,087,707 32,749,553 33,946,420 3.65% Wheat (Chicago) 23,090,255 24,283,331 27,379,403 24,993,158 25,853,154 3.44% Aluminum 15,512,393 19,852,777 19,707,861 21,255,968 21,813,230 2.62% Tin 518,090 630,544 615,605 687,300 703,979 2.43% Soy Meal 14,052,845 16,920,194 18,187,433 20,237,181 20,637,382 1.98% Brent Crude 100,022,169 132,045,563 147,385,858 159,093,303 160,425,461 0.84% Zinc 6,021,880 7,328,101 9,853,113 10,090,123 10,107,966 0.18% Unleaded Gas 27,898,698 31,129,256 36,603,841 34,470,288 34,421,866 -0.14% Soybean Oil 20,791,164 24,156,509 27,627,590 23,805,912 23,769,391 -0.15% Lead 2,581,582 3,640,627 4,749,646 4,310,356 4,290,980 -0.45% Platinum 1,486,507 1,993,263 2,621,704 3,262,775 3,235,941 -0.82% Coffee 5,488,196 5,174,538 6,125,484 7,124,029 7,052,230 -1.01% Sugar 29,052,539 24,629,369 27,126,728 29,813,680 29,396,597 -1.40%
Crude Oil 168,652,141 175,036,216 140,531,588 147,690,593 145,147,334 -1.72% Cocoa 3,797,679 4,948,052 5,999,813 6,583,746 6,315,792 -4.07%
Copper 10,305,670 12,491,517 16,158,815 13,495,339 12,937,203 -4.14% Silver 12,826,666 19,608,557 13,315,679 14,475,593 13,696,961 -5.38%
Lean Hogs 8,076,535 9,969,961 11,461,892 11,277,038 10,656,944 -5.50% Cotton 5,732,906 5,288,454 6,130,352 6,155,024 5,787,883 -5.96% Natural Gas 64,323,068 76,864,334 94,799,542 84,282,495 74,206,602 -11.95% Gold 44,730,345 49,175,593 43,893,311 47,294,551 40,518,804 -14.33%

AVERAGE LEAD FUTURES CONTRACT PRICE
* Calculated using the settlement price on the first business day of each month
Commodity 2010 2011 2012 2013 2014 % Change 2013-2014
Coffee $1.60 $2.56 $1.81 $1.27 $1.78 40.29%
Cocoa $2,971.50 $2,989.17 $2,325.50 $2,363.92 $2,985.17 26.28%
Lean Hogs $0.76 $0.90 $0.85 $0.89 $1.05 18.55%
Live Cattle $0.94 $1.15 $1.24 $1.28 $1.50 17.37%
Natural Gas $4.52 $4.21 $2.90 $3.70 $4.30 16.43%
Zinc $2,184.46 $2,266.06 $1,968.52 $1,939.96 $2,156.33 11.15%
Nickel $21,896.92 $23,404.35 $17,664.29 $15,227.96 $16,693.29 9.62%
Aluminum $2,193.39 $2,468.94 $2,059.06 $1,886.69 $1,877.65 -0.48%
Soy Meal $290.92 $349.97 $421.18 $408.72 $403.14 -1.36%
Tin $19,886.67 $26,734.67 $21,128.42 $22,306.67 $21,964.50 -1.53%
Lead $2,161.33 $2,434.08 $2,086.38 $2,171.54 $2,119.44 -2.40%
Crude Oil $80.37 $96.36 $95.24 $97.39 $94.21 -3.26%
Sugar $0.22 $0.27 $0.22 $0.18 $0.17 -5.65%
Brent Crude $80.90 $110.49 $110.90 $107.84 $101.37 -6.00%
ULS Diesel $2.16 $2.97 $3.03 $2.99 $2.81 -6.11% Unleaded Gas $2.13 $2.82 $2.88 $2.83 $2.65 -6.45% Copper $7,522.72 $9,027.01 $8,026.48 $7,383.46 $6,896.06 -6.60%
Platinum $1,606.95 $1,746.80 $1,559.76 $1,495.28 $1,392.24 -6.89%
Cotton $0.89 $1.36 $0.80 $0.83 $0.76 -7.57%
Soybeans $10.24 $13.32 $14.54 $13.56 $12.18 -10.14%
Wheat $5.99 $8.20 $7.85 $7.43 $6.67 -10.19%
Gold $1,214.57 $1,563.86 $1,679.78 $1,432.57 $1,261.05 -11.97%
Wheat (Chicago) $5.79 $7.23 $7.55 $6.92 $5.91 -14.62%
Soybean Oil $0.41 $0.56 $0.53 $0.46 $0.37 -19.91%
Silver $19.71 $35.53 $31.67 $24.28 $19.11 -21.32%
Corn $4.21 $6.77 $6.93 $5.72 $4.19 -26.82%

WORLD PRODUCTION DATA
Commodity Reporting Unit 2008 2009 2010 2011 2012 % Change
2011-2012 Coffee Thous. Met Tons 8,499 7,789 8,468 8,395 9,210 9.71% Nickel Metric Tons 1,390,000 1,370,000 1,440,000 1,620,000 1,760,000 8.64% Silver Metric Tons 21,300 22,300 23,900 24,100 25,500 5.81% Aluminum Thous. Met Tons 39,700 37,300 41,200 44,400 45,900 3.38% Pork Thous. Met Tons 102,944 104,965 107,571 108,017 111,398 3.13% Crude Petroleum Thous. Barrels 31,598,009 31,294,663 32,162,546 32,315,726 33,018,468 2.17% Copper Thous. Met Tons 18,300 18,300 19,100 19,700 20,100 2.03% Cotton Thous. Met Tons 22,459 20,877 23,591 26,130 26,532 1.54% Natural Gas Billion Cubic Feet 35,187 34,961 35,484 37,020 37,569 1.48% Lead Thous. Met Tons 8,730 8,860 9,530 10,100 10,200 0.99% Gold Kilograms 2,300,000 2,480,000 2,580,000 2,670,000 2,690,000 0.75% Beef & Fresh Veal Thous. Met Tons 62,518 62,525 63,071 62,746 63,177 0.69% Cocoa Thous. Met Tons 4,266 4,212 4,341 4,627 4,646 0.40% Corn Thous. Met Tons 830,611 820,203 851,257 887,665 877,924 -1.10% Zinc Thous. Met Tons 11,700 11,400 12,800 13,200 12,800 -3.03% Wheat Thous. Met Tons 683,207 686,720 649,325 699,373 671,482 -3.99% Tin Metric Tons 334,000 327,000 335,000 337,000 321,000 -4.75% Soybeans Thous. Met Tons 231,272 223,411 265,120 261,886 240,971 -7.99% Platinum Kilograms 193,000 184,000 192,000 200,000 183,000 -8.50%

COMMODITY CONVERSION FACTORS
Commodity Production Units Production Size Factor Contract Terms Conversion
Factor
Natural Gas Cubic Feet 35,464 1 10000 mmbtu 1,000,000.00 Crude Petroleum Barrels 31,782,935 1000 1000 bbl 1 Beef & Fresh Veal Thous Met Tons 63,188 1000 40000 lbs 3,486.43 Pork Thous Met Tons 107,417 1000 40000 lbs 2,204.62 Wheat Thous Met Tons 651,907 1000 5000 bu 36.7437 Corn Thous Met Tons 849,792 1000 5000 bu 39.3683
Soybeans Thous Met Tons 265,050 1000 5000 bu 36.7437
Aluminum Thous Met Tons 40,800 1000 25 mtons 1 Copper Thous Met Tons 19,100 1000 25000 lbs 1 Zinc Thous Met Tons 12,700 1000 25 mtons 1 Nickel Metric Tons 1,470,000 1 6 mtons 1 Lead Thous Met Tons 9,490 1000 25 mtons 1 Tin Metric Tons 350,000 1 5 mtons 1 Gold Kilograms 2,560,000 1 100 oz 32.1508 Silver Metric Tons 23,100 1 5000 oz 32,150.75 Platinum Kilograms 192,000 1 50 oz 32.1508
Sugar Thous Met Tons 156,556 1000 112000 lbs 2,204.62
Cotton Thous Met Tons 23,711 1000 50000 lbs 2,204.62 Coffee Thous Met Tons 8,304 1000 37500 lbs 2,204.62
Cocoa Thous Met Tons 4,292 1000 10 tons 1

Bloombergindices.com
BLOOMBERG and BLOOMBERG INDICES are trademarks or service marks of Bloomberg Finance L.P. Bloomberg Finance L.P. and its affiliates ("collectively, "Bloomberg") or Bloomberg's licensors own all proprietary right in the BLOOMBERG INDICES. Bloomberg does not guarantee the timeliness, accuracy or completeness of any data or information relating to BLOOMBERG INDICES. Bloomberg makes no warranty, express or implied, as to the BLOOMBERG INDICES or any data or values relating thereto or results to be obtained therefrom, and expressly disclaims all warranties of merchantability and fitness for a particular purpose with respect thereto. It is not possible to invest directly in an index. Back-tested performance is not actual performance. Past performance is not an indication of future results. To the maximum extent allowed by law, Bloomberg, its licensors, and its and their respective employees, contractors, agents, suppliers and vendors shall have no liability or responsibility whatsoever for any injury or damages - whether direct, indirect, consequential, incidental, punitive or otherwise - arising in connection with BLOOMBERG INDICES or any data or values relating thereto - whether arising from their negligence or otherwise. This document constitutes the provision of factual information, rather than financial product advice. Nothing in the BLOOMBERG INDICES shall constitute or be construed as an offering of financial instruments or as investment advice or investment recommendations (i.e., recommendations as to whether or not to “buy”, “sell”, “hold”, or to enter or not to enter into any other transaction involving any specific interest or interests) by Bloomberg or its affiliates or a recommendation as to an investment or other strategy by Bloomberg or its affiliates. Data and other information available via the BLOOMBERG INDICES should not be considered as information sufficient upon which to base an investment decision. All information provided by the BLOOMBERG INDICES is impersonal and not tailored to the needs of any person, entity or group of persons. Bloomberg and its affiliates do not express an opinion on the future or expected value of any security or other interest and do not explicitly or implicitly recommend or suggest an investment strategy of any kind. Customers should consider obtaining independent advice before making any financial decisions.