Embed Size (px)
Citation preview
American Institute of Aeronautics and Astronautics
1
Blunt-Body Aerothermodynamic Database from High-Enthalpy CO2 Testing in an Expansion Tunnel
Brian R. Hollis*
NASA Langley Research Center, Hampton, VA 23681
Dinesh K. Prabhu†
Analytical Mechanics Associates, Inc., Moffett Field, CA 94035
Matthew Maclean‡, Aaron Dufrene‡
Calspan-University at Buffalo Research Center, Buffalo, NY, 14225
An extensive database of heating, pressure, and flow field measurements on a 70-deg sphere-cone blunt body geometry in high-enthalpy, CO2 flow has been generated through testing in an expansion tunnel. This database is intended to support development and validation of computational tools and methods to be employed in the design of future Mars missions. The test was conducted in an expansion tunnel in order to avoid uncertainties in the definition of free stream conditions noted in previous studies performed in reflected shock tunnels. Data were obtained across a wide range of test velocity/density conditions that produced various physical phenomena of interest, including laminar and transitional/turbulent boundary layers, non-reacting to completely dissociated post-shock gas composition and shock-layer radiation. Flow field computations were performed at the test conditions and comparisons were made with the experimental data. Based on these comparisons, it is recommended that computational uncertainties on surface heating and pressure, for laminar, reacting-gas environments can be reduced to ±10% and ±5%, respectively. However, for flows with turbulence and shock-layer radiation, there were not sufficient validation-quality data obtained in this study to make any conclusions with respect to uncertainties, which highlights the need for further research in these areas.
Nomenclature Af,j = rate coefficient for forward reaction j (m3/kmol.s) Df,j = characteristic temperature of forward reaction j (K) H0 = total enthalpy (J/kg) Hw = wall enthalpy (J/kg) Kc = equilibrium constant (-) or (kmol/m3) kb,j = backward rate for reaction j (m3/kmol.s) or (m6/kmol2.s) kf,j = forward rate for reaction j (m3/kmol.s) M∞ = free stream Mach number P∞ = free stream pressure (Pa) P0,2 = post-shock pitot pressure (Pa) qw = heat-transfer rate at the wall (W/m2) Re∞,D = free stream Reynolds Number based on diameter - ρ∞U∞D/µ∞ Reθ = momentum thickness Reynolds Number - ρeUeθ/µe Ta,j = controlling temperature for forward reaction j (K) T∞ = free stream temperature (K) Tw = wall temperature (K) U∞ = free stream velocity (m/s) Ue = boundary layer edge velocity (m/s)
* Associate Fellow AIAA, Senior Technical Lead, Aerothermodynamics Branch, Research Directorate † Associate Fellow AIAA, Senior Scientist ‡ Senior Member AIAA, Senior Research Scientist
https://ntrs.nasa.gov/search.jsp?R=20160010149 2020-01-31T00:09:01+00:00Z
American Institute of Aeronautics and Astronautics
2
z = Cartesian distance from nose along symmetry plane (m) nf,i = rate exponent for forward reaction j γ,i = catalytic efficiency of reaction j µ∞ = free stream viscosity (kg/m.s) µe = boundary layer edge viscosity (kg/m.s) ρ∞ = free stream density (kg/m3) ρe = boundary layer edge density (kg/m3) θ = boundary layer momentum thickness (m) [i] = mass fraction of species i
I. Background and Introduction While NASA has a long history of Mars exploration, missions to-date have all been performed using relatively
small robotic orbiters and/or landers, whereas future missions under consideration, including sample return and human exploration, will require new vehicle architectures with greater performance requirements. Among the requirements identified by systems analysis studies (e.g,. Refs. 1-4 for future Mars mission are order-of-magnitude increase in payload landing mass (currently < 1 t), an order-of–magnitude reduction in landing footprint (currently > 10 km), and an order-of-magnitude reduction in aerothermodynamic environment margins (currently > 50%) for Thermal Protection System (TPS), where the state-of-the-art for these requirements is based on those developed for the Mars Science Laboratory mission (Refs. 5-6).
One of the key enablers for meeting these requirements is the validation and improvement of Computational Fluid Dynamics (CFD) tools used in the simulation of Entry, Descent and Landing (EDL) on Mars. These tools provide the aerodynamic and aeroheating environments used in the design of the EDL system. As sources of flight data have been very limited until the recent MEDLI (Mars Science Laboratory Entry, Descent and Landing Instrumentation) data set obtained (Ref. 7) during the Mars Science Laboratory (MSL) mission, validation efforts for CFD tools have primarily relied on comparisons to experimental ground test data. However, as shown in a recent survey of Mars-relevant ground tests (Ref. 8), there are large differences between the experimental data and numerical predictions and these differences are attributable, at least in part, to the quality of the ground test data.
To address the lack of high-fidelity ground test data, a test program has been conducted to obtain convective heating and surface pressure data, as well as a limited amount of shock-layer radiation data, on a blunt-body in high-enthalpy CO2. Preliminary results from this study have been presented in Ref. 9. This test program was conducted in the CUBRC LENS-XX Expansion Tunnel across a wide range of densities and velocities using a 70-deg sphere-cone heat shield design similar to the MSL entry vehicle. Surface convective and radiative heat-transfer data and pressure data were obtained through an instrumentation suite consisting of platinum thin-film gauges, chromel-constantan coaxial thermocouples, piezoelectric pressure transducers and radiometers. Flow field shock-shape imagery was also generated through schlieren photography. These data have been compared to CFD simulations performed at the test conditions in order to better define uncertainties for NASA computational tools and the results are presented herein.
The selection of the CUBRC LENS-XX Expansion Tunnel for this test program addresses one of the key deficiencies identified in the survey of historical data sets (as listed in Ref. 8), which is the undefined, but presumably large, uncertainty in free stream conditions owing to non-equilibrium vibrational and/or chemical excitation produced by the operational mode of reflected shock tunnels. This uncertainty can largely be eliminated through testing in an expansion tunnel environment, in which higher velocities are produced through unsteady expansion into a low-pressure section rather than by processing the flow through a reflected shock.
II. Experimental Method
A. LENS-XX Expansion Tunnel The CUBRC LENS-XX Expansion Tunnel facility generates test flows in a unique manner that is very different
from other high-enthalpy facility types. The expansion tunnel consists of three shock-tube segments that are filled with: (1) a low-molecular weight driver gas (hydrogen or helium), (2) the test gas (in this case, carbon dioxide), and (3) a low-pressure accelerator gas (air or hydrogen). Conditions in the three segments of the facility are tailored to process the test gas through two unsteady processes to achieve a target test condition. The test gas is first set into motion by rupture of the primary diaphragm that separates the first and second segments to produce an unsteady, traveling shock of weak to moderate strength. This shock ruptures the secondary diaphragm that separates the second and third segments, causing the test gas to be processed through an unsteady acceleration to increase its
American Institute of Aeronautics and Astronautics
3
velocity. The moving test gas is contained between a leading contact surface with the acceleration gas and behind by the unsteady expansion fan, resulting in test durations over the model on the order of one millisecond.
The unique benefit of the expansion tunnel mode of operation is that the majority of the total enthalpy in the test gas is added as kinetic energy directly by the unsteady expansion process, rather than through a shock reflection. Since the free stream gas is not stagnated before it reaches the test article, the peak thermal temperature of the flow is substantially lower than it is for other high enthalpy facilities that expand from a stagnant reservoir. As a result, the expansion tunnel free stream flow is generally not subject to the non-equilibrium chemical and vibrational excitation present in reflected shock tunnels, greatly reducing the uncertainties in specification of the test conditions.
Additional description of the LENS-XX expansion tunnel and blunt body data collected during recent experimental programs can be found in Refs. 10-12.
B. 48-Inch Reflected Shock Tunnel In addition to the data acquired in the LENS-XX Expansion Tunnel, a limited number of shots were also
performed in CO2 in the Calspan 48-Inch Reflected Shock Tunnel (RST). Although the stated goal of the study was to obtain data in an expansion tunnel environment, the additional shots in the 48-Inch RST were performed because the facility was available and was capable of generating higher Reynolds number, but lower enthalpy conditions than the LENS-XX Expansion Tunnel. The higher Reynolds number shots were desirable to explore the possibility of obtaining turbulent data, of which only a limited amount could be obtained over the range of LENS-XX operating conditions using the MSL geometry. Also, the enthalpy levels at the test conditions were so low that free stream non-equilibrium effects due to processing of the flow by the reflected shock were expected to be negligible, in contrast to previous tests performed in reflected shock tunnels (Ref. 8).
C. Test Conditions Determination of test conditions for LENS-XX was performed using the CHEETAh (CUBRC High Enthalpy
Expansion Tunnel Analysis) code (Ref. 13). This code solves for the intermediate states of the primary and secondary wave systems incorporating equilibrium chemistry, ionization, and thermodynamic excitation mechanisms. It also can incorporate measured, as-run data from the facility for each shot to anchor the calculations, including shock wave speeds, Pitot and/or static pressure, and, in some cases, free stream velocity.
Beginning midway through the test series, a Tunable Diode Laser Absorption Spectroscopy (TDLAS) system was used to measure the free stream velocity through a new laser tuned to a rotational-vibrational transition of carbon dioxide located near 2715.3 nm using the Doppler shift technique (Ref. 14). These TDLAS measurements were incorporated into the CHEETAh data reduction process to anchor the free stream velocity and to better define the arrival time and duration of the free stream test gas.
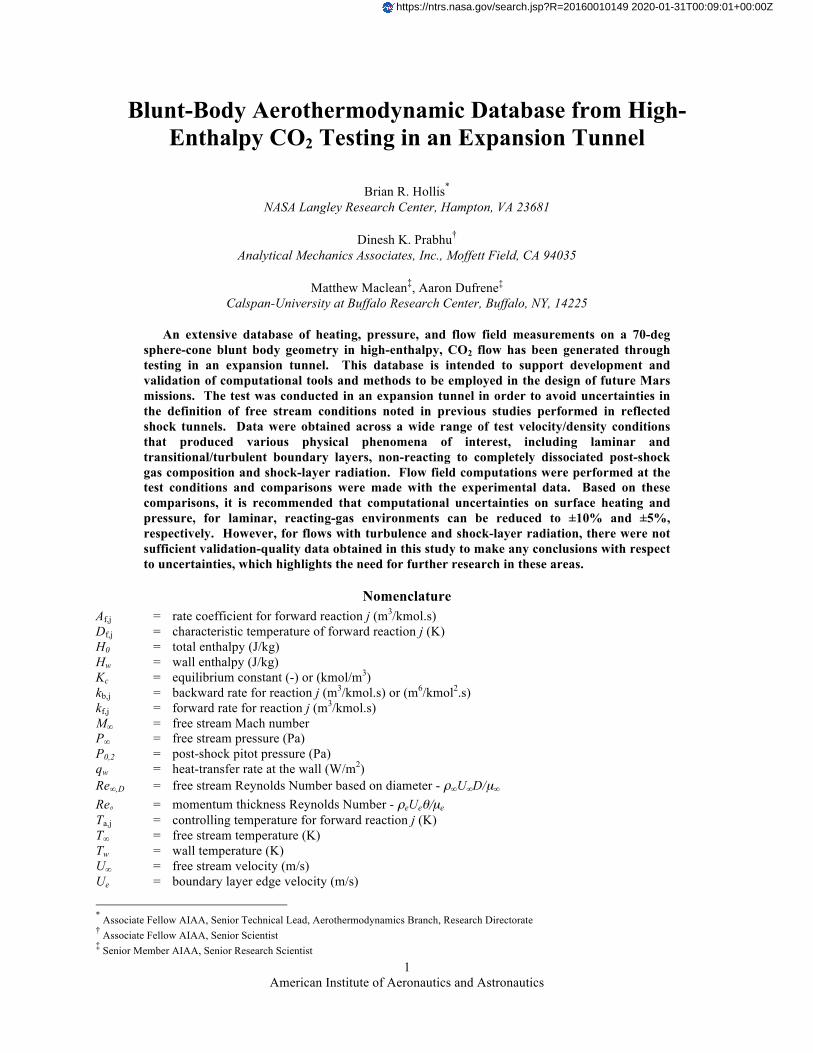
D. Model Geometry and Instrumentation Testing was performed using an 8-in. diameter, 70-deg sphere-cone model similar to the MSL entry vehicle
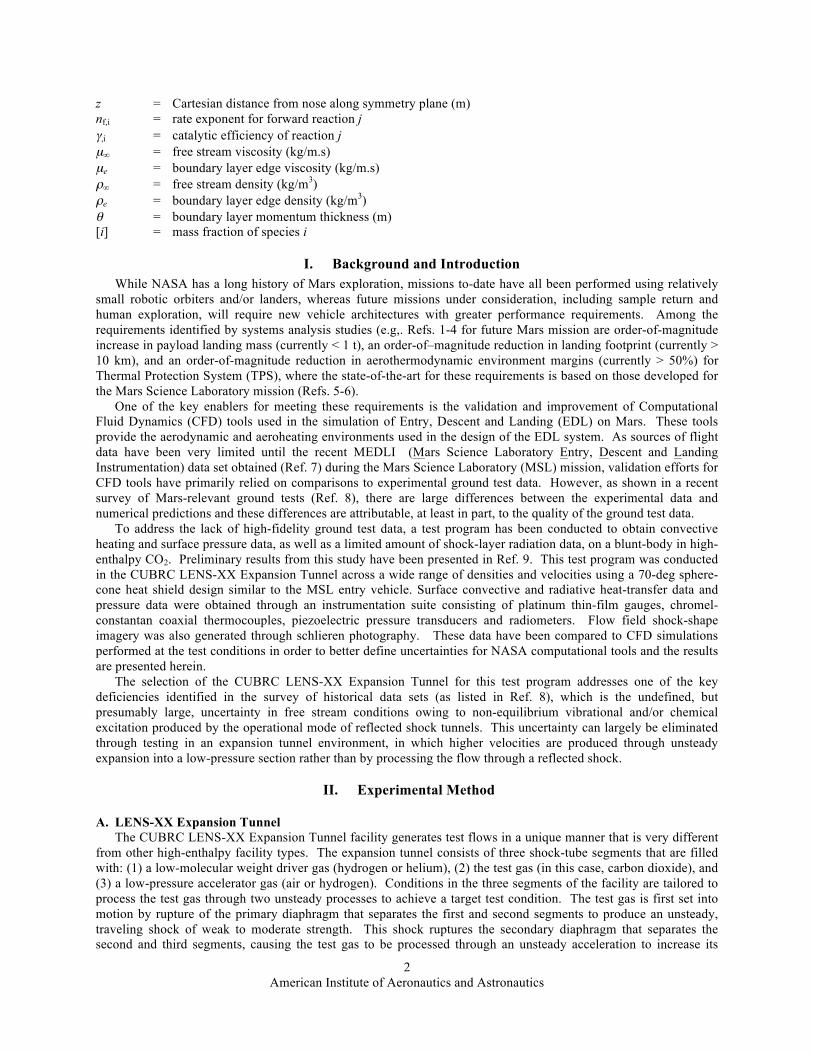
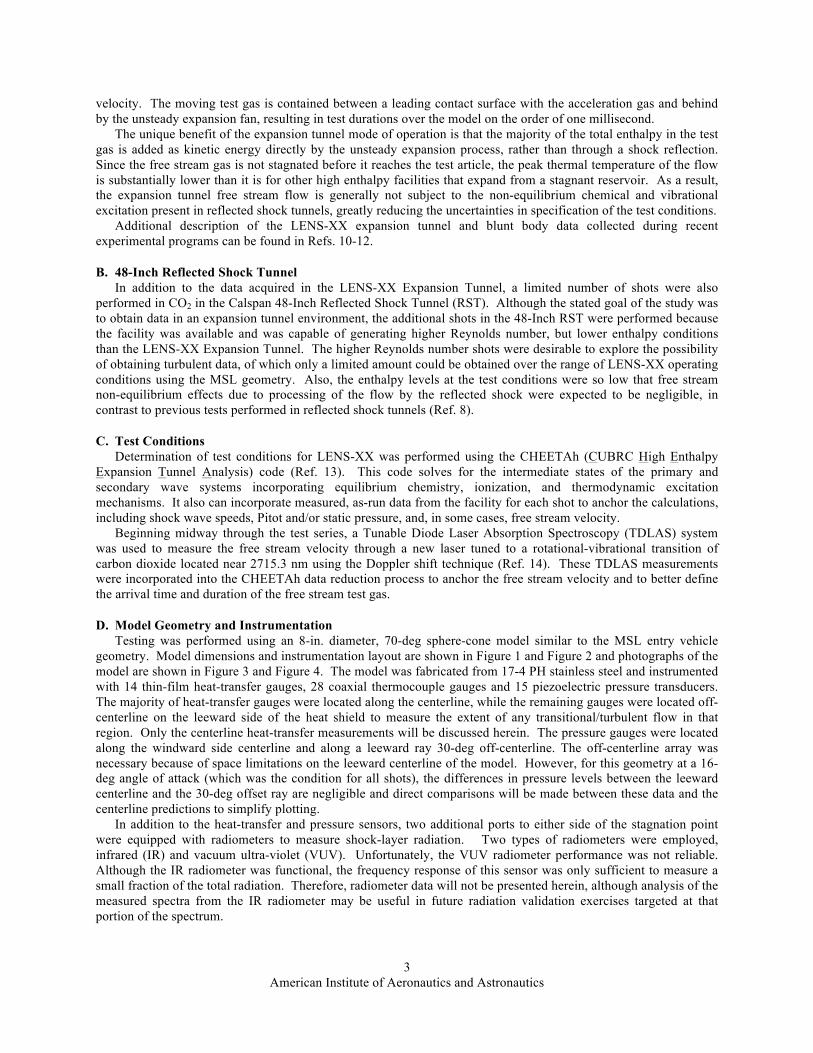
geometry. Model dimensions and instrumentation layout are shown in Figure 1 and Figure 2 and photographs of the model are shown in Figure 3 and Figure 4. The model was fabricated from 17-4 PH stainless steel and instrumented with 14 thin-film heat-transfer gauges, 28 coaxial thermocouple gauges and 15 piezoelectric pressure transducers. The majority of heat-transfer gauges were located along the centerline, while the remaining gauges were located off-centerline on the leeward side of the heat shield to measure the extent of any transitional/turbulent flow in that region. Only the centerline heat-transfer measurements will be discussed herein. The pressure gauges were located along the windward side centerline and along a leeward ray 30-deg off-centerline. The off-centerline array was necessary because of space limitations on the leeward centerline of the model. However, for this geometry at a 16-deg angle of attack (which was the condition for all shots), the differences in pressure levels between the leeward centerline and the 30-deg offset ray are negligible and direct comparisons will be made between these data and the centerline predictions to simplify plotting.
In addition to the heat-transfer and pressure sensors, two additional ports to either side of the stagnation point were equipped with radiometers to measure shock-layer radiation. Two types of radiometers were employed, infrared (IR) and vacuum ultra-violet (VUV). Unfortunately, the VUV radiometer performance was not reliable. Although the IR radiometer was functional, the frequency response of this sensor was only sufficient to measure a small fraction of the total radiation. Therefore, radiometer data will not be presented herein, although analysis of the measured spectra from the IR radiometer may be useful in future radiation validation exercises targeted at that portion of the spectrum.
American Institute of Aeronautics and Astronautics
4
Figure 1. Model geometry Figure 2. Model instrumentation layout
Figure 3. Model front view Figure 4. Model side view
E. Uncertainty Analysis CUBRC has provided a general uncertainty analysis for each sensor type (surface pressure, thin-film and
thermocouple) to obtain nominal uncertainties of ±6%, ±9% and ±13%, respectively. These values represent root-sum-squared combination of uncertainties due to instrumentation calibration, signal collection, substrate material properties (used in heat-transfer data reduction), flow field pressure and velocity fluctuations and the “stagnation heating augmentation” phenomena observed in numerous blunt body heating studies (Ref. 15). This analysis provides nominal values for general discussion of uncertainties.
An additional analysis has also been performed to disambiguate the traceable instrumentation uncertainties from flow-field uncertainties that rely on estimates of fluctuations (and the stagnation augmentation phenomena) and are applied uniformly to all shots. These “instrumentation-only” uncertainties are then determined as per Table 1.
Pressure sensor
Radiometer
Thermocouple
Thin-film

American Institute of Aeronautics and Astronautics
5
Table 1. Instrumentation-Only Uncertainties
Pressure Thin-film Thermocouple Instrument Calibration ±0.6% ±0.22% ±5%
Signal Collection and Processing ±2% ±2% ±2% Substrate Material Properties N/A ±2.5% N/A
Instrumentation Only Root-Sum-Square ±2.1% ±3.2% ±5.4%
Next, a run-specific and sensor-specific uncertainty is added to these instrumentation-only values. The root-mean-square (RMS) deviation of each individual sensor over the time-averaging data acquisition window is computed and these values are then added to the instrumentation-only uncertainty through a root-sum-square calculation. This RMS component accounts for two uncertainty sources: the effects of flow-field fluctuations over the data-averaging period and also any degradation of individual sensor performance over the course of the test program. These “sensor-specific” values will be used to denote uncertainties on data plots in the Analysis and Results section. As these values vary from run-to-run and sensor-to-sensor, it is not possible to provide a single value to represent sensor-specific uncertainties for each sensor as it was for the nominal uncertainties presented at the beginning of this section.
With respect to sensor performance, it should be noted that high-enthalpy test environments are known to have adverse effects on the function of sensors, due primarily to particulate damage from fragments of the diaphragm that initially separate the high and low pressure sections of the facility. The instrumentation suite was refurbished several times over the course of this test program, however it was not practical to do this after every shot. Thus some performance degradation was evident for various shots, most notably in the high-enthalpy shots (31 through 34) at the end of the test program. For these shots, all thin-film sensors and several of the thermocouples were rendered inoperative by the end of the test program.
III. Computational Methods
A. Flow Field Solvers Flow field computations were performed at the test conditions using the NASA LAURA (Langley Upwind
Aerothermodynamic Relaxation Algorithm) and DPLR (Data-Parallel Line Relaxation) codes (Refs. 16, 17). These codes represent the current NASA state-of-the-art for Navier-Stokes simulations of chemically reacting hypersonic flows and have been used extensively in the design of all NASA Mars missions since Mars Pathfinder. Both codes are three-dimensional, finite-volume solvers with non-equilibrium chemical and vibrational modeling capabilities. For simulation of the LENS-XX test conditions, the default model was two-temperature, laminar flow with 5 species (CO2, CO, O2, C and O). Depending on test conditions, radiation transport, turbulence and various wall-catalysis models were also employed. An isothermal, cold-wall (Tw = 300 K) temperature boundary condition was specified since even at the highest enthalpy test condition, the maximum temperature increase over the data acquisition interval was only 25 K.
B. Kinetic Models The kinetic reaction rate models employed in this study were developed for Mars simulations with LAURA and
DPLR and are listed in Table 2 and Table 3. The data are presented in modified Arrhenius form for the forward reactions with the backward reactions determined via the equilibrium constant, as per Equations (1)-(2). The kinetic data set used for LAURA is detailed in Ref. 18 and the kinetic data set used for DPLR is detailed in Ref. 19. Although some of the reaction rate data in the two models differ slightly, these differences were not found to have significant effects on the flow field solutions
These kinetic models were developed using data obtained through shock-tube testing at Mars-relevant conditions. As such, these references include the full reaction set for Mars simulations including N2-based reactions, and ionization and electronic excitation processes. However, for this study in which the initial test gas state consisted of 100% CO2, only the reactions relevant to the (CO2, CO, O2, O, C) species set were employed. This species set is sufficient for all the CUBRC LENS-XX test conditions except for several very high enthalpy shots performed at the end of the test series. For those cases, there was likely some small amount of ionization; however, more computationally intensive simulations with additional species and the associated radiation mechanisms have not yet been performed.
American Institute of Aeronautics and Astronautics
6
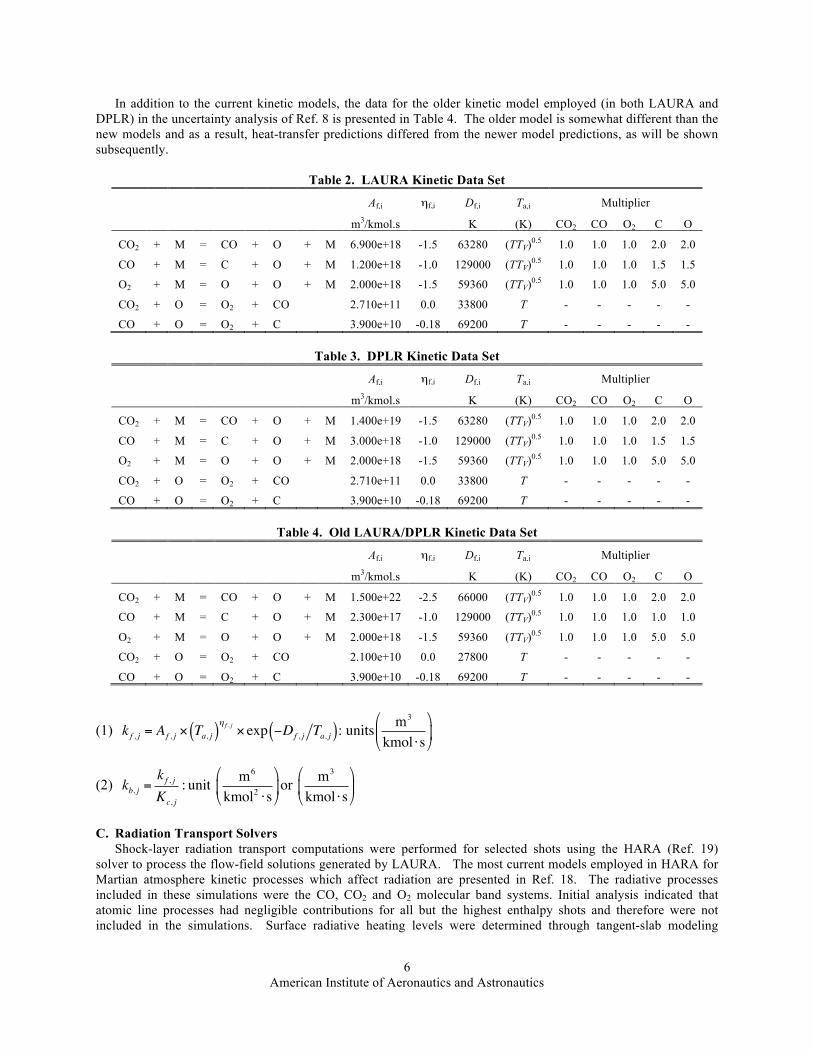
In addition to the current kinetic models, the data for the older kinetic model employed (in both LAURA and DPLR) in the uncertainty analysis of Ref. 8 is presented in Table 4. The older model is somewhat different than the new models and as a result, heat-transfer predictions differed from the newer model predictions, as will be shown subsequently.
Table 2. LAURA Kinetic Data Set
Af,i ηf,i Df,i Ta,i Multiplier
m3/kmol.s
K (K) CO2 CO O2 C O
CO2 + M = CO + O + M 6.900e+18 -1.5 63280 (TTV)0.5 1.0 1.0 1.0 2.0 2.0
CO + M = C + O + M 1.200e+18 -1.0 129000 (TTV)0.5 1.0 1.0 1.0 1.5 1.5
O2 + M = O + O + M 2.000e+18 -1.5 59360 (TTV)0.5 1.0 1.0 1.0 5.0 5.0
CO2 + O = O2 + CO
2.710e+11 0.0 33800 T - - - - -
CO + O = O2 + C
3.900e+10 -0.18 69200 T - - - - -
Table 3. DPLR Kinetic Data Set
Af,i ηf,i Df,i Ta,i Multiplier
m3/kmol.s
K (K) CO2 CO O2 C O
CO2 + M = CO + O + M 1.400e+19 -1.5 63280 (TTV)0.5 1.0 1.0 1.0 2.0 2.0
CO + M = C + O + M 3.000e+18 -1.0 129000 (TTV)0.5 1.0 1.0 1.0 1.5 1.5
O2 + M = O + O + M 2.000e+18 -1.5 59360 (TTV)0.5 1.0 1.0 1.0 5.0 5.0
CO2 + O = O2 + CO
2.710e+11 0.0 33800 T - - - - -
CO + O = O2 + C
3.900e+10 -0.18 69200 T - - - - -
Table 4. Old LAURA/DPLR Kinetic Data Set
Af,i ηf,i Df,i Ta,i Multiplier
m3/kmol.s
K (K) CO2 CO O2 C O
CO2 + M = CO + O + M 1.500e+22 -2.5 66000 (TTV)0.5 1.0 1.0 1.0 2.0 2.0
CO + M = C + O + M 2.300e+17 -1.0 129000 (TTV)0.5 1.0 1.0 1.0 1.0 1.0
O2 + M = O + O + M 2.000e+18 -1.5 59360 (TTV)0.5 1.0 1.0 1.0 5.0 5.0
CO2 + O = O2 + CO
2.100e+10 0.0 27800 T - - - - -
CO + O = O2 + C
3.900e+10 -0.18 69200 T - - - - -
(1) k f , j = Af , j × Ta, j( )η f , j × exp −Df , j Ta, j( ): units m3
kmol ⋅s$
%&
'
()
(2) kb, j =k f , jKc, j
: unit m6
kmol2 ⋅s"
#$
%
&'or m3
kmol ⋅s"
#$
%
&'
C. Radiation Transport Solvers Shock-layer radiation transport computations were performed for selected shots using the HARA (Ref. 19)
solver to process the flow-field solutions generated by LAURA. The most current models employed in HARA for Martian atmosphere kinetic processes which affect radiation are presented in Ref. 18. The radiative processes included in these simulations were the CO, CO2 and O2 molecular band systems. Initial analysis indicated that atomic line processes had negligible contributions for all but the highest enthalpy shots and therefore were not included in the simulations. Surface radiative heating levels were determined through tangent-slab modeling

American Institute of Aeronautics and Astronautics
7
assumptions. The radiation predictions are provided for informative purposes, as the sufficient radiation data were not obtained for direct comparisons with predictions
D. Surface Catalysis and Wall Temperature The specification of the catalysis boundary for surface recombination of dissociated species has a direct
influence on surface heating predictions that increases with total flow field enthalpy. Considerable uncertainty exists as to the proper specification of boundary conditions for ground tests such as this one in which metallic models are tested at low wall temperatures. This uncertainty resulted in part from the results of previous test programs which are now considered mostly invalid as per the assessment presented in Ref. 8.
For this study, the decision was made to bound the range of catalysis effects by performing simulations with “non-catalytic” and “fully-catalytic” boundary conditions. This specification refers to the catalytic efficiency imposed on the homogeneous atomic recombination reactions O + O → O2, C + C → C2, and N + N → N2 (although only the oxygen reaction is relevant to this study). Other reactions are treated as non-catalytic. These boundary conditions were employed for all but the lowest enthalpy test conditions for which chemical reactions were negligible.
The catalytic efficiency, γι, is defined as:
(3) γ i =0: non-catalytic1:fully-catalytic
!"#
$#
In addition to these physically realistic boundary conditions, the so-called “super-catalytic” boundary condition was also employed for selected cases. The super-catalytic boundary condition produces the highest possible surface heating prediction by arbitrarily forcing all species to recombine to the free stream state. While this boundary condition is physically unlikely, it has typically been employed as a conservative limit for the design of flight-vehicle TPS (e.g., Mars Science Laboratory). For this test series, in which the free stream was partially dissociated for several of the highest enthalpy conditions, the super-catalytic boundary condition was defined as recombination to the original reservoir state of 100% CO2, not to the dissociated free stream condition. This super-catalytic model is now considered to be a poor choice for representation of ground test data and the simulations with this boundary condition were performed to further reinforce that point.
Finally, specified efficiencies for the homogeneous atomic recombination of O were considered for selected cases by setting a logarithmic variation of γO of 0.001, 0.010 and 0.100. These simulations were performed to demonstrate the effects of catalytic efficiency of this reaction on surface heating. It is noteworthy that a recent investigation (Ref. 20) of metallic surface catalysis found room-temperature efficiencies for this reaction ranging from 0.046 to 0.0053 for different materials. Additionally, since no catalytic effects were found for the other reactions, the existing catalytic efficiency data are bounded by this range of values for γO.
E. Transition and Turbulence Models The majority of shots in this test series produced completely laminar boundary layers; however, a small subset of
shots produced transitional flow on the leeward side of the sphere-cone forebody with possibly small regions of fully-developed turbulent flow. For these shots, simulations were performed using the algebraic Baldwin-Lomax (Ref. 21) turbulence model in both LAURA and DPLR, and additionally with the algebraic Cebeci-Smith (Ref. 22) in LAURA. For all cases, the flow was treated as fully-turbulent over the entire model.
IV. Results and Analysis
A. Overview of Test Conditions A total of 34 shots were performed in the LENS-XX Expansion Tunnel and 6 shots in the 48-Inch RST, all at a
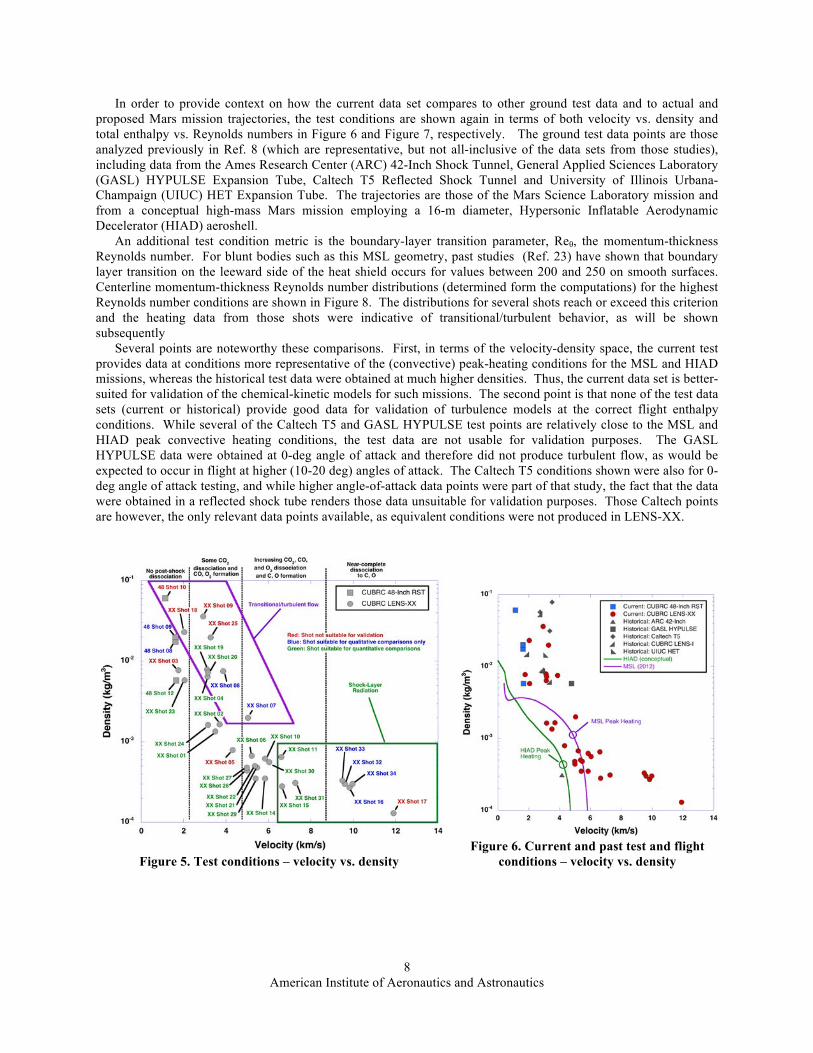
16-deg angle of attack. Of these, 31 shots in LENS-XX and 4 shots in the 48-Inch RST produced test data; for the remaining shots either data acquisition problems or facility operational issues occurred. The test matrix, shown in Figure 5 in terms of free stream velocity vs. density, spanned a wide range of conditions in order to obtain data on different physical phenomena, i.e., boundary-layer transition and turbulent heating, thermo-chemical kinetics and shock-layer radiation. Data and comparisons with predictions will be presented in groups of shots spanning each regime. The shot labels in this figure are color-coded to identify those shots that produced validation-quality data (green), data suitable only for qualitative comparisons (blue), or bad shots that did not produce usable data (red). The rationale for these classifications will be discussed in the next section.
American Institute of Aeronautics and Astronautics
8
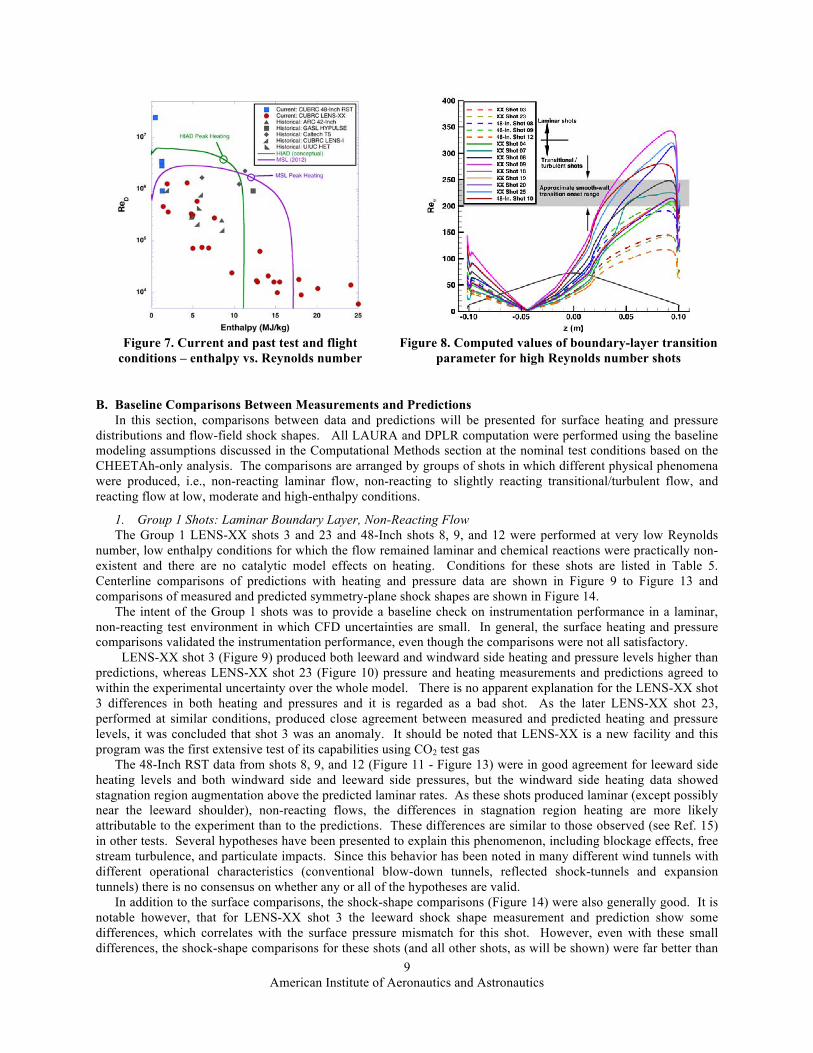
In order to provide context on how the current data set compares to other ground test data and to actual and proposed Mars mission trajectories, the test conditions are shown again in terms of both velocity vs. density and total enthalpy vs. Reynolds numbers in Figure 6 and Figure 7, respectively. The ground test data points are those analyzed previously in Ref. 8 (which are representative, but not all-inclusive of the data sets from those studies), including data from the Ames Research Center (ARC) 42-Inch Shock Tunnel, General Applied Sciences Laboratory (GASL) HYPULSE Expansion Tube, Caltech T5 Reflected Shock Tunnel and University of Illinois Urbana-Champaign (UIUC) HET Expansion Tube. The trajectories are those of the Mars Science Laboratory mission and from a conceptual high-mass Mars mission employing a 16-m diameter, Hypersonic Inflatable Aerodynamic Decelerator (HIAD) aeroshell.
An additional test condition metric is the boundary-layer transition parameter, Reθ, the momentum-thickness Reynolds number. For blunt bodies such as this MSL geometry, past studies (Ref. 23) have shown that boundary layer transition on the leeward side of the heat shield occurs for values between 200 and 250 on smooth surfaces. Centerline momentum-thickness Reynolds number distributions (determined form the computations) for the highest Reynolds number conditions are shown in Figure 8. The distributions for several shots reach or exceed this criterion and the heating data from those shots were indicative of transitional/turbulent behavior, as will be shown subsequently
Several points are noteworthy these comparisons. First, in terms of the velocity-density space, the current test provides data at conditions more representative of the (convective) peak-heating conditions for the MSL and HIAD missions, whereas the historical test data were obtained at much higher densities. Thus, the current data set is better-suited for validation of the chemical-kinetic models for such missions. The second point is that none of the test data sets (current or historical) provide good data for validation of turbulence models at the correct flight enthalpy conditions. While several of the Caltech T5 and GASL HYPULSE test points are relatively close to the MSL and HIAD peak convective heating conditions, the test data are not usable for validation purposes. The GASL HYPULSE data were obtained at 0-deg angle of attack and therefore did not produce turbulent flow, as would be expected to occur in flight at higher (10-20 deg) angles of attack. The Caltech T5 conditions shown were also for 0-deg angle of attack testing, and while higher angle-of-attack data points were part of that study, the fact that the data were obtained in a reflected shock tube renders those data unsuitable for validation purposes. Those Caltech points are however, the only relevant data points available, as equivalent conditions were not produced in LENS-XX.
Figure 5. Test conditions – velocity vs. density
Figure 6. Current and past test and flight
conditions – velocity vs. density
American Institute of Aeronautics and Astronautics
9
Figure 7. Current and past test and flight
conditions – enthalpy vs. Reynolds number Figure 8. Computed values of boundary-layer transition
parameter for high Reynolds number shots
B. Baseline Comparisons Between Measurements and Predictions In this section, comparisons between data and predictions will be presented for surface heating and pressure
distributions and flow-field shock shapes. All LAURA and DPLR computation were performed using the baseline modeling assumptions discussed in the Computational Methods section at the nominal test conditions based on the CHEETAh-only analysis. The comparisons are arranged by groups of shots in which different physical phenomena were produced, i.e., non-reacting laminar flow, non-reacting to slightly reacting transitional/turbulent flow, and reacting flow at low, moderate and high-enthalpy conditions.
1. Group 1 Shots: Laminar Boundary Layer, Non-Reacting Flow The Group 1 LENS-XX shots 3 and 23 and 48-Inch shots 8, 9, and 12 were performed at very low Reynolds
number, low enthalpy conditions for which the flow remained laminar and chemical reactions were practically non-existent and there are no catalytic model effects on heating. Conditions for these shots are listed in Table 5. Centerline comparisons of predictions with heating and pressure data are shown in Figure 9 to Figure 13 and comparisons of measured and predicted symmetry-plane shock shapes are shown in Figure 14.
The intent of the Group 1 shots was to provide a baseline check on instrumentation performance in a laminar, non-reacting test environment in which CFD uncertainties are small. In general, the surface heating and pressure comparisons validated the instrumentation performance, even though the comparisons were not all satisfactory.
LENS-XX shot 3 (Figure 9) produced both leeward and windward side heating and pressure levels higher than predictions, whereas LENS-XX shot 23 (Figure 10) pressure and heating measurements and predictions agreed to within the experimental uncertainty over the whole model. There is no apparent explanation for the LENS-XX shot 3 differences in both heating and pressures and it is regarded as a bad shot. As the later LENS-XX shot 23, performed at similar conditions, produced close agreement between measured and predicted heating and pressure levels, it was concluded that shot 3 was an anomaly. It should be noted that LENS-XX is a new facility and this program was the first extensive test of its capabilities using CO2 test gas
The 48-Inch RST data from shots 8, 9, and 12 (Figure 11 - Figure 13) were in good agreement for leeward side heating levels and both windward side and leeward side pressures, but the windward side heating data showed stagnation region augmentation above the predicted laminar rates. As these shots produced laminar (except possibly near the leeward shoulder), non-reacting flows, the differences in stagnation region heating are more likely attributable to the experiment than to the predictions. These differences are similar to those observed (see Ref. 15) in other tests. Several hypotheses have been presented to explain this phenomenon, including blockage effects, free stream turbulence, and particulate impacts. Since this behavior has been noted in many different wind tunnels with different operational characteristics (conventional blow-down tunnels, reflected shock-tunnels and expansion tunnels) there is no consensus on whether any or all of the hypotheses are valid.
In addition to the surface comparisons, the shock-shape comparisons (Figure 14) were also generally good. It is notable however, that for LENS-XX shot 3 the leeward shock shape measurement and prediction show some differences, which correlates with the surface pressure mismatch for this shot. However, even with these small differences, the shock-shape comparisons for these shots (and all other shots, as will be shown) were far better than
American Institute of Aeronautics and Astronautics
10
those reported in Ref. 8, which validates the central premise of this study – that high-enthalpy CO2 validation testing should be performed in expansion tunnels, rather than reflected shock tunnels, in order to minimize free stream test conditions uncertainties.
Based on the data quality and trends for these Group 1 shots, LENS-XX shot 3 is regarded as a bad shot, 48-Inch RST shots 8 and 9 data are suitable for at least qualitative comparisons with predictions (owing to the stagnation region heating augmentation) and LENS-XX shot 23 data are suitable for quantitative validation of computational tools.
Table 5. Shot Conditions for Group 1: Laminar Boundary Layer, Non-Reacting Flow
Facility
Shot
U∞ (m/s)
T∞ (K)
P∞ (Pa)
ρ∞ (kg/m3)
Po,2 (Pa)
Re∞,D
H0- Hw (J/kg)
M∞ [O2] [O] [CO2] [CO]
LENS-XX 3 1750 114 169 7.85E-03 2.30E+04 4.60E+05 1.40 10.3 0.00E+00 0.00E+00 1.00E+00 0.00E+00 LENS-XX 23 2030 126 140 5.90E-03 2.34E+04 3.70E+05 1.90 11.4 0.00E+00 0.00E+00 1.00E+00 0.00E+00
48-Inch 8 1620 227 752 1.75E-02 4.24E+04 2.84E+06 1.26 6.6 0.00E+00 0.00E+00 1.00E+00 0.00E+00 48-Inch 9 1620 213 806 2.01E-02 4.83E+04 3.43E+06 1.24 6.8 0.00E+00 0.00E+00 1.00E+00 0.00E+00 48-Inch 12 1650 233 254 5.77E-03 1.46E+04 9.30E+05 1.32 6.7 0.00E+00 0.00E+00 1.00E+00 0.00E+00
Centerline Heating
Centerline Pressure
Figure 9. LENS-XX shot 03 data comparison with predictions
Centerline Heating
Centerline Pressure
Figure 10. LENS-XX shot 23 data comparison with predictions

American Institute of Aeronautics and Astronautics
11
Centerline Heating
Centerline Pressure
Figure 11. 48-Inch RST shot 08 data comparison with predictions
Centerline Heating
Centerline Pressure
Figure 12. 48-Inch RST shot 09 data comparison with predictions
Centerline Heating
Centerline Pressure
Figure 13. 48-Inch RST shot 12 data comparison with predictions

American Institute of Aeronautics and Astronautics
12
LENS-XX shot 03
LENS-XX shot 23
48-Inch RST shot 08
48-Inch RST shot 9
48-Inch RST shot 12
Figure 14. Shock-shape comparisons Group 1 shots - laminar boundary layer, non-reacting flow
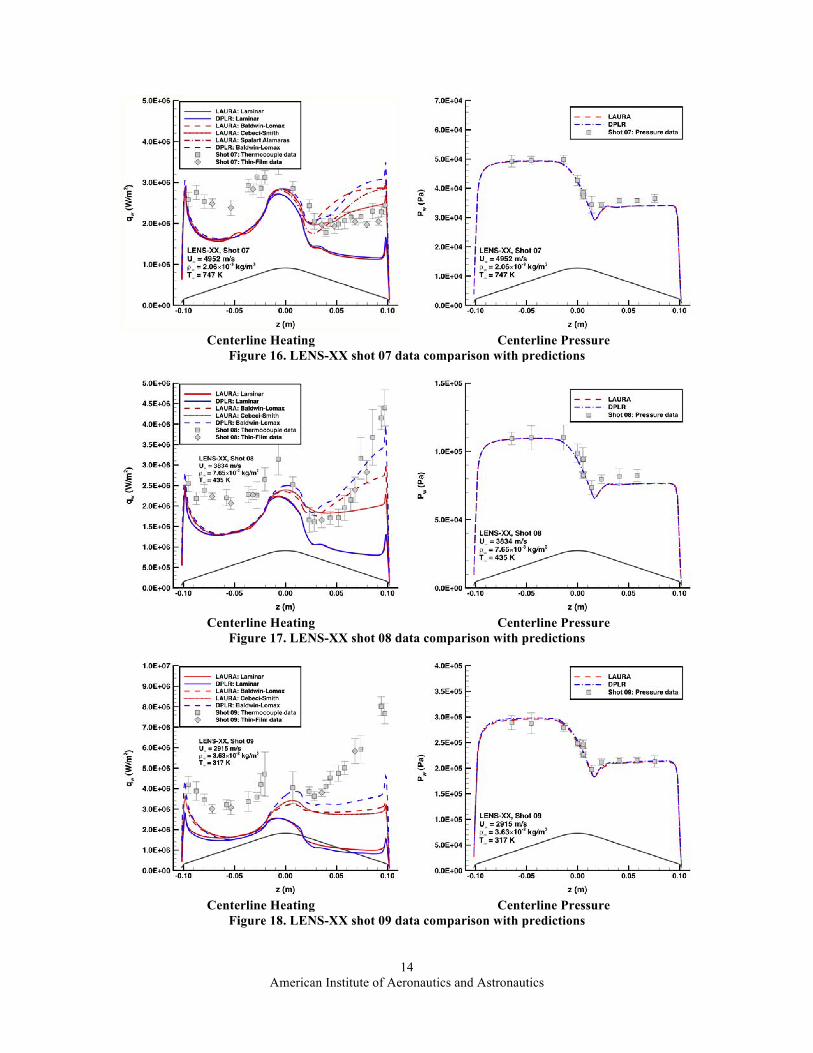
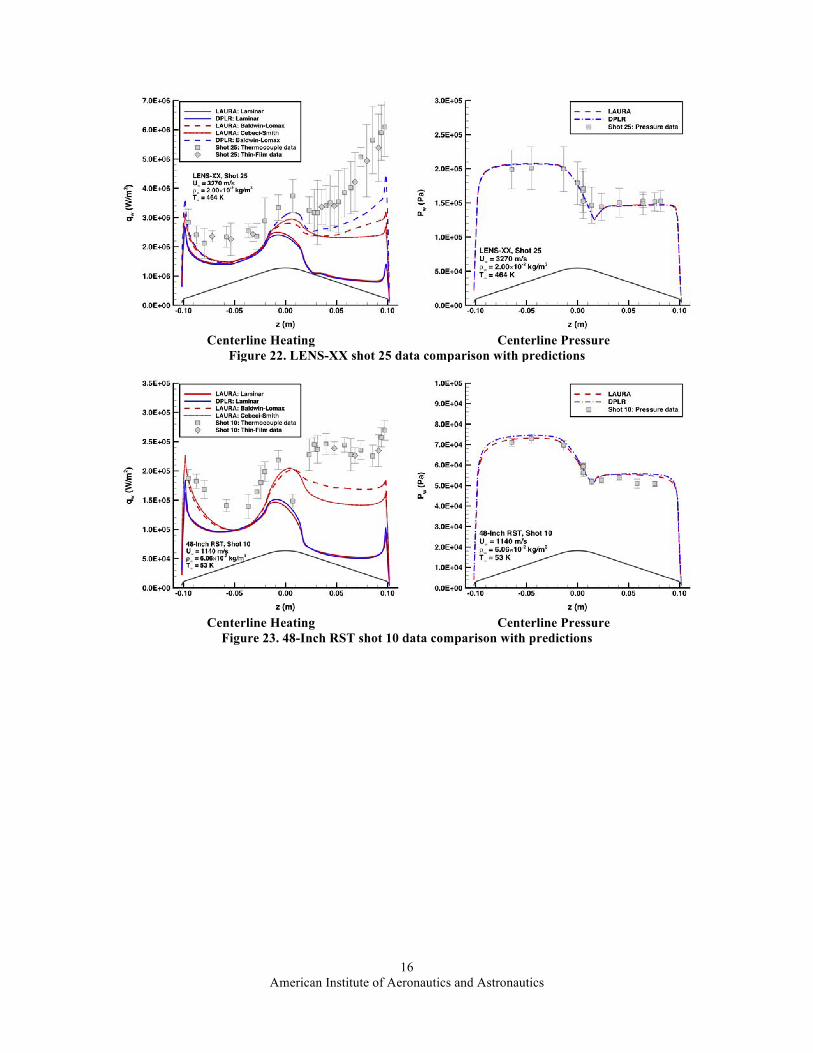
2. Group 2 Shots: Transitional/Turbulent Boundary Layer, Non-Dissociated to Slightly Dissociated Flow The Group 2 LENS-XX shots 4, 7-9, 18-20, 25 and 48-Inch Shot 10 were performed at moderate to high
Reynolds numbers, low-to-moderate enthalpy levels at which transitional or turbulent flow was produced and small amounts of CO2 dissociation occurred. For these shots, catalytic model effects on heating are very small and so, for clarify, only the fully-catalytic solutions are shown. Conditions for these shots are listed in Table 6. Centerline comparisons of predictions with heating and pressure data are shown in Figure 15 to Figure 23 and comparisons of measured and predicted symmetry-plane shapes are shown in Figure 24.
The intent of the Group 2 shots was to obtain validation data for computational turbulence models in a Mars-relevant test environment. While previous studies (Refs. 24-25) have shown that algebraic turbulence models perform very well in perfect-gas environments, there are no reliable data (i.e., obtained in an expansion tunnel, rather than a reflected shock tunnel) available for comparisons of blunt-body CO2 flow fields. Transitional/turbulent leeward side flow was produced for all shots cases except LENS-XX shot 4. There also may have been transition or turbulence on the windward side, however since blunt-body windward heating augmentation due to turbulence is usually small, it is difficult to make definitive conclusions.
Although the goal of producing transitional and/or turbulent flow was achieved, the results of the comparisons were generally unsatisfactory. For LENS-XX shots 7-9 (Figure 16 - Figure 18), shot 18 (Figure 19), shot 25 (Figure 23) and 48-Inch RST shot 10 (Figure 23), measured stagnation region heating levels exceeded laminar predictions by more than the estimated experimental uncertainty. Even if the flow in this region was turbulent - which is unlikely given the relatively low test Reynolds numbers - the turbulent heating augmentation should be very small due to the low stagnation region velocity. The augmented stagnation region heating data contradict this expectation, just as was observed for several of the laminar runs discussed in the previous section. For this group of shots, the leeward side transitional/turbulent heating data agreed reasonably well with predictions for LENS-XX shots 7 and 8 but greatly exceeded the predictions for the other shots. Of the remaining cases, LENS-XX shot 4 (Figure 15) heating data appear to be only borderline transitional at the leeward shoulder and otherwise match predictions, while heating data for LENS-XX shots 19 and 20 (Figure 20 and Figure 21) indicate transition near the leeward side

American Institute of Aeronautics and Astronautics
13
nose/flank junction and the Baldwin-Lomax turbulent predictions (but not Cebeci-Smith) match these data to within the experimental uncertainty.
With respect to surface pressures, for all cases windward measurements and predictions agreed to within the experimental uncertainty. Leeward pressure data exceed the predictions for LENS-XX shot by a large amount for LENS-XX shot 4, by small amounts for LENS-XX shots 7, 8 and 20 and agree to within the experimental uncertainty for the other cases. Shock-shape comparisons (Figure 24) for all shots show agreement to within the image resolution.
Based on the data quality and trends for these Group 2 shots, LENS-XX shots 4, 19 and 20 produced quantitative validation data and good agreement between measurement and predictions was observed (except for anomalous leeward pressure data for shot 4). LENS-XX shots 7 and 8 are regarded as suitable for only qualitative comparisons with predictions (because of the stagnation region augmentation). Owing to the large difference in both leeward and windward heating levels, the remaining cases (LENS-XX shots 9, 18 and 25 and 48-Inch RST shot 10) are regarded as bad shots.
It is noteworthy that these three bad transitional/turbulent LENS-XX shots (and the laminar LENS-XX shot 3) were performed at very high-density, low velocity conditions, which is basically the opposite test regime from which this high-enthalpy facility was designed to operate. As such, while it is unfortunate that these data do not appear to be usable, this result is neither surprising, nor greatly detrimental to the overall test program as these conditions are well outside the velocity-density space of interest for Mars missions, as shown by Figure 6. Table 6. Shot Conditions for Group 2: Transitional/Turbulent Boundary Layer, Non-Dissociated to Slightly
Dissociated Flow Facility
Shot
U∞
(m/s) T∞ (K)
P∞ (Pa)
ρ∞ (kg/m3)
Po,2 (Pa)
Re∞,D
H0- Hw (J/kg)
M∞ [O2] [O] [CO2] [CO]
LENS-XX 4 3106 271 332 6.49E-03 6.10E+04 3.01E+05 4.80 12.0 0.00E+00 0.00E+00 1.00E+00 0.00E+00 LENS-XX 7 4952 747 291 2.06E-03 4.96E+04 6.50E+04 12.70 12.1 0.00E+00 0.00E+00 1.00E+00 0.00E+00 LENS-XX 8 3834 435 628 7.65E-03 1.10E+05 2.87E+05 7.50 12.0 0.00E+00 0.00E+00 1.00E+00 0.00E+00 LENS-XX 9 2915 317 2172 3.63E-02 3.00E+05 1.33E+06 4.30 10.5 0.00E+00 0.00E+00 1.00E+00 0.00E+00 LENS-XX 18 2021 140 614 2.32E-02 9.10E+04 1.38E+06 1.90 10.7 0.00E+00 0.00E+00 1.00E+00 0.00E+00 LENS-XX 19 3080 290 440 8.01E-03 7.42E+04 3.40E+05 4.80 11.6 0.00E+00 0.00E+00 1.00E+00 0.00E+00 LENS-XX 20 3120 283 394 7.36E-03 7.00E+04 3.20E+05 4.90 11.9 0.00E+00 0.00E+00 1.00E+00 0.00E+00 LENS-XX 25 3270 464 1748 2.00E-02 2.08E+05 5.90E+05 5.50 9.9 0.00E+00 0.00E+00 1.00E+00 0.00E+00
48-Inch 10 1140 53 610 6.06E-02 7.26E+04 2.42E+07 0.47 9.6 0.00E+00 0.00E+00 1.00E+00 0.00E+00
Centerline Heating
Centerline Pressure
Figure 15. LENS-XX shot 04 data comparison with predictions
American Institute of Aeronautics and Astronautics
14
Centerline Heating
Centerline Pressure
Figure 16. LENS-XX shot 07 data comparison with predictions
Centerline Heating
Centerline Pressure
Figure 17. LENS-XX shot 08 data comparison with predictions
Centerline Heating
Centerline Pressure
Figure 18. LENS-XX shot 09 data comparison with predictions

American Institute of Aeronautics and Astronautics
15
Centerline Heating
Centerline Pressure
Figure 19. LENS-XX shot 18 data comparison with predictions
Centerline Heating
Centerline Pressure
Figure 20. LENS-XX shot 19 data comparison with predictions
Centerline Heating
Centerline Pressure
Figure 21. LENS-XX shot 20 data comparison with predictions
American Institute of Aeronautics and Astronautics
16
Centerline Heating
Centerline Pressure
Figure 22. LENS-XX shot 25 data comparison with predictions
Centerline Heating
Centerline Pressure
Figure 23. 48-Inch RST shot 10 data comparison with predictions

American Institute of Aeronautics and Astronautics
17
LENS-XX shot 04
LENS-XX shot 07
LENS-XX shot 08
LENS-XX shot 09
LENS-XX shot 18
LENS-XX shot 19
LENS-XX shot 25
LENS-XX shot 10
Figure 24. Shock-shape comparisons for Group 2 shots - transitional/turbulent boundary layer, non-dissociated to slightly dissociated flow
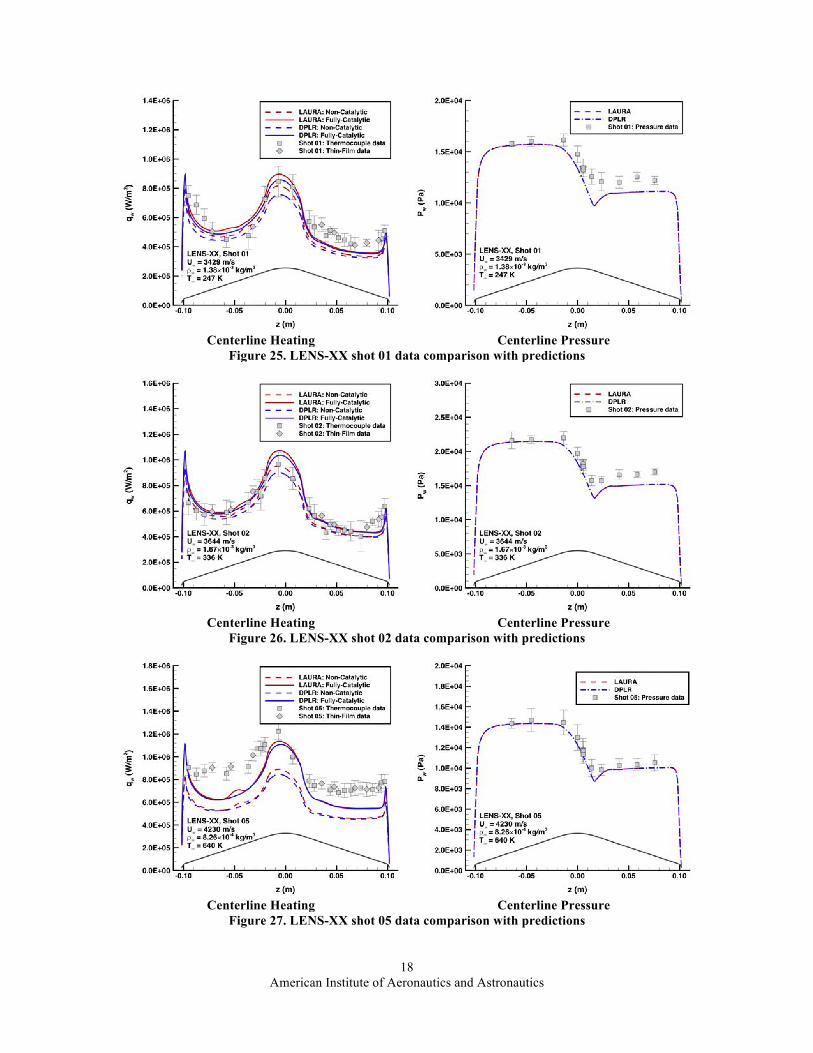
3. Group 3 Shots: Laminar Boundary Layer, Slightly Dissociated Flow The Group 3 LENS-XX shots 1-2, 5 and 24 were performed at low Reynolds numbers, low enthalpy conditions.
These shots provided laminar, reacting-gas data for flows in which CO2 dissociation and catalytic effects were small. Conditions for these shots are listed in Table 7. Centerline comparisons of predictions with heating and pressure data are shown in Figure 25 to Figure 28 and comparisons of measured and predicted symmetry-plane shock shapes are shown in Figure 29.
Heating and pressure comparisons for LENS-XX shots 1, 2 and 24 (Figure 25, Figure 26 and Figure 28) showed agreement between measurements and computations to within the estimated experimental uncertainty except for leeward side pressures from LENS-XX shots 1 and 2. Heating measurements for Shot 5 (Figure 27) were well in excess of predicted levels, but pressures compared to within the experimental uncertainty. Shock-shape comparisons (Figure 29) for all cases were good except for LENS-XX shot 1 for which the predicted leeward side shock standoff distance was slightly greater than in the schlieren image.
Based on the data quality, LENS-XX shot 5 is classified as “bad”, but the other three shots are regarded as producing qualitative data for validation of computational methods.
Table 7. Shot Conditions for Group 3: Laminar Boundary Layer, Slightly Dissociated Flow
Facility
Shot
U∞ (m/s)
T∞ (K)
P∞ (Pa)
ρ∞ (kg/m3)
Po,2 (Pa)
Re∞,D
H0- Hw (J/kg)
M∞ [O2] [O] [CO2] [CO]
LENS-XX 1 3429 247 66 1.38E-03 1.62E+04 7.56E+04 5.84 13.8 0.00E+00 0.00E+00 1.00E+00 0.00E+00 LENS-XX 2 3644 336 109 1.67E-03 2.21E+04 7.50E+04 6.70 12.8 0.00E+00 0.00E+00 1.00E+00 0.00E+00 LENS-XX 5 4230 640 100 8.26E-04 1.45E+04 2.40E+04 9.30 11.1 0.00E+00 0.00E+00 1.00E+00 0.00E+00 LENS-XX 24 3100 285 91 1.69E-03 1.59E+04 7.20E+04 4.80 11.8 0.00E+00 0.00E+00 1.00E+00 0.00E+00
American Institute of Aeronautics and Astronautics
18
Centerline Heating
Centerline Pressure
Figure 25. LENS-XX shot 01 data comparison with predictions
Centerline Heating
Centerline Pressure
Figure 26. LENS-XX shot 02 data comparison with predictions
Centerline Heating
Centerline Pressure
Figure 27. LENS-XX shot 05 data comparison with predictions
American Institute of Aeronautics and Astronautics
19
Centerline Heating
Centerline Pressure
Figure 28. LENS-XX shot 24 data comparison with predictions
LENS-XX shot 01
LENS-XX shot 02
LENS-XX shot 05
LENS-XX shot 24
Figure 29. Shock-shape comparisons for Group 3 shots - laminar boundary layer, slightly dissociated flow
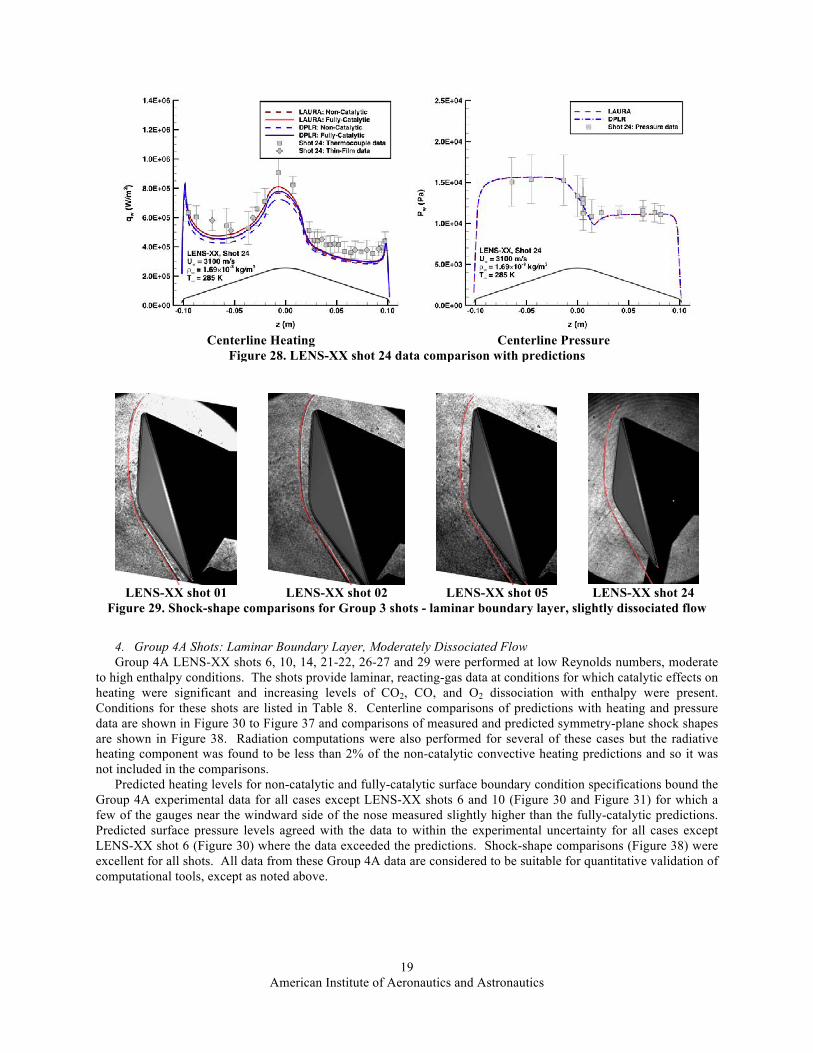
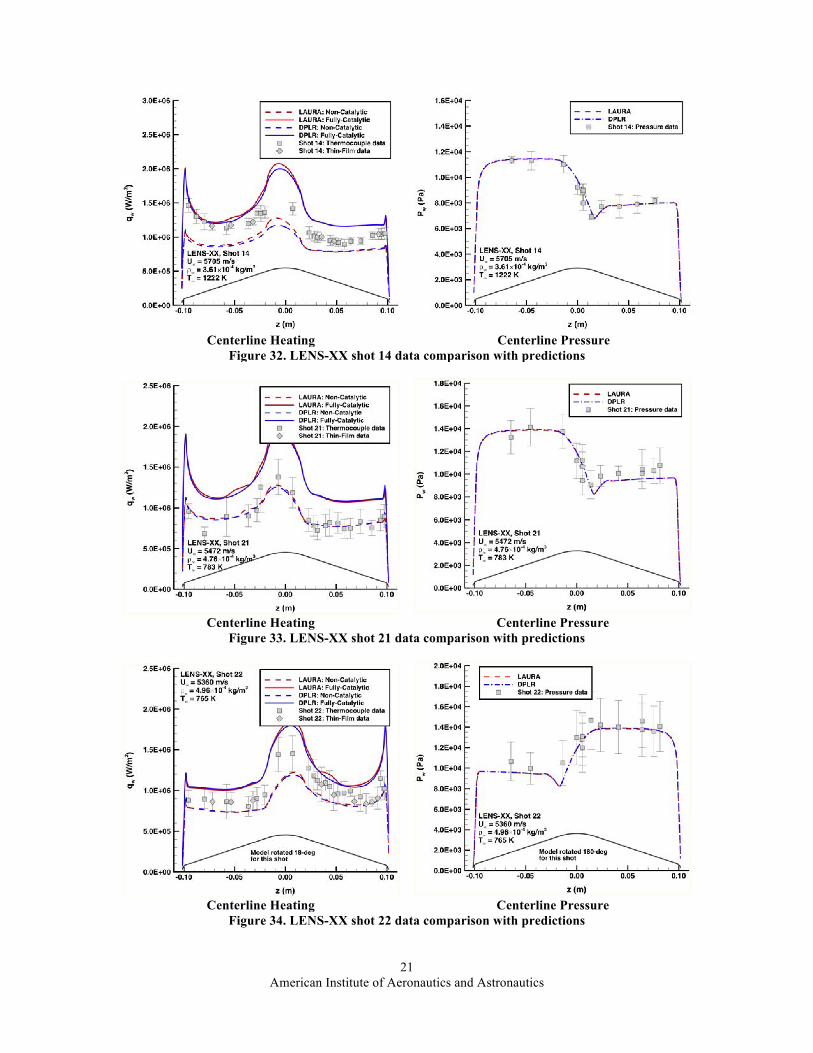
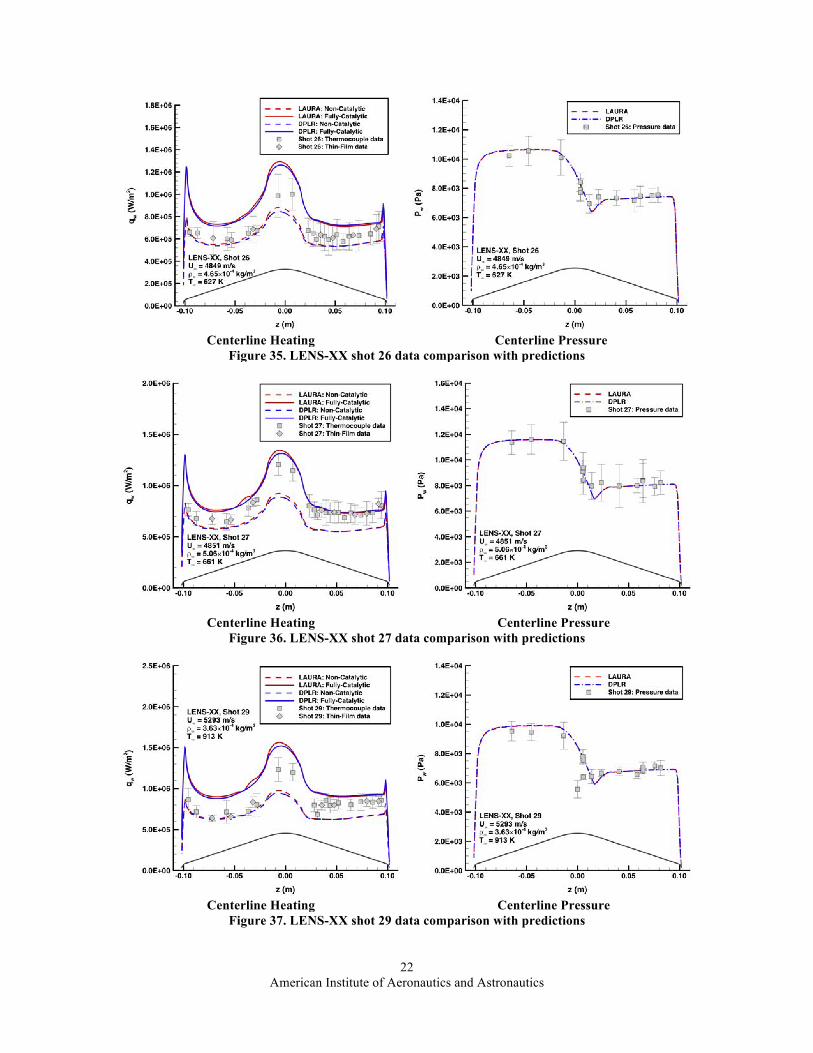
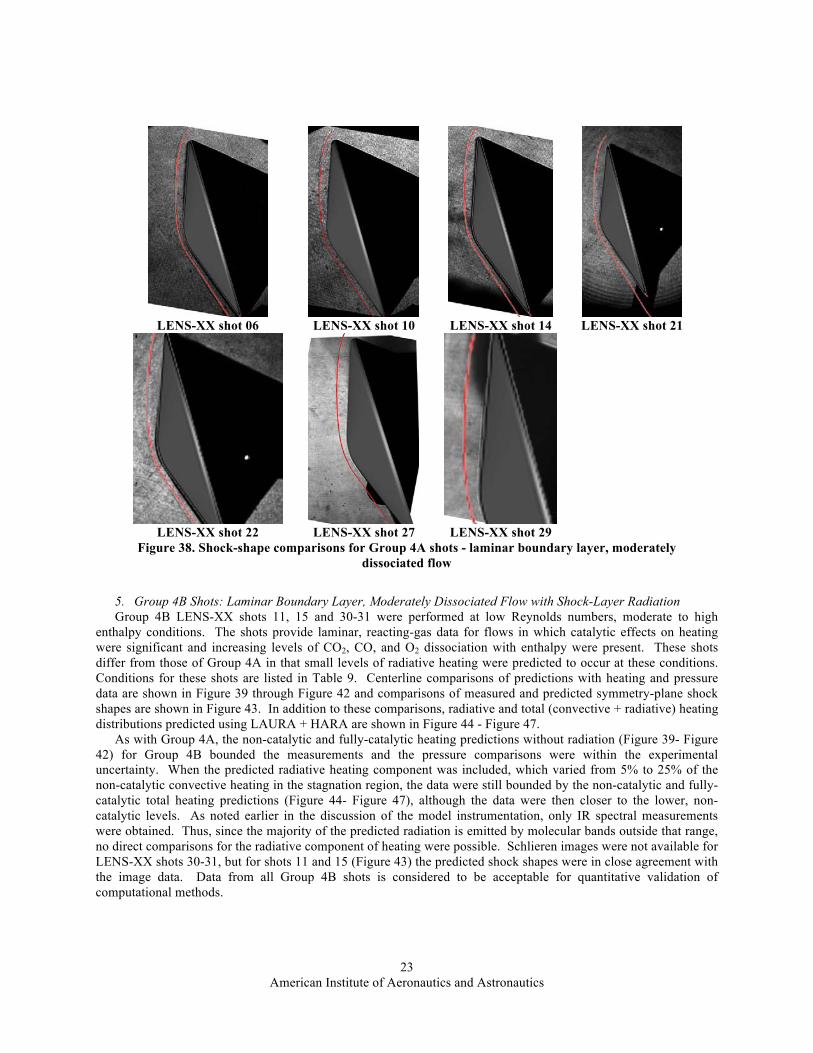
4. Group 4A Shots: Laminar Boundary Layer, Moderately Dissociated Flow Group 4A LENS-XX shots 6, 10, 14, 21-22, 26-27 and 29 were performed at low Reynolds numbers, moderate
to high enthalpy conditions. The shots provide laminar, reacting-gas data at conditions for which catalytic effects on heating were significant and increasing levels of CO2, CO, and O2 dissociation with enthalpy were present. Conditions for these shots are listed in Table 8. Centerline comparisons of predictions with heating and pressure data are shown in Figure 30 to Figure 37 and comparisons of measured and predicted symmetry-plane shock shapes are shown in Figure 38. Radiation computations were also performed for several of these cases but the radiative heating component was found to be less than 2% of the non-catalytic convective heating predictions and so it was not included in the comparisons.
Predicted heating levels for non-catalytic and fully-catalytic surface boundary condition specifications bound the Group 4A experimental data for all cases except LENS-XX shots 6 and 10 (Figure 30 and Figure 31) for which a few of the gauges near the windward side of the nose measured slightly higher than the fully-catalytic predictions. Predicted surface pressure levels agreed with the data to within the experimental uncertainty for all cases except LENS-XX shot 6 (Figure 30) where the data exceeded the predictions. Shock-shape comparisons (Figure 38) were excellent for all shots. All data from these Group 4A data are considered to be suitable for quantitative validation of computational tools, except as noted above.

American Institute of Aeronautics and Astronautics
20
Table 8. Shot Conditions for Group 4A: Laminar Boundary Layer, Moderately Dissociated Flow Facility
Shot
U∞
(m/s) T∞ (K)
P∞ (Pa)
ρ∞ (kg/m3)
Po,2 (Pa)
Re∞,D
H0- Hw (J/kg)
M∞ [O2] [O] [CO2] [CO]
LENS-XX 6 5090 812 108 7.03E-04 1.79E+04 2.20E+04 13.50 11.9 0.00E+00 0.00E+00 1.00E+00 0.00E+00 LENS-XX 10 5715 1026 124 6.40E-04 2.05E+04 1.80E+04 17.10 12.0 0.00E+00 0.00E+00 1.00E+00 0.00E+00 LENS-XX 14 5705 1216 83 3.61E-04 1.16E+04 9.00E+03 17.30 11.0 0.00E+00 0.00E+00 1.00E+00 0.00E+00 LENS-XX 21 5472 783 70 4.76E-04 1.40E+04 1.60E+04 14.70 12.6 0.00E+00 0.00E+00 1.00E+00 0.00E+00 LENS-XX 22 5360 765 72 4.96E-04 1.40E+04 1.70E+04 14.10 12.5 0.00E+00 0.00E+00 1.00E+00 0.00E+00 LENS-XX 26 4849 627 55 4.65E-04 1.08E+04 1.60E+04 12.10 12.8 0.00E+00 0.00E+00 1.00E+00 0.00E+00 LENS-XX 27 4851 661 63 5.06E-04 1.17E+04 1.70E+04 12.10 12.5 0.00E+00 0.00E+00 1.00E+00 0.00E+00 LENS-XX 29 5293 913 63 3.63E-04 1.00E+04 1.00E+04 14.70 12.0 0.00E+00 0.00E+00 1.00E+00 0.00E+00
Centerline Heating
Centerline Pressure
Figure 30. LENS-XX shot 06 data comparison with predictions
Centerline Heating
Centerline Pressure
Figure 31. LENS-XX shot 10 data comparison with predictions
American Institute of Aeronautics and Astronautics
21
Centerline Heating
Centerline Pressure
Figure 32. LENS-XX shot 14 data comparison with predictions
Centerline Heating
Centerline Pressure
Figure 33. LENS-XX shot 21 data comparison with predictions
Centerline Heating
Centerline Pressure
Figure 34. LENS-XX shot 22 data comparison with predictions
American Institute of Aeronautics and Astronautics
22
Centerline Heating
Centerline Pressure
Figure 35. LENS-XX shot 26 data comparison with predictions
Centerline Heating
Centerline Pressure
Figure 36. LENS-XX shot 27 data comparison with predictions
Centerline Heating
Centerline Pressure
Figure 37. LENS-XX shot 29 data comparison with predictions
American Institute of Aeronautics and Astronautics
23
LENS-XX shot 06
LENS-XX shot 10
LENS-XX shot 14
LENS-XX shot 21
LENS-XX shot 22
LENS-XX shot 27
LENS-XX shot 29
Figure 38. Shock-shape comparisons for Group 4A shots - laminar boundary layer, moderately dissociated flow
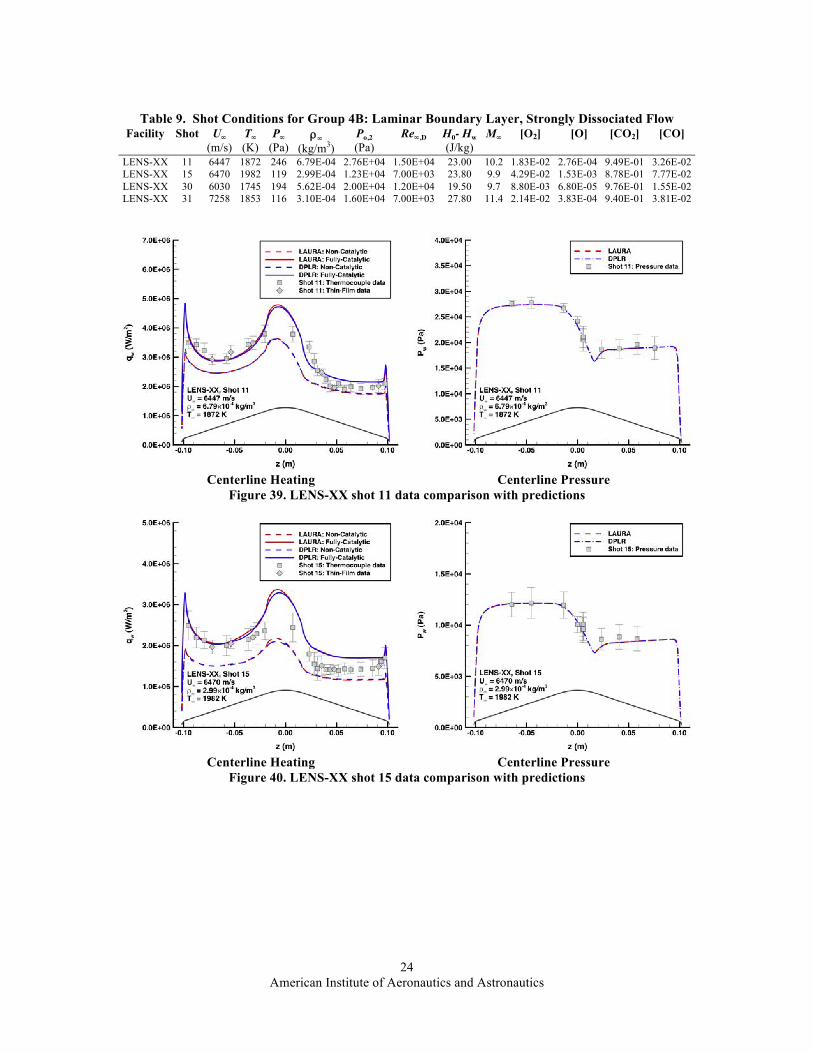
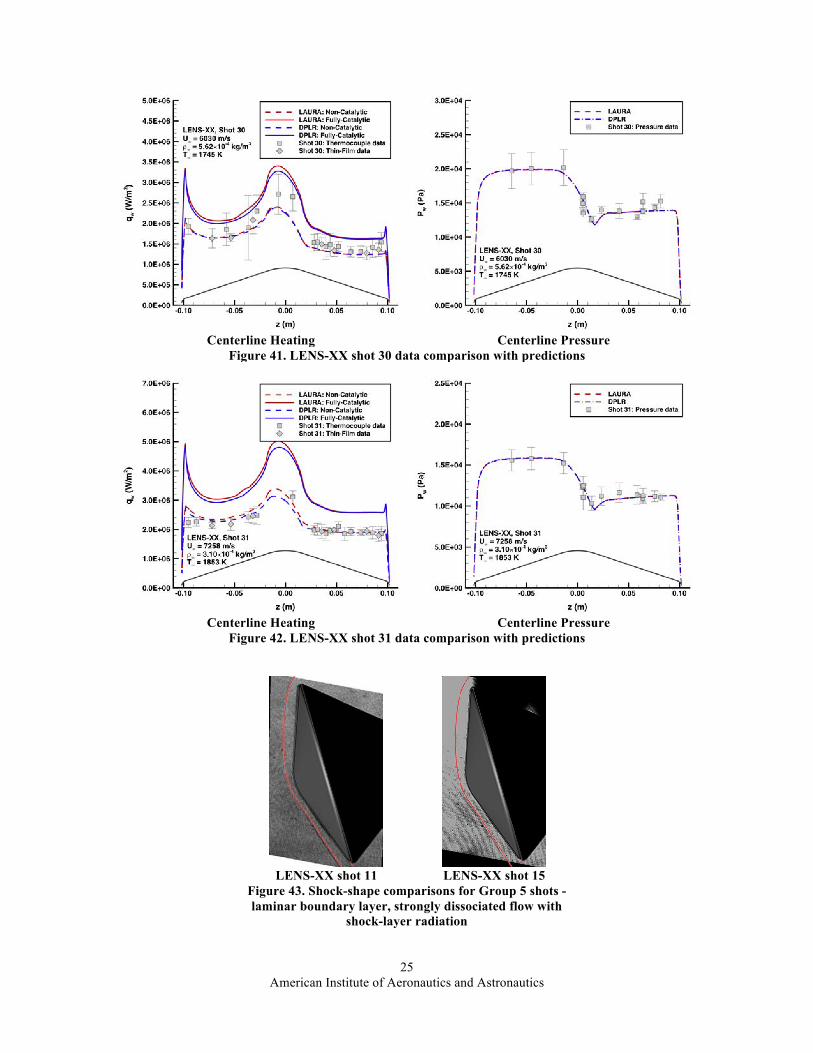
5. Group 4B Shots: Laminar Boundary Layer, Moderately Dissociated Flow with Shock-Layer Radiation Group 4B LENS-XX shots 11, 15 and 30-31 were performed at low Reynolds numbers, moderate to high
enthalpy conditions. The shots provide laminar, reacting-gas data for flows in which catalytic effects on heating were significant and increasing levels of CO2, CO, and O2 dissociation with enthalpy were present. These shots differ from those of Group 4A in that small levels of radiative heating were predicted to occur at these conditions. Conditions for these shots are listed in Table 9. Centerline comparisons of predictions with heating and pressure data are shown in Figure 39 through Figure 42 and comparisons of measured and predicted symmetry-plane shock shapes are shown in Figure 43. In addition to these comparisons, radiative and total (convective + radiative) heating distributions predicted using LAURA + HARA are shown in Figure 44 - Figure 47.
As with Group 4A, the non-catalytic and fully-catalytic heating predictions without radiation (Figure 39- Figure 42) for Group 4B bounded the measurements and the pressure comparisons were within the experimental uncertainty. When the predicted radiative heating component was included, which varied from 5% to 25% of the non-catalytic convective heating in the stagnation region, the data were still bounded by the non-catalytic and fully-catalytic total heating predictions (Figure 44- Figure 47), although the data were then closer to the lower, non-catalytic levels. As noted earlier in the discussion of the model instrumentation, only IR spectral measurements were obtained. Thus, since the majority of the predicted radiation is emitted by molecular bands outside that range, no direct comparisons for the radiative component of heating were possible. Schlieren images were not available for LENS-XX shots 30-31, but for shots 11 and 15 (Figure 43) the predicted shock shapes were in close agreement with the image data. Data from all Group 4B shots is considered to be acceptable for quantitative validation of computational methods.
American Institute of Aeronautics and Astronautics
24
Table 9. Shot Conditions for Group 4B: Laminar Boundary Layer, Strongly Dissociated Flow
Facility
Shot
U∞ (m/s)
T∞ (K)
P∞ (Pa)
ρ∞ (kg/m3)
Po,2 (Pa)
Re∞,D
H0- Hw (J/kg)
M∞ [O2] [O] [CO2] [CO]
LENS-XX 11 6447 1872 246 6.79E-04 2.76E+04 1.50E+04 23.00 10.2 1.83E-02 2.76E-04 9.49E-01 3.26E-02 LENS-XX 15 6470 1982 119 2.99E-04 1.23E+04 7.00E+03 23.80 9.9 4.29E-02 1.53E-03 8.78E-01 7.77E-02 LENS-XX 30 6030 1745 194 5.62E-04 2.00E+04 1.20E+04 19.50 9.7 8.80E-03 6.80E-05 9.76E-01 1.55E-02 LENS-XX 31 7258 1853 116 3.10E-04 1.60E+04 7.00E+03 27.80 11.4 2.14E-02 3.83E-04 9.40E-01 3.81E-02
Centerline Heating
Centerline Pressure
Figure 39. LENS-XX shot 11 data comparison with predictions
Centerline Heating
Centerline Pressure
Figure 40. LENS-XX shot 15 data comparison with predictions
American Institute of Aeronautics and Astronautics
25
Centerline Heating
Centerline Pressure
Figure 41. LENS-XX shot 30 data comparison with predictions
Centerline Heating
Centerline Pressure
Figure 42. LENS-XX shot 31 data comparison with predictions
LENS-XX shot 11
LENS-XX shot 15
Figure 43. Shock-shape comparisons for Group 5 shots - laminar boundary layer, strongly dissociated flow with
shock-layer radiation

American Institute of Aeronautics and Astronautics
26
Figure 44. LENS-XX shot 11 comparison with
radiative heating included Figure 45. LENS-XX shot 15 comparison with
radiative heating included
Figure 46. LENS-XX shot 30 comparison with
radiative heating included Figure 47. LENS-XX shot 31 comparison with
radiative heating included
6. Group 5 Shots: Laminar Boundary Layer, Strongly Dissociated Flow with Shock-Layer Radiation Group 5 LENS-XX shot 15-17 and 32-34 were performed at low Reynolds number, high to very-high enthalpy
conditions. Molecular dissociation increased with enthalpy to nearly completely atomized C-O post-shock flow. These were the only shots in the test program in which significant levels of free stream dissociation occurred. Additionally, very high levels of shock-layer radiation were predicted for these conditions. Conditions for these shots are listed in Table 10. Centerline comparisons of predictions with heating and pressure data are shown in Figure 48 to Figure 52. No schlieren images were available for shock-shape comparisons except for LENS-XX shot 16 (Figure 53). Radiative and total (convective + radiative) heating distributions predicted using LAURA + HARA are shown for shots 16 and 32 (the only ones with a fully-functional surface sensor suite) in Figure 54 - Figure 55.
All the group 5 data are considered to be useful only for qualitative comparisons for several reasons expect for shot 17 which is considered to be a bad shot owing to failure to achieve desired test conditions. First and foremost, for these shots the free stream test gas was predicted to be significantly dissociated (only 12% to 62% CO2) This dissociation violates one of the primary goals for this validation exercise, which was to obtain data in a “clean” free stream environment without vibrational or chemical non-equilibrium. Second, dissociation creates the requirement for using chemical kinetic models to predict the free stream conditions, which are then used as inputs to the flow field computations that use the same chemical kinetic models to generate predictions that are compared with the reacting test data. Absent any measurements to first validate the free stream conditions (e.g., specie vibrational excitation and dissociation levels), comparisons of measured and predicted surface heating and pressure levels

American Institute of Aeronautics and Astronautics
27
cannot provide a quantitative validation of computational methods. To properly simulate these shots, it is likely that kinetic models would need to be included for reactions producing additional species (C2, C+, O+, CO+, O2+, e-) as would the radiation models associated with those species. Finally, aside from LENS-XX shots 16 and 32, only limited surface measurements were obtained owing to damage to the sensors over the course of the test program. Shot 16 left few sensors undamaged for shot 17, after which the model was completely refurbished, but shot 32 then damaged most of the sensors again leaving sparse instrumentation set for shots 33-34. Also, aside from data quality issues, the default computational assumptions for flow-field and radiation transport computations were most likely not sufficient to model the physical processes that occurred
Despite these qualifiers, the comparisons were actually fairly good for all cases but LENS-XX shot 17. Measured and predicted pressures agreed to within the experimental uncertainties. The heating measurements were at, or slightly below the lower bound of convective-only, non-catalytic heating predictions. However, when the radiative component was added (Figure 54 - Figure 55), the predicted non-catalytic total (radiative + convective) heating levels were in excess of the measured values.
It should be noted that while high-fidelity data at the Group 5 conditions would be valuable for general model validation purposes, the Group 5 conditions are well beyond range of interest for any currently planned Mars mission. With reference to comparison of test conditions with MSL and HIAD trajectories in (Figure 7), it can be seen that these enthalpies are so high (in excess of 50 MJ/kg) that they are not even included on the plot.
Table 10. Shot Conditions for Group 5: Laminar Boundary Layer, Strongly Dissociated Flow with Shock-Layer Radiation
Facility
Shot
U∞ (m/s)
T∞ (K)
P∞ (Pa)
ρ∞ (kg/m3)
Po,2 (Pa)
Re∞,D
H0- Hw (J/kg)
M∞ [O2] [O] [CO2] [CO]
LENS-XX 16 9486 2507 196 2.88E-04 2.52E+04 6.00E+03 53.20 11.0 1.74E-01 7.22E-02 3.22E-01 4.32E-01 LENS-XX 17 11690 2667 122 1.43E-04 1.90E+04 3.00E+03 79.80 12.1 1.36E-01 1.84E-01 1.21E-01 5.59E-01 LENS-XX 32 9529 2326 215 3.06E-04 3.31E+04 8.00E+03 50.60 12.1 1.44E-01 2.65E-02 5.32E-01 2.98E-01 LENS-XX 33 9474 2265 178 3.35E-04 2.93E+04 8.00E+03 48.70 12.5 1.21E-01 1.59E-02 6.23E-01 2.40E-01 LENS-XX 34 9966 2362 182 3.04E-04 2.93E+04 7.00E+03 54.30 12.4 1.51E-01 3.20E-02 4.96E-01 3.21E-01
Centerline Heating
Centerline Pressure
Figure 48. LENS-XX shot 16 data comparison with predictions

American Institute of Aeronautics and Astronautics
28
Centerline Heating
Centerline Pressure
Figure 49. LENS-XX shot 17 data comparison with predictions
Centerline Heating
Centerline Pressure
Figure 50. LENS-XX shot 32 data comparison with predictions
Centerline Heating
Centerline Pressure
Figure 51. LENS-XX shot 33 data comparison with predictions

American Institute of Aeronautics and Astronautics
29
Centerline Heating
Centerline Pressure
Figure 52. LENS-XX shot 34 data comparison with predictions
LENS-XX shot 16
Figure 53. Shock-shape comparisons for Group 5 shots - laminar boundary layer, strongly dissociated flow
Figure 54. LENS-XX shot 16 comparison with
radiative heating included Figure 55. LENS-XX shot 32 data comparison with
radiative heating included

American Institute of Aeronautics and Astronautics
30
C. Effects of Kinetic Model on Comparisons As detailed in the Computational Methods section, the kinetic model data employed in this study differs from
that in earlier studies. The biggest difference is in the CO2 +M => CO + O reaction, which indicates that the greatest effects on predictions would occur for the moderate enthalpy shots in which CO2 is partially dissociated, i.e., shots from Group 3 and 4A-4B.
Simulations were performed for selected shots using the old kinetic model data (from Table 4) to investigate these effects. Comparisons of old and new kinetic model results are shown for LENS-XX shot 24 from Group 3, shots 14 and 27 from Group 4A and shot 31 from Group 4B in Figure 56 through Figure 59. For all cases, the old kinetic model produced slightly higher rates, which shifted the comparisons with data toward the lower, non-catalytic bound.
Figure 56. LENS-XX shot 24 (Group 3) kinetic model
effects on heating distribution Figure 57. LENS-XX shot 14 (Group 4A) kinetic
model effects on heating distribution
Figure 58. LENS-XX shot 27 (Group 4A) kinetic
model effects on heating distribution Figure 59. LENS-XX shot 31 (Group 4B) kinetic
model effects on heating distribution
D. Effects of Catalytic Models on Comparisons The baseline method for catalysis modeling was to perform non-catalytic and fully-catalytic simulation in order
to bound the physically-reasonable range of catalytic efficiency for a metallic model surface in a CO2 environment. Comparisons of the measured heating data against these upper and lower bounds have been presented in previous sections. It has been shown that the data were bounded by these limits and in general tended toward the lower, non-catalytic bound. In order to further explore catalysis model effects, two additional options were also considered for selected cases: super-catalytic and partially-catalytic boundary-conditions.

American Institute of Aeronautics and Astronautics
31
1. Super-Catalytic Boundary Condition The super-catalytic boundary condition enforces full recombination at the wall to the free stream species
composition. This is a non-physical model historically applied to flight computations to provide a conservative (or arguably over-conservative) margin for TPS design. As discussed in Ref. 8, initial analyses of data from past test programs suggested agreement of measured heating rates with super-catalytic predictions. However, that conclusion was discounted after review of those data sets indicated that the reflected-shock tunnel data were not suitable for computational validation purposes owing to uncertainties in determination of the free stream conditions. To further reinforce the conclusion that the super-catalytic boundary condition is inappropriate for modeling ground test data on metallic models, simulations for selected shots from this test series were performed using this boundary condition. As shown in Figure 60 and Figure 61 for LENS-XX shots 2 and 11, the super-catalytic boundary-condition drastically over-predicted the measured heating levels.
Figure 60. LENS-XX shot 02 over-prediction of
heating due to super-catalytic boundary condition Figure 61. LENS-XX shot 11 over-prediction of
heating due to super-catalytic boundary condition
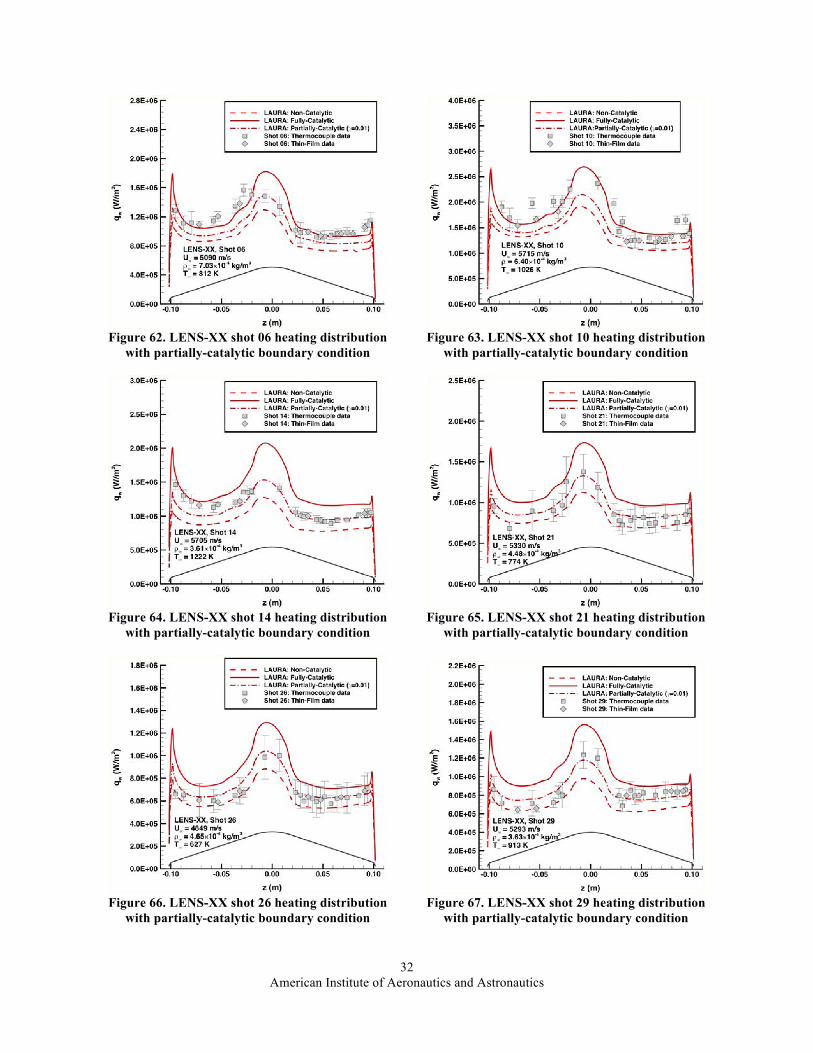
2. Partially-Catalytic Boundary Condition A more physically realistic catalysis option is to specify a partially-catalytic boundary condition with catalytic
efficiencies based on laboratory test of the material in question. While no specific data were found on the catalytic characteristic of the wind tunnel model material, 17-4 PH stainless-steel in a CO2 environment, Ref. 20 does provide relevant data on a variety of metallic surfaces. These data indicate that for metallic surfaces, catalytic efficiencies of 0.0053 to 0.046 are appropriate for the homogenous recombination of O to O2.
A set of simulations were performed for selected cases using a logarithmic variation of catalytic efficiencies of γo = 0.001, 0.01 and 0.1. The upper and lower values of 0.1 and 0.001 produced heating levels very close to the fully-catalytic and non-catalytic levels, respectively, while the 0.01 value produced values between these bounds, but shifted toward the lower non-catalytic level. Comparisons between the data and the partially-catalytic predictions are shown in Figure 62 - Figure 71; for clarity in the plots, only the γo = 0.01 predictions are shown.
In general, the best agreement between predictions and measurement was found to be for the partially-catalytic boundary condition, although for some cases, there was better agreement with the fully-catalytic (e.g., shot 6 in Figure 62) or non-catalytic levels (e.g., shot 31 in Figure 71). From these comparisons, it can be concluded that a partially-catalytic efficiency on the order of 0.01 produces the best match with data, although a fully-catalytic boundary condition would probably provide the best conservative (but not overly-conservative) environments for TPS design.
American Institute of Aeronautics and Astronautics
32
Figure 62. LENS-XX shot 06 heating distribution
with partially-catalytic boundary condition Figure 63. LENS-XX shot 10 heating distribution
with partially-catalytic boundary condition
Figure 64. LENS-XX shot 14 heating distribution
with partially-catalytic boundary condition Figure 65. LENS-XX shot 21 heating distribution
with partially-catalytic boundary condition
Figure 66. LENS-XX shot 26 heating distribution
with partially-catalytic boundary condition Figure 67. LENS-XX shot 29 heating distribution
with partially-catalytic boundary condition

American Institute of Aeronautics and Astronautics
33
Figure 68. LENS-XX shot 30 heating distribution
with partially-catalytic boundary condition Figure 69. LENS-XX shot 15 heating distribution
with partially-catalytic boundary condition
Figure 70. LENS-XX shot 11 heating distribution
with partially-catalytic boundary condition Figure 71. LENS-XX shot 31 heating distribution
with partially-catalytic boundary condition
V. Summary and Conclusions A series of shots have been conducted in an expansion tube using CO2 test gas to generate validation data for
modeling of blunt-body aerothermodynamic environments. Testing was conducted over a wide range of velocities and densities in order to obtain data for different physical processes and environments, including laminar and transitional/turbulent flow, non-reacting to completely dissociated post-shock flow, and shock-layer radiation. Data obtained from these shots include surface heating and pressure measurements and shock-shape imagery; additionally some stagnation region IR radiation measurements were performed, although those data were not considered in this report.
The facility and instrumentation performed as expected at most test conditions (including the enthalpy range of interest for potential future Mars missions) and validation-quality data were generated. Satisfactory data were not obtained at high Reynolds numbers, where transition and turbulence model validation will still be required and at very high enthalpies (in excess of 25 MJ/kg), which may be of general academic interest but are well beyond the range of current planning for future missions.
Computational simulations were performed at the test conditions using state-of-the-art NASA aerothermodynamic modeling tools to generate heating, pressure and shock-shape predictions for comparisons with the data. Baseline simulations were performed using a 5-species (CO2, CO, O2, C, O), two-temperature model with both non-catalytic and fully-catalytic, cold-wall (300 K) boundary conditions. For high-Reynolds number

American Institute of Aeronautics and Astronautics
34
conditions, algebraic turbulence models were used and at high-enthalpies, radiation transport was modeled. Additional partially-catalytic and super-catalytic simulations also were performed for several cases.
This test program has provided the most extensive and highest quality data set to date for blunt-body, CO2 flows. The data will help to validate NASA’s computational modeling tools and to define uncertainties in the aerothermodynamic environments generated with these tools for TPS design. Analysis of the dataset and the comparisons with predictions has produced several insights and conclusions and has also highlighted issues that will require further study.
First and foremost, this test program validated the premise that the expansion tunnel is the ideal facility for CO2 testing at high enthalpies. For almost every shot (for which image data were available), the predicted and measured shock shapes matched to within the resolution of the Schlieren images. These comparisons provide evidence that the test gas state was well understood and free from the chemical and vibrational non-equilibrium excitation produced in high-enthalpy, reflected shock tunnel flows. The exception to this conclusion is for those high-velocity, 50+ MJ/kg enthalpy Group 5 shots in which the free stream was dissociated.
Heating distribution comparisons for the laminar conditions of the Group 1, 3, and 4A-4B shots, which span a wide range of enthalpies (approximately 1 MJ/kg to 28 MJ/kg), showed that predictions matched the data to within the experimental uncertainty for the low enthalpy cases and that the data were bounded by non-catalytic and fully-catalytic simulations at moderate to high enthalpies. Additional simulations performed with a partially-catalytic wall specification (based on literature for metallic surface wall catalysis in CO2 flows) generally matched the data to within the experimental uncertainty. While it is difficult to assign a single number to computational uncertainty, it is reasonable to conclude from these results that for laminar flow, at enthalpies up to 25 MJ/kg (for which radiation does not have significant effects) and for which the wall catalytic efficiency is understood, convective heat transfer predictions are accurate to within approximately ±10%. This conclusion is an improvement over results from the previous uncertainty study (Ref. 8) in which computational uncertainties of ±15% to ±60% were estimated.
For these same groups of shots, pressure comparisons generally agreed to within the experimental uncertainty for shots from the second half of the test series. However, for many of the shots from the first half of the test series, leeward side pressure measurements were considerably higher than the predictions. Since those shots with bad comparisons were all grouped together at the start of the test program and were not consistent with subsequent shots at similar conditions, it was concluded that those data were anomalous and could be disregarded. With those data excluded, it can then be estimated that pressure predictions over the range of test conditions are accurate to within approximately ±2% to ±5%.
Two problems identified by analysis of the test results warrant further study. The first problem is the lack of data for validation of blunt-body turbulence models in CO2 flows. Facility performance for the Group 2 shots at the low-velocity, high-density conditions required to produce high Reynolds numbers flows with transition and turbulence was generally unsatisfactory and most of the shots were not considered suitable for comparisons with predictions. For those shots that were determined to be good, turbulent data agreed reasonably well with predictions using the Baldwin-Lomax model, but not the Cebeci-Smith model. To further explore turbulent heating effects, it is recommended that rather than testing at high unit Reynolds numbers with a small diameter, large cone-angle model, testing be conducted at lower unit Reynolds number with a smaller cone-angle, long-length model to produce high length-based Reynolds number conditions. This change would move the free stream test condition requirements away from the low-velocity/high-density region, which is not the range in which the facility is typically expected to operate, to the high-velocity/low-density region in which good facility performance was demonstrated by this study.
The second problem that rates further study is that of radiation measurements at higher enthalpies. Attempts to perform VUV range measurement in this study were unsuccessful and so it would be desirable to obtain data in this range. Additionally, IR data were obtained in this study that are available for future analyses and comparisons, but were not considered herein because the spectral range of the sensor was outside the predicted range of the majority of the shock-layer radiation.
VI. Acknowledgements This work was supported by the NASA Entry Systems Modeling Project of the Game Changing Development
Program; NASA contracts NNA10DE12C to ERC, Inc. and NNA15BB15C to AMA Inc., and through the NASA Space Technology Research Grants Program, grant # NNX12AG48A.
American Institute of Aeronautics and Astronautics
35
VII. References 1. Goodliff, K., Cirillo, W., Mattfeld, B., Stromgren, C., and Shyface, H., “Comparison of Human Exploration Architecture and Campaign Approaches,” AIAA Paper 2015-4413, AIAA SPACE 2015 Conference and Exposition, Pasadena, CA, August 31 – September 2, 2015. 2. Craig, D. A., Troutman, P., and Herrmann, N. B., “Pioneering Space Through an Evolvable Mars Campaign,” AIAA Paper 2015-4409, AIAA SPACE 2015 Conference and Exposition, Pasadena, CA, August 31 – September 2, 2015. 3. Dwyer Cianciolo, A. M., Davis, J. L., Komar, D. R., Munk, M. M., et al, “Entry, Descent and Landing Systems Analysis Study: Phase 1 Report,” NASA TM-2010-216720, July 2010. 4. Dwyer Cianciolo, A. M., Davis, J. L., Engelund, W. C., Komar, D. R., et al, “Entry, Descent and Landing Systems Analysis Study: Phase 2 Report,” NASA TM-2011-217055, February, 2011. 5. Edquist, K. T., Dyakonov, A. A., Wright, M. J., and Tang, C. Y., “Aerothermodynamic Design of the Mars Science Laboratory Heatshield,” AIAA Paper 2009-4075, 41st AIAA Thermophysics Conference, San Antonio, TX, June 22-25, 2009. 6. Way, D. W., “Preliminary Assessment of the Mars Science Laboratory Entry, Descent and Landing, Simulation,” IEEEAC Paper 2755, 2013 IEEE Aerospace Conference, Big Sky, MT, March 2-9, 2013. 7. Edquist, K. T., Hollis, B. R., Johnston, C. O., Bose, D., White, T. R., and Mahzari, M., “Mars Science Laboratory Heat Shield Aerothermodynamics: Design and Reconstruction,” Journal of Spacecraft and Rockets, Vol. 51, No. 4, July-August 2014, pp. 1106-1124. 8. Hollis, B. R. and Prabhu, D. K. “Assessment of Laminar, Convective Aeroheating Prediction Uncertainties for Mars-Entry Vehicles,” Journal of Spacecraft and Rockets, Vol. 50, No. 1., January-February 2013, pp. 56-68. 9. MacLean, M., Dufrene, A., Carr, Z., Parker, R. and Holden, M., “Measurements and Analysis of Mars Entry, Descent and Landing Aerothermodynamics at Flight-Duplicated Enthalpies in LENS-XX Expansion Tunnel,” AIAA Paper 2015-1897, AIAA SciTech Conference, Kissimmee, FL, January 5-9, 2015. 10. Dufrene, A., MacLean, M., Parker, R., Wadhams, T., and Holden, M., “Characterization of the New LENS Expansion Tunnel Facility,” AIAA Paper 2010-1564, 48th AIAA Aerospace Sciences Meeting & Exhibit, Orlando, FL, January 4-7, 2010. 11. Dufrene, A., MacLean, M., and Holden, M., “Experimental Characterization of the LENS Expansion Tunnel Facility Including Blunt Body Surface Heating,” AIAA Paper 2011-0626, 49th AIAA Aerospace Sciences Meeting, Orlando, FL, January 4-7, 2011. 12. MacLean, M., Dufrene, A., and Holden, M., “Spherical Capsule Heating in High Enthalpy Carbon Dioxide in LENS-XX Expansion Tunnel,” AIAA Paper 2013-0906, 51st AIAA Aerosciences Meeting, Grapevine, TX, January 7-10, 2013. 13. MacLean, M., Dufrene, A., Wadhams, T., and Holden, M., “Numerical and Experimental Characterization of High Enthalpy Flow in an Expansion Tunnel Facility,” AIAA Paper 2010-1562, 48th AIAA Aerospace Sciences Meeting & Exhibit, Orlando, FL, January 4-7, 2010. 14. Parker, R., Wakeman, T., MacLean. M., and Holden, M. “Measuring Nitric Oxide Freestream Velocity Using Quantum Cascade Lasers at CUBRC,” AIAA Paper 2007–1329, 45th Aerospace Sciences Meeting & Exhibit, Reno, NV, January 8-11, 2007. 15. Marineau, E. C., Lewis, D. R., Smith, M. S., Lafferty, J. F., White, M. E., and Amar. A. J., “Investigation of Hypersonic Laminar Augmentation in the Stagnation Region,” AIAA Paper 2013-0308, 51st AIAA Aerospace Sciences Meeting, Grapevine, TX, January 7-10, 2013. 16. Mazaheri, A., Gnoffo, P. A., Johnston, C. O. and Kleb, W. L., “LAURA Users Manual: 5.5-65135,” NASA TM-2013-217800, February, 2013. 17. Wright, M. W., White, T. and Mangini, N., “Data Parallel Line Relaxation (DPLR) Code User Manual Acadia – Version 4.01.1,” NASA TM-2009-215388, October, 2009. 18. Johnston, C. O. and Brandis, A. M., “Modeling of Nonequilibrium CO Fourth-Positive and CN Violet Emission in CO2-N2 Gases,” Journal of Quantitative Spectroscopy & Radiative Transfer, Vol. 149, pp. 303-17, 2014. 19. Johnston, C. O., Brandis, A. M., and Sutton, K., “Shock Layer Radiation Modeling and Uncertainty for Mars Entry,” AIAA Paper 2012-2866, 43rd AIAA Thermophysics Conference, New Orleans, LA, June 25-28, 2012. 20. Marschall, J., Copeland, R. A., Hwang, H. H. and Wright, M. J., “Surface Catalysis Experiments on Metal Surface in Oxygen and Carbon Monoxide Mixtures,” AIAA 2006-0181, 44th AIAA Aerospace Sciences Meeting and Exhibit, Reno, NV, January 9-12, 2006. 21. Baldwin, B. S. and Lomax, H., “Thin Layer Approximation and Algebraic Model for Separated Turbulent Flows,” AIAA Paper 1978-0257, AIAA 16th Aerospace Sciences Meeting, Huntsville, AL, January 16-18, 1978. 22. Cebeci, T. and Smith, A. M. O., “Calculation of Compressible Adiabatic Turbulent Boundary Layers,” AIAA Paper 1969-0687, AIAA Fluid and Plasma Dynamics Conference, San Francisco, CA, June 16-18, 1969. 23. Hollis, B. R., “Blunt-Body Entry Vehicle Aerothermodynamics: Transition and Turbulent Heating,” Journal of Spacecraft and Rockets, Vol. 49, No. 3, May-June 2012, pp. 435-449. 24. Hollis, B. R. and Collier, A. S., “Turbulent Aeroheating Testing of Mars Science Laboratory Entry Vehicle,” Journal of Spacecraft and Rockets, Vol. 45, No. 3, May-June 2008, pp. 417-427. 25. Hollis, B. R., Berger, K. T., Horvath, T. J., Coblish, J. J., Norris, J. D., Lillard, R. P. and Kirk, B. S., “Aeroheating Testing and Predictions for Project Orion Crew Exploration Vehicle,” Journal of Spacecraft and Rockets, Vol. 46, No. 4, July-August 2009, pp. 766-780.

American Institute of Aeronautics and Astronautics
36

![Thermochemistry [Thermochemical Equations, Enthalpy Change and Standard Enthalpy of Formation]](https://img.pdfslide.net/doc/110x75/557ddcecd8b42a4e358b4995/thermochemistry-thermochemical-equations-enthalpy-change-and-standard-enthalpy-of-formation.jpg)