Embed Size (px)
DESCRIPTION
IMPROVED AEROTHERMODYNAMIC MEASUREMENTS OF A T63-A-700 GAS TURBINE ENGINE
Citation preview

NAVAL
POSTGRADUATE SCHOOL
MONTEREY, CALIFORNIA
THESIS
Approved for public release; distribution is unlimited.
IMPROVED AEROTHERMODYNAMIC MEASUREMENTS OF THE T63-A-700 GAS TURBINE
ENGINE
by
Kristin B. Garrott
September 2005
Thesis Advisor: Knox. T. Millsaps, Jr. Second Reader: Garth V. Hobson

THIS PAGE INTENTIONALLY LEFT BLANK

i
REPORT DOCUMENTATION PAGE Form Approved OMB No. 0704-0188 Public reporting burden for this collection of information is estimated to average 1 hour per response, including the time for reviewing instruction, searching existing data sources, gathering and maintaining the data needed, and completing and reviewing the collection of information. Send comments regarding this burden estimate or any other aspect of this collection of information, including suggestions for reducing this burden, to Washington headquarters Services, Directorate for Information Operations and Reports, 1215 Jefferson Davis Highway, Suite 1204, Arlington, VA 22202-4302, and to the Office of Management and Budget, Paperwork Reduction Project (0704-0188) Washington DC 20503. 1. AGENCY USE ONLY (Leave blank)
2. REPORT DATE September 2004
3. REPORT TYPE AND DATES COVERED Master’s Thesis
4. TITLE AND SUBTITLE: Improved Aerothermodynamic Measurements of the T63-A-700 Gas Turbine Engine. 6. AUTHOR(S) Garrott, Kristin B.
5. FUNDING NUMBERS
7. PERFORMING ORGANIZATION NAME(S) AND ADDRESS(ES) Naval Postgraduate School Monterey, CA 93943-5000
8. PERFORMING ORGANIZATION REPORT NUMBER
9. SPONSORING /MONITORING AGENCY NAME(S) AND ADDRESS(ES) N/A
10. SPONSORING/MONITORING AGENCY REPORT NUMBER
11. SUPPLEMENTARY NOTES The views expressed in this thesis are those of the author and do not reflect the official policy or position of the Department of Defense or the U.S. Government. 12a. DISTRIBUTION / AVAILABILITY STATEMENT Approved for public release; distribution is unlimited.
12b. DISTRIBUTION CODE
13. ABSTRACT (maximum 200 words) This thesis contains an analysis of the failure of the instrumentation ring for measuring the combustor exit
temperature and total pressure in the T63-A-700 gas turbine engine. An improved ring design has been constructed and installed. Extensions to the exhaust stacks have been installed to keep the cell temperature reasonable. A water-cooled heat exchanger was installed in place of an air-cooled heat exchanger that was not adequately cooling the oil temperature while running the engine. In the program GASTURB, a compressor map with data from the manufacturer was created and an operating line from three separate speeds was plotted.
15. NUMBER OF PAGES 77
14. SUBJECT TERMS Compressor map, GASTURB, Heat exchanger, SMOOTHC, Thermocouple
16. PRICE CODE
17. SECURITY CLASSIFICATION OF REPORT
Unclassified
18. SECURITY CLASSIFICATION OF THIS PAGE
Unclassified
19. SECURITY CLASSIFICATION OF ABSTRACT
Unclassified
20. LIMITATION OF ABSTRACT
UL
NSN 7540-01-280-5500 Standard Form 298 (Rev. 2-89) Prescribed by ANSI Std. 239-18

ii
THIS PAGE INTENTIONALLY LEFT BLANK

iii
Approved for public release; distribution is unlimited.
IMPROVED AEROTHERMODYNAMIC MEASUREMENTS OF A T63-A-700 GAS TURBINE ENGINE
Kristin B. Garrott
Ensign, United States Navy B.S., United States Naval Academy, 2004
Submitted in partial fulfillment of the requirements for the degree of
MASTER OF SCIENCE IN MECHANICAL ENGINEERING
from the
NAVAL POSTGRADUATE SCHOOL September 2005
Author: Kristin B. Garrott
Approved by: Knox T. Millsaps, Jr.
Thesis Advisor
Garth V. Hobson Second Reader
Anthony J. Healey Chairman, Department of Mechanical Engineering

iv
THIS PAGE INTENTIONALLY LEFT BLANK

v
ABSTRACT This thesis contains an analysis of the failure of the instrumentation ring for
measuring the combustor exit temperature and total pressure in the T63-A-700 gas
turbine engine. An improved ring design has been constructed and installed. Extensions
to the exhaust stacks have been installed to keep the cell temperature reasonable. A
water-cooled heat exchanger was installed in place of an air-cooled heat exchanger that
was not adequately cooling the oil temperature while running the engine. In the program
GASTURB, a compressor map with data from the manufacturer was created and an
operating line from three separate speeds was plotted.

vi
THIS PAGE INTENTIONALLY LEFT BLANK
vii
TABLE OF CONTENTS
I. INTRODUCTION........................................................................................................1 A. BACKGROUND ..............................................................................................1 B. MOTIVATION ................................................................................................1 C. OBJECTIVES ..................................................................................................1 D. OVERVIEW OF THESIS CONTENTS........................................................2
II. EXISTING FACILITY INSTRAMENTATION ......................................................3 A. OVERVIEW.....................................................................................................3 B. MASS FLOW RATE MEASUREMENT DEVICES ...................................3 C. PRESSURE MEASUREMENT DEVICES...................................................3 D. TEMPERATURE MEASUREMENT DEVICES.........................................4
III. FACILITY CHANGES ...............................................................................................9 A. PROBLEMS WITH THE FACILITY...........................................................9 B. EXHAUST PIPE EXTENSIONS ...................................................................9 C. HEAT EXCHANGER .....................................................................................9
IV. IMPROVED DESIGN OF THE THERMOCOUPLE RING AT GAS GENERATOR TURBINE INLET ...........................................................................15 A. PROBLEMS WITH THE ORIGINAL RING DESIGN............................15 B. NEW THERMOCOUPLE RING DESIGNS ..............................................15
V. THE GASTURB MODEL.........................................................................................21 A. PUTTING COMPRESSOR DATA INTO PROPER FORMAT ..............21 B. IMPORTING DATA INTO SMOOTHC ....................................................21 C. USING GASTURB TO PLOT THE OPERATING POINTS ...................21
VI. CONCLUSIONS AND RECOMMENDATIONS..................................................27
APPENDIX A. THERMOCOUPLE RING DRAWINGS.................................................29 A. RECOMMENDED DESIGN (NOT USED DUE TO TIME
CONSTRAINTS) ...........................................................................................29 B. DESIGN DRAWING (INSTALLED IN ENGINE) ....................................30
APPENDIX B. COMPRESSOR MAP DATA FROM MANUFACTURER...................31
APPENDIX C. MATLAB PROGRAM TO PLOT COMPRESSOR MAP ....................35
APPENDIX D. PROCEDURE FOR SMOOTHC DATA INPUT AND EXPORTATION INTO GASTURB ........................................................................37
APPENDIX E. OUTPUT DATA IN GASTURB USING COMPRESSOR MAP MODEL ......................................................................................................................39 A. OUTPUT FOR 100% DESIGN SPEED ......................................................39 B. OUTPUT FOR 90% DESIGN SPEED ........................................................40 C. OUTPUT FOR 80% DESIGN SPEED ........................................................41
APPENDIX F. STANDARD OPERATING PROCEDURES FOR ALIGNMENT AND OPERATION OF THE GAS TURBINE AND DYNAMOMETER TEST SYSTEM..........................................................................................................43

viii
LIST OF REFERENCES......................................................................................................59
INITIAL DISTRIBUTION LIST .........................................................................................61

ix
LIST OF FIGURES Figure 1. T63-A-700 Gas Turbine Engine ........................................................................6 Figure 2. Fabricated GGT ring assembly (old) .................................................................7 Figure 3. Installed GGT ring assembly .............................................................................8 Figure 4. Old Exhaust Pipe setup ....................................................................................11 Figure 5. Exhaust pipe extensions...................................................................................12 Figure 6. New heat exchanger.........................................................................................13 Figure 7. Assembled thermocouple ring .........................................................................18 Figure 8. Installed thermocouple ring .............................................................................19 Figure 9. Matlab figure for compressor map data (mass flow in lb/s) ............................23 Figure 10. Operating line on the engine specific compressor map created in
GASTURB with points at 100%, 90%, and 80% speeds.................................24 Figure 11. Results using both the generic and model compressor maps...........................25

x
THIS PAGE INTENTIONALLY LEFT BLANK

xi
LIST OF TABLES
Table 1. Results of both generic and model compressor maps……25

xii
THIS PAGE INTENTIONALLY LEFT BLANK

xiii
ACKNOWLEDGMENTS I extend my sincere appreciation to several persons whose great efforts
significantly contributed towards the development of this thesis.
I would first like to thank Professor Knox Millsaps for providing me with the
opportunity to pursue this thesis project.
I greatly appreciate the enormous efforts of Mr. Douglas Seivwright of the
Turbopropulsion Laboratory. Without his technical support and on-sight assistance, this
project would have never been completed.
Lastly, I would like to thank Professor Garth Hobson for his guidance and support
throughout the entire project.

xiv
THIS PAGE INTENTIONALLY LEFT BLANK

1
I. INTRODUCTION
A. BACKGROUND Gas turbines are widely used and very important in the military. These engines
are used on most surface ships and aircraft in the United States Navy. As the Navy
progresses into the 21st century the use of gas turbines on ships will become increasingly
abundant.
Due to the rise in importance of gas turbines to the Navy, it is necessary to
continue with the testing and analysis of this engine. Naval Postgraduate School is in
place to provide higher education to those in the military as well as those involved with
it, therefore it only makes sense that it should have a gas turbine engine for performance
testing. The Marine Propulsion Laboratory contains a T63-A-700 gas turbine engine as
well as all of the necessary means for testing and measuring. It is not only used for
experimental purposes, but also for thesis research and a hands-on learning environment
for the students.
B. MOTIVATION After running the engine for a laboratory, several problems with the engine were
identified. The engine could only run at full speed for a very limited period of time
because the heat exchanger was inadequate in cooling the oil. Additionally, the hot
exhaust gases that were supposed to be leaving the test cell were circulating throughout
it, therefore causing temperatures in the cell to be too high. Data indicated that the
majority of the temperature readings at the gas generator turbine inlet were faulty. This
was a result of the thermocouples that were measuring that temperature being
nonfunctioning. Performance measurements were compared to predictions made using a
performance code. The availability of a manufacturer supplied compressor map allowed
for more specific predictions of the engine performance.
C. OBJECTIVES The purpose of this thesis was to solve the problems discovered with the engine
and the facility. In order to keep the oil temperature cool enough to run the engine for
unlimited time at full speed, a water cooled heat exchanger was to be installed. This
would eliminate the problem of the stagnant air that was unable to cool the oil.

2
Extensions to the exhaust stacks were to be installed to allow the exhaust gases to escape
from the test cell and therefore keep an appropriate cell temperature. The bad
temperature readings at the gas generator turbine inlet were found to be due to an
inadequate design of the thermocouple ring that was measuring the temperatures in the
harsh environment. An improved design of the thermocouple ring was made and
installed. Several issues with the original ring were taken into account and improved
upon to make a more adequate design. Data were acquired from the manufacturer in
order to create a compressor map that would be specific to the test cell engine. The map
was imported into GASTURB, an engine performance prediction program, for more
realistic predictions of the engine off-design performance.
D. OVERVIEW OF THESIS CONTENTS The remainder of this thesis further discusses the motivations as well as objectives
and results aforementioned. Chapter II outlines the existing facility instrumentation
throughout the entire engine. There is mention of arising problems with the
instrumentation, but it is more clearly outlined in Chapter III. Chapter III also describes
changes made on the facility, including the new heat exchanger and the exhaust stack
extensions. Chapter IV covers the problems with the original thermocouple ring at the
gas generator turbine inlet, considerations for the improved design, the improved design,
and the installation of the new design. Chapter V discusses the process of making the
engine specific compressor map and using the program GASTURB to create an operating
line on the engine specific compressor map as well as predict the off-design performance
such as power production and fuel consumption at off-design. Chapter VI covers the
conclusions of the work completed in this thesis.

3
II. EXISTING FACILITY INSTRAMENTATION
A. OVERVIEW There are various types of measuring devices throughout the engine, shown in
figure 1, to measure temperature, pressure, and mass flows of fuel and air. This
instrumentation was designed in 1996 and has not been altered since. This section will
discuss the locations and types of measuring devices with which the engine is equipped
[Ref. 2].
B. MASS FLOW RATE MEASUREMENT DEVICES
Mass flow rates are derived from the volumetric flow rates of both air and fuel.
First, in terms of air flow, dual turbine flowmeters are on the engine’s inlet plenum. The
values can be read on the Superflow 901 system display. Next, a calibrated bell mouth is
installed on the compressor inlet. It is possible to calculate the mass flow rate with the
following information: cross-sectional area of the bell mouth housing and both static and
total pressures at the compressor inlet. Measurement of the fuel flow is also
accomplished with a turbine flowmeter. Again, results are displayed on the Superflow
901 system.
C. PRESSURE MEASUREMENT DEVICES
Both pitot tubes and Kiel-type probes are used to measure total pressures
throughout the engine. Static pressures are measured with end wall static pressure ports.
At the compressor inlet, there is a single pitot tube to measure the total pressure entering
the compressor (PT1). A static pressure ring is on the inner surface of the bell mouth with
four inputs that are mechanically averaged. Because both static and total pressures are
measured, the air flow is measured and compared to the air flow rate measured with the
turbine flowmeters. At the compressor outlet, a Kiel-type probe measures the pressure
(PT2). Probes are positioned between the exits of the scroll type diffuser and the inlet to
the two circular ducts. There is no measurement of pressure at the combustor inlet (PT3)
because the combustor casing is too thin to safely install a measurement device. The gas
generator turbine inlet total pressure (PT4) is measured by two pitot tubes installed on a
thermocouple ring assembly. The pitot tubes are made from Inconnel 600 and are 1/8” in

4
diameter. They are placed 180° apart from each other. Both pressures are displayed in
the results and they are also averaged to get the total pressure. A Kiel probe design is
used to measure the gas generator outlet pressure. They are both inserted through two of
the existing openings for the thermocouple harness. The probes are located 90° apart
from each other and are at the midpoint of the flow path. Both pressures are separately
measured and the average is taken to acquire the total pressure (PT5). At the power
turbine exhaust a static pressure is taken, which is an industry standard. There is a static
pressure ring on each exhaust pipe which has 8 static pressure ports which are
pneumatically averaged in the results.
D. TEMPERATURE MEASUREMENT DEVICES
Temperature measurements throughout the entire engine are made with K-type
thermocouples. The K-type thermocouple was originally selected because of its
operating range and accuracy in temperature measurements. There are thermocouples
placed at each end of every major engine component (compressor, gas generator turbine,
power turbine). At the compressor inlet, there are two K-type thermocouples placed at
two different radii in the calibrated bell mouth. Both temperatures are averaged to get the
total compressor inlet temperature (TT1). At the outlet, there are two more
thermocouples, this time placed within the Kiel probe, which makes them combination
probes. The two temperatures are again averaged to obtain the total compressor
discharge temperature (TT2). The combustor inlet temperature (TT3) is not measured to
maintain the engine’s integrity. The gas generator turbine inlet temperature measurement
is the most complex of the instrumentation on the engine. There is a large non-
uniformity in the fuel burn at this stage and as a result there are hot spots and cool spots
that develop. As a result of this, a thermocouple ring containing 48 K-type
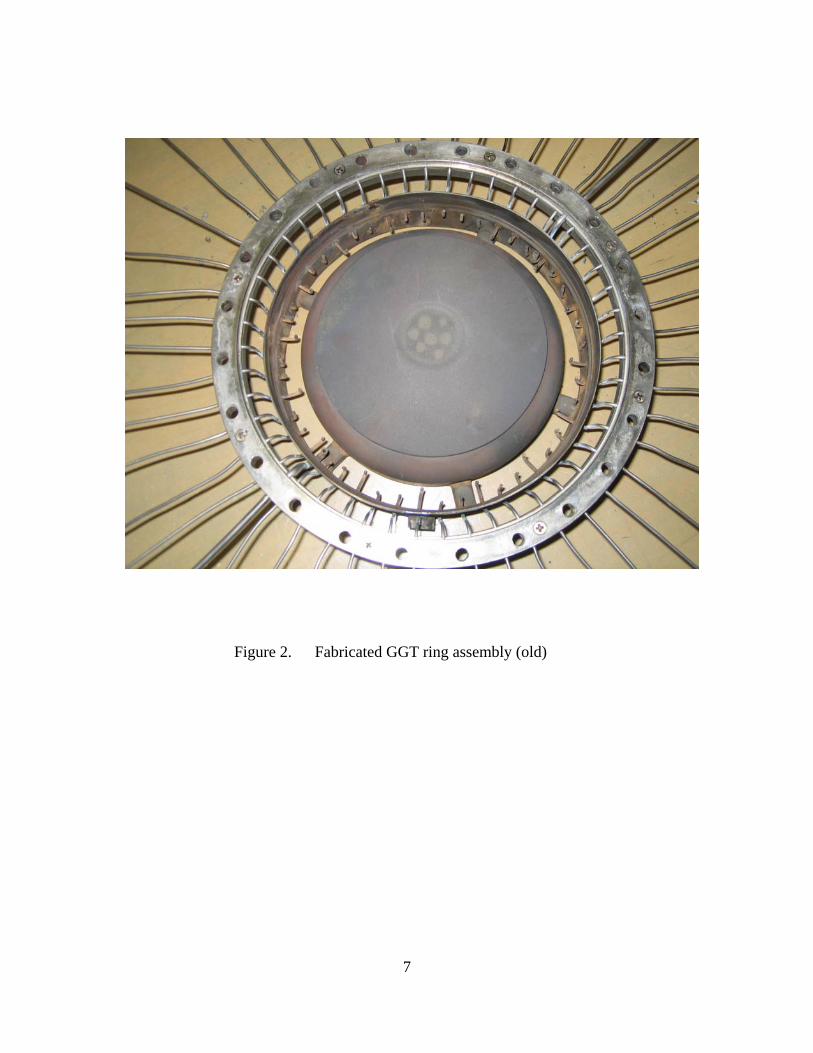
thermocouples is placed at the entrance to the gas generator turbine as pictured in figures
2 and 3. Each thermocouple is places 7.5° apart and is placed at three different radial
locations, giving 16 at each radius. Due to the extremely high temperatures at this stage,
the thermocouples used are encased in a 1/16” Inconnel sheath for protection. The ring
assembly is constructed of 347 stainless steel and the thermocouples are fitted in holes at
the designated angles. All 48 measurements are taken then a mass average is used to
compute the total temperature (TT4). A concern with this instrumentation was the

5
blockage in flow caused by the great number of thermocouples; however, it was
outweighed by the inaccuracy that would occur if fewer thermocouples were utilized.
After inspection of results from recorded data, it was determined that this device was no
longer sufficient in measuring the temperature at the gas generator turbine inlet. The
determination was due to bad temperature readings from more than half of the
thermocouples. At the power turbine inlet, which is also the gas generator outlet, there is
an onboard thermocouple harness. The original harness contained four locations for
thermocouples, but two were replaced by Kiel probes to allow for pressure measurement
at this stage. The thermocouples came with internal wiring so there is no need for
averaging results to get the total temperature (TT5). At each duct of the power turbine
exhaust there is two K-type thermocouples. The final power turbine outlet temperature
(TT6) is averaged from the two readings.

6
Figure 1. T63-A-700 Gas Turbine Engine
7
Figure 2. Fabricated GGT ring assembly (old)

8
Figure 3. Installed GGT ring assembly

9
III. FACILITY CHANGES
A. PROBLEMS WITH THE FACILITY After initially running the engine, there were two areas in which the facility
seemed to be inadequate: the temperature of the test cell after operating the engine for
only a short amount of time and the oil temperature were excessively high. The
temperature of the test cell was too high because the existing exhaust stacks were no long
enough, causing hot exhaust gases to leak into the cell. The time allowed for testing was
being severely limited due to the oil temperature rising too fast. This was determined to
be the fault of the air-cooled heat exchanger that was in place.
B. EXHAUST PIPE EXTENSIONS
After a class of students tested the engine in a lab, the cell temperature was
significantly higher than the outside temperature that it is supposed to maintain. It was
decided that this was due to the length of the exhaust pipes leading out of the cell. The
exhaust pipes did not reach the ceiling of the room, therefore allowing hot exhaust air to
flow throughout the cell rather than escaping directly outside. The length of the original
exhaust pipes is shown in figure 4. To remedy this, longer exhaust pipes were
constructed and inserted before the final convergent nozzles as pictured in figure 5. They
are slight tapered at the exit to allow for more certainty that the exhaust gases will not be
able to escape into the test cell, but rather blow directly outside. The new exhaust pipes
are 1.5 feet longer than the original design. This should allow the test cell to remain at
the desired temperature, being that of the outside air.
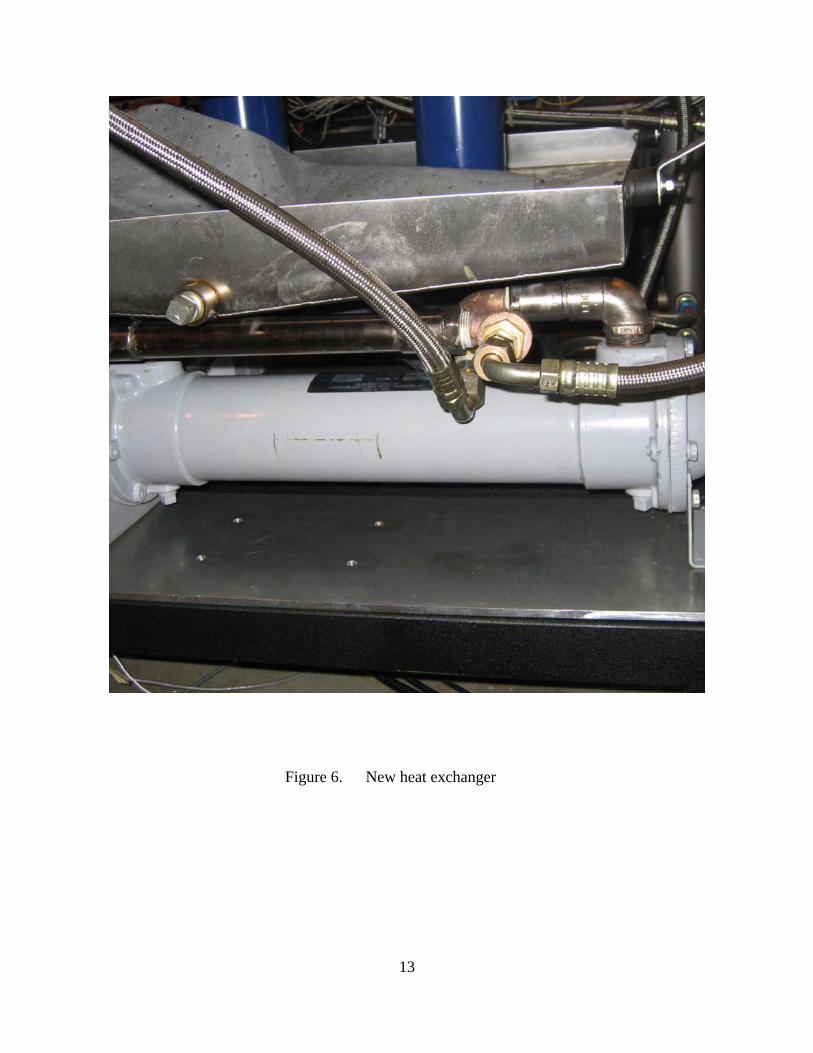
C. HEAT EXCHANGER
The heat exchanger in the original setup was a typical helicopter engine’s heat
exchanger that used air to cool the oil. The test cell has only stagnant air, therefore
rendering the heat exchanger inadequate to keep the oil cool enough. A fan was added in
an attempt to cool this stagnant air that was flowing through the engine, but was
unsuccessful. It was mounted on two blocks of wood and a rod approximately under the
bell mouth as shown in figure 6. The new heat exchanger is water cooled. It uses the
dynamometer water tank as its source for water. There is a small pipe inside of the inlet

10
pipe into the tank that runs to the opposite end of the engine where it is connected to the
heat exchanger. Since there is a constant mass flow through the inlet pipe of the
dynamometer tank, sufficient pressure will exist to get the water flowing and keep the oil
at the proper temperature. The new heat exchanger has been installed under the oil drip
pan on an existing panel that was used to support the old heat exchanger’s cooling fan.
This facility improvement should allow for unlimited use of the engine at full speed [Ref.
4].

11
Figure 4. Old Exhaust Pipe setup

12
Figure 5. Exhaust pipe extensions
13
Figure 6. New heat exchanger

14
THIS PAGE INTENTIONALLY LEFT BLANK

15
IV. IMPROVED DESIGN OF THE THERMOCOUPLE RING AT GAS GENERATOR TURBINE INLET
A. PROBLEMS WITH THE ORIGINAL RING DESIGN Examining the gas generator turbine inlet temperatures showed that there was a
lot of inconsistency in the readings; it was too great to be accounted for with the known
hot and cool spots in the temperature distribution. The assembly was disconnected and
taken out for observation. Each individual thermocouple was examined for both integrity
and working condition. Over half of the thermocouples were found to be nonfunctioning,
leading to the conclusion that a redesign of the ring was necessary.
The original ring, as shown in figure 2, placed all of the stress of the setup on the
bends in the thermocouples that connected to the turbine heat shield, which is made of
AMS5536 steel. The ring was essentially free in that the only things holding it in place
were the 48 thermocouples that were bent to go into the turbine heat shield. As a result,
several thermocouples had been overstressed at their bending point due to the differences
in thermal expansion rates of the varying materials used in the structure. There were also
a great deal of what appeared to be failures due to vibration [Ref. 3]. Additionally,
assembly of the ring was imprecise in that the thermocouples appeared to have been put
in one at a time without any guidance through the slots of the ring that would eventually
hold them in their places. This must have proved to be a grueling task, as all of the
thermocouples were eventually spot welded to the turbine heat shield, possibly another
cause for thermocouple failure. This was something that was not accounted for in the
instrumentation records.
B. NEW THERMOCOUPLE RING DESIGNS
The new design of the thermocouple ring, pictured in figures 7 and 8, was to
allow for the thermocouples (Omega TJ48-CAIN-116U-6-SB-LUG) to endure less stress
by not requiring them to support the ring, as well as protect them from vibrations, and
make the ring itself easier to construct. The original design was kept in that it was the
same size and material, as well as the use of 48 thermocouples and 2 pressure probes. A
sleeve was designed so that each thermocouple would be guided into the holes of the
turbine heat shield. This would avoid the thermocouples’ bent sections from absorbing

16
all of the stress from thermal expansion differences. The guide section is made of the
same material as the heat shield so that thermal expansion occurs at the same rate. The
new design will be put together by guiding the thermocouples through the bent sections
and putting the ends at the right radii and distance inside the heat shield space. After that
is complete, the ring will be placed onto the structure and the 48 thermocouples will be
put into the slots. The top section of the ring will be clamped and screwed together.
Once this is complete the engine can be put back together and all of the thermocouple
ends can be screwed into their respective ports on the control board for data acquisition.
After a few runs of the engine, the ends of the thermocouples will be tested to ensure that
they have not been damaged as severely as they had been in the previous design setup.
Due to time constraints in ordering and installation of the new design, it has not yet been
implemented.
With the decision not to install the new ring design, an alternate design was
chosen to be utilized in its place. The alternate design was the same as the original
design with the exception of the heat shield being slotted at each thermocouple location
rather than a drilled hole. This allowed for the thermocouple ring to be free of the heat
shield, and therefore less vulnerable to vibrations that were believed to have broken many
of the original thermocouples.
The bending of the thermocouples into place is an extremely time consuming
task, and very inaccurate if attempted by hand. Because there are only three different
distances at which the thermocouples were to be bent, jigs were made to ease in the
bending as well as to increase the uniformity of the thermocouples. Three jigs have been
constructed using a scrap piece of stainless steel and a few pegs. When designing the
jigs, the bending radius of the thermocouples was taken into account. The manufacturer
suggests never bending a thermocouple sharper than three times its diameter. In this case
1/16” thermocouples were to have a bending radius of less than or equal to 3/16”.
Sixteen thermocouples were bent in each of the three jigs and were compared to a full-
size design to ensure uniformity. The distances from the outer liner inner surface to the
thermocouple center points are: 0.08”, 0.23”, and 0.40”. This remained the same in both
new designs. In the original design, the sixteen thermocouples that were to be 0.08” from
the interior of the outer edge of the turbine heat shield had bends sharper than that

17
recommended by the manufacturer [Ref. 2]. This had to be done because each
thermocouple was placed in individually. With the new design, a continuous bend was
made for the 0.08” distance to keep within the suggestions of the manufacturer. Prior to
bending the thermocouples, each was marked at the point in which it would enter the
thermocouple ring. After all of the thermocouples were bent, they were lined up in their
places around the bottom half of the ring. The top half was then carefully clamped on, as
not to move any of the thermocouples out of place. Due to some inaccuracies in the
drilling of the slots for the thermocouple ring, small pieces of shim stock were used to
make the thermocouples snug inside their slots. Since the heat shield was slotted, as
mentioned before, the ring slid right into the slots. This eliminated a lot of the time it
originally took to insert each thermocouple into the heat shield then hand-bend it into
place. Engineering drawings of both a recommended design and the alternate design that
was constructed and installed are found in Appendix A.

18
Figure 7. Assembled thermocouple ring

19
Figure 8. Installed thermocouple ring

20
THIS PAGE INTENTIONALLY LEFT BLANK
21
V. THE GASTURB MODEL
A. PUTTING COMPRESSOR DATA INTO PROPER FORMAT
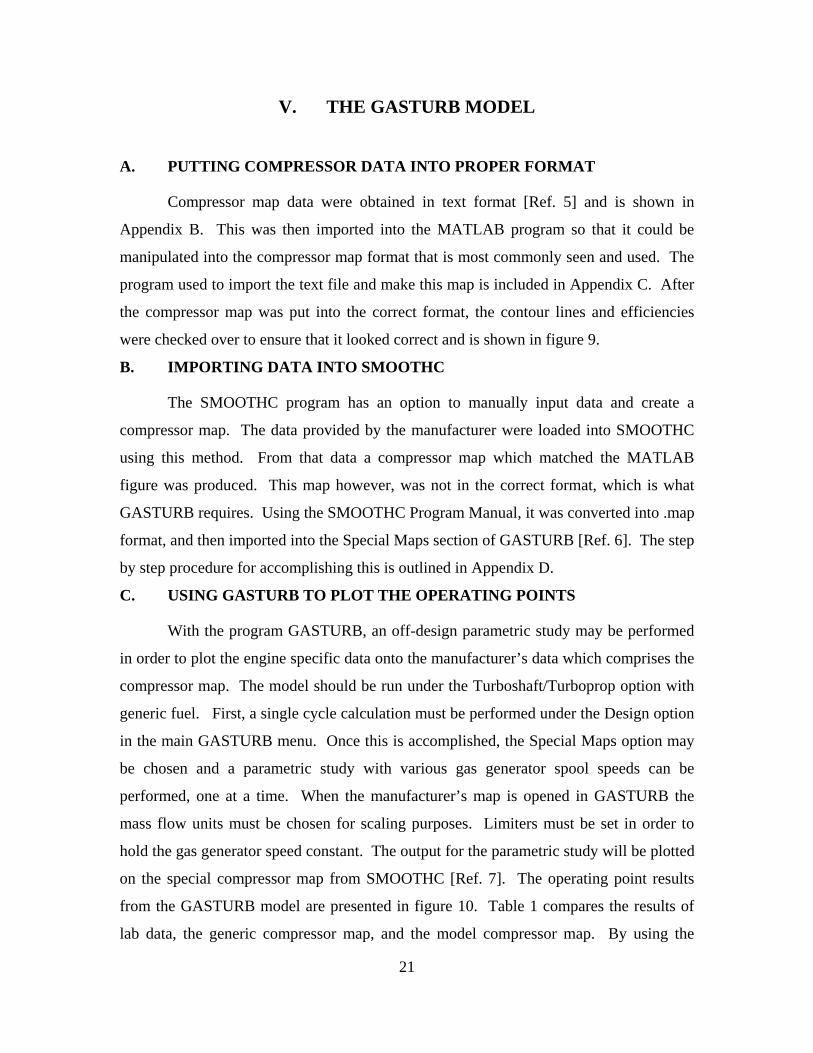
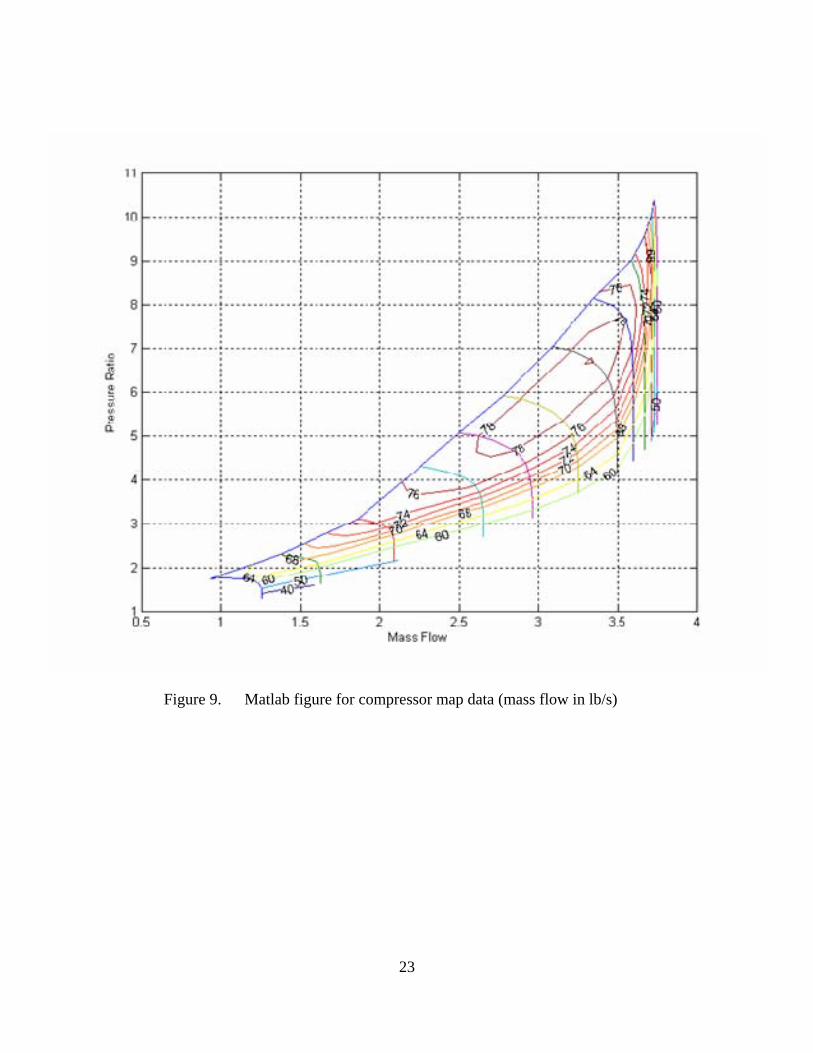
Compressor map data were obtained in text format [Ref. 5] and is shown in
Appendix B. This was then imported into the MATLAB program so that it could be
manipulated into the compressor map format that is most commonly seen and used. The
program used to import the text file and make this map is included in Appendix C. After
the compressor map was put into the correct format, the contour lines and efficiencies
were checked over to ensure that it looked correct and is shown in figure 9.
B. IMPORTING DATA INTO SMOOTHC
The SMOOTHC program has an option to manually input data and create a
compressor map. The data provided by the manufacturer were loaded into SMOOTHC
using this method. From that data a compressor map which matched the MATLAB
figure was produced. This map however, was not in the correct format, which is what
GASTURB requires. Using the SMOOTHC Program Manual, it was converted into .map
format, and then imported into the Special Maps section of GASTURB [Ref. 6]. The step
by step procedure for accomplishing this is outlined in Appendix D.
C. USING GASTURB TO PLOT THE OPERATING POINTS
With the program GASTURB, an off-design parametric study may be performed
in order to plot the engine specific data onto the manufacturer’s data which comprises the
compressor map. The model should be run under the Turboshaft/Turboprop option with
generic fuel. First, a single cycle calculation must be performed under the Design option
in the main GASTURB menu. Once this is accomplished, the Special Maps option may
be chosen and a parametric study with various gas generator spool speeds can be
performed, one at a time. When the manufacturer’s map is opened in GASTURB the
mass flow units must be chosen for scaling purposes. Limiters must be set in order to
hold the gas generator speed constant. The output for the parametric study will be plotted
on the special compressor map from SMOOTHC [Ref. 7]. The operating point results
from the GASTURB model are presented in figure 10. Table 1 compares the results of
lab data, the generic compressor map, and the model compressor map. By using the

22
model compressor map, the results in GASTURB for power remained approximately
equal, while the results for the fuel consumption were closer to design values. For 100%
design speed, the power predictions were the same for both the generic and model maps.
For 90% and 80% design speeds, the power prediction was about 2% and 12% different,
respectively. The power predictions for both the generic map and the model map were
higher than measured in the lab for the 100% and 90% speeds, possibly because of
inaccuracies in instrument measurement in the engine facility. The values measured for
fuel consumption improved for all three speeds with the model map. With decreasing
speed, the fuel consumption prediction of the model increasingly improved over the
prediction of the generic values. At 100% design speed, the results of both generic and
model predictions were about equal. At 90% design speed the model prediction was
approximately 2% better than the generic prediction, and at 80% design speed the model
prediction was about 8% improved.
23
Figure 9. Matlab figure for compressor map data (mass flow in lb/s)

24
Figure 10. Operating line on the engine specific compressor map created in GASTURB with points at 100%, 90%, and 80% speeds.

25
Power Comparison N1 (RPM) kw (lab) kW (generic) kW (model)
35000 174.57 220.7 220.7 31500 110.44 117.5 120 28000 56.3 44.7 49.4
Specific Fuel Consumption Comparison (SFC) in kg/(kW*h) N1 (RPM) SFC (lab) SFC (generic) SFC (model)
35000 0.4228 0.43359 0.43359 31500 0.4732 0.54326 0.52383 28000 0.6703 0.94806 0.86071
Table 1. Results for both the generic and model compressor maps

26
THIS PAGE INTENTIONALLY LEFT BLANK

27
VI. CONCLUSIONS AND RECOMMENDATIONS
The improvements on the T63-A-700 gas turbine engine, the facility, and the
engine specific compressor map are complete. The heat exchanger has been installed, but
not yet validated due to engine having not yet been run at full speed for any length of
time. Exhaust stack extensions are in place, but again have not been verified to work
because of the condition of the engine. The improved thermocouple ring design is
installed. Data has not yet been collected to validate the improved design. The
GASTURB model was created from previous data taken in a class laboratory. With the
operating line model, the results when running off-design calculations have been
improved. To further improve the results of this model, a turbine map model should be
created and used in conjunction with the new compressor map model.

28
THIS PAGE INTENTIONALLY LEFT BLANK

29
APPENDIX A. THERMOCOUPLE RING DRAWINGS
A. RECOMMENDED DESIGN (NOT USED DUE TO TIME CONSTRAINTS)

30
B. DESIGN DRAWING (INSTALLED IN ENGINE)

31
APPENDIX B. COMPRESSOR MAP DATA FROM MANUFACTURER
Note: SPD= speed (100%=51,120 rpm), FLOW= mass flow, RC= compressor pressure
ratio, EFF= compressor adiabatic efficiency, DTOT= unknown, WBL= bleed mass flow,
HP= power required (% design speed)
SPD FLOW RC EFF DTOT WBL HP 50 1.2579 1.2816 0.2919 0.2513 0 55.7108 50 1.2579 1.4002 0.4013 0.2514 0 55.733 50 1.2558 1.5164 0.4986 0.2531 0 56.0173 50 1.2398 1.614 0.577 0.2538 0 55.457 50 1.2077 1.6861 0.6236 0.2579 0 54.8963 50 1.1574 1.725 0.6398 0.2632 0 53.6937 50 1.0956 1.7363 0.6336 0.2692 0 51.9898 50 1.0398 1.746 0.6209 0.2777 0 50.9055 50 0.985 1.7468 0.6012 0.287 0 49.842 50 0.93 1.737 0.5793 0.2946 0 48.3098
SPD FLOW RC EFF DTOT WBL HP 60 1.6329 1.635 0.4167 0.3611 0 104.0667 60 1.6329 1.7546 0.4811 0.3614 0 104.1536 60 1.6305 1.8715 0.5412 0.3615 0 104.0295 60 1.6227 1.9814 0.594 0.3624 0 103.7821 60 1.6121 2.0866 0.6417 0.3636 0 103.4474 60 1.5836 2.1657 0.6723 0.3666 0 102.4612 60 1.5317 2.2069 0.683 0.3707 0 100.2167 60 1.4778 2.2375 0.6855 0.3765 0 98.2108 60 1.4245 2.2611 0.6838 0.3829 0 96.2854 60 1.3736 2.281 0.6796 0.3899 0 94.5528
SPD FLOW RC EFF DTOT WBL HP 70 2.0918 2.1361 0.4987 0.4836 0 178.8461 70 2.0918 2.2863 0.5494 0.4831 0 178.6598 70 2.0918 2.4365 0.5962 0.484 0 178.9839 70 2.0922 2.5872 0.6416 0.4844 0 179.1785 70 2.088 2.7319 0.6799 0.4872 0 179.8605 70 2.0687 2.8552 0.71 0.4902 0 179.3039 70 2.026 2.9417 0.7282 0.4937 0 176.8661 70 1.9804 3.0177 0.741 0.4985 0 174.5799 70 1.9224 3.0674 0.7455 0.504 0 171.3532 70 1.8599 3.1012 0.7453 0.5099 0 167.7386

32
SPD FLOW RC EFF DTOT WBL HP 80 2.6573 2.6956 0.5351 0.6083 0 286.3948 80 2.6573 2.9576 0.5938 0.6078 0 286.1567 80 2.6572 3.2195 0.6487 0.6076 0 286.0507 80 2.6522 3.475 0.6987 0.6079 0 285.6551 80 2.6347 3.7118 0.7402 0.6102 0 284.8558 80 2.5953 3.9122 0.7662 0.6179 0 284.1774 80 2.5241 4.0538 0.774 0.6308 0 282.2196 80 2.4389 4.1575 0.774 0.6445 0 278.6893 80 2.3494 4.2366 0.7705 0.6577 0 274.0305 80 2.26 4.2982 0.766 0.6695 0 268.3934
SPD FLOW RC EFF DTOT WBL HP 85 2.9648 3.1292 0.5666 0.6749 0 354.9663 85 2.9648 3.4488 0.6235 0.6754 0 355.2382 85 2.9635 3.7667 0.6762 0.676 0 355.402 85 2.9516 4.0697 0.723 0.677 0 354.5054 85 2.9244 4.3475 0.7572 0.6836 0 354.7091 85 2.8781 4.5889 0.778 0.6953 0 355.1512 85 2.7984 4.7634 0.7832 0.7114 0 353.427 85 2.7073 4.9002 0.7833 0.7271 0 349.5803 85 2.6072 5.0001 0.7792 0.7422 0 343.7552 85 2.4982 5.0603 0.7714 0.7565 0 335.8299
SPD FLOW RC EFF DTOT WBL HP 90 3.2587 3.694 0.5982 0.7496 0 433.9925 90 3.2587 4.0527 0.6494 0.7499 0 434.1748 90 3.2566 4.4085 0.6973 0.7499 0 433.9008 90 3.243 4.7471 0.7377 0.7526 0 433.6692 90 3.2126 5.0562 0.7641 0.7631 0 435.6944 90 3.1637 5.3274 0.7794 0.7782 0 437.6944 90 3.0896 5.5428 0.7853 0.7952 0 436.9416 90 2.9995 5.7113 0.785 0.8128 0 433.7557 90 2.8966 5.8342 0.7804 0.83 0 427.9036
SPD FLOW RC EFF DTOT WBL HP 95 3.4986 4.1388 0.5879 0.8417 0 524.2885 95 3.4986 4.5612 0.6381 0.841 0 523.8065 95 3.4973 4.9817 0.684 0.8413 0 523.8082 95 3.4915 5.3949 0.7246 0.8437 0 524.4598 95 3.4792 5.7959 0.7542 0.8542 0 529.2426 95 3.4542 6.1713 0.7765 0.8674 0 533.7198 95 3.4052 6.4949 0.7865 0.8869 0 538.2191 95 3.3291 6.7516 0.7872 0.9094 0 539.8251 95 3.2266 6.9333 0.7821 0.9314 0 536.1426 95 3.0939 7.0216 0.7663 0.9581 0 529.1696

33
SPD FLOW RC EFF DTOT WBL HP 100 3.6022 4.434 0.5607 0.9331 0 599.7024 100 3.6022 4.9139 0.6092 0.9326 0 599.341 100 3.6022 5.3939 0.654 0.9327 0 599.4066 100 3.6022 5.8738 0.6949 0.9343 0 600.4579 100 3.6015 6.3525 0.7275 0.943 0 606.0587 100 3.5985 6.8267 0.7542 0.9553 0 613.6342 100 3.5866 7.282 0.7738 0.9716 0 622.2875 100 3.5507 7.6822 0.7807 0.9966 0 632.2998 100 3.4725 7.9756 0.777 1.0249 0 636.384 100 3.3485 8.137 0.7623 1.0572 0 633.5181 SPD FLOW RC EFF DTOT WBL HP 105 3.6732 4.685 0.5324 1.0253 0 673.468 105 3.6732 5.1893 0.5762 1.0259 0 673.8387 105 3.6732 5.6936 0.6179 1.0251 0 673.2861 105 3.6732 6.1979 0.6552 1.0271 0 674.6472 105 3.6732 6.7022 0.6864 1.0346 0 679.7023 105 3.6732 7.2065 0.7119 1.0469 0 687.9978 105 3.6708 7.7058 0.7324 1.0626 0 698.1384 105 3.6579 8.1809 0.748 1.0804 0 707.6632 105 3.6333 8.6247 0.7528 1.1087 0 721.8776 105 3.592 9.0198 0.7479 1.146 0 738.4125 SPD FLOW RC EFF DTOT WBL HP 110 3.7138 4.8925 0.5021 1.1223 0 747.1707 110 3.7138 5.4241 0.543 1.1228 0 747.5199 110 3.7138 5.9557 0.5812 1.1229 0 747.6028 110 3.7138 6.4874 0.6164 1.1241 0 748.4247 110 3.7138 7.019 0.6453 1.1324 0 754.117 110 3.7138 7.5506 0.6684 1.1466 0 763.8632 110 3.7138 8.0822 0.6877 1.1636 0 775.5425 110 3.7133 8.6127 0.705 1.1806 0 787.128 110 3.6999 9.1112 0.7167 1.2015 0 798.627 110 3.6732 9.5713 0.72 1.231 0 812.9879 SPD FLOW RC EFF DTOT WBL HP 115 3.7341 5.0711 0.4737 1.2199 0 818.7921 115 3.7341 5.6274 0.5123 1.2196 0 818.5422 115 3.7341 6.1838 0.5479 1.22 0 818.8336 115 3.7341 6.7401 0.5799 1.2232 0 821.0536 115 3.7341 7.2964 0.6064 1.233 0 827.8564 115 3.7341 7.8528 0.6259 1.2522 0 841.1927 115 3.7341 8.4091 0.641 1.276 0 857.7512 115 3.7334 8.9637 0.655 1.2981 0 872.9868 115 3.7254 9.4996 0.6669 1.3198 0 886.2195 115 3.7138 10.0233 0.6702 1.3545 0 907.585

34
AT SURGE:
NC WA RC RC/WA 50 0.93 1.737 1.8677 60 1.3736 2.281 1.6606 70 1.8599 3.1012 1.6674 80 2.26 4.2982 1.9019 85 2.4982 5.0603 2.0256 90 2.78 5.9053 2.1242 95 3.0939 7.0216 2.2695 100 3.3485 8.137 2.43 105 3.592 9.0198 2.5111 110 3.6732 9.5713 2.6057 115 3.7138 10.0233 2.6989

35
APPENDIX C. MATLAB PROGRAM TO PLOT COMPRESSOR MAP
clear all % Raw data is loaded Raw_data = load('compressor map data raw.txt'); % Surge data is loaded Surge_data = load('compressor map data surge.txt'); % Data is named Speed_lines = Raw_data(:,1); % first column are the speed lines Mass_flow = Raw_data(:,2); % second column is mass flow Pressure_ratio = Raw_data(:,3); % third column is pressure ratio Efficiency = Raw_data(:,4); % efficiency of compressor Surge_Mass_flow= Surge_data(:,2); % surge mass flow rate Surge_Press_ratio= Surge_data(:,3) % surge pressure ratio % Data is reshaped to be one column per speed line Speed_lines = reshape(Speed_lines,10,12); Mass_flow = reshape(Mass_flow,10,12); % may need to change the number
of column and rows depending on the number of speed lines Pressure_ratio = reshape(Pressure_ratio,10,12); Efficiency = reshape(Efficiency,10,12); figure(1); close; figure(1); plot(Mass_flow,Pressure_ratio) hold on plot(Surge_Mass_flow,Surge_Press_ratio) figure(2); close; figure(2); [c,h] = contour(Mass_flow,Pressure_ratio,100*Efficiency,[40 50 60 64 68 70 72
74 76 78 78.7]); clabel(c,h) figure(3); close; figure(3); plot(Mass_flow,Pressure_ratio) hold on plot(Surge_Mass_flow,Surge_Press_ratio) [c,h] = contour(Mass_flow,Pressure_ratio,100*Efficiency,[40 50 60 64 68 70 72
74 76 78 78.7]); clabel(c,h) grid on xlabel('Mass Flow') ylabel('Pressure Ratio')

36
THIS PAGE INTENTIONALLY LEFT BLANK

37
APPENDIX D. PROCEDURE FOR SMOOTHC DATA INPUT AND EXPORTATION INTO GASTURB
1. Manual Input:
a. Select menu option File
b. Select New
c. Select Measured Data
d. Enter a map title and indicate which sort of data you have (Map type:
Compressor, Efficiency: isentropic, The data are: non-revitalized)
e. Type the measured values in the corresponding column and mark the
surge point by clicking in the second column under Surge.
f. Repeat step e. for all speed lines. A minimum of three are required to
plot the data.
g. Graphically check the data by clicking on the Plot Data button on the
right side of the window.
h. Save file as .MEA (measured data) and as .SMO (smooth data).
2. Smoothing and defining Beta lines:
a. Select menu option File
b. Select Read
c. Select Measured and Smooth Data
d. A prompt will appear that all data will be erased. Select Yes to
continue.
e. Select Define beta line grid from the picture toolbar.
f. Close the beta line picture once it is defined.

38
3. Exporting into GasTurb:
a. From the picture toolbar select Output tables. This looks like a sheet
of paper with a red arrow pointing towards the right.
a. From the toolbar in the Output Performance screen select Scale.
b. Choose Manually Scale and enter whatever scaling values you wish.
b. Select File
c. Select Save as GasTurb Map
d. Name your compressor map to be accessed in GasTurb under Special
Maps when doing an off-design calculation.
For further instruction reference the SmoothC8 manual included with the program.

39
APPENDIX E. OUTPUT DATA IN GASTURB USING COMPRESSOR MAP MODEL
A. OUTPUT FOR 100% DESIGN SPEED

40
B. OUTPUT FOR 90% DESIGN SPEED

41
C. OUTPUT FOR 80% DESIGN SPEED

42
THIS PAGE INTENTIONALLY LEFT BLANK

43
APPENDIX F. STANDARD OPERATING PROCEDURES FOR ALIGNMENT AND OPERATION OF THE GAS TURBINE AND
DYNAMOMETER TEST SYSTEM
Note: Changes from Standard Operating Procedures [Ref. 2] are:
OIL SYSTEM VERIFICATION: No longer turn on the lubrication oil cooling fan (no longer part of facility)
MASTER LIGHTOFF PROCEDURE (MLOP)
SYSTEM VERIFICATION ALIGNMENT PROCEDURES AND OPERATING PROCEDURES
PROCEDURE
PLACING THE GAS TURBINE TEST CELL INTO OPERATION
1. Conduct visual inspection of gas turbine test cell and verify the following:
a. Ensure all drip pans, piping trenches, and the deck are free of oil, fuel,
or any flammable liquids. b. Ensure all flammable liquids are stored properly in the flammable
liquids locker. c. Ensure all small parts, equipment, tools, or objects, which may become
airborne debris, are properly stored. d. Verify that the gas turbine cell and work area fire extinguishers are fully
charged. e. Inspect all piping runs and accessories for loose connections, damage,
or leaks. f. Ensure all valve handwheels are installed and valve labels are in place. g. Inspect the air intake louvers for blockage. h. Check the engine battery voltage. Place the batteries on charge if
voltage is below 22 VOLTS. i. Check fuel level in fuel oil storage tank. Ensure enough fuel is present
to support gas turbine operations.

44
j. Verify that the water storage tank is full.
2. If the gas turbine test cell and the diesel test cell have been idle for more than 30 days, the water system and fuel system must be recirculated prior to placing the systems into operation. Proceed to the fuel oil service recirculation procedure (FOSRP) and the cooling water system recirculation procedure (CWSRP).
3. If the ambient air temperature is less than 50°F, the fuel system must be
recirculated in order to ensure no paraffin separation is present. Proceed to the fuel oil service recirculation procedure (FOSRP).
4. Ensure the cooling water system filter is clean and free of excessive particulate.
WATER SYSTEM ALIGNMENT
1. Ensure the following valves are in the fully open position:
a. Water storage tank suction valve CW-1
b. Water supply pump suction valve CW-2GT
c. Water supply pump discharge valve CW-4GT
d. Dynamometer sump tank supply valve CW-6GT
e. Return pump discharge valve CW-9GT
f. Heat exchanger inlet valve CW-10
g. Heat exchanger discharge valve CW-12
2. Ensure the following valves are in the full closed position:
a. Diesel supply pump suction valve CW-2D
b. Gas turbine to diesel cross connect valve CW-5
c. Dynamometer bypass valve CW-7GT
d. Diesel return pump discharge valve CW-9D
e. Heat exchanger bypass valve CW-11
f. Dynamometer boost valve CW-12GT
3. Place the local heat exchanger breaker [ ] in the AUTO position.
4. Place the local cooling water supply pump breaker [ ] in the AUTO position.
5. Place the local cooling water return pump breaker [ ] in the AUTO position.

45
FUEL OIL SYSTEM ALIGNMENT
1. Ensure the following valves are in the fully open position:
a. Fuel oil supply pump suction valve FOS-2GT
b. Fuel oil supply pump discharge valve FOS-5GT
c. Fuel oil supply cell isolation valve FOS-6GT
d. Fuel oil return valve FOS-12GT
2. Place the local fuel supply pump breaker [ ] in the AUTO position.
3. Ensure the following valves are in the fully closed position:
a. Diesel fuel oil supply pump suction valve FOS-2D
b. Fuel oil supply cross-connect valve FOS-3
c. Fuel oil recirculation valve FOS-9GT
d. Diesel fuel oil return valve FOS-10D
4. Ensure the dynamometer to engine fuel quick disconnect is properly connected.
AIR SYSTEM ALIGNMENT
1. Place the remote LOUVER switch to the OPEN position.
2. Ensure air flow turbine meters are connected to the dynamometer instrumentation rack.
3. Remove exhaust covers from gas turbine exhaust stacks.
OIL SYSTEM VERIFICATION
WARNING: Synthetic lube oil mil-l-23699 can cause dermatitis or paralysis. If lube oil contacts skin, immediately flush with water. If clothing becomes saturated remove promptly.
1. Verify the lubrication oil level in the oil storage tank is above the fill mark (6
gallon level). 2. Ensure the oil pressure sensing line is connected to the dynamometer
instrumentation rack connection. 3. Ensure the oil supply and discharge lines are properly connected to the
accessories gearbox. 4. Ensure the shaft is free to turn by rotating manually.

46
ENGINE CHECKS AND ADJUSTMENTS 1. Check gas generator (N1) fuel control lever travel from the control console
throttle knob. Ensure full travel from 0 - 90° settings. For full travel lever must contact lever stop. Also ensure that the 0° position actuates the spring fuel cut-off on the governor actuator.
2. Verify the power turbine governor (N2) is lockwired in the MAX position. 3. Ensure all protective covers and plugs are removed from all vents and drains. 4. Ensure the battery charger is disconnected from the storage batteries. 5. Ensure the voltage regulator circuit breaker switch is in the ON position. 6. Obtain the latest barometric reading. 7. Verify the DYNO PRIME switch and FUEL PUMP switch located on the control
console are in the OFF position. 8. Place the LOAD CONTROL switch to the servo position. 9. Ensure the LOAD CONTROL knob is set to 600.
CAUTION: The LOAD CONTROL knob reads one order of magnitude less than ordered speed. Increasing LOAD CONTROL dial indicator above 630 may results in a power turbine overspeed and engine failure.
10. Verify the LOAD CONTROLLING RPM switch is in the LOAD
CONTROLLING RPM position. This switch is located inside the control console.
11. Place the THROTTLE CONTROL switch in the MANUAL position. 12. Ensure the THROTTLE CONTROL knob is in the fully closed position. 13. Press the POWER ON push-button to energize the dyno control console. 14. Set the shaft OVERSPEED at 6,300 RPM. 15. Set the TORQUE/POWER display knob to the LOW scale. 16. Set the SPEED display knob to the LOW speed scale. 17. Adjust the UPPER TEST SPEED knob to 6,250 RPM.

47
18. Either set the fuel specific gravity knob to the proper setting or input the fuel
specific gravity into the SF-901 computer monitoring system in accordance with factory technical manuals.
19. Set the FUEL mode knob to the A configuration. 20. Set the AIR-FUEL meter knob in the AIR/2 configuration. 21. Set the FLOWMETER knob to the 9” position. 22. Set the DISPLAY knob to the TORQUE position. 23. Set the control console switch to the TENTHS scale. 24. Adjust the TORQUE ADJUST knob to zero. 25. Set the DISPLAY knob to the EXHAUST position. 26. Set the water vapor pressure knob to the correct setting. 27. Turn the shutter motor switch [ ] to the OPEN position. Ensure that the intake
shutters move to the open position. 28. Ensure both test cell entrance doors are closed and latched.

48
ENGINE STARTING PROCEDURE 1. Depress the remote COOLING WATER SUPPLY PUMP start push-button [ ];
verify the MOTOR RUN light illuminates. 2. Depress the remote COOLING WATER RETURN PUMP start push-button [ ];
verify the MOTOR RUN light illuminates. 3. Adjust CW-9GT to ensure CW return pump does not become air bound. 4. Depress the remote FUEL OIL PUMP start push-button [ ]; verify the MOTOR
RUN light illuminates. 5. Depress the remote HEAT EXCHANGER start push-button [ ]; verify the
MOTOR RUN light illuminates. 6. Turn the DYNO PRIME switch to the ON position.
WARNING: The DYNO PRIME switch must be on for at least 10 seconds prior to engaging starter to ensure the dynamometer has sufficient priming water.
7. Turn the FUEL PUMP switch to the ON position. 8. Verify both engine test cell doors are closed completely.
9. Depress and hold the STARTER push-button. 10. Verify positive lubrication oil pressure on lube oil pressure gage. 11. Monitor all consol warning lights. 12. Advance the gas generator throttle lever (N1) to the 30° (idle position – 6.4V)
after N1 speed passes 8,000 RPM (16%). 13. Verify an increase in power turbine speed (N2) by the time N1 speed reaches
20,000 RPM (40%). 14. Monitor turbine outlet temperature. Ensure that TOT does not exceed 1,380 °F
for more than ten seconds or 1,700 °F for more than one second. 15. Ensure gas generator speed reaches a steady state idle speed of approximately
31,000 RPM +/- 1,000 RPM (60%). 16. Release the STARTER push-button when N1 is at 31,000 RPM +/- 1,000 RPM.

49
17. Adjust the servo control LOAD CONTROL knob and manual THROTTLE CONTROL knob as required for engine testing.
WARNING: Abort start by returning the gas generator THROTTLE CONTROL knob to
the 0° position and secure the dynamometer fuel pump if any of the following abnormal conditions occur during system start up: 1. Time from STARTER push-button depressed to idle speed exceeds one
minute. 2. No engine oil pressure is indicated on the control console. 3. Engine oil pressure does not start to increase before N1 speed reaches
10,000 RPM (20%). 4. No indication of power turbine speed N2 before gas generator speed N1
reaches 20,000 RPM (40%). 5. Turbine outlet temperature exceeds 1,380 °F for more than 10 seconds or
1,700 °F for more than one second. 6. A WATER SUPPLY warning light illuminates which indicates a supply
water pressure of less than 15 PSIG is available to the power absorber. 7. A DYNO PRIME warning light illuminates indicating the power absorber
must be reprimed. 8. A FUEL PRESSURE warning light illuminates indicating less than 4
PSIG fuel pressure. 9. The OIL PRESSURE warning light illuminates after N1 speed reaches
10,000 RPM (20%). 10. An unusual sound of vibration occurs. 11. A fuel or lubrication oil leak is observed.

50
FUEL OIL SYSTEM RECIRCULATION PROCEDURE (FOSRP)
PROCEDURE SYSTEM ALIGNMENT FOR RECIRCULATION 1. Conduct visual inspection of gas turbine test cell and verify the following:
a. Ensure all drip pans, piping trenches, and decks are free of oil, fuel, or any flammable liquids.
b. Ensure all flammable liquids are stored properly in the flammable
liquids locker. c. Verify that the gas turbine test cell and work area fire extinguishers are
fully charged. d. Inspect all piping runs and accessories for loose connections, damage or
leaks. e. Ensure all valve handwheels are installed and valve labels are in place. f. Check fuel level in fuel oil storage tank. Ensure enough fuel is present
to support gas turbine operations. g. Ensure the intake shutters are closed. h. Ensure that the battery charger is disconnected.
2. Ensure the following valves are in the fully open position:
a. Fuel oil supply pump suction valve FOS-2GT b. Fuel oil supply pump discharge valve FOS-5GT c. Fuel oil supply isolation valve FOS-6GT d. Fuel oil recirculation valve FOS-9GT e. Fuel oil return valve FOS-12GT
3. Ensure the fuel oil service flow regulator is adjusted between 6-10 PSIG.

51
4. Ensure the following valves are in the fully closed position: a. Diesel fuel oil supply pump suction valve FOS-2D b. Fuel oil supply cross-connect valve FOS-3 c. Diesel fuel oil return valve FOS-10D 5. Place the local fuel oil supply pump breaker [ ] in the AUTO position. 6. Turn the remote fuel oil pump breaker [ ] to the ON position. 7. Monitor system for possible leaks.
NOTE: The system will recirculate and filter at a rate of 60 gallons per hour. The total storage tank capacity is 500 gallons.

52
COOLING WATER SYSTEM RECIRCULATION PROCECURE (CWSRP)
PROCEDURE
SYSTEM ALIGNMENT FOR RECIRCULATION
1. Conduct visual inspection of gas turbine test cell and verify the following: a. Inspect all piping runs and accessories for loose connections, damage, or leaks. b. Ensure all valve hand wheels are installed and valve labels are in place. c. Verify that the water storage tank is full. d. Ensure the cooling water system filter is clean and free of excessive particulate. 2. Ensure the following valves are in the fully open position: a. Water storage tank suction valve CW-1 b. Water supply pump suction valve CW-2GT c. Water supply pump discharge valve CW-4GT d. Dynamometer bypass valve CW-7GT e. Heat exchanger bypass valve CW-11 f. Dynamometer boost valve CW-12GT 3. Ensure the following valves are in the fully closed position: a. Diesel supply pump suction valve CW-2D b. Gas turbine to diesel cross connect valve CW-5 c. Dynamometer sump tank supply valve CW-6GT d. Diesel return pump discharge valve CW-9D e. Return pump discharge valve CW-9GT f. Heat exchanger inlet valve CW-10 g. Heat exchanger discharge valve CW-12

53
4. Place the local cooling water supply pump breaker [ ] in the AUTO position. 5. Monitor system and check for leaks.
NOTE: The water will recirculate at 50 gallons per minute. A full tank will recirculate once every 20 minutes. It is recommended that the system be placed into recirculation mode for a minimum of 40 minutes if the system has been idle more than 30 days.

54
MASTER NORMAL SHUTDOWN PROCEDURE (MNSP)
PROCEDURE NORMAL ENGINE AND DYNAMOMETER SHUTDOWN PROCEDURES 1. Return the gas generator control lever (N1) to the IDLE position 30,000-32,000
RPM (60%). 2. Adjust the manual LOAD CONTROL knob to read 8 volts on the
TEMPERATURE VOLT meter scale. 3. Allow the engine to run at idle for two minutes to facilitate a sufficient engine
cool down. 4. Return the gas generator throttle control to the 0° (cut-off) position. 5. Turn the dynamometer FUEL PUMP OFF and monitor for decrease in N1 speed
and turbine outlet temperature (TOT).
NOTE: If N1 speed fails to decrease, secure remote fuel oil pump breaker [ ] and monitor N1 speed. If TOT temperature does NOT decrease and N1 speed does not decrease, a post shutdown fire exists. Depress STARTER push-button and motor engine for two minutes.
6. Turn the remote fuel oil supply pump breaker [ ] to the OFF position. 7. Turn the remote cooling water supply pump breaker [ ] to the OFF position. 8. Turn the remote cooling water return pump breaker [ ] to the OFF position. 9. Turn the remote heat exchanger breaker [ ] to the OFF position. 10. Return all local power panel breakers to the OFF position. 11. Depress the POWER ON push-button to de-energize the dynamometer control
console.

55
12. Close the following valves: a. Fuel oil supply suction valve FOS-2GT b. Fuel oil supply pump discharge valve FOS-5GT c. Fuel oil return valve FOS-12GT d. Water storage tank suction valve CW-1 e. Water supply pump suction valve CW-2GT f. Return pump discharge valve CW-9GT 13. Ensure all protective covers and plugs are repositioned on all vents and drains. 14. Turn the remote shutter motor breaker [ ] to the CLOSE position. Ensure that the
intake shutters move to the closed position. 15. Turn off the installed cell cooling fans from the wall mounted thermostat when
the cell is sufficiently ventilated.

56
EMERGENCY SHUTDOWN PROCEDURE (ESP)
IMMEDIATE AND CONTROLLING ACTIONS FOR EMERGENCY
SHUTDOWN OF THE GAS TURBINE TEST CELL
NOTE: Emergency shutdown of the T63-A-700 gas turbine engine and dynamometer is directed for any one or combinations of the following casualties:
a. A WATER SUPPLY warning light illuminates which indicates a supply water
pressure of less than 15 PSIG is available to the power absorber. b. A DYNO PRIME warning light illuminates indicating that the power absorber
has lost prime. c. A FUEL PRESSURE warning light illuminates indicating that there is less than
4 PSIG fuel pressure. d. A fuel oil leak occurs. e. A WATER TEMP. warning light illuminates indicating a power absorber
cooling water discharge temperature of over 210 °F. A normal shutdown should be initiated IAW EOP MNSP if a cooling water discharge of 160 °F or above is observed.
f. An oil pressure of less than 60 PSIG is observed. An automatic shutdown
should occur if an oil pressure less than 50 PSIG occurs. g. An oil leak occurs. h. An unusual metallic of vibration sound occurs. i. The overspeed warning light is illuminated. j. A fire of any type of severity is observed. k. A gas generator overspeed of 53,164 RPM (104%) is observed. l. A power turbine overspeed of 36,400 RPM (104%) is observed. m. A compressor stall is observed. n. Erratic control console readings occur. o. Uncontrolled dyno load fluctuations occur.

57
p. A turbine outlet temperature (TOT) of 1,380 °F for more than 10 seconds occurs.
q. A TOT of 1,700 °F occurs. r. An oil temperature of 225 °F of above is observed. PROCEDURE 1. Turn the dynamometer FUEL PUMP OFF and return the gas generator throttle
control to the 0° (cut-off) position. Monitor for a decrease in N1 speed and TOT temperature.
NOTE: If N1 speed fails to decrease, secure remote fuel oil pump breaker [ ] and monitor N1 speed. If TOT temperature does NOT decrease and N1 speed does decrease, a post shutdown fire exists. Depress STARTER push-button and motor engine for two minutes.
2. After N1 speed reaches 0 RPM (0%) proceed with normal shutdown IAW SOP MNSP.
NOTE: In the event of a fire, call the fire department at extension 2333. Attempt to put out fire with CO2 extinguisher only after calling fire department.
3. Troubleshoot and investigate malfunction prior to attempting a restart of the engine.

58
THIS PAGE INTENTIONALLY LEFT BLANK

59
LIST OF REFERENCES
1. Allison Gas Turbines, Model C-18 Installation Design Manual, 1976.
2. Hass, David W., The Instrumentation Design and Control of a T63-A-700 Gas Turbine Engine, M.S.M.E. Thesis, Naval Postgraduate School, June 1996.
3. Thomson, William T., Theory of Vibration with Applications, p. 273, Prentice Hall, 1972.
4. Point of Contact Bret Williamson, Superflow, [email protected], PH: (719) 471-1746, June 2005.
5. Point of Contact Dave Sayre, Rolls Royce Corporation, P.O. Box 420, Indianapolis, IN, 46206, [email protected], June 2005.
6. Kurzke, Ing J., SmoothC8 Manual, 2001.
7. Kurzke, Ing J., GasTurb9 User’s Manual, 2001.

60
THIS PAGE INTENTIONALLY LEFT BLANK

61
INITIAL DISTRIBUTION LIST
1. Defense Technical Information Center Ft. Belvoir, Virginia
2. Dudley Knox Library Naval Postgraduate School Monterey, California
3. Department Chairman, Code ME/Hy Department of Mechanical Engineering Naval Postgraduate School Monterey, CA
4. Professor Knox T. Millsaps, Jr, Code ME/Mi
Department of Mechanical Engineering Naval Postgraduate School Monterey, CA
5. Curricular Officer, Code 570
Department of Mechanical Engineering Monterey, CA
6. Professor Garth V. Hobson, Code ME/Hg Department of Mechanical Engineering Naval Postgraduate School Monterey, CA
7. ENS Kristin Garrott
Severna Park, MD