Embed Size (px)
Citation preview
BM UMa: a middle shallow contact binary at
pre-transition stage of evolution from W-type to
A-type
T. Sarotsakulchai1, B. Soonthornthum1, S. Poshyachinda1, C. Buisset1, T.
Lepine2,3, A. Prasit1
1National Astronomical Research Institute of Thailand, Donkaew, Maerim, Chiangmai 50180,
Thailand
2Univ-Lyon, Laboratoire Hubert Curien, UMR CNRS 5516, 18 rue Benoıt Lauras, 42000
Saint-Etienne, France
3Institut d’Optique Graduate School, 18 rue Benoıt Lauras, 42000 Saint-Etienne, France
∗E-mail: [email protected]
Received 〈reception date〉; Accepted 〈acception date〉
Abstract
In this study, all unpublished time series photometric data of BM UMa (q ∼ 2.0, P = 0.2712 d)
from available archives were re-investigated together with new data taken from the TNT-
2.4m of the Thai National Observatory (TNO). Based on period analysis, there is a short-
term variation superimposed on the long-term period decrease. The trend of period change
can be fitted with a downward parabolic curve indicating a period decrease at a rate of
dP/dt = −3.36(±0.02) × 10−8 d yr−1. This long-term period decrease can be explained by
mass transfer from the more massive component (M2 ∼ 0.79M) to the less massive one
(M1 ∼ 0.39M), combination with AML. For photometric study, we found that the binary con-
sists of K0 V stars and at the middle shallow contact phase with evolution of fill-out factor from
8.8 % (in 2007) to 23.2 % (in 2020). Those results suggest that the binary is at pre-transition
stage of evolution from W-type to A-type, agreeing to the results of statistical study of W-type
contact binaries. The mass of M2 will be decreased close to or below M1 and the mass ratio
will be decreased (q < 1.0). By this way, the binary will evolve into A-type as a deeper normal
1
arX
iv:2
108.
1361
5v1
[as
tro-
ph.S
R]
31
Aug
202
1
over-contact system with period increase. Finally the binary will end as a merger or a rapid-
rotating single star when the mass ratio meet the critical value (q < 0.094), as well as produce
a red nova.
Key words: binaries: close — binaries: eclipsing — stars: evolution — stars: individual (BM UMa)
1 Introduction
EW-type Eclipsing binaries are commonly composed of main-sequence F, G and K-type stars
(Rucinski 2007; Qian et al. 2017). Most of them are solar-type dwarfs with strong stellar
activities which can be seen from their light-curve asymmetries and spectral line profile (chro-
mospheric activity e.g., strong Ca II H and K emission). Contact binaries with K-type dwarfs
are known for decades (see Bradstreet 1985) and to date, there are many contact binaries with
K-type stars that were studied (e.g., Yang et al. 2008, 2009a, 2011; Liao et al 2012; Zhu et al.
2014; Liu et al. 2014a, 2014b, 2015, 2020; Martignoni et al. 2016; Xia et al. 2018; Zhou &
Soonthornthum 2019a, 2020). Most of them are shallow W-subtype contact binaries with light
curve asymmetries. Recent study by Qian et al. (2017), pointed out that the period distribution
of EW-type binaries which observed by the Large Sky Area Multi-Object Fiber Spectroscopic
Telescope (LAMOST; Cui et al. 2012) shows a peak close to 0.29 d. Similar study by Rucinski
(2007), reported the period study from the All-Sky Automated Survey (ASAS; Pojmanski 1997)
at a peak about 0.27 d, while Jiang et al. (2014) reported a shorter period at a peak of 0.25 d
from the study of Kepler data archive. In addition, the study by Qian et al. (2017) also sug-
gested that the peak of temperature distribution is about 5700 K which corresponds to the
temperature of a G3-type or solar-type star and the peak of distribution of gravitational accel-
eration log (g) is close to 4.16. They noted that those results are in agreement with the idea
that contact binaries are formed from detached binaries via the Case A mass transfer or/and
shrinking orbits via angular momentum loss (AML) due to magnetic braking (Bradstreet &
Guinan 1994).
BM UMa is a W-subtype of contact binary with a period of about 0.2712 d and magnitude
about 14 in V-band. It was firstly discovered by Hoffmeister (1963) and correctly identified as
an eclipsing W UMa type binary by Shugarov (1975). The recent study by Samec et al. (1992;
1995), who published its first CCD observations, new period analysis and ephemeris, indicated
that its light curve asymmetries would be migration by a hot spot in the neck of the secondary
2

component where both components were classified as early K-type stars. They noted that this
may be attributed to fluid dynamics of mass in transit rather than to magnetic activity. Their
period study showed that the period of the binary are decreasing, which is in agreement with
the analysis results from Yang et al. (2009), who found a cyclic oscillation superimposed on a
secular period decrease in the time interval over 77 years. Yang et al. (2009) also suggested that
the long-term period decrease may be due to mass transfer between the component and/or mass
and angular-momentum loss (AML) from the system, while the cyclic change may be due to a
light travel-time effect (LTTE) from an unseen third body with period of 30.8 yrs. However, no
asymmetry in the light curves or the O’Connell effect was reported from Yang et al. (2009), just
only a large scatter or mean errors due to faint star observations (e.g., 0.065 mag for V-band
and 0.077 mag for R-band) was noted in the paper. Later, Virnina et al. (2010) published the
new results of V-band CCD observations and obtained full light-curves for BM UMa. They
showed that the light curves were symmetric without the O’Connell effect and they also did not
confirm the presence of spots on the components. As their light curve investigation indicated
that the mass ratio of the system was 0.54 where degree of contact about 10.7, with temperature
of 4700 K and 4510 K for the primary and the secondary component, respectively.
In this paper, we will re-investigate the binary system BM UMa with new photometric
light curves in VRI bands from our observations via the 2 meter class telescope together with
an analysis of long-term photometric time series from available surveys which are unpublished
before. The new results from period study are also presented together with new aspect from
long-term photometric time series. The magnetic activities and the short-term period change
are also investigated and compared to the other K-type contact binaries.
2 New photometric observations and light curves
In April 2, 2020, we performed the observations of BM UMa (α2000 = 11h11m20s.5 and δ2000
= +4625′47′′.3) by using the 2.4-m Thai National Telescope (TNT) at the Thai National
Observatory (TNO), Chiangmai, Thailand. For data acquisitions, the instrument system e.g.,
the TNT focal reducer and the ARC 4k camera were used. For more information about the
telescope and the instrument system, see Prasit et al. (2019). During the observations, VRI
filters were employed. All images from the observations were processed by using a standard
procedure in IRAF1. The comparison (α2000 = 11h11m22s.4 and δ2000 = +4621′51′′.7) and the
check stars (α2000 = 11h11m47s.5 and δ2000 = +4624′21′′.5) are used for differential photometry.
1 The Image Reduction and Analysis Facility (IRAF), http://iraf.noao.edu.
3

gg
Fig. 1. The multi-color CCD light curves of BM UMa in V, R and I bands were obtained with the TNT-2.4m in April 2020. The differential magnitude between
the comparison and the check stars (C-Ch) in VRI bands are also displayed in the figure without the significant variation except in the early night with bad
seeing.
The full light curves of BM UMa in VRI bands are plotted together and compared to the check
star as displayed in Fig 1. The figure shows that all bands of light curves are symmetric without
the O’Connell effect, where the light curves (VRI) of the check star are mostly stable except
the observations in the early night with bad seeing affecting on the data and showing small
scatters.
3 Orbital period study
The period changes of BM UMa were studied by many authors e.g., Samec & Kreidl (1992);
Samec et al. (1995); Yang et al. (2009) and Virnina et al. (2010), but it has been neglected
for years since 2010. To re-investigate the period variation, we collected all available observed
eclipse times (times of minimum light: ToM) including data from photographic (pg), visual
(vis), photoelectric (pe) and ccd methods which reported in the literature as references shown
in the last column of Table 2. The orbital period variation of BM UMa can be analyzed from
eclipse timing differences by plotting the O−C diagram, where O refers to the observed eclipse
times and C refers to the computed ones which predicted by the reference epoch (Kreiner
2004). All O−C values were determined by using the linear ephemeris in Eq. (1), where the
corresponding values are listed in Table 1 and the result is plotted in Fig. 2.
4
O -
C
-0.08
-0.06
-0.04
-0.02
0
0.02
0.04
Epoch-40,000 -20,000 0 20,000 40,000 60,000
pgvispeccd
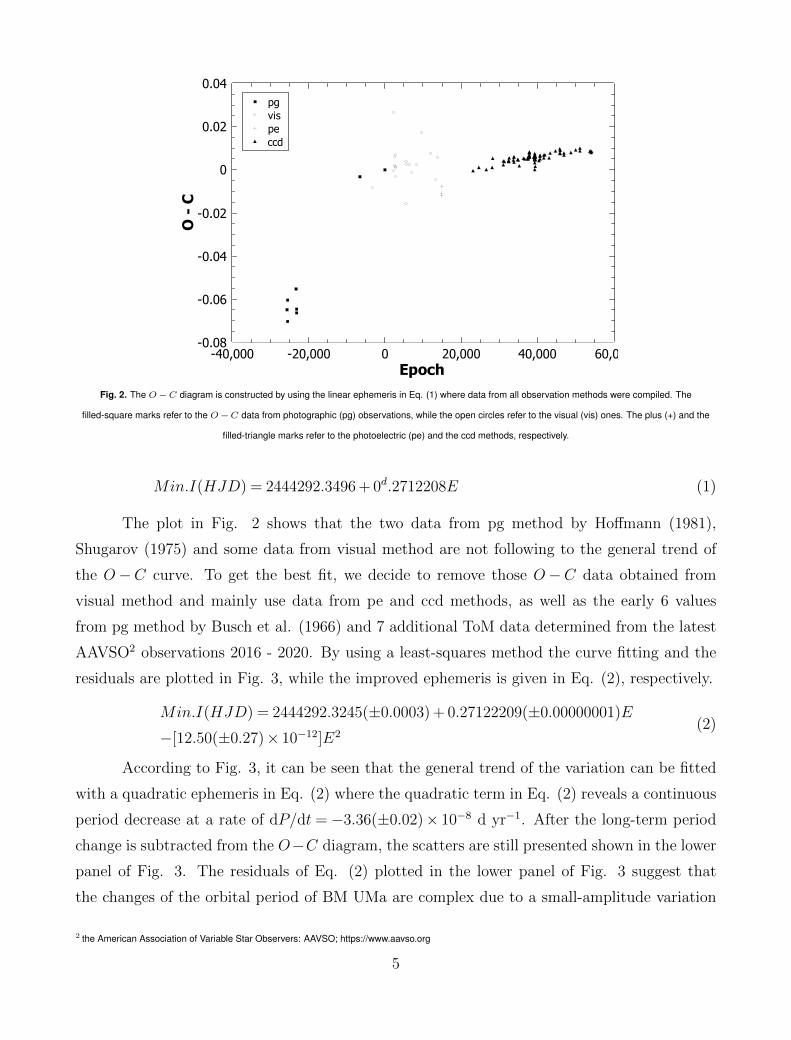
Fig. 2. The O−C diagram is constructed by using the linear ephemeris in Eq. (1) where data from all observation methods were compiled. The
filled-square marks refer to the O−C data from photographic (pg) observations, while the open circles refer to the visual (vis) ones. The plus (+) and the
filled-triangle marks refer to the photoelectric (pe) and the ccd methods, respectively.
Min.I(HJD) = 2444292.3496 + 0d.2712208E (1)
The plot in Fig. 2 shows that the two data from pg method by Hoffmann (1981),
Shugarov (1975) and some data from visual method are not following to the general trend of
the O−C curve. To get the best fit, we decide to remove those O−C data obtained from
visual method and mainly use data from pe and ccd methods, as well as the early 6 values
from pg method by Busch et al. (1966) and 7 additional ToM data determined from the latest
AAVSO2 observations 2016 - 2020. By using a least-squares method the curve fitting and the
residuals are plotted in Fig. 3, while the improved ephemeris is given in Eq. (2), respectively.
Min.I(HJD) = 2444292.3245(±0.0003) + 0.27122209(±0.00000001)E
−[12.50(±0.27)× 10−12]E2(2)
According to Fig. 3, it can be seen that the general trend of the variation can be fitted
with a quadratic ephemeris in Eq. (2) where the quadratic term in Eq. (2) reveals a continuous
period decrease at a rate of dP/dt = −3.36(±0.02)× 10−8 d yr−1. After the long-term period
change is subtracted from the O−C diagram, the scatters are still presented shown in the lower
panel of Fig. 3. The residuals of Eq. (2) plotted in the lower panel of Fig. 3 suggest that
the changes of the orbital period of BM UMa are complex due to a small-amplitude variation
2 the American Association of Variable Star Observers: AAVSO; https://www.aavso.org
5

and scatters. This may indicate that only an downward parabolic curve cannot fit the O−C
data very well. However, to get a better fit for the trend of the O−C data and to prove the
existence of short-term variations superimposed on the long-term period decrease in BM UMa,
long-term observations and new eclipse times are needed in the future.
4 The photometric time series and their photometric elements
To obtain the reliable parameters and examine the possible variability of BM UMa’s light curves
from our observations, we also compare them with the previous studies and other unpublished
data e.g., sky surveys and all available online archive of light curves. The long-term photometric
data are collected and plotted together as shown in Fig. 4 including data from the Northern
Sky Variability Survey (NSVS; Wozniak et al. 2004), the Super Wide Angle Search for Planets
(SuperWASP; Pollacco et al. 2006), the All Sky Automated Survey for Supernovae (ASAS-
SN; Shappee et al. 2014), the Catalina Sky Survey’s Northern (CSS; Drake et al. 2014) and
the American Association of Variable Star Observers (AAVSO). We find that its long term of
maximum brightness of light curves is mostly stable without a significant or dramatic change
except only the light curves from SuperWASP that do not follow to the general trend formed
by the other data sources. In addition, it is clear that the phased light curves of SuperWASP
data in Fig. 5 and Fig. 6 show a large scatter compared to the other sources. This may because
of the magnitude limit of the SuperWASP’s instrument which is capable for objects having V
7-11.5 mag but BM UMa is V 14 mag. Before doing the light curve analysis, the value of mass
ratio q has to be set first and the reliable value of q should be obtained from spectroscopic
observations. Unfortunately, no spectroscopic data or radial velocity (RV) curves of BM UMa
were published or reported in literature (e.g. LAMOST DR6; Cui et al. 2012). However, in
order to obtain reliable results, we have to search for the optimal value of photometric mass
ratio qph first by analyzing the completed and symmetric light curves from the CSS and the
ASAS-SN databases as well as the one from our observations with the TNT-2.4m.
For light curve modeling, we use PyWD2015 (Guzel & Ozdarcan 2020) based on the 2015
version (Wilson & Van Hamme 2014) of the Wilson & Devinney code (Wilson & Devinney
1971) to investigate those light curves. To obtain the initial values for parameters in light
curve modeling (e.g. the inclination (i) and so on), the effective temperature of star 1 (T1) is
set as 4999 K which computed by using the equation (Collier Cameron et al. 2007) from the
relation between the 2MASS J-H color index and the effective temperature for FGK dwarfs
(4000 < Teff < 7000 K). The corresponding spectral type is estimate as K0 V (Cox 2000) from
6

40000 20000 0 20000 40000 60000 80000 1000000.10
0.08
0.06
0.04
0.02
0.00
OC
(day
s)
oc dataleast-squares fit
40000 20000 0 20000 40000 60000 80000 100000Epoch
0.006
0.004
0.002
0.000
0.002
0.004
0.006
Resi
dual
s (da
ys)
Fig. 3. The curve fitting (upper panel) for the O−C data by using the quadratic ephemeris in Eq. (2) is plotted as dashed line with an downward parabolic
curve. The least-squares fit shows that the long-term period change is decreasing and the peak is close to the recent observations in 2020 at cycle E =
50,000. The lower panel shows the result after subtracting the quadratic term from the O−C data displayed as the residuals from Eq. (2). The residuals
show the variations of scatter which may indicate the existence of short-term period change which superimposed on the long-term period decrease.
7

Table 1. Times of minimum light of BM UMa
HJD(2400000+) Error(days) E (O−C)1 Method Min Ref.
37348.490 -25602.0 -0.06468 pg I Busch et al. (1966)
37374.396 -25506.5 -0.06026 pg II Busch et al. (1966)
37378.590 -25491.0 -0.07019 pg I Busch et al. (1966)
37992.649 -23227.0 -0.05508 pg I Busch et al. (1966)
38000.639 -23197.5 -0.06609 pg II Busch et al. (1966)
38001.590 -23194.0 -0.06436 pg I Busch et al. (1966)
42511.375 -6566.5 -0.00322 pg II Shugarov (1975)
43433.521 -3166.5 -0.00794 vis II http://var2.astro.cz/ocgate/
44292.3496 0.0008 0.0 0 pg I Hoffmann (1981)
44292.4853 0.5 0.00009 pg II Hoffmann (1981)
44885.645 2187.5 -0.0001 vis II http://var2.astro.cz/ocgate/
44910.624 2279.5 0.02659 vis II http://var2.astro.cz/ocgate/
44987.626 2563.5 0.00188 vis II http://var2.astro.cz/ocgate/
44994.682 2589.5 0.00614 vis II http://var2.astro.cz/ocgate/
45053.538 2806.5 0.00722 vis II http://var2.astro.cz/ocgate/
45056.380 2817.0 0.00141 vis I http://var2.astro.cz/ocgate/
45061.393 2835.5 -0.00318 vis II http://var2.astro.cz/ocgate/
45075.365 2887.0 0.00095 vis I http://var2.astro.cz/ocgate/
45790.577 5524.0 0.0037 vis I http://var2.astro.cz/ocgate/
45813.476 5608.5 -0.01546 vis II http://var2.astro.cz/ocgate/
45830.445 5671.0 0.00224 vis I http://var2.astro.cz/ocgate/
46039.692 6442.5 0.0024 vis II http://var2.astro.cz/ocgate/
46173.400 6935.5 -0.00146 vis II http://var2.astro.cz/ocgate/
46561.385 8366.0 0.00219 vis I http://var2.astro.cz/ocgate/
46907.342 9641.5 0.01706 vis II http://var2.astro.cz/ocgate/
47524.631 11917.5 0.00752 vis II http://var2.astro.cz/ocgate/
47927.382 13402.5 -0.00437 vis II http://var2.astro.cz/ocgate/
48039.406 13815.5 0.00544 vis II http://var2.astro.cz/ocgate/
48338.9529 0.0004 14920.0 -0.01104 pe I Samec & Kreidl (1992)
48339.7656 0.0004 14923.0 -0.012 pe I Samec & Kreidl (1992)
48339.9022 0.0006 14923.5 -0.01101 pe II Samec & Kreidl (1992)
48340.8547 14927.0 -0.00778 pe I Samec & Kreidl (1992)
50549.4130 23070.0 -0.00046 ccd I http://var2.astro.cz/ocgate/
50953.3980 24559.5 0.00116 ccd II http://var2.astro.cz/ocgate/
51490.8210 26541.0 0.00015 ccd I http://var2.astro.cz/ocgate/
51926.5381 28147.5 0.00103 ccd II http://var2.astro.cz/ocgate/
51967.4967 28298.5 0.00529 ccd II http://var2.astro.cz/ocgate/
52715.3850 31056.0 0.00224 ccd I http://var2.astro.cz/ocgate/
52715.5223 31056.5 0.00392 ccd II http://var2.astro.cz/ocgate/
52800.4143 0.0001 31369.5 0.00381 ccd II Kotkova & Wolf (2006)
52801.3635 0.0003 31373.0 0.00374 ccd I Kotkova & Wolf (2006)
53076.6530 0.0003 32388.0 0.00413 ccd I Dvorak (2005)
53081.3990 0.0001 32405.5 0.00377 ccd II Kotkova & Wolf (2006)
53092.3840 0.0001 32446.0 0.00432 ccd I Krajci (2005)
53122.4907 0.0005 32557.0 0.00551 ccd I Hubscher et al. (2005)
53418.7984 0.0001 33649.5 0.00449 ccd II Nelson (2006)
53451.3462 0.0001 33769.5 0.00579 ccd II Hubscher et al. (2005)
53451.4819 0.0002 33770.0 0.00588 ccd I Hubscher et al. (2005)
53451.6151 0.0007 33770.5 0.00347 ccd II Hubscher et al. (2005)
53744.9418 0.0002 34852.0 0.00488 ccd I Dvorak (2008)
53763.6557 0.0021 34921.0 0.00454 ccd I Brat et al. (2007)
53837.4249 0.0026 35193.0 0.00172 I SWASP*
54145.8066 0.0001 36330.0 0.00534 ccd I Samolyk (2016a)
54211.4417 0.0002 36572.0 0.00500 ccd I Dogru et al. (2007)
54419.0613 0.0002 37337.5 0.00508 ccd II Nelson (2008)
Notes. *We determined the times of light minima of BM UMa’s light curves from SWASP database (https://wasp.cerit-sc.cz/form, see Fig. 4)
8

Table 2. Times of minimum light of BM UMa (continued)
HJD(2400000+) Error(days) E (O−C)1 Method Min Ref.
54488.2226 0.0010 37592.5 0.00508 ccd II Yang et al. (2009)
54488.3592 0.0021 37593.0 0.00607 ccd I Yang et al. (2009)
54526.1946 0.0002 37732.5 0.00616 ccd II Yang et al. (2009)
54526.3298 0.0003 37733.0 0.00575 ccd I Yang et al. (2009)
54527.8214 0.0001 37738.5 0.00564 ccd II Nelson (2009)
54550.0626 0.0003 37820.5 0.00673 ccd II Yang et al. (2009)
54550.1982 0.0003 37821.0 0.00672 ccd I Yang et al. (2009)
54554.9440 0.0003 37838.5 0.00616 ccd II Yang et al. (2009)
54562.9449 0.0002 37868.0 0.00605 ccd I Yang et al. (2009)
54563.0802 0.0002 37868.5 0.00574 ccd II Yang et al. (2009)
54564.9807 0.0009 37875.5 0.00769 ccd II Yang et al. (2009)
54565.1169 0.0007 37876.0 0.00828 ccd I Yang et al. (2009)
54575.4231 0.0029 37914.0 0.00806 I SWASP*
54845.8280 0.0004 38911.0 0.00585 ccd I Deithelm (2009)
54887.5962 0.0001 39065.0 0.00605 ccd I Samolyk (2010)
54933.9733 0.0003 39236.0 0.00443 ccd I Virnina et al. (2010)
54934.7860 0.0002 39239.0 0.00339 ccd I Virnina et al. (2010)
54935.3325 0.0003 39241.0 0.00749 ccd I Hubscher (2011)
54935.6029 0.0019 39242.0 0.00667 ccd I Hubscher (2011)
54939.6699 0.0001 39257.0 0.00535 ccd I Virnina et al. (2010)
54941.7039 0.0002 39264.5 0.00521 ccd II Virnina et al. (2010)
54946.3095 0.0002 39281.5 0.00004 ccd II Samolyk (2010)
54955.6715 0.0002 39316.0 0.00489 ccd I Virnina et al. (2010)
54955.8070 0.0003 39316.5 0.00482 ccd II Virnina et al. (2010)
54958.7915 0.0003 39327.5 0.00586 ccd II Virnina et al. (2010)
54959.8766 0.0005 39331.5 0.0061 ccd II Virnina et al. (2010)
54960.8246 0.0006 39335.0 0.00488 ccd I Virnina et al. (2010)
54961.7754 0.0002 39338.5 0.00632 ccd II Virnina et al. (2010)
54964.3473 0.0002 39348.0 0.00166 ccd I Samolyk (2010)
55243.7073 0.0003 40378.0 0.00424 ccd I Deithelm (2010)
55311.3789 0.0022 40627.5 0.00625 ccd II Hubscher & Monninger (2011)
55311.5149 0.0017 40628.0 0.00664 ccd I Hubscher & Monninger (2011)
55329.8208 0.0004 40695.5 0.00513 ccd II Deithelm (2010)
55583.8208 0.0012 41632.0 0.00685 ccd I Deithelm (2011)
55583.9551 0.0003 41632.5 0.00554 ccd II Deithelm (2011)
55665.7296 0.0008 41934.0 0.00697 ccd I Deithelm (2011)
55963.9355 0.0007 43033.5 0.0056 ccd II Deithelm (2012)
56033.7769 0.0019 43291.0 0.00765 ccd I Deithelm (2012)
56404.6724 0.0001 44658.5 0.00875 ccd II Deithelm (2013)
56730.4095 0.0018 45859.5 0.00962 ccd II Hubscher & Lehmann (2015)
56730.5433 0.0007 45860.0 0.00781 ccd I Hubscher & Lehmann (2015)
56737.3235 0.0005 45885.0 0.00749 ccd I Hubscher & Lehmann (2015)
56737.4605 0.0024 45885.5 0.00888 ccd II Hubscher & Lehmann (2015)
56737.5947 0.0007 45886.0 0.00747 ccd I Hubscher & Lehmann (2015)
57001.2206 46858.0 0.00675 ccd I Nagai (2015)
57001.3571 46858.5 0.00764 ccd II Nagai (2015)
57505.6933 0.0001 48718.0 0.00877 ccd I Samolyk (2016b)
57512.7443 0.0005 48744.0 0.00798 V I AAVSO**
57859.7726 0.0003 50023.5 0.00928 V II AAVSO**
58159.7421 0.0003 51129.5 0.00862 V II AAVSO**
58159.8790 0.0003 51130.0 0.00994 V I AAVSO**
58880.7825 0.0002 53788.0 0.00855 V I AAVSO**
58880.9184 0.0003 53788.5 0.00881 V II AAVSO**
58942.2135 0.0001 54014.5 0.00805 ccd II present work
58975.7097 0.0003 54138.0 0.00841 V I AAVSO**
Notes. *We determined the times of light minima of BM UMa’s light curves from SWASP database (https://wasp.cerit-sc.cz/form, see Fig. 4), **the times of
minima are determined from the light curves observed by AAVSO’s member (https://www.aavso.org, see Fig. 4)
9

mag
V
15.0
14.5
14.0
13.5
HJD - 24500001,000 2,000 3,000 4,000 5,000 6,000 7,000 8,000 9,000
NSVSCSSSWASPASAS-SNAAVSOTNT-2.4m
Fig. 4. The long-term photometric time series from all available sky-surveys and archive including data from the NSVS, CSS, SWASP, ASAS-SN and
AAVSO, compared with our V-band light curve from the TNT-2.4m. The maximum brightness of light curves tends to be stable for over ten years with no any
significant change or there is a very weak magnetic cycle. It indicates that the binary system may have a very weak activity or it is inactive state for decades.
Fig. 5. The phased light curves from the long-term photometric time series as the same sources in Fig. 4. All are plotted separately in order to compare to
each other clearly. The light curves from the CSS and ASAS-SN are similar to the V-band light curve from the TNT-2.4m with no significant differences
between the maxima (light curve symmetry), while the light curve from the AAVSO (HJD 2458159.67 - 2458159.94) shows an unequal high between the
maxima where the max I is lower than the max II (light curve asymmetry), compared to the one from the TNT-2.4m (HJD 2458942.05 - 2458942.31).
10

0.2 0.0 0.2 0.4 0.6 0.8 1.0 1.2Phase
13.6
13.8
14.0
14.2
14.4
14.6
14.8
15.0
mag
V
nsvscssswaspasas-snaavsoTNT-2.4m
Fig. 6. All phased light curve from Fig 5 are put together, compared to each other and to our V-band light curve from the TNT-2.4m. It can see that all phased
light curves are symmetric and well overlapped. No significant variation is found in the phased light curves, except data from the NSVS and the SuperWASP
data which show a high scatter (also seen in Fig. 5).
SIMBAD database (J=12.929, H=12.428, K=12.309). According to the common convective
envelopes (CCE) in close binary stars, the gravity-darkening coefficient g1 = g2 = 0.32 (Lucy
1967) and the bolometric albedo A1 = A2 = 0.5 (Rucinski 1969) are adopted. The selected
light curves from Fig. 5 are performed separately for q-search as results shown in Fig. 7. The
q-search results in Fig 7 indicate that the optimal value of q is close to 2.0, thus we set q=2.0
as initial value for detailed search to obtain the best solution for each light curve. During
the optimization, the third light (l3) is also added as an adjustable parameter to check the
existence of third body. The photometric solutions for l3 are negative for all datasets, this may
suggest that the luminosity contribution of third light is very low compared to the total light
contribution from the binary system. If the presence of a third body is true, it will be a very cool
dwarf. However, the existence of third body will be discussed in details on the last section. In
addition, no unequal high between the primary maximum (Max-I) and the secondary maximum
(Max-II) or the O’Connell effect was remarkable except the one from aavso archive. The results
may suggest that it has a very weak activity and it may be inactive state for decades with no
significant spot activities. Therefore, the spotted model will not be considered for our light
curve analysis. With stable light curves and a very weak O’Connell effect, as well as a high
inclination nearly total eclipse, reliable mass ratio can be determined via the q-search method
11

0.0 0.5 1.0 1.5 2.0 2.5 3.0 3.5 4.0 4.5q
2.0
2.5
3.0
3.5
4.0
4.5
5.0
5.5
6.0
Sum
1e 8cssasas-snTNT-2.4m
Fig. 7. The photometric mass ratio qph from q-search method for the binary BM UMa. The results of q-search from css, asas-sn database and the one from
our observations from the TNT-2.4m all suggest that the optimal value of q is close to 2.0.
0.2 0.0 0.2 0.4 0.6 0.8 1.0 1.2Phase
13.6
13.8
14.0
14.2
14.4
14.6
14.8
15.0
mag
V
css datamodel
0.2 0.0 0.2 0.4 0.6 0.8 1.0 1.2Phase
13.6
13.8
14.0
14.2
14.4
14.6
14.8
15.0
asas-sn datamodel
0.2 0.0 0.2 0.4 0.6 0.8 1.0 1.2Phase
13.6
13.8
14.0
14.2
14.4
14.6
14.8
15.0
TNT-2.4m datamodel
Fig. 8. The photometric light curve modelings for BM UMa from CSS, ASAS-SN and TNT-2.4m. The synthetic light curves (solid line) fit well with the
observed light curves.
with no needed spectroscopic RV measurements to support (see Terrell & Wilson 2005; Li et
al. 2021). The final solution for each dataset with unspotted model and photometric elements
are listed in Table 3. The corresponding light curves and the geometrical structures with 3D
model at phase 0.25 are also plotted in Fig 8 and 9, respectively.
5 The study of W-type contact binaries (for 0.22 < P < 0.3 days)
According to the recent studies on orbital period distribution in EW-type binaries e.g., Rucinski
(2007); Jiang et al. (2014); Qian et al. (2017), it is noticed that the period distribution is
between 0.27 to 0.29 days and most of surface temperatures of those systems correspond to
solar type star (e.g. G to K spectral-type stars). In addition, it is found that most of short
period (P < 0.3 days) contact binaries are W-type contact systems while A-type systems are
composed of A to F spectral-type stars with longer orbital period (e.g. P > 0.3 days). On
12

1.0 0.5 0.0 0.50.8
0.6
0.4
0.2
0.0
0.2
0.4
0.6
0.8css (phase 0.25)
1.0 0.5 0.0 0.50.8
0.6
0.4
0.2
0.0
0.2
0.4
0.6
0.8asas-sn (phase 0.25)
1.0 0.5 0.0 0.50.8
0.6
0.4
0.2
0.0
0.2
0.4
0.6
0.8TNT-2.4m (phase 0.25)
Fig. 9. The 3-D model of contact binary BM UMa from photometric solutions as the same sources in Fig. 8. The contact configurations show the evolution of
degree of contact from 2007 to 2020 (left to right panel, respectively) with increasing fill-out factor and deeper contact state.
Table 3. Photometric solutions with unspotted model and no third light
Parameters CSS (2007-2012) ASAS-SN (2015-2017) V TNT-2.4m (2020) VRI TNT-2.4m (2020)
T1(K) 4999 (fixed) 4999 (fixed) 4999 (fixed) 4999 (fixed)
g1 = g2 0.32 (fixed) 0.32 (fixed) 0.32 (fixed) 0.32 (fixed)
A1 = A2 0.50 (fixed) 0.50 (fixed) 0.50 (fixed) 0.50 (fixed)
q 2.0349(±0.0403) 1.8859(±0.0686) 1.920(±0.015) 2.0693(±0.0456)
1/q 0.4914(±0.0097) 0.5303(±0.0193) 0.521(±0.004) 0.4833(±0.0106)
T2(K) 4783(±12) 4884(±19) 4792(±15) 4726(±11)
i(o) 88.100(±1.073) 87.234(±1.328) 88.200(±1.463) 89.856(±0.919)
Ωin 2.8593 2.9335 2.9157 2.8435
Ωout 2.5653 2.6188 2.6059 2.5539
Ω1 = Ω2 5.2483(±0.0558) 5.0221(±0.0926) 5.0000(±0.0201) 5.1635(±0.0099)
L1/(L1 +L2)(V) 0.4067(±0.0001) 0.3928(±0.0001) 0.4197(±0.0055) 0.4269(±0.0001)
L1/(L1 +L2)(R) 0.4121(±0.0001)
L1/(L1 +L2)(I) 0.4016(±0.0001)
r1(pole) 0.3026(±0.0017) 0.3107(±0.0028) 0.3180(±0.0016) 0.3132(±0.0009)
r1(side) 0.3165(±0.0019) 0.3254(±0.0031) 0.3346(±0.0020) 0.3295(±0.0011)
r1(back) 0.3519(±0.0022) 0.3621(±0.0036) 0.3787(±0.0035) 0.3742(±0.0019)
r2(pole) 0.4209(±0.0062) 0.4162(±0.0112) 0.4263(±0.0023) 0.4329(±0.0009)
r2(side) 0.4484(±0.0083) 0.4429(±0.0148) 0.4559(±0.0031) 0.4639(±0.0012)
r2(back) 0.4783(±0.0116) 0.4739(±0.0212) 0.4905(±0.0045) 0.4985(±0.0016)
f(%) 8.8(±4.3) 11.3(±5.6) 23.2(±3.4) 31.0(±1.7)
ΣW (O−C)2 (10−8) 2.31 3.25 3.57 4.20
13
the contrary, many studies show that there are both A-type and W-type contact binaries that
have orbital period below the period limit P < 0.22 days (Dimitrov & Kjurkchieva 2015; Jiang
et al. 2015), but their origin and evolution, as well as their connection are poorly understood
and investigated. The formation and evolution of contact systems can be divided into different
3 groups e.g., period below 0.22 days, period between 0.22 to 0.3 days and period longer than
0.3 days. Based on preliminary results, we will show that those W-type contact binaries which
have periods longer than 0.3 days show a high rate of period increase. This may suggest that its
formation and evolution may differ from other groups. For detailed and further investigation
will be reported in the next publication. For contact binaries with periods shorter than 0.22
days are commonly composed of late K to M spectral-type stars which are low luminosities and
difficult to monitor with small telescopes for both long-term and short-time with high cadence
photometries. Nowadays, many contact binaries with periods below the period limit are found
and studied but not in detailed because of some limitations (i.e., it is required to monitor their
long-term period variations and investigations of their long-term physical parameters changes
for each binary system such we investigated BM UMa). Thus, this study we will focus only on
W-type contact systems which have short periods 0.22 < P < 0.3 days.
In order to understand the origin and evolutionary path of W-type contact binaries and
to find a possible evolutionary correlation between W-type and A-type contact systems, we
compiled all physical parameters and observed period changes from well-investigated W-type
contact binaries in the literature as listed in Table 4. Based on those parameters from many
investigators, we plot the mass ratio q and 1/q against the orbital period (days) and the fill-out
factor f (%) as shown in Fig. 10. The figure shows that the period distribution is in the range
between 0.25 to 0.30 days which is in agreement to the previous results from many authors
above. According to Fig 10, it is also noticed that the most population of short period W-type
contact systems is located at mass ratio q = 2.0 (or 1/q = 0.5). It is also found that there is an
existence of maximum mass ratio q close to 10 (or 1/q close to 0.1) with high fill-out factor (f
> 40 %) and long period (P > 0.3 days), but no W-type system which has fill-out factor larger
than 65 % is found. In addition, no shallow contact binary with mass ratio q = 10 or 1/q = 0.1
or 1/q < 0.1 is found. This may imply that no W-type system can exist or keep its W-type
configuration in this evolutionary stage.
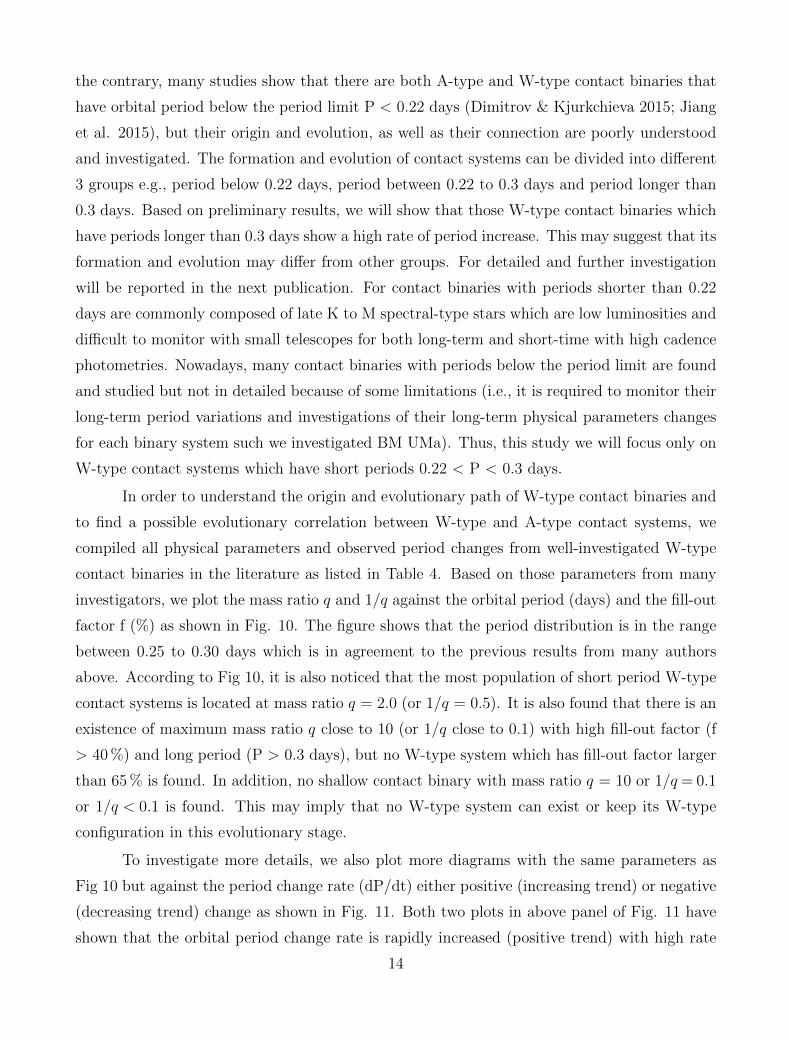
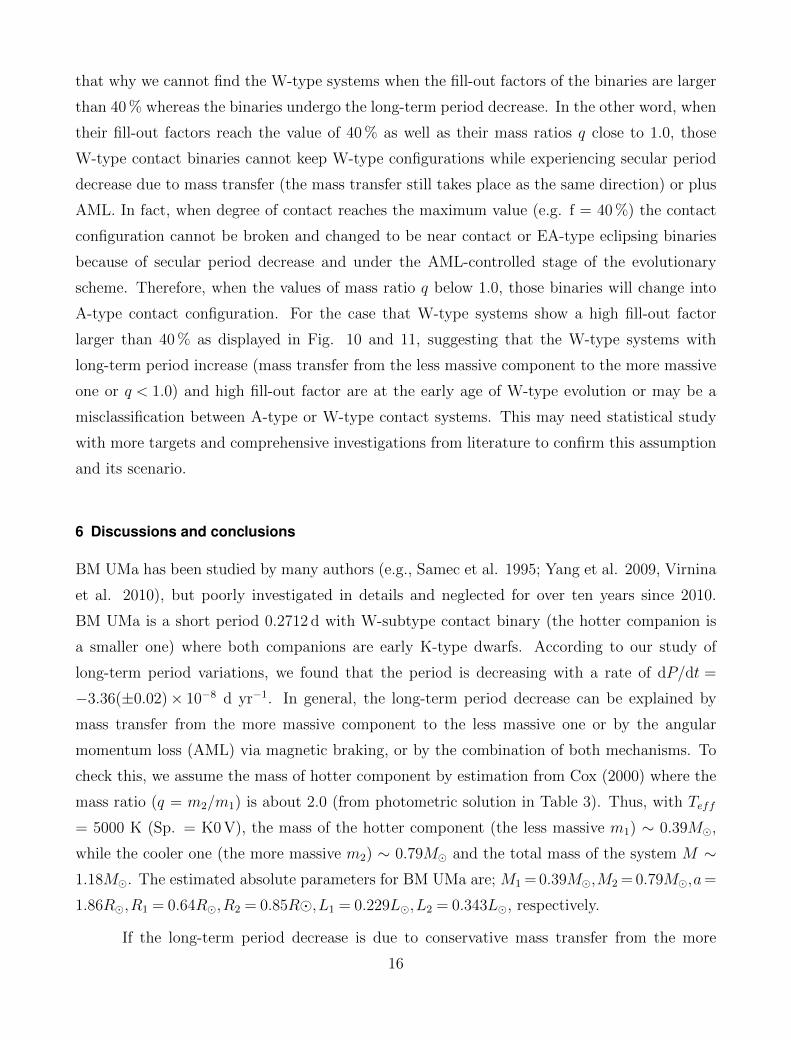
To investigate more details, we also plot more diagrams with the same parameters as
Fig 10 but against the period change rate (dP/dt) either positive (increasing trend) or negative
(decreasing trend) change as shown in Fig. 11. Both two plots in above panel of Fig. 11 have
shown that the orbital period change rate is rapidly increased (positive trend) with high rate
14
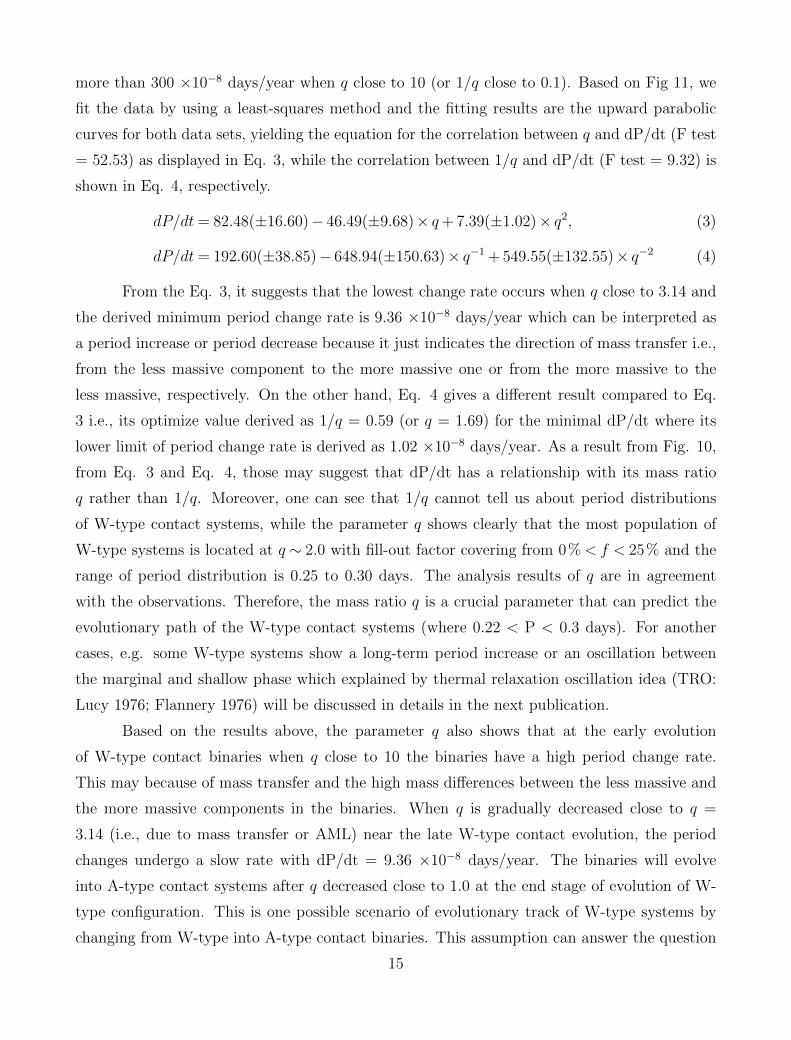
more than 300 ×10−8 days/year when q close to 10 (or 1/q close to 0.1). Based on Fig 11, we
fit the data by using a least-squares method and the fitting results are the upward parabolic
curves for both data sets, yielding the equation for the correlation between q and dP/dt (F test
= 52.53) as displayed in Eq. 3, while the correlation between 1/q and dP/dt (F test = 9.32) is
shown in Eq. 4, respectively.
dP/dt= 82.48(±16.60)− 46.49(±9.68)× q+ 7.39(±1.02)× q2, (3)
dP/dt= 192.60(±38.85)− 648.94(±150.63)× q−1 + 549.55(±132.55)× q−2 (4)
From the Eq. 3, it suggests that the lowest change rate occurs when q close to 3.14 and
the derived minimum period change rate is 9.36 ×10⁻⁸ days/year which can be interpreted as
a period increase or period decrease because it just indicates the direction of mass transfer i.e.,
from the less massive component to the more massive one or from the more massive to the
less massive, respectively. On the other hand, Eq. 4 gives a different result compared to Eq.
3 i.e., its optimize value derived as 1/q = 0.59 (or q = 1.69) for the minimal dP/dt where its
lower limit of period change rate is derived as 1.02 ×10⁻⁸ days/year. As a result from Fig. 10,
from Eq. 3 and Eq. 4, those may suggest that dP/dt has a relationship with its mass ratio
q rather than 1/q. Moreover, one can see that 1/q cannot tell us about period distributions
of W-type contact systems, while the parameter q shows clearly that the most population of
W-type systems is located at q ∼ 2.0 with fill-out factor covering from 0%< f < 25% and the
range of period distribution is 0.25 to 0.30 days. The analysis results of q are in agreement
with the observations. Therefore, the mass ratio q is a crucial parameter that can predict the
evolutionary path of the W-type contact systems (where 0.22 < P < 0.3 days). For another
cases, e.g. some W-type systems show a long-term period increase or an oscillation between
the marginal and shallow phase which explained by thermal relaxation oscillation idea (TRO:
Lucy 1976; Flannery 1976) will be discussed in details in the next publication.
Based on the results above, the parameter q also shows that at the early evolution
of W-type contact binaries when q close to 10 the binaries have a high period change rate.
This may because of mass transfer and the high mass differences between the less massive and
the more massive components in the binaries. When q is gradually decreased close to q =
3.14 (i.e., due to mass transfer or AML) near the late W-type contact evolution, the period
changes undergo a slow rate with dP/dt = 9.36 ×10⁻⁸ days/year. The binaries will evolve
into A-type contact systems after q decreased close to 1.0 at the end stage of evolution of W-
type configuration. This is one possible scenario of evolutionary track of W-type systems by
changing from W-type into A-type contact binaries. This assumption can answer the question
15
that why we cannot find the W-type systems when the fill-out factors of the binaries are larger
than 40 % whereas the binaries undergo the long-term period decrease. In the other word, when
their fill-out factors reach the value of 40 % as well as their mass ratios q close to 1.0, those
W-type contact binaries cannot keep W-type configurations while experiencing secular period
decrease due to mass transfer (the mass transfer still takes place as the same direction) or plus
AML. In fact, when degree of contact reaches the maximum value (e.g. f = 40 %) the contact
configuration cannot be broken and changed to be near contact or EA-type eclipsing binaries
because of secular period decrease and under the AML-controlled stage of the evolutionary
scheme. Therefore, when the values of mass ratio q below 1.0, those binaries will change into
A-type contact configuration. For the case that W-type systems show a high fill-out factor
larger than 40 % as displayed in Fig. 10 and 11, suggesting that the W-type systems with
long-term period increase (mass transfer from the less massive component to the more massive
one or q < 1.0) and high fill-out factor are at the early age of W-type evolution or may be a
misclassification between A-type or W-type contact systems. This may need statistical study
with more targets and comprehensive investigations from literature to confirm this assumption
and its scenario.
6 Discussions and conclusions
BM UMa has been studied by many authors (e.g., Samec et al. 1995; Yang et al. 2009, Virnina
et al. 2010), but poorly investigated in details and neglected for over ten years since 2010.
BM UMa is a short period 0.2712 d with W-subtype contact binary (the hotter companion is
a smaller one) where both companions are early K-type dwarfs. According to our study of
long-term period variations, we found that the period is decreasing with a rate of dP/dt =
−3.36(±0.02) × 10−8 d yr−1. In general, the long-term period decrease can be explained by
mass transfer from the more massive component to the less massive one or by the angular
momentum loss (AML) via magnetic braking, or by the combination of both mechanisms. To
check this, we assume the mass of hotter component by estimation from Cox (2000) where the
mass ratio (q = m2/m1) is about 2.0 (from photometric solution in Table 3). Thus, with Teff
= 5000 K (Sp. = K0 V), the mass of the hotter component (the less massive m1) ∼ 0.39M,
while the cooler one (the more massive m2) ∼ 0.79M and the total mass of the system M ∼1.18M. The estimated absolute parameters for BM UMa are; M1 = 0.39M,M2 = 0.79M,a=
1.86R,R1 = 0.64R,R2 = 0.85R,L1 = 0.229L,L2 = 0.343L, respectively.
If the long-term period decrease is due to conservative mass transfer from the more
16

Table 4. Parameters of W-type contact binaries which have orbital periods shorter than 0.3 days
Star Sp. Period q 1/q f dP/dt Cyclic l3 LTTE Ref.
(days) (%) (10−8 d/y) (%) M3(M)
KIC 9532219 G9 0.1981 1.20 0.833 - -52.7 yes 76 0.09 Lee et al. (2016)
NSVS 7179685 K8 0.2097 2.13 0.469 19.3 - - 1.2 - Dimitrov et al. (2015)
SWASPJ015100 K4 0.2145 3.13 0.319 14.6 - - no - Qian et al. (2015)
CC Com K6 0.2207 1.90 0.527 16.7 -2.0 yes no 0.07 Yang et al. (2009a)
V1104 Her K7 0.2279 1.60 0.625 15 -2.9 yes no m3+m4 Liu et al. (2015)
1SWASPJ161335 K0 0.2298 1.10 0.909 19 -42.6 yes no 0.15 Fang et al. (2019)
V523 Cas K4 0.2337 1.76 0.518 21.6 +34.4 yes no 0.60 Jeong et al. (2010), (Castelaz 2014)
YZ Phe K2 0.2347 2.63 0.379 10 -2.6 yes 2 0.13 Sarotsakulchai et al. (2019b)
RW Com K2 0.2373 2.10 0.471 6 0 yes no m3+m4 Ozavci et al. (2020)
FY Boo K3 0.2412 2.55 0.392 11 0 yes no 0.16 Samec et al. (2011)
1SWASPJ064501 K5 0.2486 2.11 0.474 15.3 - - 2 - Liu et al. (2014a)
BI Vul K3 0.2518 1.04 0.964 8.7 -9.5 yes no 0.30 Qian et al. (2013)
EI CVn K5 0.2608 2.17 0.461 21.0 -31.1 unclear no - Yang (2011)
PZ UMa G7 0.2627 5.62 0.178 38.8 - yes no 0.84 Zhou & Soonthornthum (2019a)
V1197 Her K1 0.2627 2.61 0.383 15.7 -25.8 unclear no - Zhou & Soonthornthum (2020)
EH CVn G9 0.2636 3.33 0.300 19.2 -5.2 unclear no - Xia et al. (2018)
GV Leo K2 0.2667 5.32 0.188 17.7 -49.5 unclear 2 - Kriwattanawong & Poojon (2013)
V336 TrA K1 0.2668 1.39 0.716 15.7 - - no - Kriwattanawong et al. (2018)
CSTAR 038663 K3 0.2671 1.12 0.890 10.6 - yes < 1 0.63 Qian et al. (2014)
IL Cnc K3 0.2676 1.76 0.568 8.9 -0.68 yes no 0.06 Liu et al. (2020)
DD Com G5 0.2692 3.69 0.271 8.8 +0.01 unclear no - Zhu et al. (2010)
FG Sct K4 0.2706 1.35 0.740 21.4 -6.39 unclear no - Yue et al. (2019)
BM UMa K0 0.2712 2.00 0.500 23.2 -3.36 unclear no - this study
EF CVn G5 0.2720 3.49 0.286 32.0 +45.2 yes no 0.22 Xia et al. (2018)
VW Cep K1 0.2783 3.31 0.302 -16.9 yes no m3+m4 Mitnyan et al. (2018)
V1005 Her G5 0.2789 3.29 0.303 11.2 -15.9 yes 4 0.45 Zhu et al. (2019)
BX Peg G5 0.2804 2.69 0.372 23.1 -9.84 yes no m3+m4 Lee et al. (2009)
AQ Com G8 0.2813 2.86 0.350 21.4 - yes 7-11 0.08 Liu et al. (2014c)
V357 Her K2 0.2820 3.57 0.280 11 - - no - Branicki & Pigulski (2002)
AD Cnc K0 0.2827 1.30 0.770 8.3 +49.4 yes no m3+m4 Qian et al. (2007)
GSC 2765-0348 G4 0.2835 3.19 0.313 34.0 - unclear no - Samec et al. (2012)
V524 Mon G5 0.2836 2.10 0.476 7.7 -.015 yes no 0.26 He et al. (2012)
XY Leo K2 0.2841 1.64 0.609 6.7 +2.7 yes 8 0.98 Yakut et al. (2003)
RW Dor G4 0.2854 1.59 0.630 11 -1.4 unclear no 0.09 Sarotsakulchai et al. (2019a)
ER Cep G8 0.2857 2.22 0.450 62.0 +9.7 yes no m3+m4 Liu et al. (2011)
V2790 Ori G1 0.2878 2.93 0.341 20.9 +10.3 unclear no - Kriwattanawong et al. (2019)
V842 Cep K0 0.2889 2.28 0.438 8.7 -15 unclear no - Li et al. (2021)
EP Cep K1 0.2897 6.51 0.154 10.7 -37.3 unclear no - Zhu et al. (2014)
PS Vir G2 0.2898 3.4 0.305 14.4 unclear unclear 0.3 0.12 Yuan et al. (2018)
LO Com K0 0.2864 2.48 0.404 3.2 -11.8 yes no - Zhang et al. (2016)
V1799 Ori K1 0.2903 1.33 0.749 3.5 +1.8 unclear no - Liu et al. (2014b)
GSC 03526 K2 0.2922 2.84 0.351 18.2 - yes no 0.57 Liao et al. (2012)
UW CVn G5 0.2925 4.08 0.245 20 unclear unclear no - Kopacki & Pigulski (1995)
V354 UMa G1 0.2938 3.62 0.276 10.7 unclear unclear no - Michel et al. (2019)
V873 Per K0 0.2949 2.50 0.399 18.1 -33.1 yes no 0.20 Kriwattanawong & Poojon (2015)
OU Ser F9 0.2968 5.77 0.173 30.7 - - - - Pribulla & Vanko (2002)
BN Ari K1 0.2994 2.55 0.392 6.9 -47.2 yes 0.2 0.23 Alton et al. (2018b)
IK Boo G2 0.3031 1.14 0.873 2.2 -21.7 yes - 0.21 Kriwattanawong et al. (2017)
CE Leo K0 0.3034 1.88 0.533 15.8 +16.3 yes no 0.33 Yang et al. (2013)
V2284 Cyg G7 0.3069 0.345 39.2 -29.7 yes no 0.04 Wang et al. (2017)
EQ Cep K1 0.3070 1.90 0.526 62.1 +117 unclear no - Liu et al. (2011)
V1191 Cyg 0.3134 9.36 0.107 57.9 +313 unclear no - Ostadnezhad et al. (2014)
FV CVn G6 0.3154 1.07 0.930 4.6 -113 yes 2.5 - Michel et al. (2019)
V0599 Aur G5 0.3165 1.61 0.617 4.3 -30.7 yes no 0.27 Hu et al. (2020)
TY Boo G3 0.3171 2.15 0.465 7.6 -3.6 yes no 0.52 Christopoulou et al. (2012)
17

0 2 4 6 8 10 12q
0.00
0.05
0.10
0.15
0.20
0.25
0.30
0.35
0.40
Perio
d (d
ays)
0 2 4 6 8 10 12q
0
10
20
30
40
50
60
70
80
f (%
)
0.0 0.2 0.4 0.6 0.8 1.01/q
0.00
0.05
0.10
0.15
0.20
0.25
0.30
0.35
0.40
Perio
d (d
ays)
0.0 0.2 0.4 0.6 0.8 1.01/q
0
10
20
30
40
50
60
70
80
f (%
)
Fig. 10. The plots of mass ratio q and 1/q against the orbital periods and the fill-out factors. The results show that the period distribution of W-type contact
systems is in the range between 0.25 to 0.30 days with population of mass ratios between 1 to 6. The figure also shows that the most population of short
period W-type systems is located at mass ratio q=2.0 (or 1/q=0.5) covering fill-out factor 0% < f < 25%. There is an existence of maximum mass ratio q
close to 10 (or 1/q close to 0.1) with high fill-out factor (f < 60 %) and long period (P > 0.3 days). No q = 10 or 1/q less than 0.1 is found from the present
study.
18
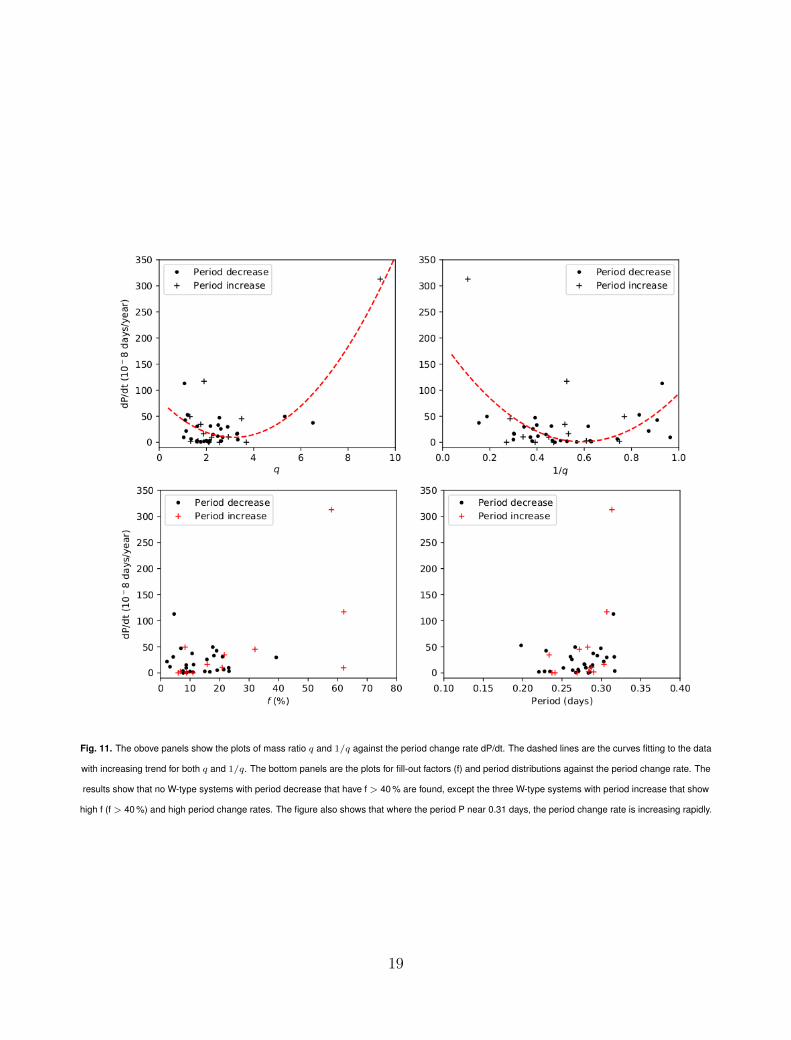
Fig. 11. The obove panels show the plots of mass ratio q and 1/q against the period change rate dP/dt. The dashed lines are the curves fitting to the data
with increasing trend for both q and 1/q. The bottom panels are the plots for fill-out factors (f) and period distributions against the period change rate. The
results show that no W-type systems with period decrease that have f > 40 % are found, except the three W-type systems with period increase that show
high f (f > 40 %) and high period change rates. The figure also shows that where the period P near 0.31 days, the period change rate is increasing rapidly.
19

massive component to the less massive one, the mass transfer rate can be determined with the
following equation (Kwee 1958),
P
P= −3M2(
1
M1
− 1
M2
) (5)
The result is dM2/dt= 3.26×10⁻⁸ Myr−1. The timescale from computed mass transfer
rate can be estimated as M2/M2 ∼ 2.42× 10⁷yrs or 24.2 Myr but the timescale from observed
period decrease is P/(dP/dt) ∼ 8.07 × 10⁶yrs or 8 Myr which is the lower limit, while the
timescale by thermodynamic processes is 67.7 Myr which is the upper limit. In addition, we
also examine the period decrease by the angular momentum loss (AML) via magnetic stellar
wind from the well-known equation given by Bradstreet & Guinan (1994).
P ≈ 1.1× 10⁻⁸q−1(1 + q)2(M1 +M2)−5/3k2× (M1R
41 +M2R
42)P
−7/3, (6)
where k2 is the gyration constant ranging from 0.07 to 0.15 for solar type stars. By adopting
a value of k2 = 0.1 (Bradstreet & Guinan 1994), the rate of period decrease due to spin-orbit
coupled AML can be derived as dP/dt = −2.75 × 10⁻⁸ d yr−1 which is close to the present
observed period change rate. However, based on long-term photometric time series it can see
that the maximum brightness is stable for decades without significant variations (e.g., flares,
outburts or magnetic cycle activities), except a very weak spot activity which had occurred in
short life (see Samec et al. 1995) and recent unpublished data from AAVSO in Fig 5. This can
be interpreted that the activity of BM UMa is quite weak but the period decrease from AML
cannot be neglected for this case. Therefore, the plausible explanation for long-term period
decrease in BM UMa is the mass transfer or the combination of the two mechanisms (mass
transfer and AML). In addition, since the short-term variation or periodic change in the O−Ccurve is not clear, as well as no detected third light, the third body will not be discussed further
details here.
According to the results of our statistical study on W-type contact binaries, it is found
that the most population of the binaries is located at q = 2.0 with period distribution 0.25 <
P < 0.3 days and fill-out factor 0 < f < 25%. In addition, it is also found that the mass ratio
q (> 1) is likely a main parameter, as well as the period change rate, to control the direction
and evolutionary stages of W-type systems. There are strong evidences to support that there
is evolutionary correlation between W-type and A-type contact systems by transforming from
late W-type systems into A-type systems when the value q decreased and close to 1.0 while the
orbital period is decreasing by mass transfer and AML. There are no W-type systems with q =
1 or q < 1, as well as the fill-out factor f > 40% to be found because they have already evolved
into A-type contact systems. For the cases that W-type systems with high q (close to 10), high
20

fill-out factor and high period change rate, they can be considered as early W-type systems
at the beginning of the evolutionary stage or they are at the transitional phase and oscillated
between marginal and shallow stage predicted by TRO theory. For the case of W-type systems
with orbital period P > 0.3 days (e.g., periods close to 0.31 days), they show a high period
change rate. This is not clear about the cause behind, this will be investigated and reported in
details for the next publication. However, these results indicate that there is a different path
of evolution among W-type and A-type, which is in agreement to many studies (e.g., Zhang et
al. 2020; Li et al. 2021).
Based on the observations and analysis results e.g., growing fill-out factor and continuing
period decrease, as well as the results of statistical study of W-type contact binaries, those may
suggest that BM UMa is at the pre-transition stage from the late W-type into A-type contact
as seen a slow rate of period change near the minimum. Both variations of fill-out factor and
period have been found in many systems e.g., CC Com (Yang et al. 2009a) and V599 Aur
(Hu et al. 2020). More examples e.g., V873 Per shows clearly about increasing fill-out factor
from 5.5 % (Samec et al. 2009) to 18.1 % (Kriwattanawong & Poojon 2015), V502 Oph e.g.,
f = 22 % (Deb & Singh 2011) to f = 35.3 % (Zhou et al. 2016). After the evolution of BM
UMa reaches the stage where mass ratio q close to 1 and goes further the point q < 1.0, the
binary will evolve into A-subtype as a deeper normal overcontact binary where the mass transfer
takes place from the less massive component (m2) to the more massive one (m1), similar to
the present evolutionary stage of V802 Aql (P = 0.2677 d; Yang et al. 2008) where its orbital
period is increasing and the fill-out factor also gradually grows (f = 35 %) at the beginning
stage of A-subtype before becoming a deep low-mass ratio overcontact system. By this way,
the evolution of BM UMa will end as a merger or rapid-rotating single star when the mass ratio
meet the critical value (q < 0.094, see Rasio 1995; Arbutina 2007; Zhu et al. 2016) and the
binary will produce a red nova similar to the case of the red outburst V1309 Sco (Tylenda et al.
2011) and the recent study of KIC 9832227 (Gazeas et al. 2021). The changing of contact type
from W-type to A-type has been found in many systems e.g., EM Psc (Yang et al. 2005; Qian
et al. 2008). The study of binary system such BM UMa will be an important observational
evidence to reveal the evolutionary correlation between W-type and A-type contact binary. The
more observations and investigations of W-type systems will be very useful to understand their
formation and evolution, as well as a proof of the assumption about the link between W-type
and A-type contact systems.
21
The authors are very grateful to the referee for very helpful comments and sugges-
tions to improve the quality of the manuscript. This work is supported by Thailand Science
Research and Innovation (TSRI): Fundamental Fund (Grant No. 88309). We would like to
thank NARIT’s Time Allocation Committee (TAC) to manage and schedule time for us to
use the TNT-2.4m for the observations. Based on observations made with the TNT focal re-
ducer and the ARC 4K camera at the Thai National Observatory (TNO) under the program
ID 1, which is operated by the National Astronomical Research Institute of Thailand (Public
Organization). Special thanks to Mr Sawang Kangkriangkrai and TNO’s staff for support dur-
ing the observing run. This research has made use of the VizieR catalog access tool, CDS,
Strasbourg, France. This work was also made use of data from the AAVSO international
database (https://www.aavso.org/). This paper also makes use of data from the DR1 of the
WASP data (Butters et al. 2010) as provided by the WASP consortium, and the computing
and storage facilities at the CERIT Scientific Cloud, reg. no. CZ.1.05/3.2.00/08.0144 which is
operated by Masaryk University, Czech Republic.
7 Data availability
The data underlying this article are available in the article and in its online supplementary
material or upon request to the corresponding author.
References
Alton, K. B. & Nelson, R. H. 2018a, MNRAS, 479, 3197
Alton, K. B., Nelson, R. H., Boyd, D. R. S., 2018b, AcA, 68, 159
Alton, K. B. & Stepien, K. 2016, AcA, 66, 357
Applegate, J. H., 1992, ApJ, 385, 621
Arbutina, B. 2007, MNRAS, 377, 1635
Bradstreet, D. H. 1985, ApJS, 58, 413
Bradstreet, D. H., & Guinan, E. F. 1994, ASP Conf. Ser., 56, 228
Branicki, A. & Pigulski, A. 2002, IBVS, No. 5280
Brat, L., Zejda, M., Svoboda, P., 2007, Open European Journal on Variable Stars, 74, 1
Busch, H., Haussler, K., Lochel, K., et al. 1966, MVS 4(2), 19
Butters, O. W., West, R. G., Anderson, D. R., et al. 2010, A&A, 520, 10
Castelaz, M. W. 2014, IBVS, No. 6120
22

Chen, X.-D., Wang, S., Deng, L.-C., et al. 2020, ApJS, 249, 18
Christopoulou, P.-E., et al. 2012, AJ, 144, 149
Collier Cameron, A., Wilson, D. M., West, R. G., et al. 2007, MNRAS, 380, 1230
Cox, A. N. 2000, Allen’s Astrophysical Quantities (4th ed.; New York: Springer)
Cui, X., Zhao, Y., Chu, Y., et al. 2012, RAA, 12, 1197
D’Angelo, C., van Kerkwijk, M. H., Rucinski, S. M., 2006, AJ, 132, 650
Davenport, J. R. A., Becker, A. C., West, A. A., et al. 2013, ApJ, 764, 62
Deb, S. & Singh, H. P. 2011, MNRAS, 412, 1787
Diethelm, R. 2009, IBVS, No. 5894
Diethelm, R. 2010, IBVS, No. 5945
Diethelm, R. 2011, IBVS, No. 5992
Diethelm, R. 2012, IBVS, No. 6029
Diethelm, R. 2013, IBVS, No. 6063
Dimitrov, D. P. & Kjurkchieva, D. P. 2015, MNRAS, 448, 2890
Djurasevic, G., Yilmaz, M., et al. 2011, A&A, 525, A66
Dogru, S. S., Dogru, D., Donmez, A., 2007, IBVS, No. 5795
Drake, A. J., Graham, M. J., Djorgovski, S. G., el al. 2014, ApJS, 213, 9
Dvorak, S. W. 2005, IBVS, No. 5603
Dvorak, S. W. 2008, IBVS, No. 5814
Eker, Z., Demircan, O., Bilir, S., Karatas, Y., 2006, MNRAS, 373, 1483
Fang, X.-H., Qian, S.-B., et al. 2019, PASJ, 71, 125
Flannery, B. P. 1976, ApJ, 205, 217
Gazeas, K. D., Loukaidou, G. A., Niarchos, P. G., et al. 2021, MNRAS, 502, 2879
Guzel, O. & Ozdarcan, O., 2020, CoSka, 50, 535
Hoffmann, M. 1981, IBVS, No. 1934
Hoffmeister, C. 1963, AN, 287, 169
Hu, K., Yu, Y.-X., Zhang, J.-F., et al. 2020, AJ, 160, 62
Hubscher, J., Paschke, A., Walter, F. 2005, IBVS, No. 5657
Hubscher, J. 2011, IBVS, No. 5984
Hubscher, J. & Monninger, G., 2011, IBVS, 5959
Hubscher, J. & Lehmann, P. B., 2015, IBVS, 6149
Jayasinghe, T., Stanek, K. Z., Kochanek, C. S., et al. 2020, MNRAS, 493, 4045
Jeong, J.-H, Kim, Ch.-Hw., Lee, Y.-S., et al. 2010, JASS, 27, 81
Jiang, D.-K. 2020, MNRAS, 492, 2731
23

Jiang, D.-K., Han, Z.-W., Li, L.-F., 2014, MNRAS, 438, 859
Jiang, L.-Q., Qian, S.-B., Zhang, J., Zhou, X., 2015, AJ, 149, 169
Kim, S.-L., Lee, J.-W., Kim, Ch.-Lh., et al. 2005, PASP, 117, 1394
Kopacki, G. & Pigulski, A. 1995, AcA, 45, 753
Kotkova, L. & Wolf, M. 2006, IBVS, No. 5676
Kozai, Y. 1962, AJ, 67, 591
Krajci, T. 2005, IBVS, No. 5592
Kraft, R. P. 1967, ApJ, 150, 551
Kreiner, J. M. 2004, Acta Astron., 54, 207
Kriwattanawong, W. & Kriwattanawong, K. 2019, RAA, 19, 143
Kriwattanawong, W. & Poojon, P., 2013, RAA, 13, 11
Kriwattanawong, W. & Poojon, P., 2015, New A, 36, 50
Kriwattanawong, W., Sanguansak, N., Maungkorn, S., 2017, PASJ, 69, 62
Kriwattanawong, W., Sarotsakulchai, T., Maungkorn, S. et al., 2018, New A., 61, 1
Kwee, K. K. 1958, BAN, 14, 131
Lee, J. W., Hong, K.-S., Koo, J.-R., et al. 2016, ApJ, 820, 1
Lee, J. W., Kim, C.-H., Han, W., et al. 2004, MNRAS, 352, 1041
Lee, J. W., Kim, S.-L., Lee, Ch.-U., et al. 2009, PASP, 121, 1366
Li, K., Hu, S.-M., Jiang, Y.-G., et al. 2014, New A, 30, 64
Li, K., Xia, Q.-Q., Kim, Chun-Hwey, et al. 2021, AJ, 162, 13
Li, M. C. A., Rattenbury, N. J., Bond, I. A., et al. 2018, MNRAS, 480, 4557
Li, Y.-Y., Li, K., Liu, Y., 2021, RAA, 21, 122
Liao, W.-P. & Qian, S.-B. 2010, MNRAS, 405, 1930
Liao, W.-P., Qian, S.-B., Liu, N.-P., 2012, AJ, 144, 178
Liu, J.-H., et al. 2019, PASP, 131, 4202
Liu, L., Qian, S.-B., Zhu, L.-Y., et al. 2011, MNRAS, 415, 3006
Liu, N.-P., Qian, S.-B., Soonthornthum, B., et al. 2014a, AJ, 147, 41
Liu, N.-P., Qian, S.-B., Liao, W.-P., et al. 2014b, RAA, 14, 1157
Liu, N.-P., Qian, S.-B., Wang, J.-J., et al. 2014c, New A, 32, 31
Liu, N.-P., Qian, S.-B., Soonthornthum, B., et al. 2015, AJ, 149, 148
Liu, N.-P., Sarotsakulchai, T., Rattanasoon, S., Zhang, B., 2020, PASJ, 72, 73
Lu, H.-P., Zhang, L.-Y., Michel, R., et al. 2020, ApJ, 901, 169
Lucy, L. B. 1967, Zs. Ap., 65, 89
Lucy, L. B. 1976, ApJ, 205, 208
24

Martignoni, M., Acerbi, F., Barani, C., 2016, New A, 46, 25
Marsh, F. M., Prince, T. A., Mahabal, A. A., et al. 2017, MNRAS, 465, 4678
Michel, R., Xia, Q.-Q., Higuera, J. 2019, RAA, 19, 99
Mitnyan, T., Bodi, A., Szalai, T., et al. 2018, A&A, 612, A91
Nagai, K. 2015, Variable Star Bulletin, No. 59
Nelson, R. H. 2006, IBVS, No. 5672
Nelson, R. H. 2008, IBVS, No. 5820
Nelson, R. H. 2009, IBVS, No. 5875
Nelson, R. H. 2010, IBVS, No. 5951
O’Connell, D. J. K. 1951, PRCO, 2, 85
Ostadnezhad, S., Delband, M., Hasanzadeh, A., 2014, New A, 31, 14
Ozavci, I., Ozuyar, D., et al. 2020, AcA, 70, 33
Pilecki, B., Fabrycky, D., Poleski, R., 2007, MNRAS, 378, 757
Pojmanski, G. 1997, AcA, 47, 467
Pollacco, D. L., Skillen, I., Cameron, A. C., et al. 2006, PASP, 118, 1407
Prasit, A., Buisset, C., Lepine, T., et al. 2019, proceeding of the SPIE, 11116, 1
Pribulla, T. & Rucinski, S. M. 2006, AJ, 131, 2986
Pribulla, T. & Vanko, M. 2002, CoSka, 32, 79
Qian, S.-B. 2003, A&A, 400, 649
Qian, S.-B., He, J.-J., Zhang, J., et al. 2017, RAA, 17, 87
Qian, S.-B., Jiang, L.-Q., et al. 2015, ApJL, 798, L42
Qian, S.-B., Liu, N.-P., Li, K., et al. 2013, ApJS, 209, 13
Qian, S.-B., Wang, J.-J. Zhu, L.-Y., et al. 2014, ApJS, 212, 4
Qian, S.-B., Yuan, J.-Z., Soonthornthum, B., et al. 2007, ApJ, 671, 811
Rappaport, S., Deck, K., Levine, A., et al. 2013, ApJ, 768, 33
Rasio, F. A. 1995, ApJ, 444, 41
Rucinski, S. M. 1969, Acta Astron., 19, 245
Rucinski, S. M. 2007, MNRAS, 382, 393
Rucinski, S. M., Pribulla, T., et al. 2007, AJ, 134, 2353
Samec, R. G., Figg, E. R., Faulkner, D. R., et al., 2009, IBVS, No. 5901
Samec, R. G., Flaaten, D., Jaso, A., et al. 2012, PASP, 124, 1025
Samec, R. G., Gray, J. D., Carrigan, B. J. 1995, PASP, 107, 136
Samec, R. G. & Kreidl, T. J. 1992, IBVS, No 3790
Samec, R. G., Oliver, B., Figg, E. R., et al. 2011, IBVS, No. 5963
25
Samolyk, G. 2010, JAVSO, 38, 85
Samolyk, G. 2016a, JAVSO, 44, 69
Samolyk, G. 2016b, JAVSO, 44, 164
Sarotsakulchai, T., Qian, S.-B., Soonthornthum, B., et al. 2019a, PASJ, 71, 34
Sarotsakulchai, T., Qian, S.-B., Soonthornthum, B., et al. 2019b, PASJ, 71, 81
Shappee, B. J., Prieto, J. L., Grupe, D., et al. 2014, ApJ, 788, 48
Shugarov, S. Y., 1975, Astron. Zirk., 888, 7
Socia, Q. J., Welch, W. F., Short, D. R., et al. 2018, ApJL, 864, L32
Terrell, D. & Willson, R. E. 2005, Ap&SS, 296, 221
Tokovinin, A. 2014, AJ, 147, 87
Tylenda, R., Majduk, M., Kaminski, T., et al. 2011, A&A, 528, A114
Virnina, N. A., Panko, E. A., Sergienko, O. G., et al. 2010, OAP, 23, 148
Wang, J.-J., Jiang, L.-Q., Zhang, B., et al. 2017, PASP, 129, 124202
Webbink, R. F. 1976, ApJ, 209, 829
Wilson, R. E. & Devinney, E. J., 1971, ApJ, 166, 605
Wilson, R. E. & Van Hamme, W., 2014, ApJ, 780, 151
Wozniak, P. R., et al. 2004, AJ, 127, 2436
Xia, Q.-Q., Li, K., Chen, X., et al. 2018, PASJ, 70, 104
Yang, Y.-G. 2011, RAA, 11, 2
Yang, Y.-G., Dai, H.-F., Zhang, J.-F. 2013, New A, 19, 27
Yang, Y.-G., Lu, G.-L., Yin, X.-G., et al. 2009a, AJ, 137, 236
Yang, Y.-G., Qian, S.-B., et al. 2005, Ap&SS, 300, 337
Yang, Y.-G., Qian, S.-B., Zhu, L.-Y., et al. 2008, PASJ, 60, 803
Yang, Y.-G., Wei, J.-Y., Nakajima, K., 2009b, PASJ, 61, 13
Yuan, H.-Y., Dai, H.-F., Yang, Y.-G., 2018, RAA, 18, 78
Yue, Q., Zhang, L.-Y., et al. 2019, RAA, 19, 97
Zhang, J., Qian, S.-B., Han, Z.-T., Wu, Y., 2017, MNRAS, 466, 1118
Zhang, L.-Y., Pi, Q.-F., Han, X.-M., et al. 2015, New A, 38, 50
Zhang, L.-Y., Pi, Q.-F., Yang, Y.-G., Li, Z.-M., 2014, New A, 27, 81
Zhang, X.-D., Qian, S.-B., Liao, W.-P. 2020, MNRAS, 492, 4112
Zhang, Y., Han, Q.-W., Liu, J.-Z., et al. 2016, PASP, 128, 124201
Zhou, X., Qian, S.-B., Huang, B.-H., et al. 2016, PASJ, 68, 102
Zhou, X. & Soonthornthum, B., 2019a, PASJ, 71, 39
Zhou, X. & Soonthornthum, B., Qian, S.-B., et al. 2019b, MNRAS, 489, 4760
26
Zhou, X. & Soonthornthum, B., 2020, RAA, 20, 10
Zhu, L.-Y., Qian, S.-B., et al. 2010, 140, 215
Zhu, L.-Y., Qian, S.-B., Soonthornthum, B., et al. 2014, AJ, 147, 42
Zhu, L.-Y., Wang, Z.-H., Tian, X.-M., et al. 2019, MNRAS, 489, 2677
Zhu, L.-Y., Zhao, E.-G., Zhou, X., 2016, RAA, 16, 68
27