Embed Size (px)
Citation preview
BioMed CentralBMC Biology
ss
Open AcceResearch articlePositive correlation between genetic diversity and fitness in a large, well-connected metapopulationSofie Vandewoestijne*1, Nicolas Schtickzelle1 and Michel Baguette2Address: 1Biodiversity Research Centre, Université catholique de Louvain, Place Croix du Sud 5, 1348 Louvain-la-Neuve, Belgium and 2Muséum National d'Histoire Naturelle, Département Ecologie et Gestion de la Biodiversité, CNRS UMR 7179, 4 Avenue du Petit-Château, 91800 Brunoy, France
Email: Sofie Vandewoestijne* - [email protected]; Nicolas Schtickzelle - [email protected]; Michel Baguette - [email protected]
* Corresponding author
AbstractBackground: Theory predicts that lower dispersal, and associated gene flow, leads to decreasedgenetic diversity in small isolated populations, which generates adverse consequences for fitness,and subsequently for demography. Here we report for the first time this effect in a well-connectednatural butterfly metapopulation with high population densities at the edge of its distribution range.
Results: We demonstrate that: (1) lower genetic diversity was coupled to a sharp decrease in adultlifetime expectancy, a key component of individual fitness; (2) genetic diversity was positivelycorrelated to the number of dispersing individuals (indicative of landscape functional connectivity)and adult population size; (3) parameters inferred from capture-recapture procedures (populationsize and dispersal events between patches) correlated much better with genetic diversity thanestimates usually used as surrogates for population size (patch area and descriptors of habitatquality) and dispersal (structural connectivity index).
Conclusion: Our results suggest that dispersal is a very important factor maintaining geneticdiversity. Even at a very local spatial scale in a metapopulation consisting of large high-densitypopulations interconnected by considerable dispersal rates, genetic diversity can be decreased anddirectly affect the fitness of individuals. From a biodiversity conservation perspective, this studyclearly shows the benefits of both in-depth demographic and genetic analyses. Accordingly, toensure the long-term survival of populations, conservation actions should not be blindly based onpatch area and structural isolation. This result may be especially pertinent for species at their rangemargins, particularly in this era of rapid environmental change.
BackgroundHabitat destruction and fragmentation result in decreasedhabitat patch size and increased habitat patch isolation.Consequences of this common and now well-studiedphenomenon include, amongst others, modified commu-nity composition and structure, smaller population sizes
and decreased population connectivity [1]. Both popula-tion size and connectivity significantly affect populationgenetic diversity, which can subsequently affect fitness.Indeed, as population size decreases, genetic stochasticityincreases, resulting in increased allele fixation with eachgeneration due to higher genetic drift. Homozygosity also
Published: 5 November 2008
BMC Biology 2008, 6:46 doi:10.1186/1741-7007-6-46
Received: 25 September 2008Accepted: 5 November 2008
This article is available from: http://www.biomedcentral.com/1741-7007/6/46
© 2008 Vandewoestijne et al; licensee BioMed Central Ltd. This is an Open Access article distributed under the terms of the Creative Commons Attribution License (http://creativecommons.org/licenses/by/2.0), which permits unrestricted use, distribution, and reproduction in any medium, provided the original work is properly cited.
Page 1 of 11(page number not for citation purposes)

BMC Biology 2008, 6:46 http://www.biomedcentral.com/1741-7007/6/46
increases due to a higher frequency of mating among rel-atives. Decreased connectivity augments the effects ofsmall population sizes because of a reduction in success-ful dispersal events. Consequently, no or few alleles arriveto enhance the existing gene pool. Accordingly, smallerand more isolated populations are generally characterizedby low genetic diversity (e.g. [2]). Theory predicts that lossof genetic diversity generates adverse consequences for fit-ness, and subsequently for population demography, insmall isolated populations [3], which is indeed confirmedby empirical evidence [2,4-6]. Hence, the major goal ofconservation managers is to maintain minimum viablepopulation sizes not only by increasing population sizebut also by enhancing connectivity between populations(e.g. [7]).
In this study, we analysed the relationship betweengenetic diversity and fitness in a butterfly metapopulationwithin a highly fragmented landscape. Contrary to moststudies relating genetic diversity to fitness, and despite thehigh amount of habitat loss and fragmentation within thestudy area, the chosen model species still has local popu-
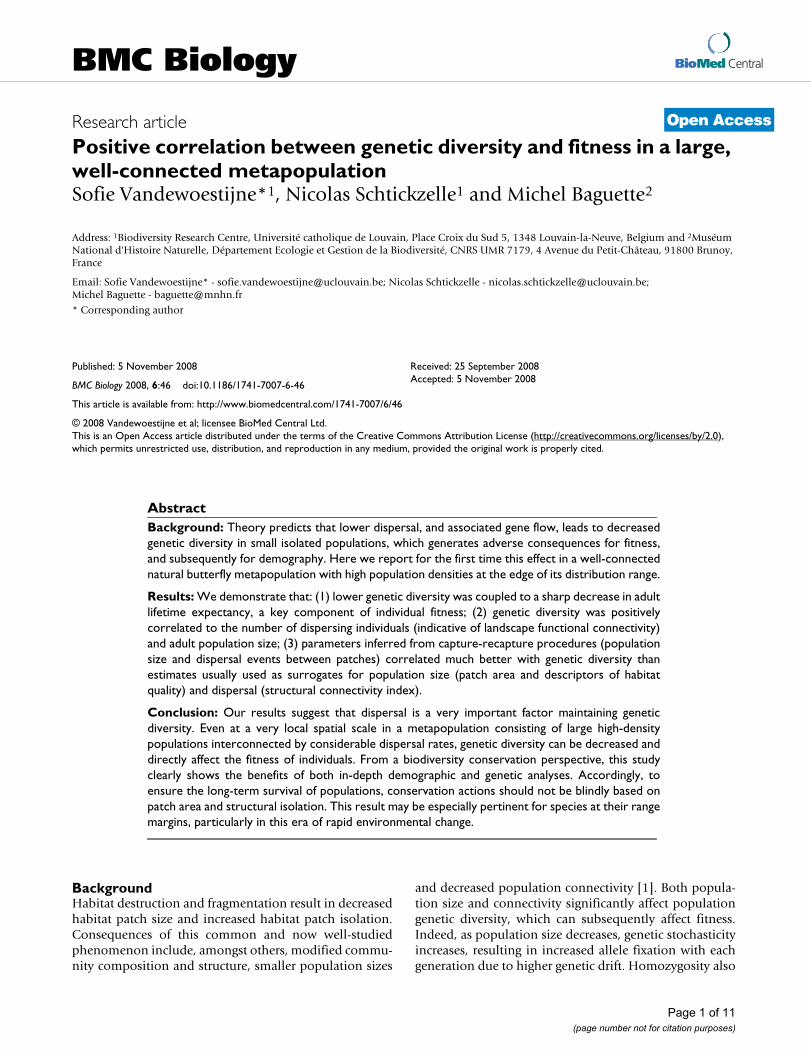
lations of relatively large sizes and high connectivity. Bothdemographic and genetic techniques were used to esti-mate genetic diversity and fitness in five populations ofthe chalk-hill blue butterfly Polyommatus coridon (Poda)(Lycaenidae, Lepidoptera) situated in southern Belgium,at the northern edge of the species distribution range (Fig-ure 1). These five populations were the largest popula-tions in the area. Several other suitable sites were visitedin the neighbourhood, but no or very few P. coridon indi-viduals were observed. Polyommatus coridon is a ther-mophilic univoltine habitat specialist of calcareousgrasslands [8,9], where caterpillars feed exclusively (T.Schmitt, personal communication) on the horseshoevetch, Hippocrepis comosa. It is one of the six most charac-teristic butterfly species of European calcareous grasslands[10]. Within the Walloon region (i.e. southern Belgium),P. coridon is classified as rare and in decline, and its distri-bution range has regressed by 70% since the 1950s [11].Consequently, it is a species of high conservation priority.
Calcareous grasslands are biodiversity hotspots not onlybecause they are amongst the richest plant and insect
Polyommatus coridon worldwide (a) and Belgian (b) distribution rangeFigure 1Polyommatus coridon worldwide (a) and Belgian (b) distribution range. Study sites (c) with number of observed between-population movements (males and females combined) indicated in white.
Page 2 of 11(page number not for citation purposes)
BMC Biology 2008, 6:46 http://www.biomedcentral.com/1741-7007/6/46
communities in Europe [12], but also because they har-bour numerous species from diverse regions, includingSouthern Mediterranean and Eastern Asia. They are also acentral issue in nature conservation management inEurope because most of the calcareous grasslands aresemi-natural habitats, i.e. created by human activity. Sincethe beginning of the 20th century, calcareous grasslandsand their associated communities have declined severelyfollowing the progressive abandonment of agropastoralpractices due to a lack of economical interest, land useintensification, and urbanisation [13]. Indeed, mostformer calcareous grasslands have been afforested or havedeveloped into woodlands by natural succession [14].Our study area reflects this general trend [15]. In 2004only 4.76% of the calcareous grassland surface of 1905remained. This drastic decrease in calcareous grasslandarea is accompanied by a sharp decrease in average patcharea (from 7.8 ha in 1905 to 0.8 ha in 2004), in patchnumber (22 large patches in 1905, 45 small patches in1965, and 10 small patches in 2004), and in average patchconnectivity (connectivity in 2004 is only 6% of that in1905). Habitat loss and fragmentation in this region hashad a profound effect on the butterfly community, includ-ing the extinction of specialist species and a subsequentincrease in the over-representation of generalist species.Butterfly abundance, for both specialist and generalistspecies (based on common versus rare status), has alsodecreased significantly during this time period within thestudy region [15]. These modifications have also beenobserved elsewhere (i.e. on western German calcareousgrasslands [16]). Consequently, calcareous grasslands areof high conservation priority, not only because they arebiodiversity hotspots but also because of their historical(and cultural) heritage. The fact that the study system isfound at the edge of P. coridon's distribution range doesnot make it less important for conservation management,especially when the main factors driving extinction areexternal (e.g. [17]).
The primary aim of this study was to analyse the relation-ship between genetic diversity and fitness in a species ofhigh conservation value within a landscape that has dete-riorated significantly over the last century. Demographicdata were used to estimate population size, effective pop-ulation connectivity (number of successful dispersalevents) and a fitness component, lifetime expectancy. Wethen investigated how genetic diversity affected lifetimeexpectancy. Lifetime expectancy is an important fitnesscomponent in insects because it directly affects lifetimereproductive success of many species [18], particularlypolygamous species mating throughout their life, as P.coridon. Indeed, a longer life span will allow a greaternumber of matings (both sexes of P. coridon mate morethan once). Furthermore, P. coridon females with a higherlifetime expectancy will lay more eggs since they lay eggs
singly and continually until they die, but need to attain acertain maturity after hatching before being able to layeggs, and lay fewer eggs in early life compared with lateron [9].
Additionally, since this study was conducted within theframework of a nature conservation project with concretemanagement guidelines as one of the main objectives, werelate our demographic and genetic results to surrogateindices often used in applied conservation studies: habitatpatch area and habitat quality descriptors as surrogates forpopulation size, and structural connectivity as a surrogatefor the intensity of dispersal and associated gene flow.Central to the metapopulation theory, the basic idea isthat increased patch size and/or connectivity lead toincreased population sizes (e.g. [19]). Populations oflarger size are expected to be more viable because they aresubjected less to demographic, genetic, and environmen-tal stochasticity [20]. The long-term viability of popula-tions is also expected to decrease with increasedgeographic isolation. Indeed, due to a decrease in success-ful dispersal events, locally isolated populations will notbenefit from population replenishment by immigrants,which is necessary for population subsistence when thebirth rate is exceptionally low or the death rate high [21].The supply and exchange of genes (alleles) also decreasesin isolated populations, resulting in lower genetic diver-sity and increased inter-population differentiation [22](but see [23]).
The causal link between genetic diversity and fitness can-not be demonstrated without large experimental breedingand/or translocation manipulations at the populationlevel, which is almost impossible to put into practice,especially with a threatened species. In such study systemsit is therefore often necessary to correlate the variationobserved in several traits, and we used this approach inour study; this correlation approach often generates richconclusions (e.g. [24]). Obtaining high quality estimatesof genetic, demographic, and dispersal data was a clearprerequisite to be able to assess existing relations betweenthese three kinds of trait. This required a huge investmentin data collection and analysis, forcing a trade-off with thenumber of populations analysed in this study. The rela-tively small number of populations (five) studied hereplaced certain limits on the power of statistical tests. As aconsequence, we did not interpret the very statistical levelassociated with the test of any single particular correlationcoefficient, but focused on patterns emerging from sets ofcorrelations involving alternative measures of geneticdiversity.
Demography of the five populations was studied with theCapture-Mark-Recapture (CMR) methodology. The largeCMR data set (7228 (re)captures of 2789 different indi-
Page 3 of 11(page number not for citation purposes)

BMC Biology 2008, 6:46 http://www.biomedcentral.com/1741-7007/6/46
viduals) was analysed using high-performance statisticalprocedures to obtain estimates of demographic parame-ters (survival and birth rates). Lifetime expectancy at birth(LTE), i.e. the number of days a newborn butterfly isexpected to live, was computed for each of the five popu-lations from these values of survival and birth rates.Genetic diversity was evaluated using three alternative andpartially redundant measures based on 30 ISSR (intersim-ple sequence repeat) loci: He (expected heterozygosity,calculated from the null allele frequency and based on theHardy-Weinberg equilibrium, with allele frequencies cal-culated from null homozygote frequencies assuming pan-mixia and corrected for dominance), Div (average genediversity, i.e. mean number of pairwise haplotype differ-ences), and PPL (percentage polymorphic loci). From hereon, we refer to He, PPL and Div collectively when using theterm 'genetic diversity'.
ResultsPopulation sizes (total over the flight period) variedbetween 2301 and 171 individuals (sexes pooled), andlifetime expectancy LTE varied from 8.46 to 10.86 days(Table 1). More detailed demographic results are out ofthe scope of the present paper; they are therefore not dis-played here.
The average gene diversity Div over all ISSR loci and for allpopulations was 0.347 ± 0.176 (Table 1), indicating thatabout 35% of the loci differed between all pairs of ISSRgenotypes. The expected heterozygosity He was 0.321 andthe percentage of polymorphic loci PPL was 96.7%. Asexpected, the three measures of genetic diversity were allpositively correlated to each other, although strictly speak-ing only the He-PPL correlation was statistically signifi-cant at the 0.05 level (He-Div: r = 0.700, p = 0.188; He-PPL:r = 0.949, p = 0.014; Div-PPL: r = 0.632, p = 0.252). Popu-lation differentiation was low but significant: 0.0268 and0.0225 (p = 0.001) for Fst and θst, respectively. Fondry desChiens and Abannets were the most genetically differenti-ated populations (Table 2). No significant (geographic)isolation by distance was detected (r = -0.040, p = 0.495).
Patterns of correlations were clearly visible among all thegenetic, demographic, and dispersal measures: whereascorrelations presented in Table 3 (genetic diversity, LTE,population size and dispersal rate) are high (10/11 arehigher or equal to 0.63), those presented in Table 4 andTable 5 (genetic diversity and LTE with surrogates for pop-ulation size and dispersal rate) are substantially lower(only 1/20 is higher than 0.63).
Table 1: Genetic, demographic and ecological data collected for five populations of Polyommatus coridon in the Walloon region (i.e. southern Belgium)
Montagne au Buis
Roche à Lomme Abannets Tienne Breumont
Fondy des Chiens
Entire data set
Genetic data Sample size (individuals)
28 31 25 30 30 144
He 0.333 ± 0.056 0.309 ± 0.066 0.302 ± 0.070 0.294 ± 0.063 0.313 ± 0.060 0.321 ± 0.056Div 0.364 ± 0.084 0.328 ± 0.072 0.307 ± 0.078 0.339 ± 0.076 0.345 ± 0.077 0.347 ± 0.033PPL 96. 7 90 90 86.7 96.7 96.7
Demographic data
Census population size
1620 ± 84 384 ± 106 171 ± 24 630 ± 130 2301 ± 130
LTE (days) 10.86(9.98–12.03)
9.43(7.71–12.06)
8.86(7.02–11.60)
8.46(7.41–9.71)
9.50(8.65–10.49)
Number of immigrants
47 24 21 12 56
Number of emigrants
55 30 17 12 46
Landscape and environmental data
Area 4.3 0.67 2.77 8.03 3.97
Structural connectivity
0.0035 0.0155 0.0146 0.0038 0.0087
Microclimatic conditions
-0.228 ± 0.614 -1.624 ± 1.501 1.449 ± 0.595 0.094 ± 0.565 -0.191 ± 0.739
Nectar abundance
39.350 ± 7.417 38.583 ± 12.795 35.944 ± 8.048 26.000 ± 3.406 41.391 ± 7.349
Host plant abundance
5.750 ± 3.979 5.750 ± 7.112 3.810 ± 5.476 0.059 ± 0.120 1.826 ± 3.603
He: expected heterozygosity, Div: average gene diversity, PPL: percentage of polymorphic loci, LTE: lifetime expectancy. A 95% confidence interval is given when available (± half length if symmetrical, lower and upper values when asymmetrical).
Page 4 of 11(page number not for citation purposes)

BMC Biology 2008, 6:46 http://www.biomedcentral.com/1741-7007/6/46
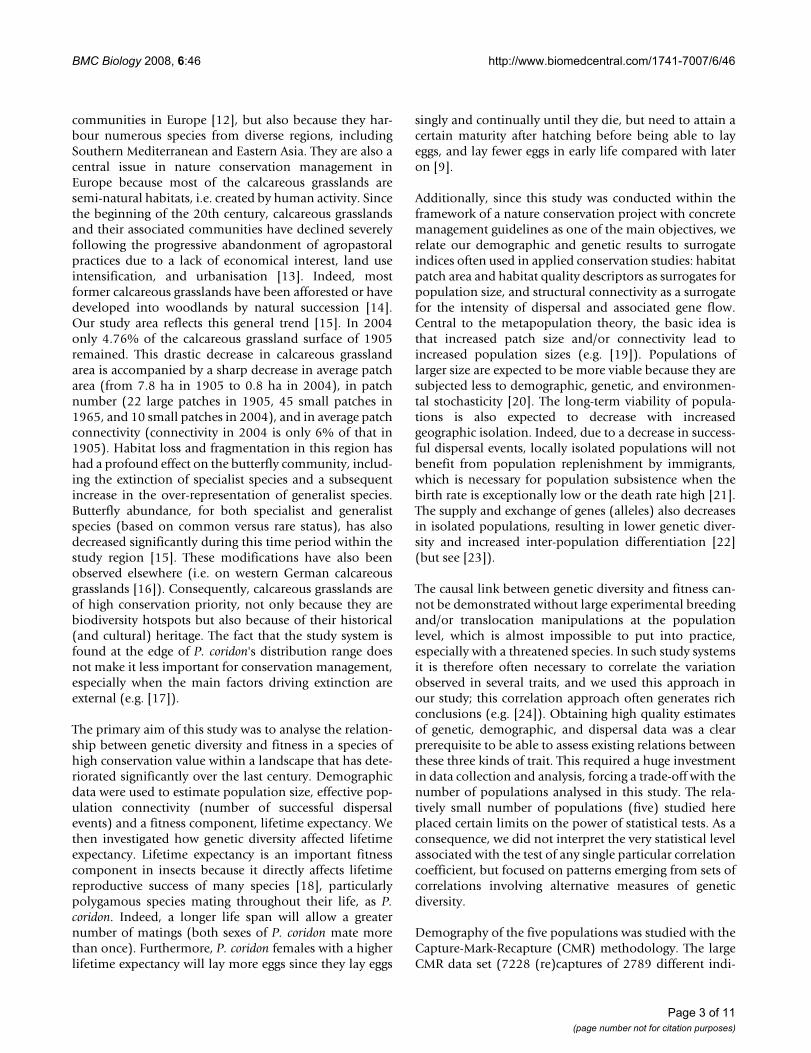
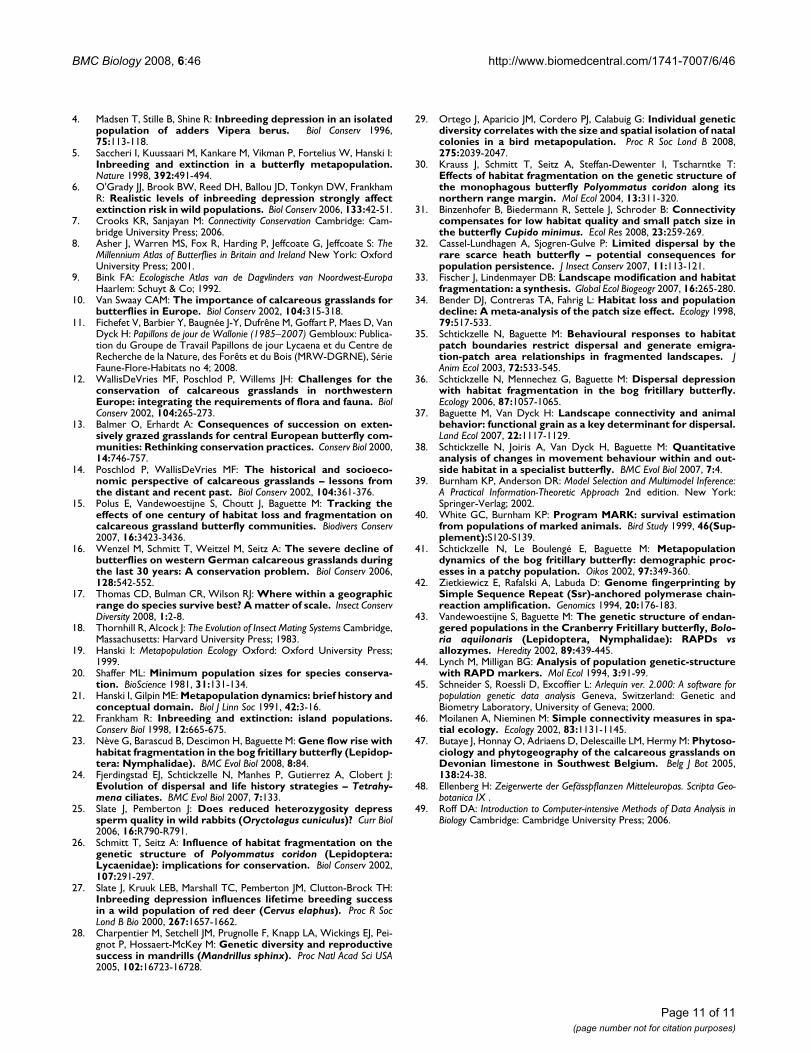
Variations between populations in genetic diversity werepositively correlated to variations in LTE (Table 3; Figure2). This correlation was highly significant for He. Whilenot significant at the 0.05 level, Div and PPL also showedlargely positive covariation with LTE. The example of theHe-LTE correlation is used to show that this correlationremained largely unaltered when the uncertainties in theestimates of He and LTE were fully taken into account, andis robust to a large decrease of the number of loci onwhich genetic diversity was computed (Figure 3). Thispositive relation implies that butterflies from populationswith the highest genetic diversity had a mean lifetimeexpectancy up to c. 25% higher than butterflies from pop-ulations characterised by a low genetic diversity.
Genetic diversity was positively correlated with popula-tion size (Table 3), but not with its surrogates (Table 4).Likewise, genetic diversity was positively correlated withnumber of immigration dispersal events (Table 3) but notwith its surrogate (Table 5). No correlation was observedbetween LTE and population size or its surrogates (Tables3 and 4); LTE was positively correlated with number ofimmigration events, but not with its surrogate (Tables 3and 5); LTE was also positively correlated with thenumber of emigration events (r = 0.900, p = 0.037), butnot with the net number of immigrants (immigrationminus emigration: r = 0.300, p = 0.624).
DiscussionUsing both demographic and genetic techniques on ametapopulation of P. coridon consisting of large and wellconnected populations, three conclusions were reached:(1) the most important conclusion is that fitness of butter-flies positively correlated with genetic diversity; (2) immi-gration rate and population size were also positively
correlated with genetic diversity; and (3) CMR-based esti-mates of population size and dispersal rates were betterindicators of genetic diversity than were some of theirmore conventionally used surrogates: habitat patch area,various measures of habitat quality, and geographic patchisolation.
Lower genetic diversity was coupled to a sharp decrease inadult lifetime expectancy (LTE): P. coridon butterflies ofsome populations lived for up to 25% (2.4 days) longeron average than their counterparts of other populations,therefore significantly increasing their individual fitness.LTE is definitely a major component of individual fitnessvia lifetime reproductive success in this species. Indeed,both sexes mate more than once and females with ahigher LTE will lay more eggs, because females lay eggssingly and continually until they die but need to attain acertain maturity after hatching before being able to layeggs [9].
Despite the limits inherent to the correlational approachand the restricted number of populations sampled in thisstudy, the validity of our conclusions is supported bythree main elements. First, the accuracy of estimates forgenetic, demographic and dispersal parameters was veryhigh compared with the standard level achieved in otherstudies. Genetic diversity measures were based on a rela-tively large number of loci. Demographic and dispersalmeasures were based on a very large CMR dataset. LTE notonly integrates survival over the entire adults' life-span(daily survival changed with time) but also incorporatesthe variation in birth rate over time (which followed a par-abolic distribution), which results in one robust and com-prehensive value of average adult lifetime expectancy perpopulation. Second, the He-LTE correlation remained
Table 2: Population pairwise θst values. Bold values signify a significant θst value at the 0.05 level
Montagne au Buis Roche à Lomme Abannets Tienne Breumontθst p θst p θst p θst p
Roche à Lomme 0.013 0.132Abannets 0.027 0.039 0.013 0.149Tienne Breumont 0.007 0.237 0.010 0.165 0.025 0.043Fondry des Chiens 0.038 0.005 0.056 0.001 0.037 0.010 0.050 0.001
Table 3: Correlation between genetic diversity, lifetime expectancy, population size and dispersal rate
Lifetime expectancy (LTE) Census population size (N) Dispersal rate (number of immigrants)r p r p r p
Expected heterozygosity (He) 1.000 <0.0001 0.600 0.285 1.000 <0.0001Gene diversity (Div) 0.700 0.188 0.900 0.037 0.700 0.188Percentage of polymorphic loci (PPL) 0.949 0.014 0.632 0.252 0.949 0.014Lifetime expectancy (LTE) - - 0.600 0.285 1.000 <0.0001
Spearman coefficients (r) in bold are statistically significant at the 0.05 level.
Page 5 of 11(page number not for citation purposes)

BMC Biology 2008, 6:46 http://www.biomedcentral.com/1741-7007/6/46
highly significant even when the errors associated withdemographic and genetic estimates were taken intoaccount, indicating that the restricted number of popula-tions was sufficient for detection of trends, despite theestimation errors. And third, clear trends of similar andconsistent correlations were observed with alternativemeasures of genetic diversity.
Furthermore, although artefacts could potentially haveinfluenced the observed correlation between fitness andgenetic diversity, they do not alter the validity of our con-clusions. First, the issue of population structure (i.e. sig-nificant population differentiation) has been raised asone of the most likely causes of association betweengenetic diversity and fitness related traits. Indeed, sam-pling individuals from different geographic origins couldconfound associations because of environmental hetero-geneity at the sites [25]. We are convinced that this expla-nation can be ruled out in the present case for severalreasons. First of all, the studied populations were alllocated within a very restricted geographic area and werereadily identifiable because of the very specific ecologicalrequirements of P. coridon's host plant. Additionally, CMRdata confirmed that the five populations were in fact inde-pendent but interconnected units: dispersal within popu-lations (intra-patch movements) was more than 10 timesas large as between population dispersal, and none of thepopulations functioned as source or sink. Genetic analy-ses confirmed these results: population differentiationwas significant but extremely low. Low population differ-
entiation at local and regional scales is typical for this spe-cies [26]. Second, a positive correlation between geneticdiversity and LTE could also be due to the recognition byP. coridon adults of differential habitat quality amongpatches. Indeed, prime habitat would facilitate long lifespans in butterflies living there and attract, and keep,many individuals from outside the patch, leading toincreased genetic diversity. As a consequence, populationsin prime habitat will show an increased LTE and anincreased genetic diversity, both caused by habitat quality,and the link between genetic diversity and LTE might notexpress an effect of genetic diversity on fitness. If this sce-nario were the case in our study, we would expect to findboth a positive relation between LTE and some of theusual habitat quality descriptors (habitat area, microcli-mate, adult nectar resources, host plant abundance, struc-tural connectivity), and between LTE and the net numberof immigrants (immigrants minus emigrants), which wasnot the case. Some of the harshest conditions were evenfound on the site characterised by the highest geneticdiversity and LTE. Indeed, vegetation in this site had com-pletely dried up long before the end of the P. coridon flightseason, including its host plant (SV, personal observa-tion). Third, LTE might be biased by emigration rate,because CMR analyses consider as identical the death orthe emigration of an individual, both being disappear-ance events that decrease the estimate of survival rate (andthen LTE). In this case, a negative trend between LTE andthe number of emigration events is expected. However,emigration rate from the five populations was relativelylow compared with the amount of demographic data (3%of captures), and a positive correlation was observedbetween LTE and the number of emigration events, i.e. inthe opposite direction to the expected bias. The bias ofLTE due to emigration decreased differences between pop-ulations in LTE instead of exaggerating them, and theobserved positive correlations between LTE and geneticdiversity were therefore conservative.
So far, the interaction between genetic diversity and fit-ness (i.e. survival and/or reproductive success) has onlybeen revealed when effective population size becomeslow and/or populations are extremely isolated (e.g.
Table 4: Correlation between genetic diversity, lifetime expectancy, and surrogates of population size: patch area, microclimatic conditions, nectar and host plant abundance.
Patch area Microclimatic conditions Nectar abundance Host plant abundancer p r p r p r p
Expected heterozygosity (He) -0.100 0.873 -0.600 0.285 0.300 0.624 0.616 0.269Gene diversity (Div) 0.600 0.285 -0.400 0.505 -0.200 0.747 0.051 0.935Percentage of polymorphic loci (PPL) -0.105 0.866 -0.369 0.541 0.527 0.362 0.433 0.467Lifetime expectancy (LTE) -0.100 0.873 -0.600 0.285 0.300 0.624 0.616 0.269
Spearman coefficients (r) in bold are statistically significant at the 0.05 level.
Table 5: Correlation between genetic diversity, lifetime expectancy, and surrogate of dispersal rate: structural connectivity
Structural connectivityr p
Expected heterozygosity (He) -0.300 0.624Gene diversity (Div) -0.800 0.104Percentage of polymorphic loci (PPL) -0.264 0.668Lifetime expectancy (LTE) -0.300 0.624
Spearman coefficients (r) in bold are statistically significant at the 0.05 level.
Page 6 of 11(page number not for citation purposes)

BMC Biology 2008, 6:46 http://www.biomedcentral.com/1741-7007/6/46
Page 7 of 11(page number not for citation purposes)
Genetic diversity was positively correlated with lifetime expectancy (LTE)Figure 2Genetic diversity was positively correlated with lifetime expectancy (LTE). Butterflies from local populations with the highest genetic diversity had a LTE up to c. 25% higher, directly affecting their individual fitness through lifetime reproduc-tive success. Colours refer to sites in Figure 1.
0 31
0.32
0.33
0.34
rozy
gosi
ty (
He)
.
0.29
0.30
0.31
8 9 10 11Exp
ecte
d he
te
Mean lifetime expectancy (LTE in days)Mean lifetime expectancy (LTE in days)
0 35
0.36
0.37
Div
) .
0 30
0.31
0.32
0.33
0.34
0.35
Gen
e di
vers
ity (
D
0.30
8 9 10 11
Mean lifetime expectancy (LTE in days)
ci
90
95
100
of p
olym
orph
isc
loc
(PP
L) .
85
90
8 9 10 11
Per
cent
age
o (
Mean lifetime expectancy (LTE in days)
BMC Biology 2008, 6:46 http://www.biomedcentral.com/1741-7007/6/46
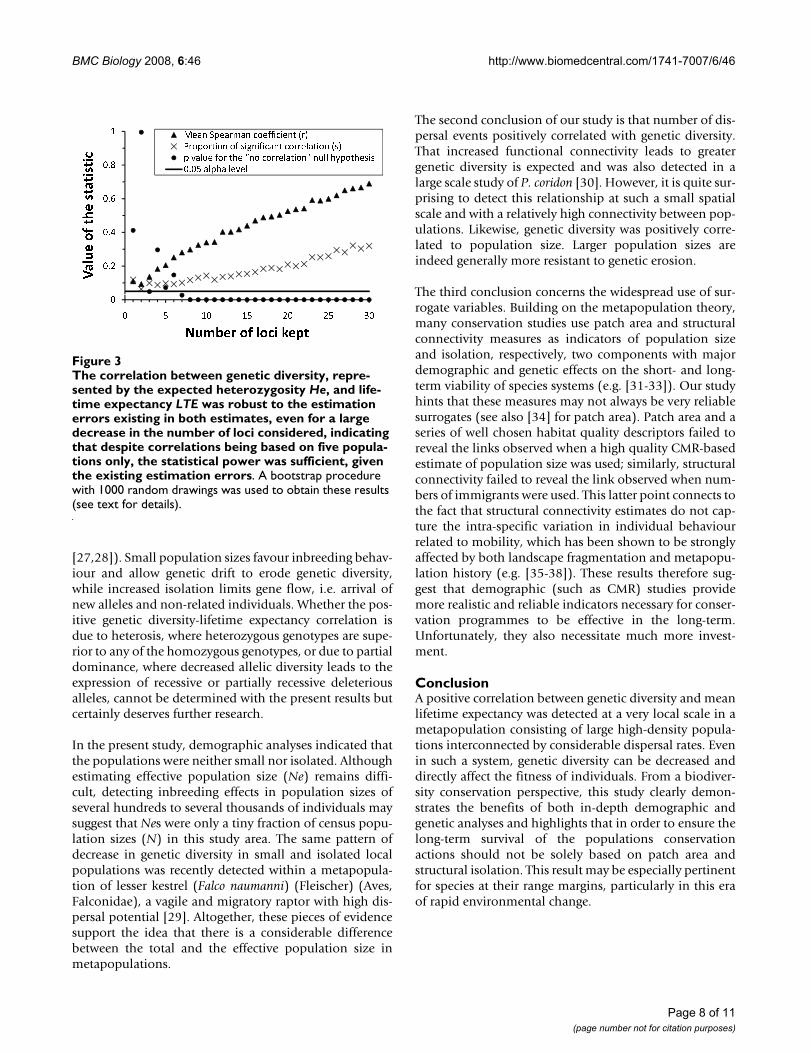
[27,28]). Small population sizes favour inbreeding behav-iour and allow genetic drift to erode genetic diversity,while increased isolation limits gene flow, i.e. arrival ofnew alleles and non-related individuals. Whether the pos-itive genetic diversity-lifetime expectancy correlation isdue to heterosis, where heterozygous genotypes are supe-rior to any of the homozygous genotypes, or due to partialdominance, where decreased allelic diversity leads to theexpression of recessive or partially recessive deleteriousalleles, cannot be determined with the present results butcertainly deserves further research.
In the present study, demographic analyses indicated thatthe populations were neither small nor isolated. Althoughestimating effective population size (Ne) remains diffi-cult, detecting inbreeding effects in population sizes ofseveral hundreds to several thousands of individuals maysuggest that Nes were only a tiny fraction of census popu-lation sizes (N) in this study area. The same pattern ofdecrease in genetic diversity in small and isolated localpopulations was recently detected within a metapopula-tion of lesser kestrel (Falco naumanni) (Fleischer) (Aves,Falconidae), a vagile and migratory raptor with high dis-persal potential [29]. Altogether, these pieces of evidencesupport the idea that there is a considerable differencebetween the total and the effective population size inmetapopulations.
The second conclusion of our study is that number of dis-persal events positively correlated with genetic diversity.That increased functional connectivity leads to greatergenetic diversity is expected and was also detected in alarge scale study of P. coridon [30]. However, it is quite sur-prising to detect this relationship at such a small spatialscale and with a relatively high connectivity between pop-ulations. Likewise, genetic diversity was positively corre-lated to population size. Larger population sizes areindeed generally more resistant to genetic erosion.
The third conclusion concerns the widespread use of sur-rogate variables. Building on the metapopulation theory,many conservation studies use patch area and structuralconnectivity measures as indicators of population sizeand isolation, respectively, two components with majordemographic and genetic effects on the short- and long-term viability of species systems (e.g. [31-33]). Our studyhints that these measures may not always be very reliablesurrogates (see also [34] for patch area). Patch area and aseries of well chosen habitat quality descriptors failed toreveal the links observed when a high quality CMR-basedestimate of population size was used; similarly, structuralconnectivity failed to reveal the link observed when num-bers of immigrants were used. This latter point connects tothe fact that structural connectivity estimates do not cap-ture the intra-specific variation in individual behaviourrelated to mobility, which has been shown to be stronglyaffected by both landscape fragmentation and metapopu-lation history (e.g. [35-38]). These results therefore sug-gest that demographic (such as CMR) studies providemore realistic and reliable indicators necessary for conser-vation programmes to be effective in the long-term.Unfortunately, they also necessitate much more invest-ment.
ConclusionA positive correlation between genetic diversity and meanlifetime expectancy was detected at a very local scale in ametapopulation consisting of large high-density popula-tions interconnected by considerable dispersal rates. Evenin such a system, genetic diversity can be decreased anddirectly affect the fitness of individuals. From a biodiver-sity conservation perspective, this study clearly demon-strates the benefits of both in-depth demographic andgenetic analyses and highlights that in order to ensure thelong-term survival of the populations conservationactions should not be solely based on patch area andstructural isolation. This result may be especially pertinentfor species at their range margins, particularly in this eraof rapid environmental change.
The correlation between genetic diversity, represented by the expected heterozygosity He, and lifetime expectancy LTE was robust to the estimation errors existing in both esti-mates, even for a large decrease in the number of loci con-sidered, indicating that despite correlations being based on five populations only, the statistical power was sufficient, given the existing estimation errorsFigure 3The correlation between genetic diversity, repre-sented by the expected heterozygosity He, and life-time expectancy LTE was robust to the estimation errors existing in both estimates, even for a large decrease in the number of loci considered, indicating that despite correlations being based on five popula-tions only, the statistical power was sufficient, given the existing estimation errors. A bootstrap procedure with 1000 random drawings was used to obtain these results (see text for details).
� � �
�
�� ��� �
� � � � � � � � � � � � � � � � � � � �� � � � � � � � � � � � � � � � � � � � � � � � � � � � � � � � � � � �� � � � � � � � � � � � � � � � � � � � � � � � � � � � � � � � � � � �� � � ! � � � � � � � �
� � "
� � #
� � $
% &' ()*+ �, ) �
� &
�� ! � � � ! " � " ! - �
. / 0 1 2 3 4 5 6 4 7 8 9 2 : ;
Page 8 of 11(page number not for citation purposes)

BMC Biology 2008, 6:46 http://www.biomedcentral.com/1741-7007/6/46
MethodsDemographyDuring the entire 2003 flight period (end of June to begin-ning of September), the demography of five P. coridonpopulations was studied with the CMR methodology. Thefive study sites, delimited on the basis of favourable hab-itat and topographic features, were visited as often as pos-sible (weather permitting). Every encountered imago wascaptured with a net, individually marked with a perma-nent pen and immediately released. For each (re)capture,the following data were recorded: tag number, sex, age(estimated through wing wear), date and hour, site andpatch.
Estimates of demographic parameters (daily survival rateφt, capture rate pt, recruitment rate bt, daily population sizeNt, and total population size N) were obtained for the fivepopulations separately, by analyzing the large CMR dataset (7228 captures of 2789 individuals) using the con-strained linear models method, with AIC-based [39]model selection procedure: Cormack-Jolly-Seber typemodel selection for survival and catchability and Jolly-Seber type model selection for survival, catchability andrecruitment with MARK software [40]. This procedure(described in detail with references in [41]) is currentlyone of the best techniques to obtain estimates of both sur-vival and birth rates in an open population, and is basedon the selection of the best model among a set of candi-date regression models describing variations (in thepresent case temporal) in demographic parameters. Sexeswere pooled to enable comparisons with the geneticresults.
Daily lifetime expectancy (LTEt), i.e. the number of days anewborn butterfly is expected to live, was computed froma virtual life table constructed from estimates of daily sur-vival rate (φt) using the formula:
with St = St-1·φt-1 and S1 being an arbitrarily fixed initialpopulation size (not affecting the resulting estimate ofLTEt). For each butterfly population, the mean LTE atbirth was computed by weighting daily values of LTEt bydaily number of births (Bt, with Bt = bt·N). Its 95% confi-dence interval was computed from the distribution of1000 random drawings of φt and Bt from their variance-covariance matrices.
Numbers of dispersing individuals (immigrants and emi-grants) were calculated directly from the CMR data set.The number of immigrants was used to quantify the dis-persal rate as it reflects the potential amount of gene flowbetween populations.
GeneticsSamples (between 25 and 31 per population) were col-lected, during the 2003 field season, using a non-invasivesampling technique: a tiny fraction of the wing or one legper butterfly was sampled and analysed using dominantDNA neutral markers, i.e. intersimple sequence repeat[42]. Reactions were standardised and care was taken tocreate identical experimental conditions for all samples(PCR reactions were run on the same thermal cycler, iden-tical products and concentrations were used for each run,etc.) Negative controls were used continually to check forcontamination and amplifying the same samples on dif-ferent days tested reproducibility. Product concentrationsand PCR reaction parameters were similar to those used in[43]. PCR products were separated on 1.6% agarose gels(TBE buffer) that were run for 225 minutes at 100 V. Sev-eral DNA size standards were run on every gel to aid iden-tification of the target bands. Ethidium bromide stainingwas used to visualise band patterns using GelDoc (Bio-Rad). Three ISSR primers out of 21 were selected based onthe polymorphism and reproducibility of the bands thatthey generated: 809, (AG)8G; 816, (CA)8T; 848, (CA)8RG.Only primers with 100% reproducible bands were consid-ered. Primers 809, 816, and 848 produced, respectively, 9,11, and 14 bands that could be unambiguously scored,and were reproducible and polymorphic. Of the 34 poly-morphic loci, four were dropped from analyses due tolinkage disequilibrium. Results of analyses based onbiased and unbiased allele frequencies [44] were very sim-ilar; therefore, we report only results based on the latter.Every sample was characterised by a different ISSR geno-type.
Genetic diversity was quantified for each population bythree measures: (1) expected heterozygosity He, (2) aver-age gene diversity over all loci Div, and (3) percentage ofpolymorphic loci PPL. Allele frequencies were calculatedfrom null homozygote frequencies assuming panmixiaand corrected for dominance [44] using TFPGA 1.3 (Toolsfor Population Genetic Analyses [TFPGA] 1.3: A WindowsProgram for the Analysis of Allozyme and Molecular Pop-ulation Genetic Datat, by MP Miller, 1997). Using theseallele frequencies, He was calculated from the null allelefrequency and based on the Hardy-Weinberg equilibrium.PPL (99% criterion) and genetic structuring (θst) were cal-culated using the same program. We also used genotypedata directly to obtain Div, the mean number of differ-ences between all pairs of genotypes divided by thenumber of loci, and to derive Fst from the variance compo-nents (AMOVA) using ARLEQUIN [45]. He and Div areindependent estimates of genetic diversity since theformer is based on allele frequencies and the latter onhaplotype identity. He and PPL are probably correlated bynature because both depend on the presence or absence ofpolymorphism at the locus level. A Mantel test was used
LTE S St t
t
k
t==
∑1
Page 9 of 11(page number not for citation purposes)

BMC Biology 2008, 6:46 http://www.biomedcentral.com/1741-7007/6/46
to assess the association between Nei's unbiased (1978)genetic matrix and the geographical distance matrix.
Habitat network descriptorsThe following habitat patch descriptors were measured:area, connectivity, a summary variable describing micro-climatic conditions, abundance of nectar sources, andhost plant abundance.
Patch area and inter-patch distances were calculated usingaerial photographs (year 2000) with ArcGIS 9 softwarehttp://www.esri.com. Structural connectivity of a habitatpatch was quantified according to its relation to all otherpatches in the study system:
where djk is the distance between patch j and patch k, andAk the area of patch k [46]. Plant species abundance anddiversity were inventoried for a total of 125 one metresquared plots within the P. coridon study system [47].Microclimatic conditions were summarised by the firstaxis (PRIN1) of a principal component analysis (PCA)performed on eight descriptors, including four descriptorsinferred by pooling knowledge on the vegetation compo-sition with Ellenberg values of individual plant species(light L, temperature T, humidity F, and nutrient acidityN: [48]). This first component explained 61.55% of thevariation existing in the original data. An increase alongthis axis represented an increase in bare ground, barerocks, light and temperature, and a decrease in humidity,nutrient acidity, soil depth and bryophyte abundance. Ahigher value therefore represented a more xeric microcli-mate. A plant species was classified as a potential adultfood resource by combining information concerning itsnectar production and its flowering period, and fieldobservations. Host plant abundance was based on meas-ured H. comosa abundance.
Statistical analysesWe quantified the correlation between the three estimatesof genetic diversity (He, Div, and PPL) and the mean life-time expectancy LTE, and the correlation of these four var-iables with (1) population size N and dispersal rate(number of immigrants and emigrants), (2) surrogates ofpopulation size (patch area, microclimatic conditions,nectar and host plant abundance), and (3) surrogate ofdispersal rate (structural connectivity). As there was no apriori reason to believe that these would be linear correla-tions, rank (Spearman), instead of linear (Pearson), corre-lation coefficients were used throughout this study. Nocorrection procedure for multiple testing has been usedbecause we did not base our conclusions on a sharp inter-pretation of the significance level of each correlation, but
on the general trend emerging from redundant correla-tions, as already mentioned.
However, we designed a bootstrap procedure [49] toassess how the most important relation between these var-iables, the one between genetic diversity (represented hereby He) and LTE, was sensitive to the error present in theestimates of these variables. This procedure had a doubleaim: (1) to take into account the unequal precision ofeach population-specific estimate of average He and LTE,and (2) to test the robustness of the genetic data. Concern-ing He, a subset of the 30 loci was randomly selected andthe mean computed for each population; subsets of 30loci to only one locus were considered. On the otherhand, LTE was computed for each population from ran-domly generated values of demographic parameters φt andBt using their respective variance-covariance matrices. TheSpearman's correlation coefficient r between populationHe-LTE means was then computed. This procedure wasrepeated 1000 times to construct the distribution of r. Themean r was reported as covariation measure between thetwo parameters studied. Statistical significance of this cor-relation (showing that it significantly differed from zero),however, was based on the probability of obtaining theobserved proportion s (in the 1000 simulations) of signif-icant correlations by chance. The distribution of s underthe null hypothesis of no correlation was also obtained byresampling, with observed values for the site populationsrandomly shuffled, breaking any existing correlation. Thisshuffle procedure was repeated another 1000 times foreach of the 1000 simulations and the p-value for the testwas computed as the proportion of random associationswith a proportion s of significant correlations greater thanor equal to the observed s.
Authors' contributionsSV and MB designed the research; SV performed theresearch; SV and NS analysed the data; SV, NS, and MBwrote the paper. All authors contributed equally to thiswork.
AcknowledgementsWe thank the Ministère de la Région Wallonne for capture licences, nature conservation associations for granting site access, L Dhondt and A Snirc for help with lab work, and three anonymous reviewers for improving the man-uscript through their constructive comments. SV and MB acknowledge grant BELSPO-PADDII EV10/26A and SV acknowledges grant FRFC 2.4595.07 for support. SV is postdoctoral researcher and NS research asso-ciate of the Fund for Scientific Research – FNRS. This is publication BRC125 of the Biodiversity Research Centre at Université catholique de Louvain.
References1. Fahrig L: Effects of habitat fragmentation on biodiversity. Ann
Rev Ecol Evol Syst 2003, 34:487-515.2. Frankham R: Genetics and extinction. Biol Conserv 2005,
126:131-140.3. Lande R: Genetics and demography in biological conserva-
tion. Science 1988, 241:1455-1460.
S e Ajd jk
k
k j
=−
≠∑
Page 10 of 11(page number not for citation purposes)
BMC Biology 2008, 6:46 http://www.biomedcentral.com/1741-7007/6/46
4. Madsen T, Stille B, Shine R: Inbreeding depression in an isolatedpopulation of adders Vipera berus. Biol Conserv 1996,75:113-118.
5. Saccheri I, Kuussaari M, Kankare M, Vikman P, Fortelius W, Hanski I:Inbreeding and extinction in a butterfly metapopulation.Nature 1998, 392:491-494.
6. O'Grady JJ, Brook BW, Reed DH, Ballou JD, Tonkyn DW, FrankhamR: Realistic levels of inbreeding depression strongly affectextinction risk in wild populations. Biol Conserv 2006, 133:42-51.
7. Crooks KR, Sanjayan M: Connectivity Conservation Cambridge: Cam-bridge University Press; 2006.
8. Asher J, Warren MS, Fox R, Harding P, Jeffcoate G, Jeffcoate S: TheMillennium Atlas of Butterflies in Britain and Ireland New York: OxfordUniversity Press; 2001.
9. Bink FA: Ecologische Atlas van de Dagvlinders van Noordwest-EuropaHaarlem: Schuyt & Co; 1992.
10. Van Swaay CAM: The importance of calcareous grasslands forbutterflies in Europe. Biol Conserv 2002, 104:315-318.
11. Fichefet V, Barbier Y, Baugnée J-Y, Dufrêne M, Goffart P, Maes D, VanDyck H: Papillons de jour de Wallonie (1985–2007) Gembloux: Publica-tion du Groupe de Travail Papillons de jour Lycaena et du Centre deRecherche de la Nature, des Forêts et du Bois (MRW-DGRNE), SérieFaune-Flore-Habitats no 4; 2008.
12. WallisDeVries MF, Poschlod P, Willems JH: Challenges for theconservation of calcareous grasslands in northwesternEurope: integrating the requirements of flora and fauna. BiolConserv 2002, 104:265-273.
13. Balmer O, Erhardt A: Consequences of succession on exten-sively grazed grasslands for central European butterfly com-munities: Rethinking conservation practices. Conserv Biol 2000,14:746-757.
14. Poschlod P, WallisDeVries MF: The historical and socioeco-nomic perspective of calcareous grasslands – lessons fromthe distant and recent past. Biol Conserv 2002, 104:361-376.
15. Polus E, Vandewoestijne S, Choutt J, Baguette M: Tracking theeffects of one century of habitat loss and fragmentation oncalcareous grassland butterfly communities. Biodivers Conserv2007, 16:3423-3436.
16. Wenzel M, Schmitt T, Weitzel M, Seitz A: The severe decline ofbutterflies on western German calcareous grasslands duringthe last 30 years: A conservation problem. Biol Conserv 2006,128:542-552.
17. Thomas CD, Bulman CR, Wilson RJ: Where within a geographicrange do species survive best? A matter of scale. Insect ConservDiversity 2008, 1:2-8.
18. Thornhill R, Alcock J: The Evolution of Insect Mating Systems Cambridge,Massachusetts: Harvard University Press; 1983.
19. Hanski I: Metapopulation Ecology Oxford: Oxford University Press;1999.
20. Shaffer ML: Minimum population sizes for species conserva-tion. BioScience 1981, 31:131-134.
21. Hanski I, Gilpin ME: Metapopulation dynamics: brief history andconceptual domain. Biol J Linn Soc 1991, 42:3-16.
22. Frankham R: Inbreeding and extinction: island populations.Conserv Biol 1998, 12:665-675.
23. Nève G, Barascud B, Descimon H, Baguette M: Gene flow rise withhabitat fragmentation in the bog fritillary butterfly (Lepidop-tera: Nymphalidae). BMC Evol Biol 2008, 8:84.
24. Fjerdingstad EJ, Schtickzelle N, Manhes P, Gutierrez A, Clobert J:Evolution of dispersal and life history strategies – Tetrahy-mena ciliates. BMC Evol Biol 2007, 7:133.
25. Slate J, Pemberton J: Does reduced heterozygosity depresssperm quality in wild rabbits (Oryctolagus cuniculus)? Curr Biol2006, 16:R790-R791.
26. Schmitt T, Seitz A: Influence of habitat fragmentation on thegenetic structure of Polyommatus coridon (Lepidoptera:Lycaenidae): implications for conservation. Biol Conserv 2002,107:291-297.
27. Slate J, Kruuk LEB, Marshall TC, Pemberton JM, Clutton-Brock TH:Inbreeding depression influences lifetime breeding successin a wild population of red deer (Cervus elaphus). Proc R SocLond B Bio 2000, 267:1657-1662.
28. Charpentier M, Setchell JM, Prugnolle F, Knapp LA, Wickings EJ, Pei-gnot P, Hossaert-McKey M: Genetic diversity and reproductivesuccess in mandrills (Mandrillus sphinx). Proc Natl Acad Sci USA2005, 102:16723-16728.
29. Ortego J, Aparicio JM, Cordero PJ, Calabuig G: Individual geneticdiversity correlates with the size and spatial isolation of natalcolonies in a bird metapopulation. Proc R Soc Lond B 2008,275:2039-2047.
30. Krauss J, Schmitt T, Seitz A, Steffan-Dewenter I, Tscharntke T:Effects of habitat fragmentation on the genetic structure ofthe monophagous butterfly Polyommatus coridon along itsnorthern range margin. Mol Ecol 2004, 13:311-320.
31. Binzenhofer B, Biedermann R, Settele J, Schroder B: Connectivitycompensates for low habitat quality and small patch size inthe butterfly Cupido minimus. Ecol Res 2008, 23:259-269.
32. Cassel-Lundhagen A, Sjogren-Gulve P: Limited dispersal by therare scarce heath butterfly – potential consequences forpopulation persistence. J Insect Conserv 2007, 11:113-121.
33. Fischer J, Lindenmayer DB: Landscape modification and habitatfragmentation: a synthesis. Global Ecol Biogeogr 2007, 16:265-280.
34. Bender DJ, Contreras TA, Fahrig L: Habitat loss and populationdecline: A meta-analysis of the patch size effect. Ecology 1998,79:517-533.
35. Schtickzelle N, Baguette M: Behavioural responses to habitatpatch boundaries restrict dispersal and generate emigra-tion-patch area relationships in fragmented landscapes. JAnim Ecol 2003, 72:533-545.
36. Schtickzelle N, Mennechez G, Baguette M: Dispersal depressionwith habitat fragmentation in the bog fritillary butterfly.Ecology 2006, 87:1057-1065.
37. Baguette M, Van Dyck H: Landscape connectivity and animalbehavior: functional grain as a key determinant for dispersal.Land Ecol 2007, 22:1117-1129.
38. Schtickzelle N, Joiris A, Van Dyck H, Baguette M: Quantitativeanalysis of changes in movement behaviour within and out-side habitat in a specialist butterfly. BMC Evol Biol 2007, 7:4.
39. Burnham KP, Anderson DR: Model Selection and Multimodel Inference:A Practical Information-Theoretic Approach 2nd edition. New York:Springer-Verlag; 2002.
40. White GC, Burnham KP: Program MARK: survival estimationfrom populations of marked animals. Bird Study 1999, 46(Sup-plement):S120-S139.
41. Schtickzelle N, Le Boulengé E, Baguette M: Metapopulationdynamics of the bog fritillary butterfly: demographic proc-esses in a patchy population. Oikos 2002, 97:349-360.
42. Zietkiewicz E, Rafalski A, Labuda D: Genome fingerprinting bySimple Sequence Repeat (Ssr)-anchored polymerase chain-reaction amplification. Genomics 1994, 20:176-183.
43. Vandewoestijne S, Baguette M: The genetic structure of endan-gered populations in the Cranberry Fritillary butterfly, Bolo-ria aquilonaris (Lepidoptera, Nymphalidae): RAPDs vsallozymes. Heredity 2002, 89:439-445.
44. Lynch M, Milligan BG: Analysis of population genetic-structurewith RAPD markers. Mol Ecol 1994, 3:91-99.
45. Schneider S, Roessli D, Excoffier L: Arlequin ver. 2.000: A software forpopulation genetic data analysis Geneva, Switzerland: Genetic andBiometry Laboratory, University of Geneva; 2000.
46. Moilanen A, Nieminen M: Simple connectivity measures in spa-tial ecology. Ecology 2002, 83:1131-1145.
47. Butaye J, Honnay O, Adriaens D, Delescaille LM, Hermy M: Phytoso-ciology and phytogeography of the calcareous grasslands onDevonian limestone in Southwest Belgium. Belg J Bot 2005,138:24-38.
48. Ellenberg H: Zeigerwerte der Gefässpflanzen Mitteleuropas. Scripta Geo-botanica IX .
49. Roff DA: Introduction to Computer-intensive Methods of Data Analysis inBiology Cambridge: Cambridge University Press; 2006.
Page 11 of 11(page number not for citation purposes)