Embed Size (px)
Citation preview

BioMed CentralBMC Plant Biology
ss
Open AcceResearch articleGene expression profiling in susceptible interaction of grapevine with its fungal pathogen Eutypa lata: Extending MapMan ontology for grapevineAna Rotter*1, Céline Camps2, Marc Lohse3, Christian Kappel2, Stefania Pilati4, Matjaž Hren1, Mark Stitt3, Pierre Coutos-Thévenot5, Claudio Moser4, Björn Usadel*3, Serge Delrot2 and Kristina Gruden1Address: 1National Institute of Biology, Department of Biotechnology and Systems Biology, Večna pot 111, 1000 Ljubljana, Slovenia, 2Institute of Vine and Wine Sciences (ISVV), University Victor Segalen Bordeaux II, Unite Mixte de Recherches Ecophysiology and Grape Functional Genomics, INRA, 71 Avenue Edouard, Bourlaux 33883, BP 81, Villenave d'Ornon, France, 3Max Planck Institute of Molecular Plant Physiology Am Mühlenberg 1, 14476 Golm, Germany, 4Department of Genetics and Molecular Biology, IASMA Research Center, Via E. Mach 1, 38010 S, Michele a/Adige (TN), Italy and 5Laboratoire de Physiologie et Biochimie Végétales, UMR CNRS 6161, Université de Poitiers, Bâtiment Botanique, 40 Avenue du Recteur Pineau, 86022 Poitiers Cedex, France
Email: Ana Rotter* - [email protected]; Céline Camps - [email protected]; Marc Lohse - [email protected]; Christian Kappel - [email protected]; Stefania Pilati - [email protected]; Matjaž Hren - [email protected]; Mark Stitt - [email protected]; Pierre Coutos-Thévenot - [email protected]; Claudio Moser - [email protected]; Björn Usadel* - [email protected]; Serge Delrot - [email protected]; Kristina Gruden - [email protected]
* Corresponding authors
AbstractBackground: Whole genome transcriptomics analysis is a very powerful approach because it givesan overview of the activity of genes in certain cells or tissue types. However, biologicalinterpretation of such results can be rather tedious. MapMan is a software tool that displays largedatasets (e.g. gene expression data) onto diagrams of metabolic pathways or other processes andthus enables easier interpretation of results. The grapevine (Vitis vinifera) genome sequence hasrecently become available bringing a new dimension into associated research. Two microarrayplatforms were designed based on the TIGR Gene Index database and used in several physiologicalstudies.
Results: To enable easy and effective visualization of those and further experiments, annotation ofVitis vinifera Gene Index (VvGI version 5) to MapMan ontology was set up. Due to specificities ofgrape physiology, we have created new pictorial representations focusing on three selectedpathways: carotenoid pathway, terpenoid pathway and phenylpropanoid pathway, the products ofthese pathways being important for wine aroma, flavour and colour, as well as plant defence againstpathogens. This new tool was validated on Affymetrix microarrays data obtained during berryripening and it allowed the discovery of new aspects in process regulation. We here also presentresults on transcriptional profiling of grape plantlets after exposal to the fungal pathogen Eutypa latausing Operon microarrays including visualization of results with MapMan. The data show that thegenes induced in infected plants, encode pathogenesis related proteins and enzymes of theflavonoid metabolism, which are well known as being responsive to fungal infection.
Published: 5 August 2009
BMC Plant Biology 2009, 9:104 doi:10.1186/1471-2229-9-104
Received: 9 April 2009Accepted: 5 August 2009
This article is available from: http://www.biomedcentral.com/1471-2229/9/104
© 2009 Rotter et al; licensee BioMed Central Ltd. This is an Open Access article distributed under the terms of the Creative Commons Attribution License (http://creativecommons.org/licenses/by/2.0), which permits unrestricted use, distribution, and reproduction in any medium, provided the original work is properly cited.
Page 1 of 14(page number not for citation purposes)

BMC Plant Biology 2009, 9:104 http://www.biomedcentral.com/1471-2229/9/104
Conclusion: The extension of MapMan ontology to grapevine together with the newlyconstructed pictorial representations for carotenoid, terpenoid and phenylpropanoid metabolismprovide an alternative approach to the analysis of grapevine gene expression experimentsperformed with Affymetrix or Operon microarrays. MapMan was first validated on an alreadypublished dataset and later used to obtain an overview of transcriptional changes in a susceptiblegrapevine – Eutypa lata interaction at the time of symptoms development, where we showed thatthe responsive genes belong to families known to be involved in the plant defence towards fungalinfection (PR-proteins, enzymes of the phenylpropanoid pathway).
BackgroundSeveral tools are now available to describe plants meta-bolic pathways (see [1] for a recent review on Reactome),but they are usually restricted to specific parts of themetabolism. However, it is often interesting to get a quickand complete overview of the whole data set, especially atthe start of the analysis. Furthermore, many tools are onlyoffered as online-tools, thus the user has to rely on theavailability of a fast internet connection at the time of theanalysis. To overcome these problems, MapMan [2] intro-duced an ontology which removes redundancies, and dis-plays metabolic maps including many processes at once,thus immediately highlighting important pathways. Lateron, statistical tools [3] were added to this software pack-age to get an unbiased overview of changed pathways orprocesses. The ontology was originally built for the modelspecies Arabidopsis thaliana, and furthermore extended tocover also maize [4], Medicago [5], tomato [6] and potato[7]. Briefly, MapMan ontology consists of a set of 34 hier-archical BINs (Table 1), constructed around centralmetabolism, as well as other categories (e.g. stress, celletc.). Original BIN assignments were based on publiclyavailable gene annotation within TIGR (The Institute forGenomic Research), adopting a process alternatingbetween automatic recruitment and manual correction[2]. BINs can be furthermore split into hundreds of sub-BINs.
The grapevine (Vitis vinifera) genome sequence hasrecently become available [8,9] and approximately30,000 genes were predicted. An accurate gene predictionand gene annotation is however still lacking for the wholesequence. Using strict rules for homology definition,around half of the predicted genes in the grape genomeare specific for grape [9], leading to the conclusion thatsome of the significant metabolic pathways for grapemight not be easily inferred by homology transfer. Wehave therefore chosen to characterize a few pathways,important for wine production and quality, in a greaterdetail. To this aim we constructed new pictorial represen-tations and, where necessary, rearranged BIN representa-tions in order to get a better overview onphenylpropanoid, terpenoid and carotenoid biosynthesis.Grape secondary metabolites, particularly polyphenols
and terpenoids, have a strong influence on wine qualitysince they determine colour, bitterness, astringency andaroma [10,11]. They also have important pharmacologi-cal effects acting as health-promoting compounds (for areview see [12]).
Most phenolics derive from the nonoxidative deamina-tion of the amino acid phenylalanine via phenylalanineammonia-lyase (PAL), and encompass a range of struc-tural classes such as lignins, phenolic acids, flavonoidsand stilbenes. A key branching point in this biosyntheticpathway is the condensation of 4-coumaroyl-CoA andmalonyl-CoA which can produce either trans-resveratrol(stilbene pathway), or tetrahydroxychalcone (flavonoidpathway) due to the action of stilbene synthase or chal-cone synthase, respectively. Grapevine flowers and fruitsare rich in flavonoids where they act as pollinator attract-ants and seed dispersers, UV-scavengers and are involvedin disease resistance [13]. In red grape, flavanols andanthocyanins are the most abundant flavonoid classes,the latter accumulating mostly in berry skin and theformer in seeds [14]. Stilbenes content increases in grape-vine in response to biotic and abiotic stress [15,16], butalso during berry ripening [17]. Resveratrol, the first stil-bene phytoalexin identified in grapevine [18] has alsobeen associated with the health benefits of red wine [19].Terpenoids are a very large and diverse class of metabo-lites synthesized starting from isopentenyl diphosphateand dimethylallyl diphosphate via the mevalonate or themevalonate-independent pathways. They play an impor-tant role in plant growth and development as well as inplant interaction with environment [20].
Véraison is a transitional phase of grape berry develop-ment, during which growth declines and berries start tochange colour and soften. In a previously conducted study[21], three time points were selected in order to investi-gate fruit ripening. Time-point A (TP A, two weeks beforevéraison) was characterized by small green berries stillaccumulating organic acids, TP B (3 days before véraison)was characterized by berries in the green hard state withmaximum acidic content and TP C (three weeks aftervéraison) by ripening berries growing fast, colouring, sof-tening and accumulating sugars. These time points corre-
Page 2 of 14(page number not for citation purposes)

BMC Plant Biology 2009, 9:104 http://www.biomedcentral.com/1471-2229/9/104
spond to the developmental stages E-L 33, E-L 34 and E-L36 according to the modified E-L system reported in [22].Due to the economic importance wine has, diseaseresearch on grapevine is very important. Although grape-vine fungal diseases have a major economical impact, andalthough they have been extensively described from aphysiological standpoint, still little is known about themolecular basis of grapevine response to fungi. Amongthe numerous diseases affecting grapevines, eutypiosis,caused by fungus Eutypa lata, is very damaging. It ispresent in all grape growing areas around the world andcauses important economic losses. After initial infection,a lag phase of several years is often observed before theappearance of symptoms whose intensity on a given plantmay vary with each year. However, infected plants diewithin a few years. There is no known resistant cultivar, no
efficient treatment and neither diagnostic tool availablefor this disease. Therefore a better insight into the grape-vine response to E. lata infection is required.
While the gene model based on the genome sequence hasstill not been released, a large grapevine transcript data-base is available, including 34,134 unique sequences(Vitis vinifera gene index release 5, VvGI) which were usedto construct several microarray platforms. The two mostcomprehensive ones are GeneChip®Vitis vinifera GenomeArray from Affymetrix which has been available since2005 and interrogates 14,496 transcripts and a ready toprint 70-mer Vitis vinifera (grape) AROS V1.0 Oligo Set(Operon, Qiagen) covering 14,562 transcripts. Both wereextensively exploited for genome-wide gene expressionanalyses [21,23-31]. In order to expand MapMan ontol-
Table 1: MapMan BIN structure and number of manual corrections made for each BIN
BIN BIN name No. of clones in the BIN No. of corrected clones % of corrected clones
1 photosynthesis 494 23 4.62 major CHO metabolism 165 8 4.83 minor CHO metabolism 162 13 84 glycolysis 123 9 7.35 fermentation 52 0 06 gluconeogenesis/glyoxylate cycle 22 2 97 oxidative pentose phosphate pathway 42 1 2.48 TCA cycle/org. acid transformations 123 8 6.59 mitochondrial electron transport/ATP synthesis 156 4 2.610 cell wall 595 4 0.711 lipid metabolism 495 27 5.912 nitrogen metabolism 59 4 6.813 amino acid metabolism 459 17 3.714 sulphur assimilation 15 0 015 metal handling 142 14 9.916 secondary metabolism 543 92 16.917 hormone metabolism 502 29 5.818 cofactor and vitamin synthesis 45 3 6.719 tetrapyrrole synthesis 56 14 2520 stress 948 456 48.121 redox 282 15 5.322 polyamine metabolism 18 0 023 nucleotide metabolism 147 6 4.124 biodegradation of xenobiotics 24 1 4.225 C1 metabolism 33 0 026 miscellaneous enzyme families 1219 69 5.727 RNA 2296 85 3.728 DNA 422 43 10.229 protein 3628 157 4.330 signalling 1157 81 731 cell 655 12 1.833 development 405 31 7.634 transport 951 32 3.4
35 35.1. not assigned. no ontology 3276 437 13.335.2. not assigned. unknown 15571 31 0.2
Σ 35246 1728 4.9
Page 3 of 14(page number not for citation purposes)

BMC Plant Biology 2009, 9:104 http://www.biomedcentral.com/1471-2229/9/104
ogy to grapevine we have annotated the tentative genesequences from grape gene index (Vitis vinifera gene index,VvGI) and have implemented them for use with Operonand Affymetrix microarrays experiments. Due to specifici-ties of the grape physiology, we have created new pictorialrepresentations of the grape mapping file focusing onthree selected pathways: carotenoid, terpenoid and phe-nylpropanoid. The visualization of differentiallyexpressed (DE) genes involved in berry development, firstpublished in [21] is discussed as an example of applica-tion to the Affymetrix microarray platform. We have addi-tionally performed the first analysis of processesunderlying the pathogenesis of Eutypa lata – grapevineinteraction using DNA microarrays in combination withthe newly developed visualisation tool.
Results and discussionAnnotation of grapevine Gene IndexAnnotation of grapevine Gene Index (VvGI version 5)using the MapMan ontology was performed by includinginformation on grapevine genome and plant proteindomains, the latter found in SwissProt/Uniprot plant pro-teins PPAP [32], the Conserved Domain Database CDD[33], Clusters of orthologous groups KOG [34] and Inter-Pro [35]. Manual annotation was performed by differentcontributors for the BINs they have most expertise for. Amanual correction usually consisted of blasting the appro-priate tentative contig (TC) sequence, followed by classifi-cation using expert knowledge and a literature search.Altogether, 1728 manual corrections of automated anno-tation were made using this approach (Table 1). Becausemany genes from VvGI are expected to be grape-specific,special emphasis was put on genes present on either arrayand classified into BIN 35.2, where typically genes with noor only weak similarity to Arabidopsis and other plantsincluded in MapMan are found. We were able to success-fully annotate 13 TCs from this BIN. Some BINs, usuallythe smaller ones and the ones where a weaker emphasiswas assigned, had a lower number/percentage of clonesmanually checked and corrected when necessary. OtherBINs (e.g. BIN 16), which served as the basis of construct-ing new pictorial representations for phenylpropanoid,carotenoid and terpenoid metabolism were more thor-oughly checked. A special case is BIN 20, where half of itwas manually corrected due to recent changes in its anno-tation [7]. 34 TCs from the grape Gene Index were foundto have high similarity to grapevine pathogen sequences,for example Ralstonia solanacearum or do not belong toVitis vinifera and thus they were assigned to BIN 35.2 (notassigned. unknown). 24 out of these 34 TCs can be foundin the more recent grape Gene Index (VVGI version 6).
To enable visualisation of results of transcriptomics exper-iments two final mapping files were created, one to beused with Operon microarrays and the other to be used
with Affymetrix microarrays. Both final mapping files thusconsist of the following data: BINcode, BINname, probeidentifier from Operon/Affymetrix microarrays, respec-tively and gene description from grape gene index (withgrape gene index and the protein domains informationincluded). Due to specificities of grape physiology, wehave created new pictorial representations of the grapemapping file focusing on three selected pathways: carote-noid pathway, terpenoid pathway and phenylpropanoidpathway.
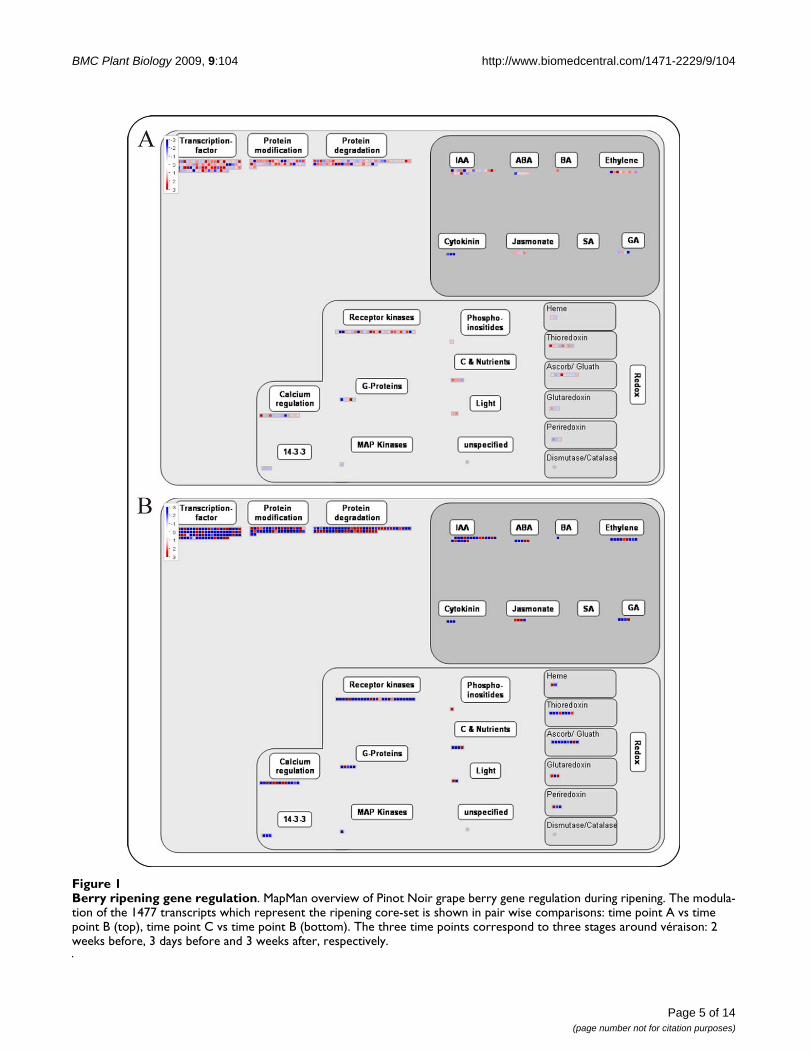
Validation of mapping file for Affymetrix platformThe mapping file built for the analysis of data obtainedwith the Affymetrix GeneChip was validated on a datasetof genes differentially expressed during berry ripening,reported in [21]. This study analysed two pre-véraison (A,B) and one post-véraison (C) stages during Pinot Noirgrape berry development along three years, identifying aset of 1477 genes conservatively modulated. They weremanually annotated using the Gene Ontology vocabularyand grouped into biological process categories. Here, wehave annotated the 1477 genes with the MapMan map-ping file. Two processes important for berry developmenthave been chosen for visualization in Figure 1 and 2: anoverview of ripening regulation and the phenylpropanoidpathway. The representation of berry development regula-tion provided by MapMan immediately highlights thelarge number of genes involved in the berry developmen-tal control (226), including 95 genes involved in tran-scription regulation, 49 in the hormonal metabolism and88 in signalling and protein modification (Figure 1). Aclear trend of prevalent gene induction from stage A to Band prevalent repression from stage B to C is evident.These observations are in agreement with the resultsreported in [21], in which these three classes (transcrip-tion factors, hormone metabolism and signal transduc-tion) included respectively 125, 65 and 92 genes. Thehigher numbers are probably due to a wider functionalclassification and to annotation redundancy of the pub-lished analysis. The general trend of these classes is thesame as reported in Figure 5 of [21], in which it is evidentthat all of them are prevalently induced from stage A to Band then mostly repressed. The main advantage of usingMapMan is no doubt the ease and speed of the analysis.
The visualization of the genes distribution among thephytohormones confirms the large involvement of geneslinked to auxins and ethylene and fewer genes involved inthe abscisic acid, brassinosteroid and gibberellic acidpathways as previously reported [36-38], and as showedin Table 1 of [21].
Finally, the two categories of receptor kinases and calciumregulation (Figure 1), which were not investigated indetail in the published analysis [21], appear to be quite
Page 4 of 14(page number not for citation purposes)
BMC Plant Biology 2009, 9:104 http://www.biomedcentral.com/1471-2229/9/104
Page 5 of 14(page number not for citation purposes)
Berry ripening gene regulationFigure 1Berry ripening gene regulation. MapMan overview of Pinot Noir grape berry gene regulation during ripening. The modula-tion of the 1477 transcripts which represent the ripening core-set is shown in pair wise comparisons: time point A vs time point B (top), time point C vs time point B (bottom). The three time points correspond to three stages around véraison: 2 weeks before, 3 days before and 3 weeks after, respectively.

BMC Plant Biology 2009, 9:104 http://www.biomedcentral.com/1471-2229/9/104
highly represented according to the MapMan annotationand, in agreement with [25]. Nonetheless, the two catego-ries of light signalling and redox control, on which thepublished analysis had focused (see Table 1 and Figure 7in [25]), include fewer transcripts and gene families,respectively.
This comparison shows that MapMan is a reliable annota-tion and data display tool which is easy to use and partic-ularly efficient for representing genome-wide geneexpression experiments. Obviously, when the interest isfocused on a particular pathway or metabolism, furtherinvestigation is needed.
The pictorial representation of the general phenylpropa-noid pathway is very effective, as it displays the informa-
tion about the members of the gene families, the relativegene expression and the name of the enzyme in a singleimage. It is interesting to observe that before véraison thepathway is not modulated, with the exception of the fla-vonol synthase gene which is responsible for the flavonolsbiosynthesis. On the contrary during ripening, specificenzymes are strongly induced: phenylalanine ammonial-yase (PAL), at the beginning of the pathway; stilbene syn-thase (SS), responsible for resveratrol accumulation;chalcone isomerase (CHI) and flavanone-3 hydroxylase(F3H), at the beginning of flavonoid synthesis; UDPglu-cose:flavonoid 3-O-glucosyltransferase (F3OGT), catalys-ing the final steps of colour accumulation. The pictureclearly shows that, at the same time, the genes encodingthe enzymes leucoanthocyanidin reductase (LAR) andanthocyanidin reductase (ANR) are repressed. Altogether
Berry ripening phenylpropanoid pathwayFigure 2Berry ripening phenylpropanoid pathway. MapMan visualization of the phenylpropanoid pathway modulation during Pinot Noir grape berry ripening: time point A vs time point B (A), time point C vs time point B (B).
Page 6 of 14(page number not for citation purposes)
BMC Plant Biology 2009, 9:104 http://www.biomedcentral.com/1471-2229/9/104
these results suggest that in the ripening process thebranches of the phenylpropanoid pathway which lead tothe accumulation of stilbenes and anthocyanins arefavoured with respect to those which lead to tannins pro-duction.
Overview of transcriptional changes in grapevine response to infection with Eutypa lata20 Cabernet Sauvignon plantlets were experimentallyinfected with NE85-1 E. lata strain in three independentseries. Seven weeks after infection, the plantlets with con-firmed eutypiosis and healthy plantlets were collected forthe microarray hybridisations each in two technical repli-cates. The symptoms consisted of a clear necrosis appear-ing few mm above the infected zone (Figure 3C).Symptoms sometimes extended beyond this zone, induc-ing leaf yellowing and necrosis (Figure 3A). Similar symp-toms were obtained after infection of various grapevinevarieties with either E. lata mycelium (symptomsobserved after 6 weeks) or culture filtrate (symptomsobserved after 4 weeks) [39].
Altogether 312 differentially expressed (DE) genes wereidentified using strict statistical testing (Bonferroniadjusted p < 0.05, see Additional file 1: Differentiallyexpressed genes in Eutypa lata experiment). We have how-ever used less stringent statistical testing to get an pictorialoverview of metabolic and signal processes involved usingthe expanded MapMan tool (non-adjusted p < 0.01; 767differentially expressed genes). DE genes were mappedinto 29 out of 34 BINs represented in MapMan and theones most significantly altered are shown in Table 2. Inter-estingly, except few individual enzymes (invertaseTC67908, beta-galactosidase TC53602 and GDSL-motiflipase TC59023) that were significantly down regulated,all pathways represented by DE genes were found to beup-regulated. However, 302 DE genes (39%) did not havea reliable annotation and were not assigned to any path-way/process (BIN 35). Observed changes in expressionwere however relatively small as was the percentage of DEgenes obtained. One has to note that expression changeswere monitored late after infection (7 weeks after inocula-tion). When studying response of grapevine to powderymildew over time, the strongest response was observed upto 24 h post inoculation, thus a stronger response couldalso be expected in our experimental system at shortertimes post inoculation [28].
Stress related responses in E. lata infected plantsIn Figure 4A we can see that changes in expression ofgenes involved in cellular responses clearly indicate thatthe only genes induced belong to the category of bioticstress. The exceptions are the two genes classified to devel-opment corresponding to legumins, a gene family that has
been frequently mentioned as up-regulated by bioticstress [40]. This is more specifically shown in Figure 4Bshowing biotic stress related genes which 107 out of the312 strictly defined DE genes are annotated to. Thestrongly regulated biotic stress related genes include sev-eral PR-proteins (endochitinase (TC60929), chitinase(Q7XB39), osmotin-like proteins (P93621), thaumatin(Q7XAU7), disease response protein (Q45W75), tumorrelated proteins (P93378)), three 1,3- -glucanases andseveral proteinase inhibitors. Early induction of genesencoding chitinases and 1,3- -glucanases is a typicalresponse of plants towards fungal pathogens. In the inter-action between Cladosporium fulvum and tomato, resist-ance against the fungus correlates with early induction oftranscription of genes encoding apoplastic chitinase and1,3- -glucanase and the accumulation of these proteins ininoculated tomato leaves [41]. It is additionally consid-ered that genes encoding chitinases or -1,3-glucanases arethe most attractive candidates for the genetic manipula-tion approach to increase anti-fungal tolerance in grape-vine [42]. Also strong induction of polygalacturonaseinhibiting proteins (PGIPs, TC69081 CF604851TC69081) was observed. In plant tissues, the activity ofpathogen's PGs is counteracted by PGIPs, leucine-richrepeat proteins (LRR) located in the cell wall. A role forPGIPs in plant defence has been demonstrated by show-ing that transgenic Arabidopsis plants over-expressingPGIPs exhibit enhanced resistance to Botrytis cinerea [43].
Induction of phenylpropanoid pathway in eutypiosisSecondary metabolism was also strongly induced afterinfection of grapevine by E. lata (Figure 5). Phenylalanineammonia-lyase, PAL (P45735 and P45726), the firstenzyme of the pathway, was up-regulated 1.5 to 1.7 fold.Likewise, chalcone synthase (Q8W3P6, O80407), chal-cone isomerase (P51117), dihydroflavonol 4-reductase,DFR (P93799), and anthocyanidin reductase, ANR(Q7PCC4) which control the pathways leading to fla-vonols, tannins, and anthocyanins were up-regulated.Also the induction of secondary metabolites was shown tobe associated with defence and pathogenesis related proc-esses [44].
However, these results are not in complete agreementwith those obtained by treating grapevine cell suspensioncultures with the Eutypa pathogenic toxin, eutypine. Inthat experiment the authors observed a strong repressionof the UDP glucose-flavonoid glucosyltransferase gene(UFGT) and no significant modulation of the chalconesynthase and DFR encoding genes [45]. A possible expla-nation of the incongruity can be different experimentalsystems used: complex response to the pathogen is mostprobably going to be different in a population of relativelyuniform cells of a cell culture than in whole plants. In
Page 7 of 14(page number not for citation purposes)

BMC Plant Biology 2009, 9:104 http://www.biomedcentral.com/1471-2229/9/104
addition, the treatment with toxic compounds alonemight not be directly related to effects of the real infectionwith pathogen.
Similarly, no changes in activity of respiratory metabo-lism related genes were observed in infected plantlets,while a model bioassay using the yeast Saccharomyces cer-evisiae showed that the E. lata derived toxic metabolitesinhibited the respiratory metabolism, causing the reducedgrowth of the cells. One possible explanation is that sucha response of grapevine cells is masked due to the dilutionof infected area with surrounding healthy tissue. Theother explanation is that grapevine reacts differently fromyeast and that primary target of toxic compounds is notyet determined [46].
ConclusionBiological interpretation of data is the last step in micro-array-based analysis of transcriptome. Several tools thatenable easier interpretation of plant microarray data areavailable (e.g. [47,48]), but have usually been designedspecifically for Arabidopsis microarrays. On the other handMapMan has an advantage in its flexibility, as it can beextended easily to any plant species. Here, we present theextension of MapMan ontology to grapevine experiments,performed with Affymetrix or Operon microarrays. Vali-dation of Affymetrix mapping file was performed throughbiological re-interpretation of previously published grape-vine berries development gene expression data [21].Together with the construction of pictorial representa-tions for carotenoid, terpenoid and phenylpropanoidmetabolism, a deeper insight into changes in these meta-bolic activities was possible. Recently, grapevine genomehas become available [8,9] and complete gene annota-tions are yet to be done. Improved MapMan grapevineannotation will be an ongoing process through expertmanual editing and can be easily modified when thegenome annotations will become available as well aswhen new microarray platforms are constructed.
Data on molecular basis of grapevine defence against fun-gal pathogens are gradually becoming available. Powderymildew induces defence-oriented reprogramming of thetranscriptome in a susceptible but not in a resistant grape-vine [28]. In addition, possible innate resistance againstpathogenic fungi is being unravelled using transcriptionaland metabolic profiling of grape (Vitis vinifera L.) leaves[49]. Here we present an overview of the transcriptionalchanges in a susceptible grapevine – Eutypa lata interac-tion at the time of symptoms development. The resultsobtained through the use of the MapMan representationof metabolic pathways showed that the responsive genesbelong to families known to be involved in the plant
Eutypiosis symptomsFigure 3Eutypiosis symptoms. Eutypiosis symptoms on grapevine plantlets (A) as compared to control plants (B) 7 weeks after infection. Arrow indicates the point of infection to the infected cut stem which is shown in a close up on (C) to see typical necrosis caused by the disease.
Page 8 of 14(page number not for citation purposes)

BMC Plant Biology 2009, 9:104 http://www.biomedcentral.com/1471-2229/9/104
defence towards fungal infection (PR-proteins, enzymesof the phenylpropanoid pathway). Nevertheless, theobserved response was relatively weak. This is in line withthe hypothesis that defence compounds are induced inresistant as well in susceptible interaction, the main differ-ence being the speed and intensity of response. Also, itshould be stressed that not all responses to pathogens nec-essarily occur at transcriptional level, and that transla-tional and post-translational events may also be involved.
MethodsPlant materialCabernet Sauvignon in vitro plantlets were experimentallyinfected with the E. lata strain NE85-1 previously charac-terized as an aggressive strain [50]. Cabernet Sauvignon isa major variety used in various countries around the worldand is particularly sensitive to E. lata. Infection wasachieved by applying 10–15 days growing myceliumdirectly onto the cut surface of de-topped plantlets. Unin-fected de-topped plantlets were used as healthy controls.Samples were further on characterized according to symp-toms, re-isolation of the fungus, and formal identificationof re-isolated E. lata mycelium by PCR. Foliar symptomsof eutypiosis were evaluated for each plantlet seven weeksafter the experimental infection. 46 plantlets out of 60infected plantlets were showing eutypiosis symptoms. Thecontrol plantlets [40] did not show any symptoms. After
inspection of symptoms, each plantlet was frozen individ-ually in liquid nitrogen and stored at -80 ‰.
Confirmation of infectionE. lata was re-isolated from the first internode of eachplantlet. Internodes were surface-sterilized for 2 min with1% sodium hypochlorite, rinsed in sterile water threetimes for 5 min, cut into two pieces and put on sterile PDAmedium containing streptomycin (0.1 mg mL-1). Afterincubation in darkness for 10 days at 22 ‰ the plateswere visually assessed for the presence of typical E. latacottony white mycelium. DNA was extracted from myc-elium and E. lata was detected with PCR as described in[51]. The re-isolation and PCR detection of E. lata wasused to check whether the non inoculated control wasindeed axenic and to distinguish the experimentally inoc-ulated plantlets that became infected from those that didnot. Fungus was successfully re-isolated from all plantletsthat were characterised as symptomatic and its identityconfirmed by PCR. From the non-symptomatic plantletsno fungus could be isolated. The plantlets where infectionwas not successful were eliminated from further analysis.
Microarray hybridizationsRNA was isolated as described in [52]. To prepare fluores-cently (cy3/Cy5) labelled antisense RNA (aRNA) targets,total RNA was amplified and purified using the Amino
Table 2: Significantly altered processes
BIN Upregulated processes/protein families Number of DE genes Total number of genes in BIN p-value
10.5 cell wall.cell wall proteins 8 54 0.00610.5.3 cell wall.cell wall proteins.LRR 4 35 0.006
16 secondary metabolism 44 190 < 0.000116.1 secondary metabolism.isoprenoids 9 57 0.00816.2 secondary metabolism.phenylpropanoids 15 45 < 0.000116.2.1 secondary metabolism.phenylpropanoids.lignin biosynthesis 14 31 < 0.000116.8 secondary metabolism.flavonoids 18 55 < 0.000116.8.2 secondary metabolism.flavonoids.chalcones 5 9 0.000916.8.3 secondary metabolism.flavonoids.dihydroflavonols 6 16 0.004
17.5.1 hormone metabolism.ethylene.synthesis-degradation 6 32 0.01
20 stress 49 396 0.00120.1 stress.biotic 26 157 < 0.000120.1.7 stress.biotic.PR-proteins 20 64 < 0.0001
26.4 misc.beta 1,3 glucan hydrolases 3 19 0.005
27 RNA 57 970 0.0127.3 RNA.regulation of transcription 53 737 0.01
29.5.15 protein.degradation.inhibitors 4 14 0.007
Significantly altered processes or protein families according to changes in gene expression level in symptomatic compared to healthy grapevine leaf samples. The results show numbers of genes annotated to each process or family (indent) and corresponding p-values (as calculated by MapMan Wilcoxon rank sum test) according to the MapMan gene ontology.
Page 9 of 14(page number not for citation purposes)

BMC Plant Biology 2009, 9:104 http://www.biomedcentral.com/1471-2229/9/104
Page 10 of 14(page number not for citation purposes)
Eutypa infection responseFigure 4Eutypa infection response. Overview of cellular responses in grapevine leaves to Eutypa infection (A) and more specifically responses of genes related to biotic stress (B) as visualised by MapMan. Genes that were shown to be differentially expressed using p < 0.01 as a cutoff value were imported.

BMC Plant Biology 2009, 9:104 http://www.biomedcentral.com/1471-2229/9/104
Allyl MessageAmp II aRNA Amplification Kit (Ambion,USA) following the manufacturer's instructions.
Array-Ready Oligo Set™ for the Grape (Vitis vinifera)Genome Version 1.0 designed and synthesised by Operon(Qiagen) was used for microarrays fabrication. Probeswere spotted on epoxy mirror slides (Amersham, GEHealthCare) at the Montpellier Languedoc RoussillonGenopole, Institut de Génomique fonctionnelle. Justbefore hybridization, oligonucleotides were fixed on theslide by UV (254 nm) radiation of 120 mJ in a UV Strata-linker 2400-crosslinker (Stratagene). The slides were thenwashed twice in 0.2% SDS and positioned into thehybridization chambers. Approximately 4 g of Cy3 and 4g of Cy5-labelled aRNA was mixed, fragmented, volumebrought to 100 L with hybridization buffer and dena-tured.
Hybridization was then conduced 16 h at 37 ‰ withmedium agitation in the automated microarray stationHS4800 Mastersystem (Tecan). Slides were washedsequentially with 1× SSC/0.2% SDS for 20 min, twice with0.1× SSC/0.2% SDS for 10 min and finally with 0.1× SSCfor 10 min. Washed arrays were quickly dried with nitro-gen gas (2.7 × 10⁵ Pa) and immediately scanned withGenepix 4000B fluorescence reader (Axon Instruments,Canada) using GenePix 4.0 image acquisition software.
Statistical analysis of microarray resultsSignals were extracted from microarray images using theMaia tool version 2.75 [53]. Median intensity gene expres-
sion data without background subtraction were normal-ized by a global lowess method followed by a print-tipmedian method with a modified version of the Goulpharscript version 1.1.2 [54]. Differentially expressed geneswere identified with the R/Bioconductor packageLimma[55] using linear models and by taking intoaccount technical and biological replicates.
Microarray data accession numberMicroarray data analyzed in this study have been depos-ited in the ArrayExpress database. The accession number isE-MEXP-2102 [56].
Classification of TIGR Gene Index using the MapMan ontologyVitis vinifera Gene Index sequences were downloadedfrom TIGR (VvGI version 5; 34,134 unique sequences).These were blasted (BLASTx, version 2.2.14) against Ara-bidopsis proteins release TAIR7 [57] under default set-tings. A RPS-blast against SwissProt/Uniprot plantproteins PPAP [32], the Conserved Domain DatabaseCDD [33], Clusters of orthologous groups KOG [34] andInterProScan [35] was also performed.
The results of all searches were compiled into one tableand using the Arabidopsis as well as RPS-Blast hits an ini-tial classification into the MapMan BINs was achieved.This was then checked manually based on the annotationsprovided by TIGR, as well as based on the results obtainedby the different similarity searches [7]. Furthermore sev-eral genes were annotated based on the expertise of the
Eutypa infection phenylpropanoid pathwayFigure 5Eutypa infection phenylpropanoid pathway. Changes in expression of genes involved in phenylpropanoid metabolism after E. lata infection.
Page 11 of 14(page number not for citation purposes)
BMC Plant Biology 2009, 9:104 http://www.biomedcentral.com/1471-2229/9/104
different contributors. The final mapping file has 35,246entries, of those 34,132 are unique and the others are rep-resented in two or more subBINs.
Grapevine specific BINs and subBINs organizationIn order to get pictorial representations for the selectedpathways (carotenoid, terpenoid and phenylpropanoid)BIN structures for the secondary metabolism had to befurther refined. The carotenoid biosynthesis pathway wasadopted from potato carotenoid pathway [58] with thehelp of already published MapMan representation forpotato [7]. The flavonoid biosynthesis pathway was con-structed based on [24,59] where grape gene names, play-ing a role in flavonoid biosynthesis were directly used forcreating our improved, grape-based flavonoid pathway.The existing pathway mapping file for terpenoid biosyn-thesis from the MapMan website [60] which includedonly the mevalonate pathway was modified in order toinclude the non-mevalonate pathway, too. Thus thepresent terpenoid mapping file includes both the meval-onate pathway and non-mevalonate pathways, which areessential for plant development [16]. Pictorial representa-tions for all three pathways can be uploaded from theMapMan website.
Linking the mapping file to Operon and Affymetrix microarraysIn order to make the mapping file useful for studiesinvolving grape microarray experiments, informationfrom two microarray platforms was used, the Array ReadyOligo Set Vitis vinifera (grape) AROS V1.0 Oligo Set(Operon, Qiagen) covering 14,562 transcripts and theGeneChip® Vitis vinifera Genome Array with 14,496probesets (Affymetrix). Sequences from both microarrayswere blasted against the grape gene index and grapevinegenome sequences using the default parameters (BLASTN[61]). Since the first hit from this blast was typically byorders of magnitude (as shown with the E value) betterthan the other hits, only the information from the first hitwas taken into account. Hits displaying less than 70%sequence identity were ignored. Subsequently all foundblast hits were aligned to the corresponding oligonucle-otide using the smith-waterman algorithm (as imple-mented in the "water" program of the EMBOSS package[62]), again discarding hits with more than 10% gapsand/or less than 70% sequence identity over the fulllength of the oligonucleotide sequence. The remaininghits were classified into MapMan BINs [63] using themanually curated mapping file for grapevine as a refer-ence. If all hits for one specific oligonucleotide probebelonged to the same BIN (or multiple BINs) these BINswere assigned to the oligonucleotide probe. In case of dis-agreeing hits the BIN code "35.3 not assigned. disagreeinghits" was assigned unless manual inspection suggested adifferent BIN. For each oligonucleotide that showed mul-
tiple hits, the corresponding gene identifiers of all foundhits were given in the description line in order not to losepotentially important information.
Berry development studyDetails on experimental setup, lab work and statisticalanalysis of microarray results are described in [21]. Briefly,50 berries of Vitis vinifera cv. Pinot Noir were randomlychosen from ten grape clusters harvested at the peak ofacidity, two weeks before and three weeks after in the2003, 2005 and 2006 seasons. Data representing individ-ual years (2003, 2005 and 2006) were analyzed inde-pendently in order to obtain one set of differentiallyexpressed genes for each season. Following stringent dataanalysis, a set of 1477 genes modulated during berry rip-ening was obtained. Genes were grouped into 17 func-tional categories based on GO 'biological process' termsannotation.
Authors' contributionsAR, BU, ML and MS constructed an initial automatedmapping file. CK and ML were involved in the mapping ofTCs to probe(sets). SP, CM, AR, MH, BU were involved inmanual annotation of TCs. CC, SD and PCT wereinvolved in design setup and analysis of Eutypa lata exper-iment. SP and CM were involved in validation grapevineMapMan for Affymterix microarrays. KG was involved inorganization of the work and writing of the manuscript.
Additional material
AcknowledgementsThis work was organised through COST action 858 and financed by the Slovenian Research Agency (Ref. Nos. 1000-05-310172, P4-0165), by the German Ministry of Research and Education (GABI-MAPMEN 0313112/0313110), the Fondo Unico of the Provincia Autonoma di Trento, post doc project "Profiles" (S.P.), and from the Advanced Biology Project funded by the Fondazione delle Casse di Risparmio di Trento e Rovereto. Céline Camps was supported by the Conseil Interprofessionnel du Vin de Bor-deaux (CIVB). We thank Pascal Lecomte for help in Eutypa infections.
References1. Tsesmetzis N, Couchman M, Higgins J, Smith A, Doonan JH, Seifert
GJ, Schmidt EE, Vastrik I, Birney E, Wu G, D'Eustachio P, Stein LD,Morris RJ, Bevan MW, Walsh SV: Arabidopsis Reactome: A
Additional file 1ID, VVGI5id, VVGI5annotation, UniqueOligo, logFC, AveExpr, t, P.value, adj.P.value, B. The data shows all 312 differentially expressed genes as found in the E. lata experiment: their microarray ID, VVGI5 ID and its annotation, unique oligo sequence, M and A values, p-value and Bonferroni-adjusted p-value, t-statistic and B-statistic.Click here for file[http://www.biomedcentral.com/content/supplementary/1471-2229-9-104-S1.txt]
Page 12 of 14(page number not for citation purposes)

BMC Plant Biology 2009, 9:104 http://www.biomedcentral.com/1471-2229/9/104
Foundation Knowledgebase for Plant Systems Biology. PlantCell 2008, 20(6):1426-1436.
2. Thimm O, Bläsing O, Gibon Y, Nagel A, Meyer S, Krüger P, Selbig J,Müller LA, Rhee SY, Stitt M: MAPMAN: a user-driven tool to dis-play genomics data sets onto diagrams of metabolic path-ways and other biological processes. Plant J 2004, 37:914-939.
3. Usadel B, Nagel A, Steinhauser D, Gibon Y, Blasing O, Redestig H,Sreenivasulu N, Krall L, Hannah M, Poree F, Fernie A, Stitt M: Page-Man: An interactive ontology tool to generate, display, andannotate overview graphs for profiling experiments. BMC Bio-informatics 2006, 7:535.
4. Doehlemann G, Wahl R, Horst RJ, Voll LM, Usadel B, Poree F, StittM, Pons-Kühnemann J, Sonnewald U, Kahmann R, Kämper J: Repro-gramming a maize plant: transcriptional and metabolicchanges induced by the fungal biotroph Ustilago maydis. PlantJ 2008, 56:181-195.
5. Tellström V, Usadel B, Thimm O, Stitt M, Küster H, Niehaus K: TheLipopolysaccharide of Sinorhizobium meliloti SuppressesDefense-Associated Gene Expression in Cell Cultures of theHost Plant Medicago truncatula. Plant Physiol 2007, 143:825-837.
6. Urbanczyk-Wochniak E, Usadel B, Thimm O, Nunes-Nesi A, CarrariF, Davy M, Bläsing O, Kowalczyk M, Weicht D, Polinceusz A, MeyerS, Stitt M, Fernie AR: Conversion of MapMan to allow the anal-ysis of transcript data from Solanaceous species: effects ofgenetic and environmental alterations in energy metabolismin the leaf. Plant Mol Biol 2006, 60:773-792.
7. Rotter A, Usadel B, Baebler v, Stitt M, Gruden K: Adaptation of theMapMan ontology to biotic stress responses: application insolanaceous species. Plant Methods :10+.
8. Jaillon O, Aury JM, Noel B, Policriti A, Clepet C, et al.: The grape-vine genome sequence suggests ancestral hexaploidizationin major angiosperm phyla. Nature 2007, 449:463-467.
9. Velasco R, Zharkikh A, Troggio M, Cartwright DA, Cestaro Aea: AHigh Quality Draft Consensus Sequence of the Genome of aHeterozygous Grapevine Variety. PLoS ONE 2007, 2(12):e1326.
10. Waterhouse AL: Wine phenolics. Ann N Y Acad Sci 2002,957:21-36.
11. Ribéreau-Gayon P, BDAL , Duburdieu D: Handbook of enology: Themicrobiology of wine and vinifications New York: John Wiley&Sons;2000.
12. Nassiri-Asl M, Hosseinzadeh H: Review of the pharmacologicaleffects of Vitis vinifera (Grape) and its bioactive compounds.Phytother Res 2009, 23:9999.
13. Winkel-Shirley B: Flavonoid Biosynthesis. A Colorful Model forGenetics, Biochemistry, Cell Biology, and Biotechnology.Plant Physiol 2001, 126(2):485-493.
14. Mattivi F, Zulian C, Nicolini G, Valenti L: Wine, Biodiversity,Technology, and Antioxidants. Ann N Y Acad Sci 2002,957:37-56.
15. Pryce RJ, Langcake P: alpha-Viniferin: an antifungal resveratroltrimer from grapevines. Phytochemistry 1977, 16:1452-1454.
16. Bavaresco L, Petegolli D, Cantu E, Fregoni M, Chiusa G, Trevisan M:Elicitation and accumulation of stilbene phytoalexins ingrapevine berries infected by Botrytis cinerea. Vitis 1997,36:77-83.
17. Gatto P, Vrhovsek U, Muth J, Segala C, Romualdi C, Fontana P,Pruefer D, Stefanini M, Moser C, Mattivi F, Velasco R: Ripening andGenotype Control Stilbene Accumulation in HealthyGrapes. Journal of Agricultural and Food Chemistry 2008,56(24):11773-11785.
18. Langcake P, Pryce RJ: Production of resveratrol by Vitis Viniferaand other members of Vitaceae as a response to infection orinjury. Physiol Mol Plant Pathol 1976, 9:77-86.
19. de la Lastra CA, Villegas I: Resveratrol as an antioxidant and pro-oxidant agent: mechanisms and clinical implications. BiochemSoc Trans :1156-1160.
20. Mahmoud SS, Croteau RB: Strategies for transgenic manipula-tion of monoterpene biosynthesis in plants. Trends Plant Sci2002, 7:366-373.
21. Pilati S, Perazzolli M, Malossini A, Cestaro A, Demattè L, Fontana P,Dal Ri A, Viola R, Velasco R, Moser C: Genome-wide transcrip-tional analysis of grapevine berry ripening reveals a set ofgenes similarly modulated during three seasons and theoccurrence of an oxidative burst at veraison. BMC Genomics2007, 8:428.
22. Coombe BG: Growth Stages of the Grapevine: Adoption of asystem for identifying grapevine growth stages. Aust J GrapeWine Res 1995, 1:104-110.
23. Tattersall EA, Grimplet J, DeLuc L, Wheatley MD, Vincent D,Osborne C, Ergül A, Lomen E, Blank RR, Schlauch KA, Cushman JC,Cramer GR: Transcript abundance profiles reveal larger andmore complex responses of grapevine to chilling comparedto osmotic and salinity stress. Funct Integr Genomics 2007,7:317-333.
24. Grimplet J, Deluc L, Tillett R, Wheatley M, Schlauch K, Cramer G,Cushman J: Tissue-specific mRNA expression profiling ingrape berry tissues. BMC Genomics 2007, 8:187.
25. Deluc L, Grimplet J, Wheatley M, Tillett R, Quilici D, Osborne C,Schooley D, Schlauch K, Cushman J, Cramer G: Transcriptomicand metabolite analyses of Cabernet Sauvignon grape berrydevelopment. BMC Genomics 2007, 8:429.
26. Espinoza C, Vega A, Medina C, Schlauch K, Cramer G, Arce-JohnsonP: Gene expression associated with compatible viral diseasesin grapevine cultivars. Funct Integr Genomics 2007, 7:95-110.
27. Mori K, Goto-Yamamoto N, Kitayama M, Hashizume K: Loss ofanthocyanins in red-wine grape under high temperature. JExp Bot 2007, 58(8):1935-1945.
28. Fung RW, Gonzalo M, Fekete C, Kovacs LG, He Y, Marsh E, McIntyreLM, Schachtman DP, Qiu W: Powdery Mildew Induces Defense-Oriented Reprogramming of the Transcriptome in a Suscep-tible But Not in a Resistant Grapevine. Plant Physiol 2008,146:236-249.
29. Lund ST, Peng FY, Nayar T, Reid KE, Schlosser J: Gene expressionanalyses in individual grape (Vitis vinifera L.) berries duringripening initiation reveal that pigmentation intensity is avalid indicator of developmental staging within the cluster.Plant Mol Biol 2008, 68:301-315.
30. Terrier N, Torregrosa L, Ageorges A, Vialet S, Verriès C, Cheynier V,Romieu C: Ectopic Expression of VvMybPA2 PromotesProanthocyanidin Biosynthesis in Grapevine and SuggestsAdditional Targets in the Pathway. Plant Physiol 2009,149(2):1028-1041.
31. Postharvest water loss induces marked changes in transcriptprofiling in skins of wine grape berries. Postharvest Biol Technol2009, 52(3):247-253.
32. The UniProtKB/Swiss-Prot knowledgebase and its PlantProteome Annotation Program. J Proteomics 2009,72(3):567-573. [Plant Proteomics]
33. Marchler-Bauer A, Anderson JB, Derbyshire MK, DeWeese-Scott C,Gonzales NR, Gwadz M, Hao L, He S, Hurwitz DI, Jackson JD, Ke Z,Krylov D, Lanczycki CJ, Liebert CA, Liu C, Lu F, Lu S, Marchler GH,Mullokandov M, Song JS, Thanki N, Yamashita RA, Yin JJ, Zhang D,Bryant SH: CDD: a conserved domain database for interactivedomain family analysis. Nucl Acids Res 2007,35(suppl1):D237-240.
34. Tatusov R, Fedorova N, Jackson J, Jacobs A, Kiryutin B, Koonin E, Kry-lov D, Mazumder R, Mekhedov S, Nikolskaya A, Rao BS, Smirnov S,Sverdlov A, Vasudevan S, Wolf Y, Yin J, Natale D: The COG data-base: an updated version includes eukaryotes. BMC Bioinfor-matics 2003, 4:41.
35. Zdobnov EM, Apweiler R: InterProScan – an integration plat-form for the signature-recognition methods in InterPro. Bio-informatics 2001, 17(9):847-848.
36. Coombe BG, Hale CR: The Hormone Content of RipeningGrape Berries and the Effects of Growth Substance Treat-ments. Plant Physiol 1973, 51(4):629-634.
37. Davies C, Boss PK, Robinson SP: Treatment of Grape Berries, aNonclimacteric Fruit with a Synthetic Auxin, Retards Ripen-ing and Alters the Expression of Developmentally RegulatedGenes. Plant Physiol 1997, 115(3):1155-1161.
38. Symons GM, Davies C, Shavrukov Y, Dry IB, Reid JB, Thomas MR:Grapes on Steroids. Brassinosteroids Are Involved in GrapeBerry Ripening. Plant Physiol 2006, 140:150-158.
39. Mauro MC, Vaillant V, Tey-Rulh P, Mathieu Y, Fallot J: In vitro Studyof the Relationship Between Vitis vinifera and Eutypa lata(Pers.: Fr.) Tul. I. Demonstration of Toxic CompoundsSecreted by the Fungus. Am J Enol Vitic 1988, 39(3):200-204.
40. Ferreira RB, Monteiro SARA, Freitas R, Santos CN, Chen Z, BatistaLM, Duarte JOAO, Borges A, Teixeira AR: The role of plantdefence proteins in fungal pathogenesis. Mol Plant Pathol:677-700.
Page 13 of 14(page number not for citation purposes)

BMC Plant Biology 2009, 9:104 http://www.biomedcentral.com/1471-2229/9/104
Publish with BioMed Central and every scientist can read your work free of charge
"BioMed Central will be the most significant development for disseminating the results of biomedical research in our lifetime."
Sir Paul Nurse, Cancer Research UK
Your research papers will be:
available free of charge to the entire biomedical community
peer reviewed and published immediately upon acceptance
cited in PubMed and archived on PubMed Central
yours — you keep the copyright
Submit your manuscript here:http://www.biomedcentral.com/info/publishing_adv.asp
BioMedcentral
41. Differential induction of chitinase and 1,3-[beta]-glucanasegene expression in tomato by Cladosporium fulvum and itsrace-specific elicitors. Physiol Mol Plant Pathol 1996,48(2):105-116.
42. Engineering grapevine for increased resistance to fungalpathogens without compromising wine stability. Trends Bio-technol 2004, 22(4):168-173.
43. Polygalacturonase-inhibiting protein (PGIP) in plantdefence: a structural view. Phytochemistry 2006, 67(6):528-533.
44. Abu-Nada Y: Temporal dynamics of pathogenesis-relatedmetabolites and their plausible pathways of induction inpotato leaves following inoculation with Phytophthorainfestans. Eur J Plant Pathol 2007, 118:375-391. (17)
45. Afifi M, El-Kereamy A, Legrand V, Chervin C, Monje MC, Nepveu F,P RJ: Control of anthocyanin biosynthesis pathway geneexpression by eutypine, a toxin from Eutypa lata, in grapecell tissue cultures. J Plant Physiol 2003, 160:971-975.
46. Kim JH, Mahoney N, Chan KL, Molyneux RJ, Campbell BC: Second-ary Metabolites of the Grapevine Pathogen Eutypa lataInhibit Mitochondrial Respiration, Based on a Model Bio-assay Using the Yeast Saccharomyces cerevisiae. Curr Microbiol2004, 49:282-287.
47. Tokimatsu T, Sakurai N, Suzuki H, Ohta H, Nishitani K, Koyama T,Umezawa T, Misawa N, Saito KDS: KaPPA-View. A Web-BasedAnalysis Tool for Integration of Transcript and MetaboliteData on Plant Metabolic Pathway Maps. Plant Physiol 2005,138:1289-1300.
48. Junker BH, Klukas C, Schreiber F: VANTED: A system foradvanced data analysis and visualization in the context ofbiological networks. BMC Bioinformatics 2006, 7:109.
49. Figueiredo A, Fortes AM, Ferreira S, Sebastiana M, Choi YH, Sousa L,Acioli-Santos B, Pessoa F, Verpoorte R, Pais MS: Transcriptionaland metabolic profiling of grape (Vitis vinifera L.) leavesunravel possible innate resistance against pathogenic fungi. JExp Bot 2008, 59(12):3371-3381.
50. Peros JP, Berger G: Diversity within natural progenies of thegrapevine dieback fungus Eutypa lata. Curr Genet 1999,36:301-309.
51. Lardner R, Stummer BE, Sosnowski MR, Scott ES: Molecular iden-tification and detection of Eutypa lata in grapevine. Mycol Res2005, 109(07):799-808.
52. Reid K, Olsson N, Schlosser J, Peng F, Lund S: An optimized grape-vine RNA isolation procedure and statistical determinationof reference genes for real-time RT-PCR during berry devel-opment. BMC Plant Biol 2006, 6:27.
53. Novikov E, Barillot E: Software package for automatic microar-ray image analysis (MAIA). Bioinformatics 2007, 23(5):639-640.
54. Lemoine S, Combes F, Servant N, Le Crom S: Goulphar: rapidaccess and expertise for standard two-color microarray nor-malization methods. BMC Bioinformatics 2006, 7:467.
55. Smyth GK: Linear models and empirical Bayes methods forassessing differential expression in microarray experiments.Stat Appl Genet Mol Biol 2004, 3:. Article 3
56. ArrayExpress database [http://www.ebi.ac.uk/microarray-as/ae/]57. TAIR 7 genome release [ftp://ftp.arabidopsis.org/home/tair/
Genes/TAIR7_genome_release/TAIR7_blastsets/]58. Diretto G, Tavazza R, Welsch R, Pizzichini D, Mourgues F, Papacchioli
V, Beyer P, Giuliano G: Metabolic engineering of potato tubercarotenoids through tuber-specific silencing of lycopeneepsilon cyclase. BMC Plant Biol 2006, 6:13.
59. Four specific isogenes of the anthocyanin metabolic pathwayare systematically co-expressed with the red colour of grapeberries. Plant Sci 2006, 170(2):372-383.
60. MapMan website [http://www.gabipd.org/database/java-bin/MappingDownloader]
61. Altschul SF, Gish W, Miller W, Myers EW, Lipman DJ: Basic localalignment search tool. J Mol Biol :403-410.
62. EMBOSS: The European Molecular Biology Open SoftwareSuite. Trends Genet 2000, 16(6):276-277.
63. Usadel B, Nagel A, Thimm O, Redestig H, Blaesing OE, Palacios-RojasN, Selbig J, Hannemann J, Conceiçao Piques M, Steinhauser D, Schei-ble WR, Gibon Y, Morcuende R, Weicht D, Meyer S, Stitt M: Exten-sion of the visualization tool MapMan to allow statisticalanalysis of arrays, display of coresponding genes, and com-parison with known responses. Plant Physiol 2005,138:1195-1204.
Page 14 of 14(page number not for citation purposes)