Embed Size (px)
Citation preview
7/27/2019 bns_auto
http://slidepdf.com/reader/full/bnsauto 1/8
Carlos Gomes (416) [email protected]
Global Economics
Global Auto Report
Global Auto Report is available on: www.scotiabank.com, Bloomberg at SCOT and Reuters at SM1C
Scotiabank Economics
Scotia Plaza 40 King Street West, 63rd Floor
Toronto, Ontario Canada M5H 1H1
Tel: (416) 866-6253 Fax: (416) 866-2829
Email: [email protected]
This report has been prepared by Scotiabank Economics as a resource for the clients of Scotiabank
Opinions, estimates and projections contained herein are our own as of the date hereof and are
subject to change without notice. The information and opinions contained herein have been
compiled or arrived at from sources believed reliable but no representation or warranty, express o
implied, is made as to their accuracy or completeness. Neither Scotiabank nor its affiliates accepts
any liability whatsoever for any loss arising from any use of this report or its contents.
TM Trademark of The Bank of Nova Scotia. Used under license, where applicable.
G lobal vehicle sales continued to move higher in May, but the
pace of growth moderated to 3.5% y/y from an average of
5% during the previous four months. Slower sales gains reflect a
recent softening in purchases in Eastern Europe — especially
Russia — and India, as well as ongoing declines in the euro zone.
Outside of these regions, activity remains strong led by double-
digit gains in South America — particularly Brazil — and China.
However, the pace of growth in Brazil is likely to moderate incoming months, constrained by the 75 basis point increase in interest
rates since late last year and high inflation. Auto loan rates in Brazilhave climbed by more than a percentage point since March and now
exceed 20%.
Canadian passenger vehicle sales have averaged an incentive-
induced seasonally adjusted annual rate of 1.75 million units in
April and May, well above our previous full-year forecast. As a
result, we are increasing our 2013 Canadian passenger vehicle sales forecast to a record 1.72 million units,
from 1.69 million. This assumes that despite the recent sharp backup in bond yields since Federal Reserve
Chairman Ben Bernanke indicated that the U.S. central bank will likely begin to reduce liquidity later this
year, automakers will maintain current incentives through the end of 2013.
DOUBLE-DIGIT SALES GAINS IN CHINA
China has become the world’s largest auto market, accounting for one-quarter of global vehicle sales
(cars and trucks) and production. As a result, it is crucial to have a good handle on economic developments
in China — a task made much harder by limited data availability, as well as concerns over data quality.
However, in China, as in other markets, employment and income trends, as well as credit availability are
the key drivers of industry volumes.
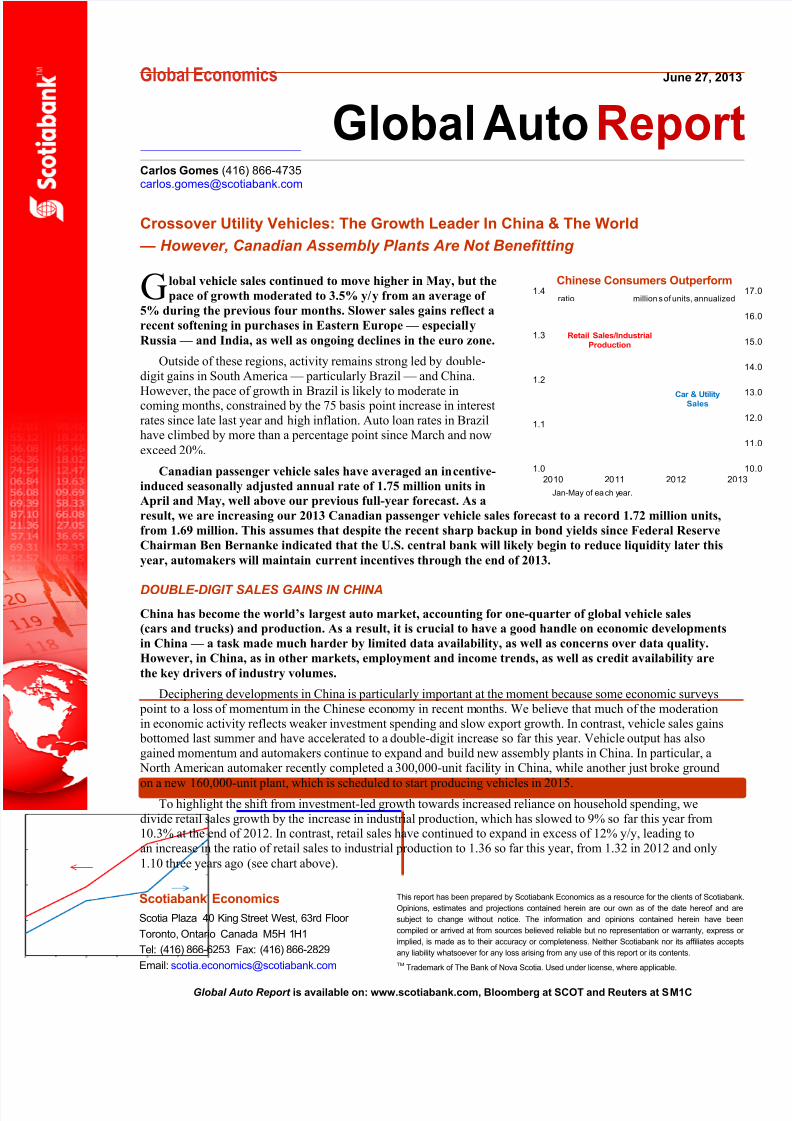
Deciphering developments in China is particularly important at the moment because some economic surveys
point to a loss of momentum in the Chinese economy in recent months. We believe that much of the moderation
in economic activity reflects weaker investment spending and slow export growth. In contrast, vehicle sales gains bottomed last summer and have accelerated to a double-digit increase so far this year. Vehicle output has also
gained momentum and automakers continue to expand and build new assembly plants in China. In particular, a North American automaker recently completed a 300,000-unit facility in China, while another just broke ground
on a new 160,000-unit plant, which is scheduled to start producing vehicles in 2015.To highlight the shift from investment-led growth towards increased reliance on household spending, we
divide retail sales growth by the increase in industrial production, which has slowed to 9% so far this year from10.3% at the end of 2012. In contrast, retail sales have continued to expand in excess of 12% y/y, leading to
an increase in the ratio of retail sales to industrial production to 1.36 so far this year, from 1.32 in 2012 and only
1.10 three years ago (see chart above).
Crossover Utility Vehicles: The Growth Leader In China & The World
— However, Canadian Assembly Plants Are Not Benefitting
June 27, 2013
Chinese Consumers Outperform
1.0
1.1
1.2
1.3
1.4
2010 2011 2012 201
ratio million s of units, annualized
Jan-May of each year.
Car & UtilitySales
Retail Sales/Industrial
Production
7/27/2019 bns_auto
http://slidepdf.com/reader/full/bnsauto 2/8
2
Global Economics
Global Auto Report
June 27, 2013
We continue to expect a 10% increase in vehicle sales in
China this year as employment growth and urban income
growth show no sign of abating. Employment in China is
advancing 5% year-over-year — triple the pace of job creationin North America — and urban incomes continue to post
double-digit gains. In addition, demand will be buoyed by the
launch of new models in China. According to the ChinaPassenger Car Association, more than 50 models were
introduced during the first quarter, and a raft of new models
will be launched through the remainder of the year.
CROSSOVER UTILITIES LEAD THE WAY
The auto market in China and the rest of the world is
undergoing significant changes, especially the escalating popularity of crossover utility vehicles (CUVs). According to
data from IHS Automotive, global sales of CUVs surged by
more than 35% between 2007 and 2012 and exceed 13 million
per annum — 18% of the global auto market.
This rising popularity of SUVs and CUVs first emergedseveral decades ago in North America — with these models
accounting for at least 20% of the U.S. market since the new
millennium. These vehicles now garner one-third of theCanadian and U.S. market, but the trend has recently become a
global phenomenon. In particular, IHS indicates that CUV sales
in China have been posting explosive growth in recent years,including a 20% surge in 2012 — triple the increase in car sales
— to 2.5 million units. Estimates suggest that these models will
account for one-quarter of the passenger vehicle market in
China by 2020, as consumers are increasingly attracted to the
practicality and fuel economy of these all-wheel-drive vehicles.
As a result, we expanded our collection of sales data for China beyond just cars to also include crossover utility vehicles from
2005 onward. This change increases China’s 2012 sales in the
table below to 13.18 million units from 10.68 million previously.
In India, this segment is still small by global standards, withsales of 360,000 units last year —15% of the market. However,
estimates suggest that volumes could exceed 1 million units bythe end of the decade, enabling India to become the third largest
CUV market in the world behind the United States and China.
Even in Europe, where car sales have slumped to 20-year lows,estimates suggest that utility vehicles have made progress, and
are only the segment with sales gains since 2005. (However,
since we have not been able to collect good data on utilityvehicles for India or Europe, we will continue to track only car
sales in both regions for the time being.)
Canada would seem to be well positioned to be a significant
beneficiary of the rising popularity of crossover utility vehicles.These models account for 40% of Canadian vehicle production
and their share will increase further as Toyota continues to
ramp up RAV4 output in Woodstock. However, the reality isthat, with the exception of the Ford Edge assembled inOakville, almost all of the crossovers produced in Canada
remain in North America — either in Canada or exported to the
United States. Instead, most automakers are opting to build new
plants to assemble these popular models in the jurisdiction
where these vehicles are sold, and are not considering Canada — the premier CUV manufacturing nation in North America —
as an export base from which to ship these vehicles overseas.
As result, Canadian CUV production is flat so far this year,while demand for these products has soared in excess of
20% y/y through May.
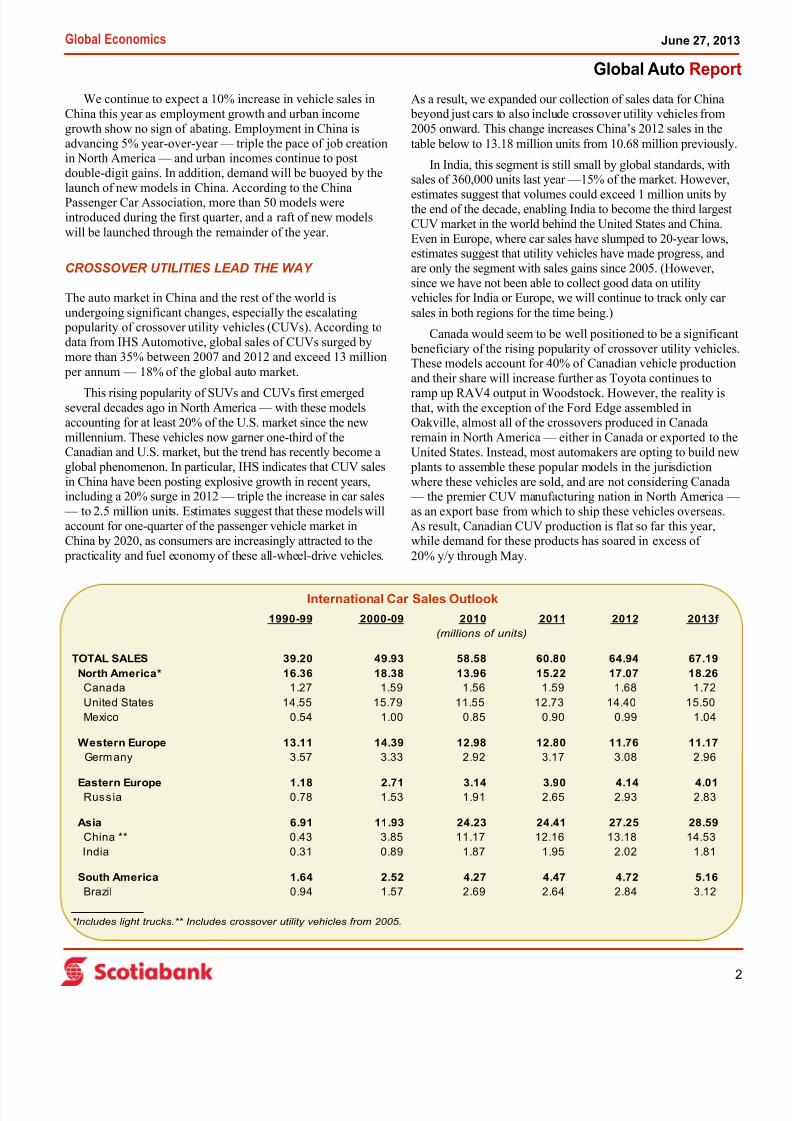
International Car Sales Outlook
1990-99 2000-09 2010 2011 2012 2013f
TOTAL SALES 39.20 49.93 58.58 60.80 64.94 67.19
North America* 16.36 18.38 13.96 15.22 17.07 18.26
Canada 1.27 1.59 1.56 1.59 1.68 1.72
United States 14.55 15.79 11.55 12.73 14.40 15.50
Mexico 0.54 1.00 0.85 0.90 0.99 1.04
Western Europe 13.11 14.39 12.98 12.80 11.76 11.17
Germany 3.57 3.33 2.92 3.17 3.08 2.96
Eastern Europe 1.18 2.71 3.14 3.90 4.14 4.01Russia 0.78 1.53 1.91 2.65 2.93 2.83
Asia 6.91 11.93 24.23 24.41 27.25 28.59
China ** 0.43 3.85 11.17 12.16 13.18 14.53
India 0.31 0.89 1.87 1.95 2.02 1.81
South America 1.64 2.52 4.27 4.47 4.72 5.16
Brazil 0.94 1.57 2.69 2.64 2.84 3.12
*Includes light trucks.** Includes crossover utility vehicles from 2005.
(millions of units)
7/27/2019 bns_auto
http://slidepdf.com/reader/full/bnsauto 3/8
3
Global Economics
Global Auto Report
June 27, 2013
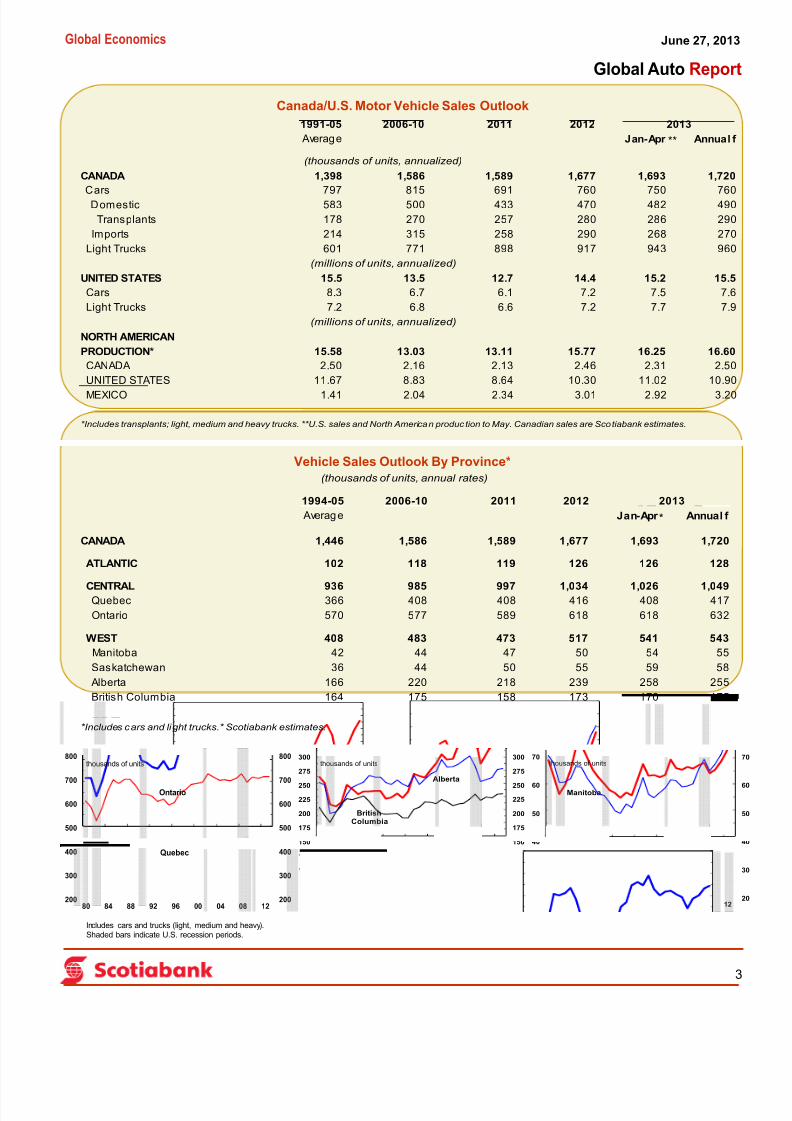
Canada/U.S. Motor Vehicle Sales Outlook
Vehicle Sales Outlook By Province*
1991-05 2006-10 2011 2012
Average Jan-Apr Annual f
CANADA 1,398 1,586 1,589 1,677 1,693 1,720
Cars 797 815 691 760 750 760
Domestic 583 500 433 470 482 490
Transplants 178 270 257 280 286 290
Imports 214 315 258 290 268 270
Light Trucks 601 771 898 917 943 960
UNITED STATES 15.5 13.5 12.7 14.4 15.2 15.5
Cars 8.3 6.7 6.1 7.2 7.5 7.6
Light Trucks 7.2 6.8 6.6 7.2 7.7 7.9
NORTH AMERICAN
PRODUCTION* 15.58 13.03 13.11 15.77 16.25 16.60
CANADA 2.50 2.16 2.13 2.46 2.31 2.50
UNITED STATES 11.67 8.83 8.64 10.30 11.02 10.90
MEXICO 1.41 2.04 2.34 3.01 2.92 3.20
*Includes transplants; light, medium and heavy trucks. **U.S. sales and North American produc tion to May. Canadian sales are Scotiabank estimates.
2013
(millions of units, annualized)
(millions of units, annualized)
(thousands of units, annualized)
**
200
300
400
500
600
700
800
200
300
400
500
600
700
800
80 84 88 92 96 00 04 08 12
Ontario
Quebec
Includes cars and trucks (light, medium and heavy).Shaded bars indicate U.S. recession periods.
thousands of units
50
75
100
125
150
175
200
225
250
275
300
50
75
100
125
150
175
200
225
250
275
300
80 84 88 92 96 00 04 08 12
BritishColumbia
Atlantic
thousands of units
Alberta
20
30
40
50
60
70
80 84 88 92 96 00 04 08 12
Manitoba
Saskatchewan
thousands of units
1994-05 2006-10 2011 2012
Average Jan-Apr Annual f
CANADA 1,446 1,586 1,589 1,677 1,693 1,720
ATLANTIC 102 118 119 126 126 128
CENTRAL 936 985 997 1,034 1,026 1,049Quebec 366 408 408 416 408 417
Ontario 570 577 589 618 618 632
WEST 408 483 473 517 541 543
Manitoba 42 44 47 50 54 55
Saskatchewan 36 44 50 55 59 58
Alberta 166 220 218 239 258 255
British Columbia 164 175 158 173 170 175
*Includes cars and light trucks.* Scotiabank estimates.
(thousands of units, annual rates)
2013
*
7/27/2019 bns_auto
http://slidepdf.com/reader/full/bnsauto 4/8
4
Global Economics
Global Auto Report
June 27, 2013
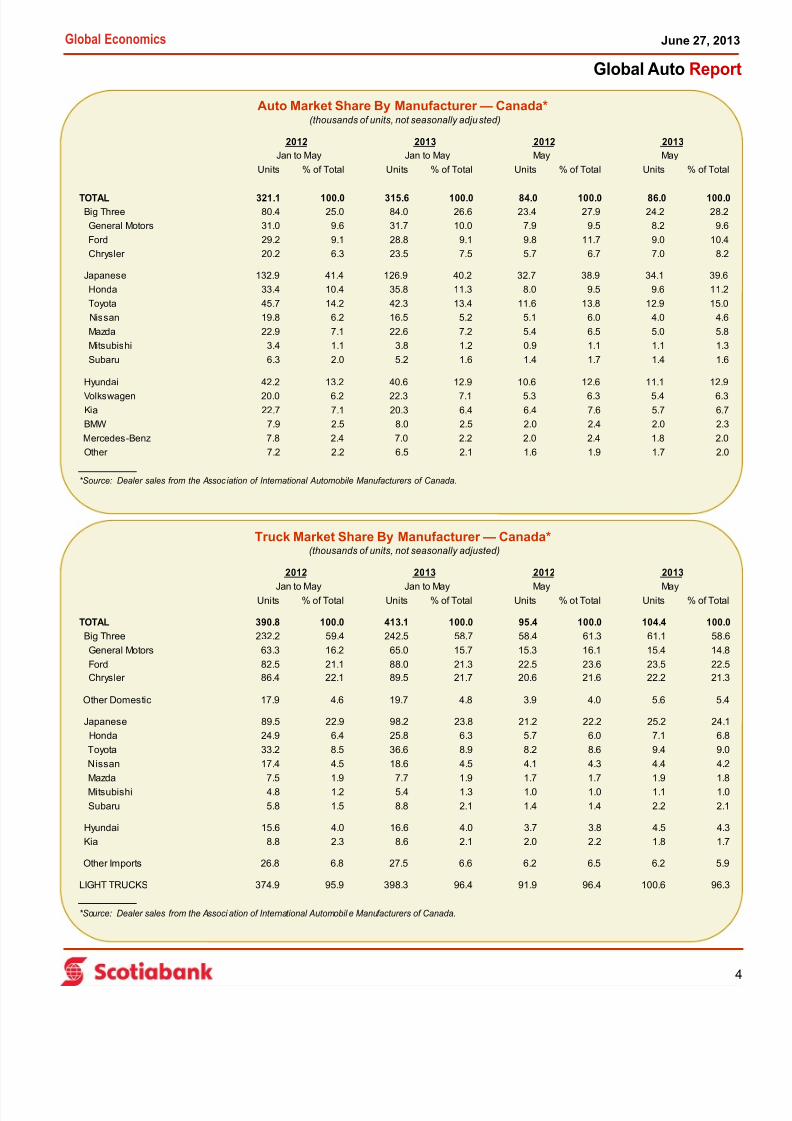
Auto Market Share By Manufacturer — Canada*
Truck Market Share By Manufacturer — Canada*
Units % of Total Units % of Total Units % of Total Units % of Total
TOTAL 321.1 100.0 315.6 100.0 84.0 100.0 86.0 100.0Big Three 80.4 25.0 84.0 26.6 23.4 27.9 24.2 28.2
General Motors 31.0 9.6 31.7 10.0 7.9 9.5 8.2 9.6
Ford 29.2 9.1 28.8 9.1 9.8 11.7 9.0 10.4
Chrysler 20.2 6.3 23.5 7.5 5.7 6.7 7.0 8.2
Japanese 132.9 41.4 126.9 40.2 32.7 38.9 34.1 39.6
Honda 33.4 10.4 35.8 11.3 8.0 9.5 9.6 11.2
Toyota 45.7 14.2 42.3 13.4 11.6 13.8 12.9 15.0
Nissan 19.8 6.2 16.5 5.2 5.1 6.0 4.0 4.6
Mazda 22.9 7.1 22.6 7.2 5.4 6.5 5.0 5.8
Mitsubishi 3.4 1.1 3.8 1.2 0.9 1.1 1.1 1.3
Subaru 6.3 2.0 5.2 1.6 1.4 1.7 1.4 1.6
Hyundai 42.2 13.2 40.6 12.9 10.6 12.6 11.1 12.9
Volkswagen 20.0 6.2 22.3 7.1 5.3 6.3 5.4 6.3
Kia 22.7 7.1 20.3 6.4 6.4 7.6 5.7 6.7
BMW 7.9 2.5 8.0 2.5 2.0 2.4 2.0 2.3
Mercedes-Benz 7.8 2.4 7.0 2.2 2.0 2.4 1.8 2.0
Other 7.2 2.2 6.5 2.1 1.6 1.9 1.7 2.0
*Source: Dealer sales from the Assoc iation of International Automobile Manufacturers of Canada.
Jan to May May MayJan to May
(thousands of units, not seasonally adjusted)
2012 2013 2012 2013
Units % of Total Units % of Total Units % ot Total Units % of Total
TOTAL 390.8 100.0 413.1 100.0 95.4 100.0 104.4 100.0
Big Three 232.2 59.4 242.5 58.7 58.4 61.3 61.1 58.6
General Motors 63.3 16.2 65.0 15.7 15.3 16.1 15.4 14.8
Ford 82.5 21.1 88.0 21.3 22.5 23.6 23.5 22.5
Chrysler 86.4 22.1 89.5 21.7 20.6 21.6 22.2 21.3
Other Domestic 17.9 4.6 19.7 4.8 3.9 4.0 5.6 5.4
Japanese 89.5 22.9 98.2 23.8 21.2 22.2 25.2 24.1
Honda 24.9 6.4 25.8 6.3 5.7 6.0 7.1 6.8
Toyota 33.2 8.5 36.6 8.9 8.2 8.6 9.4 9.0
Nissan 17.4 4.5 18.6 4.5 4.1 4.3 4.4 4.2
Mazda 7.5 1.9 7.7 1.9 1.7 1.7 1.9 1.8
Mitsubishi 4.8 1.2 5.4 1.3 1.0 1.0 1.1 1.0
Subaru 5.8 1.5 8.8 2.1 1.4 1.4 2.2 2.1
Hyundai 15.6 4.0 16.6 4.0 3.7 3.8 4.5 4.3
Kia 8.8 2.3 8.6 2.1 2.0 2.2 1.8 1.7
Other Imports 26.8 6.8 27.5 6.6 6.2 6.5 6.2 5.9
LIGHT TRUCKS 374.9 95.9 398.3 96.4 91.9 96.4 100.6 96.3
*Source: Dealer sales from the Associ ation of International Automobil e Manufacturers of Canada.
Jan to May May MayJan to May
(thousands of units, not seasonally adjusted)
2012 2013 2012 2013
7/27/2019 bns_auto
http://slidepdf.com/reader/full/bnsauto 5/8
5
Global Economics
Global Auto Report
June 27, 2013
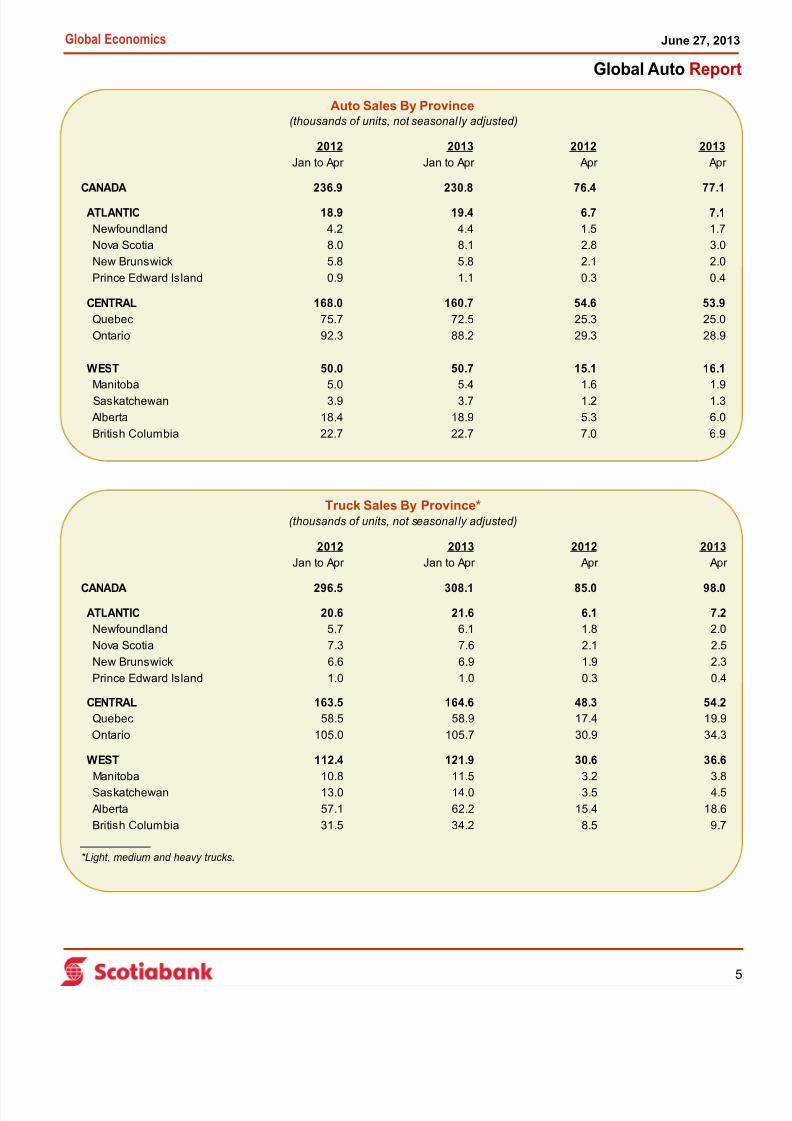
Auto Sales By Province
Truck Sales By Province*
2012 2013 2012 2013
Jan to Apr Jan to Apr Apr Apr
CANADA 236.9 230.8 76.4 77.1 ATLANTIC 18.9 19.4 6.7 7.1
Newfoundland 4.2 4.4 1.5 1.7
Nova Scotia 8.0 8.1 2.8 3.0
New Brunswick 5.8 5.8 2.1 2.0
Prince Edward Island 0.9 1.1 0.3 0.4
CENTRAL 168.0 160.7 54.6 53.9
Quebec 75.7 72.5 25.3 25.0
Ontario 92.3 88.2 29.3 28.9
WEST 50.0 50.7 15.1 16.1
Manitoba 5.0 5.4 1.6 1.9
Saskatchewan 3.9 3.7 1.2 1.3
Alberta 18.4 18.9 5.3 6.0
British Columbia 22.7 22.7 7.0 6.9
(thousands of units, not seasonal ly adjusted)
2012 2013 2012 2013
Jan to Apr Jan to Apr Apr Apr
CANADA 296.5 308.1 85.0 98.0
ATLANTIC 20.6 21.6 6.1 7.2
Newfoundland 5.7 6.1 1.8 2.0
Nova Scotia 7.3 7.6 2.1 2.5
New Brunswick 6.6 6.9 1.9 2.3
Prince Edward Island 1.0 1.0 0.3 0.4
CENTRAL 163.5 164.6 48.3 54.2
Quebec 58.5 58.9 17.4 19.9
Ontario 105.0 105.7 30.9 34.3
WEST 112.4 121.9 30.6 36.6
Manitoba 10.8 11.5 3.2 3.8
Saskatchewan 13.0 14.0 3.5 4.5
Alberta 57.1 62.2 15.4 18.6
British Columbia 31.5 34.2 8.5 9.7
*Light, medium and heavy trucks.
(thousands of units, not seasonal ly adjusted)
7/27/2019 bns_auto
http://slidepdf.com/reader/full/bnsauto 6/8
6
Global Economics
Global Auto Report
June 27, 2013
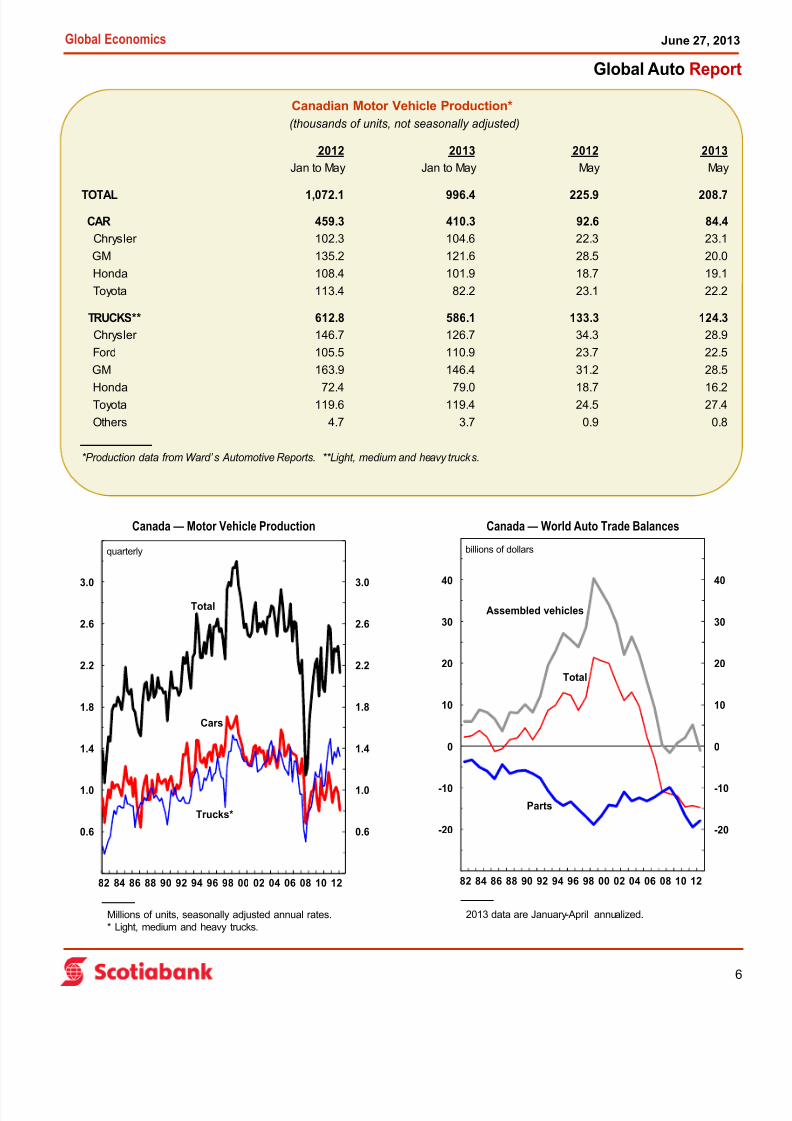
Canada — Motor Vehicle Production Canada — World Auto Trade Balances
Canadian Motor Vehicle Production*
0.2
0.6
1.0
1.4
1.8
2.2
2.6
3.0
3.4
0.2
0.6
1.0
1.4
1.8
2.2
2.6
3.0
3.4
82 84 86 88 90 92 94 96 98 00 02 04 06 08 10 12
quarterly
Total
Millions of units, seasonally adjusted annual rates.* Light, medium and heavy trucks.
Cars
Trucks*
-30
-20
-10
0
10
20
30
40
50
-30
-20
-10
0
10
20
30
40
50
82 84 86 88 90 92 94 96 98 00 02 04 06 08 10 12
billions of dollars
Assembled vehicles
Total
Parts
2013 data are January-April annualized.
2012 2013 2012 2013
Jan to May Jan to May May May
TOTAL 1,072.1 996.4 225.9 208.7
CAR 459.3 410.3 92.6 84.4
Chrysler 102.3 104.6 22.3 23.1
GM 135.2 121.6 28.5 20.0
Honda 108.4 101.9 18.7 19.1
Toyota 113.4 82.2 23.1 22.2
TRUCKS** 612.8 586.1 133.3 124.3
Chrysler 146.7 126.7 34.3 28.9
Ford 105.5 110.9 23.7 22.5
GM 163.9 146.4 31.2 28.5
Honda 72.4 79.0 18.7 16.2Toyota 119.6 119.4 24.5 27.4
Others 4.7 3.7 0.9 0.8
*Production data from Ward’ s Automotive Reports. **Light, medium and heavy trucks.
(thousands of units, not seasonally adjusted)
7/27/2019 bns_auto
http://slidepdf.com/reader/full/bnsauto 7/8
7
Global Economics
Global Auto Report
June 27, 2013
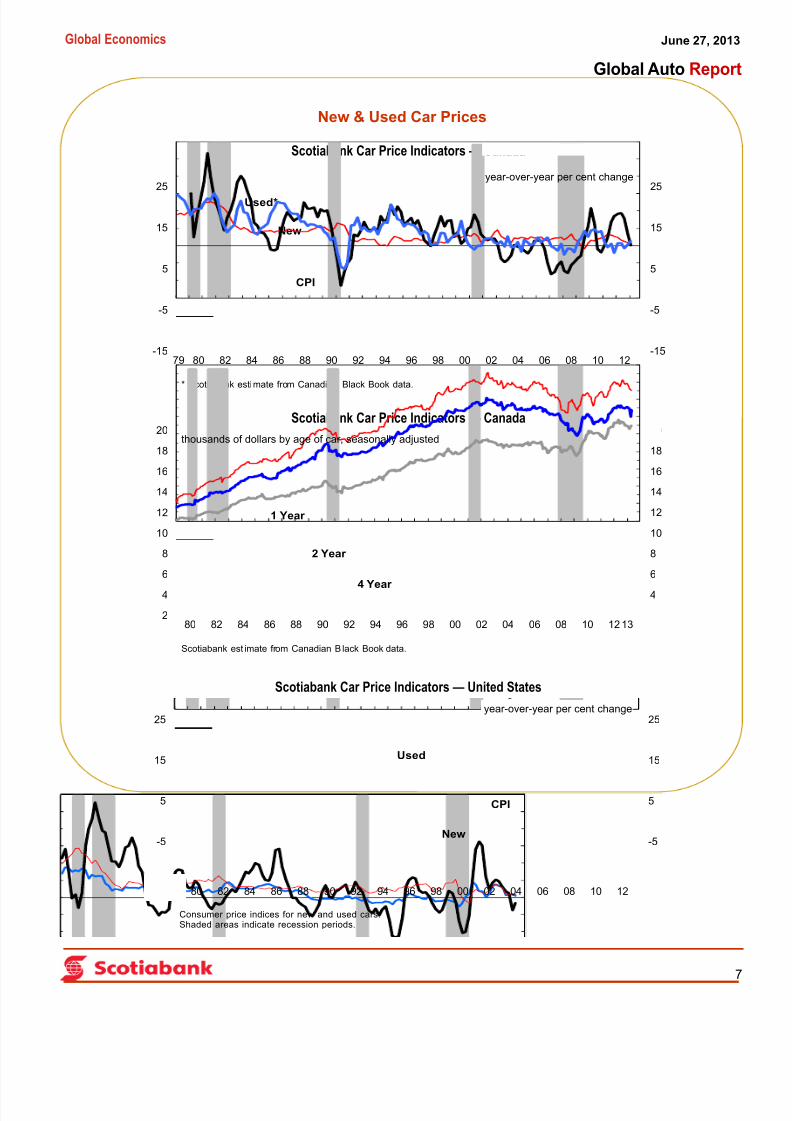
Scotiabank Car Price Indicators — Canada
Scotiabank Car Price Indicators — Canada
Scotiabank Car Price Indicators — United States
New & Used Car Prices
-15
-5
5
15
25
-15
-5
5
15
25
79 80 82 84 86 88 90 92 94 96 98 00 02 04 06 08 10 12
Used*
* Scotiabank estimate from Canadian Black Book data.
CPI
New
year-over-year per cent change
2
4
6
8
10
12
14
16
18
20
2
4
6
8
10
12
14
16
18
20
79 80 82 84 86 88 90 92 94 96 98 00 02 04 06 08 10 1213
1 Year
Scotiabank est imate from Canadian B lack Book data.
4 Year
thousands of dollars by age of car, seasonally adjusted
2 Year
-15
-5
5
15
25
-15
-5
5
15
25
79 80 82 84 86 88 90 92 94 96 98 00 02 04 06 08 10 12
Consumer price indices for new and used cars.Shaded areas indicate recession periods.
Used
New
year-over-year per cent change
CPI
7/27/2019 bns_auto
http://slidepdf.com/reader/full/bnsauto 8/8
8
Global Economics
Global Auto Report
June 27, 2013
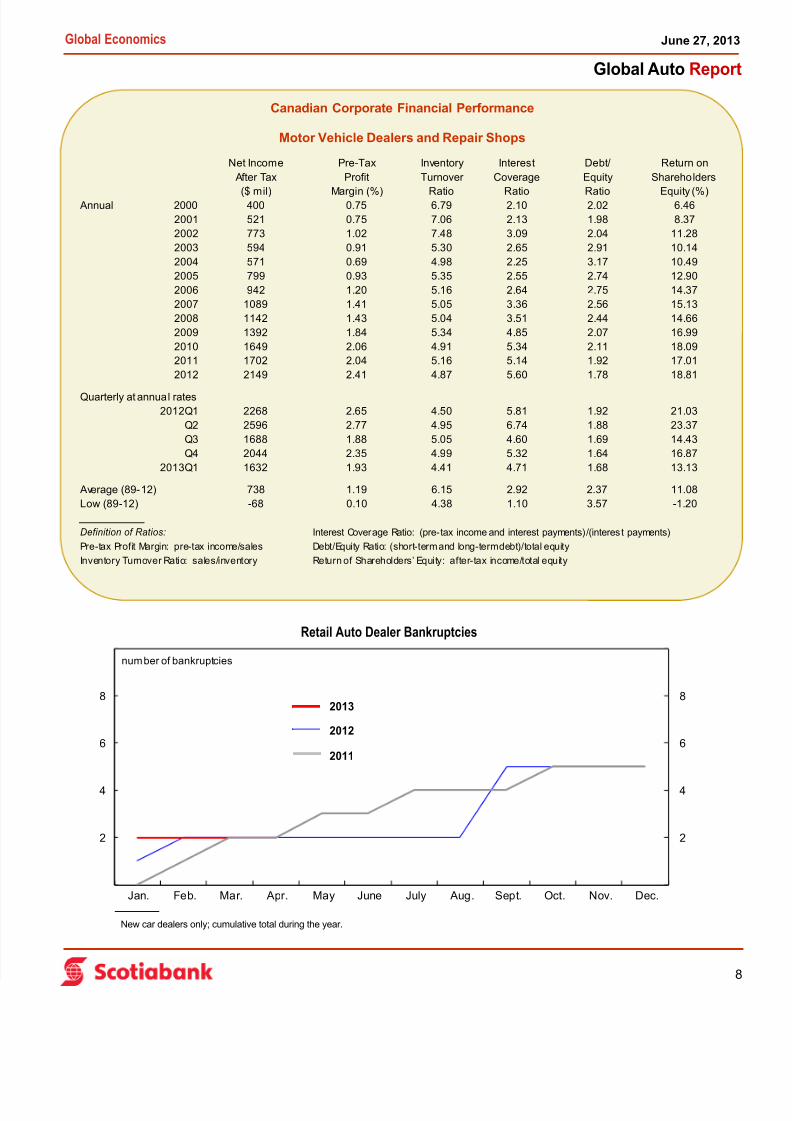
Retail Auto Dealer Bankruptcies
Canadian Corporate Financial Performance
Motor Vehicle Dealers and Repair Shops
Net Income Pre-Tax Inventory Interest Debt/ Return on
After Tax Profit Turnover Coverage Equity Shareholders
($ mil) Margin (%) Ratio Ratio Ratio Equity (%) Annual 2000 400 0.75 6.79 2.10 2.02 6.46
2001 521 0.75 7.06 2.13 1.98 8.37
2002 773 1.02 7.48 3.09 2.04 11.28
2003 594 0.91 5.30 2.65 2.91 10.14
2004 571 0.69 4.98 2.25 3.17 10.49
2005 799 0.93 5.35 2.55 2.74 12.90
2006 942 1.20 5.16 2.64 2.75 14.37
2007 1089 1.41 5.05 3.36 2.56 15.13
2008 1142 1.43 5.04 3.51 2.44 14.66
2009 1392 1.84 5.34 4.85 2.07 16.99
2010 1649 2.06 4.91 5.34 2.11 18.09
2011 1702 2.04 5.16 5.14 1.92 17.01
2012 2149 2.41 4.87 5.60 1.78 18.81
Quarterly at annual rates
2012Q1 2268 2.65 4.50 5.81 1.92 21.03
Q2 2596 2.77 4.95 6.74 1.88 23.37
Q3 1688 1.88 5.05 4.60 1.69 14.43
Q4 2044 2.35 4.99 5.32 1.64 16.87
2013Q1 1632 1.93 4.41 4.71 1.68 13.13
Average (89-12) 738 1.19 6.15 2.92 2.37 11.08
Low (89-12) -68 0.10 4.38 1.10 3.57 -1.20
Definition of Ratios: Interest Coverage Ratio: (pre-tax income and interest payments)/(interes t payments)
Pre-tax Profit Margin: pre-tax income/sales Debt/Equity Ratio: (short-term and long-term debt)/total equity
Inventory Turnover Ratio: sales/inventory Return of Shareholders’ Equity: after-tax income/total equity
0
2
4
6
8
10
0
2
4
6
8
10
Jan. Feb. Mar. Apr. May June July Aug. Sept. Oct. Nov. Dec.
New car dealers only; cumulative total during the year.
number of bankruptcies
2013
2011
2012


