Embed Size (px)
Citation preview
Bogich, TL; Funk, S; Malcolm, TR; Chhun, N; Epstein, JH; Chmura,AA; Kilpatrick, AM; Brownstein, JS; Hutchison, OC; Doyle-Capitman,C; Deaville, R; Morse, SS; Cunningham, AA; Daszak, P (2013) Usingnetwork theory to identify the causes of disease outbreaks of unknownorigin. Journal of the Royal Society, Interface / the Royal Society,10 (81). p. 20120904. ISSN 1742-5689 DOI: 10.1098/rsif.2012.0904
Downloaded from: http://researchonline.lshtm.ac.uk/1175535/
DOI: 10.1098/rsif.2012.0904
Usage Guidelines
Please refer to usage guidelines at http://researchonline.lshtm.ac.uk/policies.html or alterna-tively contact [email protected].
Copyright c© and Moral Rights for the papers on this site are retained by the individual au-thors and/or other copyright owners
!
Using network theory to identify disease outbreaks of unknown etiology
Tiffany L. Bogich1,2,3*
, Sebastian Funk3,4,5*
, Trent R. Malcolm1, Nok Chhun
1, Jonathan H. Epstein
1,
Aleksei A. Chmura1, A. Marm Kilpatrick
6, John S. Brownstein
7, O. Clyde Hutchison
4, Catherine Doyle-
Capitman1,8
, Robert Deaville4, Stephen S. Morse
9, Andrew A. Cunningham
4, Peter Daszak
1
1EcoHealth Alliance, 460 West 34
th Street, 17
th Floor, New York, NY 10001, USA
2Fogarty International Center, National Institutes of Health, Bethesda, MD, 20892 USA
3Princeton University, Dept of Ecology & Evolutionary Biology, Princeton, NJ 08544, USA
4Institute of Zoology, Zoological Society of London, Regent’s Park, London NW1 4RY, UK
5London School of Hygiene & Tropical Medicine, Keppel St, London WC1E 7HT, UK
6Department of Ecology and Evolutionary Biology, University of California, Santa Cruz, CA 95064, USA
7Childrens’ Hospital Boston, Harvard University, Boston, MA, USA, 02115
8Department of Mammalogy, American Museum of Natural History, Central Park West at 79
th Street,
New York, NY 10024, USA 9Department of Epidemiology, Columbia University, Mailman School of Public Health, 722 W 168
th
Street, New York, NY 10032, USA
These authors contributed equally, author order is alphabetical
Corresponding authors: TL Bogich (+1 917 882 5422, [email protected]), S Funk (+1 609 258
6882, [email protected]) and P Daszak (+1 212 380 4460, [email protected])
Abstract
The identification of undiagnosed disease outbreaks is critical for mobilizing efforts to prevent
widespread transmission of novel virulent pathogens. Recent developments in online surveillance systems
allow for the rapid communication of the earliest reports of emerging infectious diseases and tracking of
their spread. The efficacy of these programs, however, is inhibited by the anecdotal nature of informal
reporting and uncertainty of pathogen identity in the early stages of emergence. We developed theory to
connect disease outbreaks of known etiology in a network using an array of properties including
symptoms, seasonality and case-fatality ratio. We tested the method with 125 reports of outbreaks of ten
known infectious diseases causing encephalitis in South Asia, and showed that different diseases
frequently form distinct clusters within the networks and the approach can correctly identify unknown
disease outbreaks with an average sensitivity of 76% and specificity of 88%. Outbreaks of some diseases,
such as Nipah virus encephalitis, were well identified (sensitivity = 100%, PPV = 80%), whereas others
(e.g., Chandipura encephalitis) were more difficult to distinguish. These results suggest that unknown
outbreaks in resource-poor settings could be evaluated in real-time, potentially leading to more rapid
responses and reducing the risk of an outbreak becoming a pandemic.
Keywords: emerging infectious disease, encephalitis, complex networks, South Asia, Nipah virus
encephalitis, cluster analysis, early warning system
Introduction
Despite the enormous social,
demographic, and economic impact of emerging
infectious diseases, and billions of dollars spent
to control them, there has been limited progress
in the development of tools for early
intervention that could prevent the emergence
and spread of pathogens in the initial stages of
an epidemic (1-5). This is an acute problem in
resource-poor nations that have limited
surveillance capacity and often lack laboratory
facilities to diagnose unusual outbreaks.
To address this issue, online databases
and surveillance reporting networks have been
developed to identify and monitor the
emergence and spread of infectious agents.
These include tools to aid in the clinical
diagnosis of single cases of infectious diseases
(6-12), tools that process unverified epidemic
!
intelligence using specific keywords, e.g.
HealthMap.org (13, 14) and Google Flu Trends
(15), those that compile verified outbreak data,
e.g. GLEWS (16), GAINS (17), and GIDEON
(6), and those that disseminate expert-moderated
outbreak reports and anecdotal information, e.g.
ProMED-mail (18). To the best of our
knowledge, no decision support tool exists for
the rapid and inexpensive assessment of
outbreaks, particularly in the face of minimal
information and limited resources to make the
clinical assessments necessary to parameterize
one of the existing diagnostic models.
We developed a method based on
network theory to evaluate potential causes of
outbreaks of disease. While many statistical
approaches exist for assigning multivariate data
records into categories, e.g. Bayesian network
analysis or Discriminant Functions Analysis
(19), the method we present here has the
advantage of allowing for multiple equitable
solutions for symptom assignment. Our method
employs an ensemble of adequate solutions and
this ensemble allows one to assess certainty of
outbreak diagnosis assignment.
Network theory is the study of
relationships between entities (‘nodes’) and
connections between these entities (‘edges’)
(20). Network theory has previously been used
effectively to describe social and biological
datasets (21, 22), and it has been shown to be a
useful tool for cluster analysis (23). Here, we
consider outbreaks as nodes, and create an edge
between any two outbreaks if they share
symptoms, or have similar properties such as
case fatality ratio or seasonality (Fig. 1). We
give an edge greater weight if the two outbreaks
at either end are more similar in that sense (see
supplementary methods for details). Groups of
outbreaks that are more strongly connected to
each other than to other outbreaks in the network
can be said to form a ‘cluster’ or, more
commonly in network theory, a ‘community’. If
outbreaks of different diseases were perfectly
distinguishable on the basis of the properties we
consider, each disease would form a single and
distinct cluster of outbreaks of that disease. In
that case we could use this to link unidentified
outbreaks to those of known etiological agents
with similar properties (e.g. seasonality, case
fatality ratio, symptoms) by adding them to the
network and testing which cluster they are most
similar to (in the sense that they are strongly
connected to outbreaks within that cluster). We
applied this method to 125 outbreak reports of
ten different diseases causing encephalitis in
South Asia. Furthermore, we analyzed 97
outbreaks of encephalitis in South Asia reported
on ProMED-mail that were reported without a
definitive diagnosis. We associated each of them
with one of the ten diseases based on which
cluster in the network they are most strongly
linked to. As such, our approach uses a novel
interpretation of an abstract network to link
(unidentified) outbreaks to those of known
etiological agents with similar properties (e.g.
seasonality, case fatality ratio, symptoms). We
chose South Asia as it has been identified as an
emerging infectious disease ‘hotspot’ (24), and
has a history of recent pathogen emergence,
including those causing encephalitis, e.g. Nipah
virus encephalitis, Japanese encephalitis, and
cerebral malaria (25). Further, investigations
into encephalitis outbreaks in South Asia have
been limited and diagnoses are sometimes
controversial (26).
Methods
Differential Diagnosis of Diseases in South Asia
Our aim was to develop a method that
could be used to identify the pathogens causing
undiagnosed outbreaks of encephalitis in South
Asia. We first built a library of potential
pathogens, and then developed a model to
quantify associations between the symptoms,
seasonality, and case fatality ratio (CFR) caused
by infection with these pathogens
We used the Global Infectious Disease
and Epidemiology Network (GIDEON) online
database to create a library of potential diseases
and pathogens and to establish a differential
diagnosis for diseases in South Asia with
encephalitis as a potential symptom. The
GIDEON database contains a diagnostic module
that utilizes information on symptoms, country,
incubation period, and laboratory tests to
construct a ranked differential diagnosis (27).
Using common characteristics of outbreaks
reported in ProMED-mail, we queried GIDEON
for the most likely diagnoses for such diseases in
each of the eight nations comprising the South
!
Asian Association for Regional Cooperation
(SAARC): Afghanistan, Bangladesh, Bhutan,
India, Maldives, Nepal, Pakistan, and Sri Lanka.
Search criteria included “outbreak or case
cluster”, “severe/fatal”, “fever”,
“neurological/headache”, and
“neurological/encephalitis”. For each nation, we
recorded all potential diagnoses with >1%
probability of occurrence. Potential diagnoses
with <1% probability of occurrence and “first
case scenario” diagnoses were excluded. The ten
diseases identified and their diagnoses were
compiled into an inclusive list of differential
diagnoses for the SAARC region. Two diseases,
influenza and rabies, appeared in the region-
wide differential diagnosis but were excluded
from the analysis because symptoms associated
with their outbreaks are distinct and relatively
easily distinguished from encephalitides (e.g. for
rabies, due to rapid fatality, lack of human-to-
human transmission and distinct symptoms).
Two other diseases, Chandipura encephalitis and
chikungunya fever, were added to the
differential diagnosis based on their increasing
incidence within the region.
We then conducted a literature search to
compile a dataset of the clinical and
epidemiological features of known outbreaks of
each of the ten diseases (Supplementary
Appendix, Table S1): Chandipura encephalitis,
chikungunya fever, dengue fever, Japanese
encephalitis, malaria, measles, aseptic
meningitis, bacterial meningitis, Nipah virus
encephalitis (NiV), and typhoid/enteric fever.
We searched the literature for the clinical and
epidemiological features of each disease, and we
restricted the results to the SAARC nations in
order to capture the seasonality and disease
etiology in this region. For each published
report, we recorded the location of the outbreak
or study, the month and year of recorded cases,
CFR, and the prevalence of symptoms among
cases (recorded as % of patients). Results for
malaria include only complicated and cerebral
malaria, and results for “dengue” include dengue
fever, dengue hemorrhagic fever, and dengue
shock syndrome.
Network Analysis
We developed a network model to
determine how outbreaks of the same disease
cluster together and how distinct they are
compared to outbreaks of other diseases, with
respect to seasonality, CFR, and symptoms. Our
method is based on the assumption that in
outbreaks of the same disease patients will show
similar symptoms, occur in similar times of the
years, and/or have similar CFRs. If this
assumption is correct, outbreaks will be linked
by similar traits and would be clustered into
groups of the same disease (Fig 1) (28). We
constructed a network from the set of 125
diagnosed outbreak reports from the literature of
the ten diseases selected, with each node
representing a single outbreak report. A
connection (edge) is created between two
outbreaks (nodes) if they share a symptom or
property, with the weight of the edge given by a
weighted sum of all symptoms/properties
shared. We used a previously developed
algorithm to detect densely connected clusters of
outbreaks in networks (29). As some symptoms
may be more important than others in
distinguishing one disease from another, we
allowed for unequal weights to each of the
symptoms in the model. We determine
appropriate symptom weights using a method
that yields maximal within-cluster similarity and
between-cluster dissimilarity (called network
modularity, see Supplemental Appendix
Methods and Table S2). Because multiple sets of
symptom weights could result in similar
maximal network modularity, we created an
ensemble of sample networks, each with its own
set of symptom/property weights, and averaged
over all of them in evaluating the outbreak
reports to increase the reliability of our analysis.
Model Testing
We tested the reliability of our method
by removing each of the reference reports from
the network, running the model with the
removed reference report as an ‘undiagnosed’
report, and checking if the model-predicted
diagnosis matched the actual diagnosis. This
allowed us to determine the sensitivity
(proportion of true positives correctly identified
as such) and specificity (proportion of true
negatives correctly identified as such) of the
model for each disease. We calculated positive
predictive values (PPV) and negative predictive
values (NPV) for each of the ten diseases. PPV
!
is the proportion of positive results that are true
positives (e.g. the proportion of outbreaks
identified by the model as dengue that were
laboratory confirmed as dengue cases), whereas
NPV is the proportion of negative results that
are true negatives (e.g. the proportion of
outbreaks identified by the model as not dengue
and were confirmed as something else). We
assumed that each of the ten diseases considered
was equally likely to be the correct diagnosis for
any given ‘mystery case’ presented, and that all
of our reports could be diagnosed as one of the
ten diseases considered.
Undiagnosed Outbreaks
We reviewed ProMED-mail for reports
of undiagnosed encephalitis between 1994 and
2008. Search terms included “encephalitis”,
“fever”, “mystery”, “undiagnosed”, and
“unknown origin”. Search results were again
restricted to the SAARC nations. For each
ProMED-mail report, the geographic location,
month and year of the first recognized case,
number of people affected, number of deaths
and clinical symptoms were recorded. We
calculated the CFR as the number of deaths per
total number of cases reported for each outbreak.
For outbreaks with multiple associated incident
reports over time, we recorded the total number
of reports and final diagnosis, if provided.
For the period under study (1994-2008),
a sample of 99 outbreaks of undiagnosed
encephalitis was selected from ProMED-mail
(Supplementary Appendix Table S3). We
removed two outbreak reports that had
incomplete information (lacking symptoms,
CFR, or seasonality), reducing the dataset to 97
outbreaks. We added the undiagnosed outbreaks
to each of the sample networks, using the
weights as determined before. For each
undiagnosed outbreak added, we determined the
cluster the outbreak associated best with (see
supplementary material), and recorded each
disease present in that cluster. We used a
bootstrap method across the sample networks to
identify the disease associated most frequently
with a given undiagnosed outbreak, and we
consider this its primary diagnosis. We
calculated the number of times a disease was
associated with a given outbreak out of the total
number of networks tested to determine an
association score and a corresponding 95%
confidence interval around this association.
When multiple diseases had overlapping percent
association confidence intervals, they were all
considered to be plausible diagnoses
(Supplementary Appendix Table S4), thus
increasing sensitivity but reducing specificity of
our method.
Results
Seven communities or clusters of
outbreaks based on symptoms, seasonality and
CFR were identified from associations of the
original set of 125 outbreak reports from the
literature of the ten diseases tested (Fig. 2, outer
ring). Ideally, each cluster of outbreaks would
consist of reports of a single disease. However,
given overlapping sets of symptoms, CFR, or
seasonality, most clusters included outbreaks of
more than one disease. Of the ten diseases
included in this study, NiV infection was
identified most reliably (100% sensitivity, Table
1 and 80% PPV, Table 2), and forms a distinct
cluster (Fig. 2). It was unique in our analysis in
having a high CFR (~70%), a distinct
seasonality (spring), and symptoms of
respiratory difficulty, seizure, unconsciousness,
vomiting and weakness. Other diseases with
relatively high PPV were chikungunya fever
(75% PPV) on the basis of low CFR and
symptoms of nausea, joint pain, rash, and
myalgia, and typhoid fever (58% PPV) based on
the symptom of pneumonia and low CFR (a few
percent). Diseases that were moderately difficult
to identify were malaria (47% PPV) on the basis
of CFR (~30%) and the symptoms of
unconsciousness, jaundice, acute renal failure,
seizure, respiratory difficulty and neck rigidity;
and bacterial meningitis (PPV 42%) on the basis
of CFR (~15%) and neck rigidity. The diseases
most difficult to identify were dengue fever
(31% PPV), Chandipura encephalitis (27%
PPV), Japanese encephalitis (25% PPV) and
measles (21% PPV), all of which had properties
that made them similar to other diseases. As the
reference dataset contained only three entries of
aseptic meningitis the PPV of 49% is tentative.
Of the 97 unidentified outbreaks from
ProMED that we analyzed, our model evaluated
!
27 as uniquely associated with a single disease
(Fig. 2, white circles of the inner network;
Supplementary Appendix Table S4). A further
38 diseases were associated with two diseases
and 16 were associated with three of the ten
diseases. Of these 54 that yielded multiple
diagnoses, six were associated with NiV.
Sixteen outbreaks were marked as inconclusive
because they either did not contain enough
information or associated with more than three
diseases.
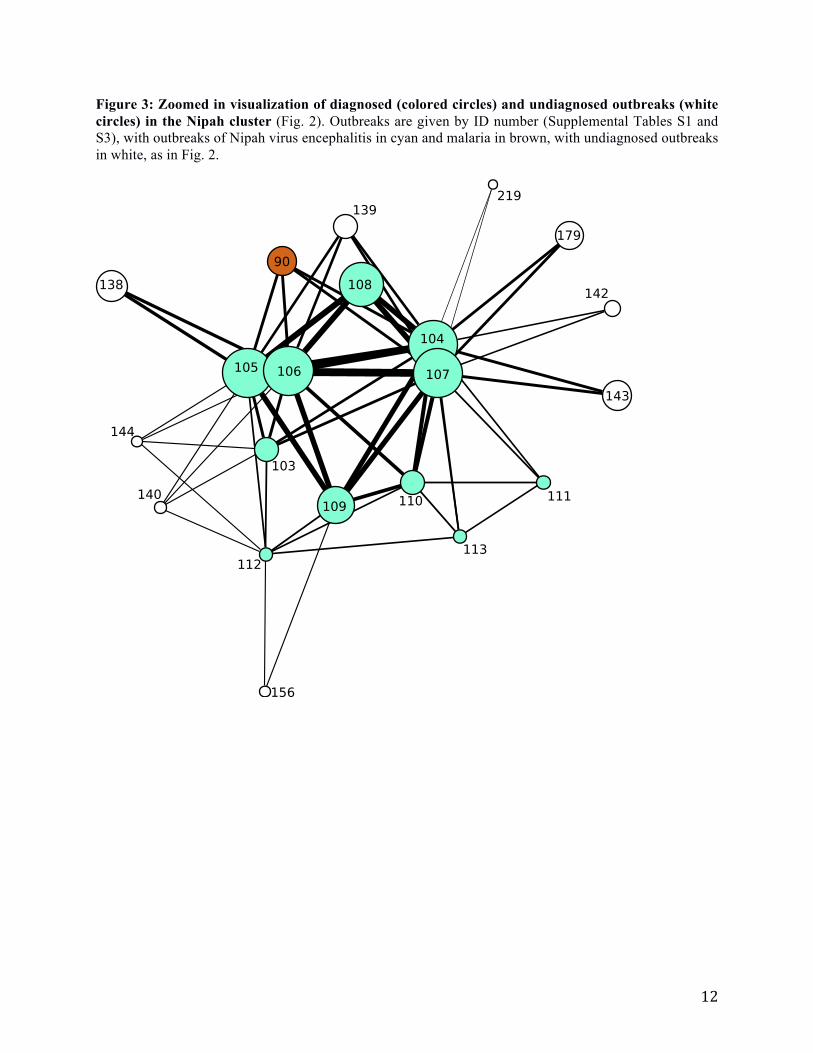
Since NiV was the best-predicted
disease in our dataset (PPV 80%) and is
relatively new and therefore easily misidentified
on the ground, we investigated further the
possible outbreaks of NiV (Fig. 3). Of the six
associated with NiV in our model, two were
clinically confirmed as NiV in follow-up studies.
For the other four, two were never identified,
one was diagnosed as dengue (but moderators
speculated that it may have been NiV), and one
was diagnosed as avian influenza, which was not
represented in our reference dataset.
Attempts to identify two unknown
outbreaks highlight the importance of accurate
data in the initial reports. Our model associated
two other outbreaks that were later reported in
the literature to have been diagnosed as NiV
with malaria, bacterial meningitis, Japanese
encephalitis or typhoid fever (30, 31). This
misidentification resulted from the fact that in
the initial ProMED-mail reports for these two
outbreaks, the CFR was significantly lower than
in the post-outbreak data in the literature (30,
31). The CFR may have been understated in
ProMED-mail reports due to incomplete
recording or right-censoring of the CFR when
estimated during an ongoing outbreak (32).
When the later estimates for CFR from the
literature were used for these two outbreaks, our
method correctly identified them as NiV.
Discussion
We have developed a novel method to
identify disease outbreaks based on their
similarity in properties and symptoms reported.
Our method yielded high PPV, sensitivity and
specificity for an important virulent disease,
NiV, and relatively high values for several other
causes of encephalitis in South Asia. We then
used this method on unidentified reports of
encephalitis outbreaks in South Asia, and
identified several outbreaks as likely being
caused by NiV, which was new to the region at
the time when the outbreaks occurred.
Retrospective studies of several of the NiV
outbreaks identified the causative agent, and our
method provided the correct identification in all
cases, but with a key caveat: when the original
outbreak contained inaccurate information on
one or more outbreak traits (in this case, the
CFR), the method incorrectly classified the
outbreaks. This highlights the strength of the
method when the original outbreak has accurate
information, as well as the importance of the
quality of information in the reporting system.
Unfortunately, inaccurate initial estimates of the
CFR are not infrequent (and difficult to correct
if they result from right-censoring) and can lead
to allocations of public health resources that
might retrospectively be considered less than
ideal, e.g. the 2009 H1N1 pandemic (33-35).
There are limitations to our approach,
and this study provides a proof-of-principle for a
potentially powerful method. As just noted, the
accuracy of our method relies critically on the
accuracy of the data reported and the
completeness of the reports. Furthermore, it is
possible that some outbreaks continued beyond
the last posting of details on ProMED-mail, and
CFRs estimated during an outbreak are known to
be biased (32). Some of these problems could be
mitigated by including data taken at different
stages of outbreaks or by comparing the
unidentified outbreak reports with identified
outbreaks reported via the same source
(ProMED-mail). In addition, even with accurate
information, our method can only provide
probabilities for association with each of the
diseases based on the assumption that it is one of
the diseases. However, while our method is
currently limited by the list of reference diseases
provided, it can also be used to flag reports
which do not seem to fit any of these well. If, for
example, several outbreak reports for a region
were highly clustered with each other but not
with any known disease in the model, then this
would be evidence for a potentially new disease,
or new disease to the region, and could be
prioritized for further investigation. Similarly,
this approach may have value in determining
!
whether exotic pathogens have been introduced
to a region either inadvertently or deliberately.
The ensuing outbreaks may have characteristics
that cause them to cluster with diseases outside
those normally encountered in a region, and an
expanded network analysis may be able to
identify their etiology more rapidly than sample
collection would allow.
Further, this method can be applied
more broadly to extend the range of diseases as
well as hosts under consideration (e.g. zoonotic
disease in wildlife reservoir hosts). Disease
communities with distinct symptoms will be the
best candidates for use with this method.
Encephalitis was an ideal candidate symptom as
it was less common than a symptom such as
fever, but common enough to be shared by a set
of diseases within a single region. Diseases with
respiratory illness, on the other hand, would be
significantly more difficult to differentiate
because of the ubiquitous nature of this
symptom across many possible diseases.
Further research is required to determine the full
potential of this approach and the applicability
of this method to other diseases.
A major strength of our approach is that
it does not require expert judgment or laboratory
analysis, and provides a way to quickly and
inexpensively assess outbreaks. A key direction
for future research would be to compare the
approach we have proposed here to expert
opinion. Comparisons of our method to other
clustering techniques would also be of
substantial interest, but we note that an
important challenge is that many other methods
have substantial difficulty with incomplete data
and unequal weighting of traits, whereas our
method is able to overcome both of these
obstacles. Given the opportunistic nature of
outbreak reports, this is an important strength.
Our method has the potential to greatly
increase the value of surveillance systems like
ProMED-mail, and online surveillance systems
in general, which rapidly disseminate
information on outbreaks prior to the results of
laboratory diagnostics. Although our initial
analysis was restricted to ProMED-mail it is
likely that this method would also be effective
using data that has been collected by filtered
searches such as those used by HealthMap (14).
More generally, the recent increase in the
number of online surveillance tools, and their
speed and efficiency at reporting novel
outbreaks, combined with our analysis approach,
could become a significant rapid identification
tool for diagnosis.
With increasing availability and
capacity of Internet surveillance systems, our
application of network theory to outbreak
assessment demonstrates the inherent, and
underestimated value in collecting key data on
novel outbreaks, and disseminating it early and
openly. There is immense potential in using
methods for automatic text recognition
combined with improvements to our method and
integration with alternative methods for cluster
analysis, to extract as much information as
possible from these reports. Many new
infections such as NiV first emerge in resource-
poor regions, making an intensive and/or active
surveillance system difficult. With relatively
little additional development, the method
presented here could provide a low-cost tool that
allows for the rapid, objective assessment of
outbreaks of diseases at the onset of their
emergence.

!
!
Acknowledgments
This study was made possible by the generous support of the American people through the United States
Agency for International Development (USAID) Emerging Pandemic Threats PREDICT. The contents
are the responsibility of the authors and do not necessarily reflect the views of USAID or the United
States Government. This work was also supported by NIH/NSF “Ecology of Infectious Diseases” awards
from the John E. Fogarty International Center (2R01-TW005869), the NSF (EF-0914866), DTRA
(HDTRA1-13-C-0029), the Rockefeller Foundation, the New York Community Trust, the Eppley
Foundation for Research, Google.org, the National Institutes of Health (1R01AI090159-01), and a
National Science Foundation Human and Social Dynamics “Agents of Change” award (BCS – 0826779
& BCS-0826840). TLB acknowledges the Research and Policy for Infectious Disease Dynamics
(RAPIDD) program of the Science and Technology Directorate, U.S. Department of Homeland Security,
and the Fogarty International Center, NIH for funding. SF acknowledges the EU FP7 funded integrated
project EPIWORK (grant agreement number 231807) for funding. The authors thank J. Bryden, L.
Madoff, N. Wale, J. White, and J. Zelner for assistance in preparing the manuscript
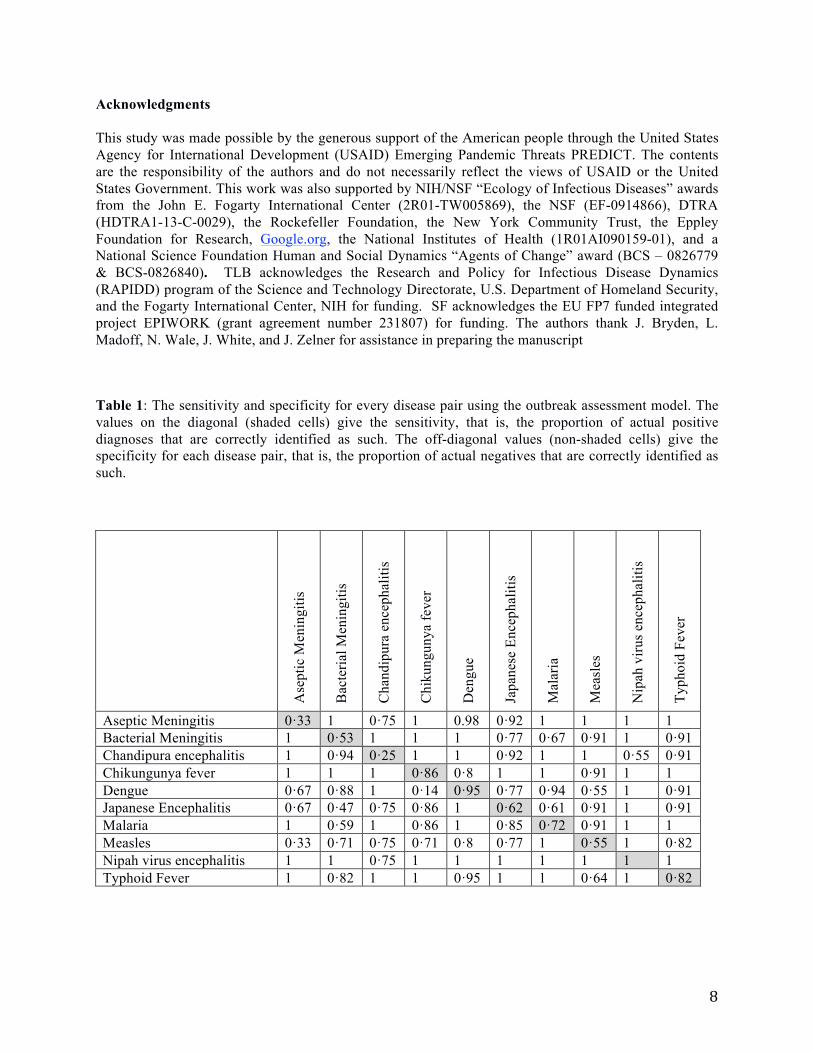
Table 1: The sensitivity and specificity for every disease pair using the outbreak assessment model. The
values on the diagonal (shaded cells) give the sensitivity, that is, the proportion of actual positive
diagnoses that are correctly identified as such. The off-diagonal values (non-shaded cells) give the
specificity for each disease pair, that is, the proportion of actual negatives that are correctly identified as
such.
Ase
pti
c M
enin
git
is
Bac
teri
al M
enin
git
is
Ch
and
ipu
ra e
nce
ph
alit
is
Ch
iku
ng
un
ya
fev
er
Den
gu
e
Jap
anes
e E
nce
ph
alit
is
Mal
aria
Mea
sles
Nip
ah v
iru
s en
cep
hal
itis
Ty
ph
oid
Fev
er
Aseptic Meningitis 0·33 1 0·75 1 0.98 0·92 1 1 1 1
Bacterial Meningitis 1 0·53 1 1 1 0·77 0·67 0·91 1 0·91
Chandipura encephalitis 1 0·94 0·25 1 1 0·92 1 1 0·55 0·91
Chikungunya fever 1 1 1 0·86 0·8 1 1 0·91 1 1
Dengue 0·67 0·88 1 0·14 0·95 0·77 0·94 0·55 1 0·91
Japanese Encephalitis 0·67 0·47 0·75 0·86 1 0·62 0·61 0·91 1 0·91
Malaria 1 0·59 1 0·86 1 0·85 0·72 0·91 1 1
Measles 0·33 0·71 0·75 0·71 0·8 0·77 1 0·55 1 0·82
Nipah virus encephalitis 1 1 0·75 1 1 1 1 1 1 1
Typhoid Fever 1 0·82 1 1 0·95 1 1 0·64 1 0·82
!
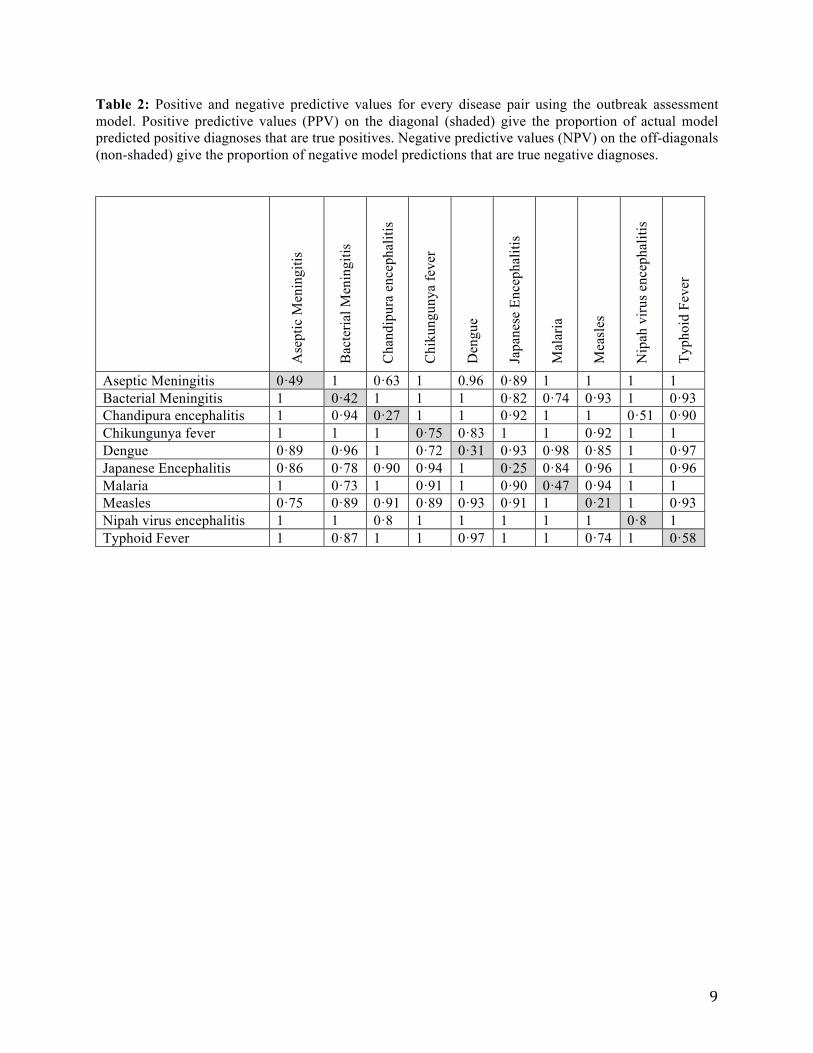
Table 2: Positive and negative predictive values for every disease pair using the outbreak assessment
model. Positive predictive values (PPV) on the diagonal (shaded) give the proportion of actual model
predicted positive diagnoses that are true positives. Negative predictive values (NPV) on the off-diagonals
(non-shaded) give the proportion of negative model predictions that are true negative diagnoses.
Ase
pti
c M
enin
git
is
Bac
teri
al M
enin
git
is
Ch
and
ipu
ra e
nce
ph
alit
is
Ch
iku
ng
un
ya
fev
er
Den
gu
e
Jap
anes
e E
nce
ph
alit
is
Mal
aria
Mea
sles
Nip
ah v
iru
s en
cep
hal
itis
Ty
ph
oid
Fev
er
Aseptic Meningitis 0·49 1 0·63 1 0.96 0·89 1 1 1 1
Bacterial Meningitis 1 0·42 1 1 1 0·82 0·74 0·93 1 0·93
Chandipura encephalitis 1 0·94 0·27 1 1 0·92 1 1 0·51 0·90
Chikungunya fever 1 1 1 0·75 0·83 1 1 0·92 1 1
Dengue 0·89 0·96 1 0·72 0·31 0·93 0·98 0·85 1 0·97
Japanese Encephalitis 0·86 0·78 0·90 0·94 1 0·25 0·84 0·96 1 0·96
Malaria 1 0·73 1 0·91 1 0·90 0·47 0·94 1 1
Measles 0·75 0·89 0·91 0·89 0·93 0·91 1 0·21 1 0·93
Nipah virus encephalitis 1 1 0·8 1 1 1 1 1 0·8 1
Typhoid Fever 1 0·87 1 1 0·97 1 1 0·74 1 0·58
"!
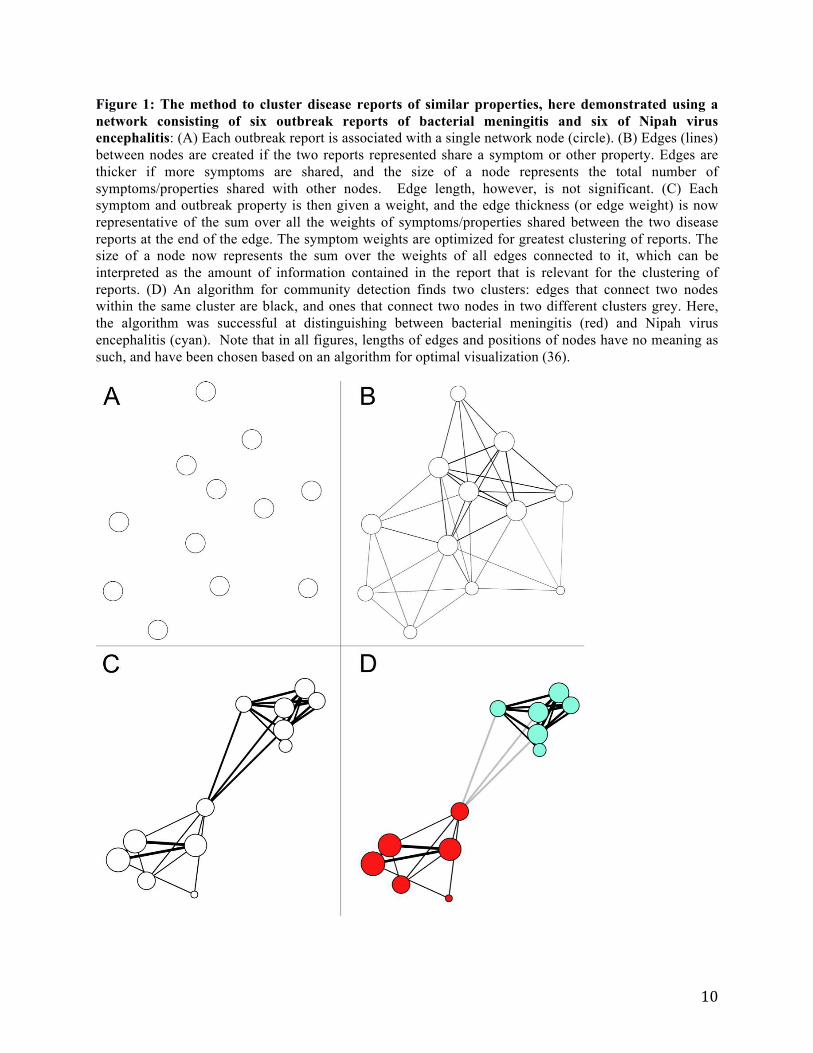
Figure 1: The method to cluster disease reports of similar properties, here demonstrated using a
network consisting of six outbreak reports of bacterial meningitis and six of Nipah virus
encephalitis: (A) Each outbreak report is associated with a single network node (circle). (B) Edges (lines)
between nodes are created if the two reports represented share a symptom or other property. Edges are
thicker if more symptoms are shared, and the size of a node represents the total number of
symptoms/properties shared with other nodes. Edge length, however, is not significant. (C) Each
symptom and outbreak property is then given a weight, and the edge thickness (or edge weight) is now
representative of the sum over all the weights of symptoms/properties shared between the two disease
reports at the end of the edge. The symptom weights are optimized for greatest clustering of reports. The
size of a node now represents the sum over the weights of all edges connected to it, which can be
interpreted as the amount of information contained in the report that is relevant for the clustering of
reports. (D) An algorithm for community detection finds two clusters: edges that connect two nodes
within the same cluster are black, and ones that connect two nodes in two different clusters grey. Here,
the algorithm was successful at distinguishing between bacterial meningitis (red) and Nipah virus
encephalitis (cyan). Note that in all figures, lengths of edges and positions of nodes have no meaning as
such, and have been chosen based on an algorithm for optimal visualization (36).
!!
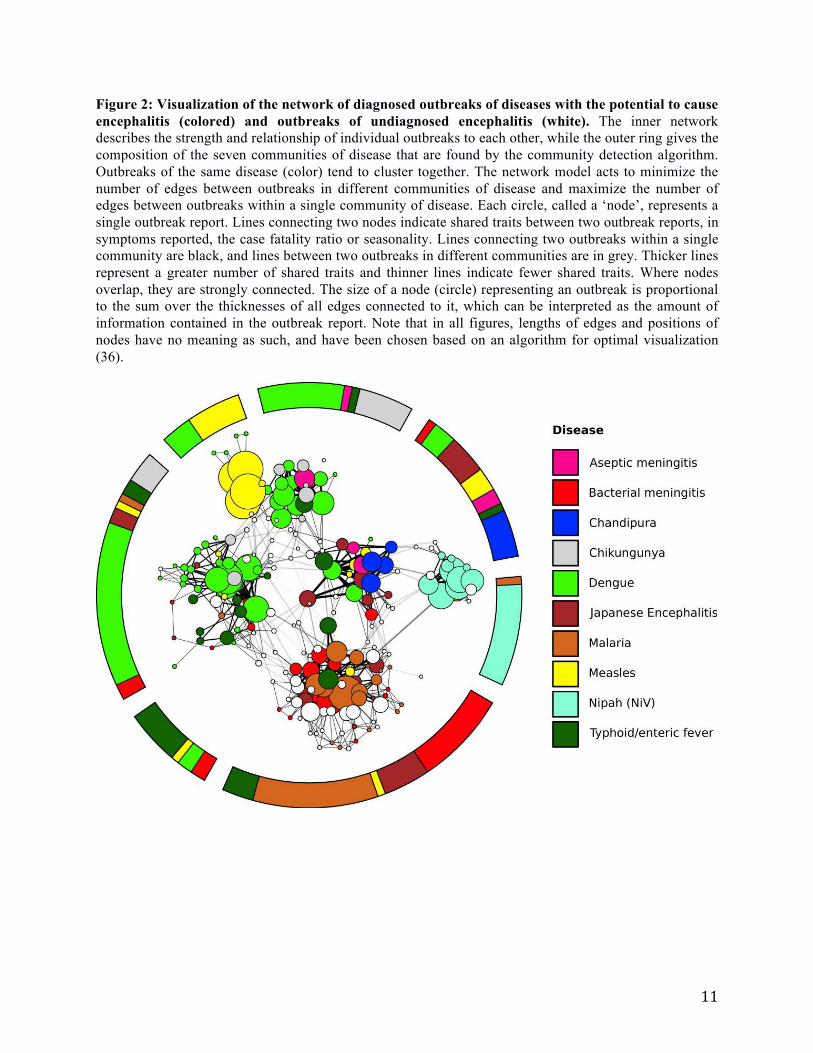
Figure 2: Visualization of the network of diagnosed outbreaks of diseases with the potential to cause
encephalitis (colored) and outbreaks of undiagnosed encephalitis (white). The inner network
describes the strength and relationship of individual outbreaks to each other, while the outer ring gives the
composition of the seven communities of disease that are found by the community detection algorithm.
Outbreaks of the same disease (color) tend to cluster together. The network model acts to minimize the
number of edges between outbreaks in different communities of disease and maximize the number of
edges between outbreaks within a single community of disease. Each circle, called a ‘node’, represents a
single outbreak report. Lines connecting two nodes indicate shared traits between two outbreak reports, in
symptoms reported, the case fatality ratio or seasonality. Lines connecting two outbreaks within a single
community are black, and lines between two outbreaks in different communities are in grey. Thicker lines
represent a greater number of shared traits and thinner lines indicate fewer shared traits. Where nodes
overlap, they are strongly connected. The size of a node (circle) representing an outbreak is proportional
to the sum over the thicknesses of all edges connected to it, which can be interpreted as the amount of
information contained in the outbreak report. Note that in all figures, lengths of edges and positions of
nodes have no meaning as such, and have been chosen based on an algorithm for optimal visualization
(36).
!"
Figure 3: Zoomed in visualization of diagnosed (colored circles) and undiagnosed outbreaks (white
circles) in the Nipah cluster (Fig. 2). Outbreaks are given by ID number (Supplemental Tables S1 and
S3), with outbreaks of Nipah virus encephalitis in cyan and malaria in brown, with undiagnosed outbreaks
in white, as in Fig. 2.
!"
##
#$
%
&'
!
#!
#%
()
% )
)$
!)
$"
$#
$(
$ $)
$!
$& $'
!"
References
1. Wolfe ND, Daszak P, Kilpatrick AM, Burke DS. Bushmeat hunting, deforestation and prediction of
zoonotic emergence. Emerging Infectious Diseases. 2005;11:1822-7.
2. Ferguson NM, Cummings DAT, Cauchemez S, Fraser C, Riley S, Meeyai A, et al. Strategies for
containing an emerging influenza pandemic in Southeast Asia. Nature. 2005 Sep;437(7056):209-14.
3. Weiss RA, McMichael AJ. Social and environmental risk factors in the emergence of infectious
diseases. Nature Medicine. 2004 Dec;10(12):S70-S6.
4. Hufnagel L, Brockmann D, Geisel T. Forecast and control of epidemics in a globalized world.
Proceedings of the National Academy of Sciences of the United States of America. 2004
Oct;101(42):15124-9.
5. Bogich TL, Chunara R, Scales D, Chan E, Pinheiro LC, Chmura AA, et al. Preventing Pandemics Via
International Development: A Systems Approach. PLoS Med. 2012;9(12):e1001354.
6. Felitti VJ. GIDEON: Global infectious disease and epidemiology network. Jama-Journal of the
American Medical Association. 2002 May;287(18):2433-4.
7. Graber M, Mathew A. Performance of a Web-Based Clinical Diagnosis Support System for Internists.
Journal of General Internal Medicine. 2008;23(0):37-40.
8. Miller RA. Computer-assisted diagnostic decision support: history, challenges, and possible paths
forward. Adv Health Sci Educ. 2009 Sep;14:89-106.
9. Shortliffe EH. Computer-programs to support clinical decision-making. Jama-Journal of the
American Medical Association. 1987 Jul;258(1):61-6.
10. Berner ES, Webster GD, Shugerman AA, Jackson JR, ALgina J, Baker AL, et al. Performance of four
computer-based diagnostic systems. New England Journal of Medicine. 1994 June 23,
1994;330(25):1792-6.
11. Warner HR, Toronto AF, Veasey LG, Stephenson R. A Mathematical Approach to Medical
Diagnosis. JAMA: The Journal of the American Medical Association. 1961 July 22,
1961;177(3):177-83.
12. Barnett GO, Cimino JJ, Hupp JA, Hoffer EP. DXPLAIN - An evolving diagnostic decision-support
system. Jama-Journal of the American Medical Association. 1987 Jul;258(1):67-74.
13. Brownstein JS, Freifeld CC, Chan EH, Keller M, Sonricker AL, Mekaru SR, et al. Information
Technology and Global Surveillance of Cases of 2009 H1N1 Influenza. New England Journal of
Medicine. 2010 May;362(18):1731-5.
14. Brownstein JS, Freifeld CC, Madoff LC. Digital Disease Detection - Harnessing the Web for Public
Health Surveillance. New England Journal of Medicine. 2009;360(21):2153-7.
15. Conrad C. Google Flu Trends: Mapping Influenza in Near Real Time. International Journal of
Infectious Diseases. 2010;14:E185-E.
16. FAO, OIE, WHO. GLEWS: Global Early Warning and Response System for Major Animal Diseases,
including Zoonoses. [5 January 2011]; Available from: http://www.glews.net/.
17. Baylis M, Mellor PS, Meiswinkel R. Horse sickness and ENSO in South Africa Nature. 1999 397:574
18. Madoff LC, Woodall JP. The internet and the global monitoring of emerging diseases: Lessons from
the first 10 years of ProMED-mail. Archives of Medical Research. 2005;36:724-30.
19. Everitt BS, Landau S, Leese M. Cluster Analysis. Fourth Edition ed: Taylor & Francis; 2009.
20. Newman MEJ. Networks: An Introduction. Oxford: Oxford University Press; 2010.
21. Wasserman S, Faust K. Social network analysis: Methods and applications: Cambridge University
Press, Cambridge; 1994.
22. Lazer D, Pentland A, Adamic L, Aral S, Barabasi A-L, Brewer D, et al. Computational social science.
Science. 2009 Feb;323(5915):721-3.
23. Granell C, Gomez S, Arena A. Unsupervised clustering analysis: a multiscale complex networks
approach. arXiv:11011890v1 [physicsdata-an]. 2011.
24. Jones KE, Patel N, Levy M, Storeygard A, Balk D, Gittleman JL, et al. Global trends in emerging
infectious diseases. Nature. 2008;451:990-4.
!"
25. Jones KE, Patel NG, Levy MA, Storeygard A, Balk D, Gittleman JL, et al. Global trends in emerging
infectious diseases. Nature. 2008 Feb;451(7181):990-U4.
26. Kumar S. Inadequate research facilities fail to tackle mystery disease. British Medical Journal.
2003;326:12.
27. Edberg SC. Global infectious diseases and epidemiology network (GIDEON): A world wide web-
based program for diagnosis and Informatics in infectious diseases. Clin Infect Dis. 2005
Jan;40(1):123-6.
28. Bryden J, Funk S, Geard N, Bullock S, Jansen VAA. Stability in flux: community structure in
dynamic networks. J R Soc Interface. 2011;8(60):1031-40.
29. Blondel VD, Guillaume JL, Lambiotte R, Lefebvre E. Fast unfolding of communities in large
networks. Journal of Statistical Mechanics: Theory and Experiment. 2008;P10008.
30. Hossain MJ, Gurley ES, Montgomery JM, Bell M, Carroll DS, Hsu VP, et al. Clinical presentation of
nipah virus infection in Bangladesh. Clin Infect Dis. 2008 Apr;46(7):977-84.
31. Hsu VP, Hossain MJ, Parashar UD, Ali MM, Ksiazek TG, Kuzmin I, et al. Nipah virus encephalitis
reemergence, Bangladesh. Emerg Infect Dis. 2004 Dec;10(12):2082-7.
32. Ghani AC, Donnelly CA, Cox DR, Griffin JT, Fraser C, Lam TH, et al. Methods for estimating the
case fatality ratio for a novel, emerging infectious disease. American Journal of Epidemiology.
2005;162(5):479-86.
33. Bautista E, Chorpitayasunondh T, Gao ZC, Harper SA, Shaw M, Uyeki TM, et al. Medical Progress:
Clinical Aspects of Pandemic 2009 Influenza A (H1N1) Virus Infection. New England Journal of
Medicine. 2010 May;362(18):1708-19.
34. Wilson N, Baker MG. The emerging influenza pandemic: estimating the case fatality ratio.
Eurosurveillance. 2009 Jul;14(26):4.
35. Fraser C, Donnelly CA, Cauchemez S, Hanage WP, Van Kerkhove MD, Hollingsworth TD, et al.
Pandemic Potential of a Strain of Influenza A (H1N1): Early Findings. Science. 2009
Jun;324(5934):1557-61.
36. Fruchterman TMJ, Reingold EM. Graph drawing by force-directed placement. Software: Practice and
Experiment. 1991;21(11).