Embed Size (px)
Citation preview
2008 - Jun / 2018BOLETIM ESTATÍSTICOSTATISTICAL BULLETIN
Banco Nacional de AngolaAv. 4 de Fevereiro nº 151 - Luanda - Angola Caixa Postal 1243 Tel.: (+244) 222 679200 www.bna.ao
I - ESTATISTICAS MONETÁRIAS E FINANCEIRAS 10II - ESTATISTICAS SECTOR EXTERNO 10III - ESTATISTICAS DO SECTOR REAL 11IV - PREÇOS 12V - GRÁFICOS 12
I - MONETARY AND FINANCIAL STATISTICS 10II - EXTERNAL SECTOR STATISTICS 10III - REAL SECTOR STATISTICS 11IV - PRICES 12V - GRAPHICS 12
Índice dos principais agregados e gráficos
Main aggregates and graphics index
4 •
Angola Angola
Estatísticas Monetárias Monetary Statistics
Índice Table of Contents
I.A Panorama monetário Monetary Institutions
I.A.1 Síntese Monetária Monetary Survey
I.A.2 Agregados Monetários Monetary Aggregates
I.B Banco Nacional de Angola Banco Nacional de Angola
I.B.1 Síntese do Banco Nacional de Angola National Bank of Angola Survey
I.B.2 Balanço do Banco Nacional de Angola Balance Sheet of the National Bank of Angola
I.B.3 Base Monetária Monetary Base
I.C Outras Instituições Financeiras Monetárias Other Depository Corporations
I.C.1 Síntese das Outras Instituições Financeiras Monetárias Other Depository Corporations Survey
I.C.2 Balanço Consolidado das Outras Instituições Financeiras Monetárias Balance Sheet of the Other Depository Corporations
I.C.3 Repartição do Crédito por Sector Institucional Credit by Institutional Sector
I.C.4 Repartição do Crédito por Ramos de Actividade Credit by Economic Activity
I.C.5 Repartição dos Depósitos nas OIFM Deposit by Other Depository Corporations
I.D Taxas de Juros Interest Rates
I.D.1 Taxas de Juro do Banco Central e do Mercado Monetário Interbancário Central Bank and interbank Interest Rates
I.D.2 Taxas de Juro das Outras Instituições Financeiras Monetárias Other Depository Corporations Interest Rates
II - A. Estatísticas da Balança de Pagamentos Balance of Payments Statistics
II A .1.a) Angola - Balança de Pagamentos: 2008 - 2011 Angola - Balance of Payments 2008 - 2011
II.A.1.b) Angola - Balança de Pagamentos: 2012 - 2017 Angola - Balance of Payments, 2012 - 2017
II A .2 Balança de Pagamentos - Evolução Comparada dos Principais Indicadores Balance of Payments - Main Indicators Evolution
II A .3 Exportações por Países de Destino Exports by Country
II A .4 Composição das Exportações Angola -Composition of Exports
II A .5 Importações Imports
II - B. Estatísticas da Dívida Externa External Debt Statistics
II B .1 Stock da Dívida Externa de Curto, de Médio/Longo Prazo ( 2008-2018*) Stock of Debt, Short, Medium and Long -Term (2008-2018*)
II - C. Estatísticas Cambiais Exchange Rate Statistics
II C . 1 Taxas de Câmbio do Kwanza com relação ao USD Kwanza/USD - Exchange Rate
II C . 2 Taxas de Câmbio de Referência do Kwanza com relação ao Euro, Yen e Rand Kwanza Reference Rate against Euro, Yen and Rand
II C . 3 ndice de Taxa de Câmbio Real Real Exchange Rate Index
II.D.1 Reserva Internacional Liquida (RIL) International Reserves
II.D.1 Reservas Internacionais Liquidas e Liquidez em Moeda Estrangeira International Reserves (net) and Liquidity in Foreign Currency
III. Estatísticas do Sector Real Real Sector Statistics
III.A.1. Produto Interno Bruto por Ramos de Actividade - Preços constantes GDP By Sector-At Constant Price
III.A.2. Produto Interno Bruto por Ramos de Actividade - Estrutura Percentual GDP By Sector-Percentual Structure
IV. Preços Prices
IV.A.1. Índice de Preços ao Consumidor (2008 -2010) Consumer Prices Index (2008-2010)
IV.A.2. Índice de Preços ao Consumidor (2011 - Jun/18) Consumer Prices Index (2011- Jun/18)
IV.A.3. Taxas de Inflação no período Inflation Rates
Índice
BOLETIM ESTATÍSTICO | STATISTICAL BULLETIN | Jun / 2018 • 5
Angola Angola
Estatísticas Monetárias Monetary Statistics
Índice Table of Contents
V Gráfica Graphics
V.A.I. Síntese Monetária Monetary Survey
1 .1. Activos Externos Líquidos do Sistema Bancário Net Foreign Assets
1 .2. Activos Internos Líquidos e Componentes Net Domestic Assets and Components
1 .3. Crédito Interno Líquido e Componentes Net Domestic Claims and Components
1 .4. Crédito à Economia e Componentes Claims on Economy and Components
1 .5. Meios de Pagamentos (M2) e Componentes Money Supply (M2 ) and Components
1 .6. Moeda (M1) e Componentes Money (M1) and Components
V.A .2. Base Monetária Reserve Money/Monetary Base
2.1. Base Monetária e Componentes Reserve Monetary and Components
V.A. 3. Situação dos Depósitos na Banca Comercial Commercial Banks Deposits
3.1. Depósitos Totais por Prazos Total Deposits by Terms
3.2. Depósitos Totais por Moedas Total Deposits by Currency
3.3. Repartição dos Depósitos nas ODC Deposit by Other Depository Corporations
V.A.4. Situação dos Créditos na Banca Comercial Commercial Banks Credit
4.1. Repartição do Crédito por Sector Institucional Credit by Institutional Sector
4.2. Crédito dos Bancos por Moedas Banking Credits by Currency
V.A.5. Taxas de Juro Interest Rates
5.1. Taxas de Redesconto do Banco Central Rediscount Rates
5.2. Taxas de Juro dos Títulos do Banco Central Central Bank Bill Rates
5.3. Taxas das Operações Activas dos Bancos Banking Lending Rates
5.3.1 Taxas das Operações Activas dos Bancos- Sector Empresarial MN Banking Lending Rates DC
5.3.2 Taxas das Operações Activas dos Bancos- Sector Empresarial ME Banking Lending Rates FC
5.4. Taxas das Operações Passivas dos Bancos Deposits Rates of the Banking System
5.4.1 Taxas das Operações Passivas dos Bancos- Sector Empresarial MN Deposits Rates of the Banking System DC
5.4.2 Taxas das Operações Passivas dos Bancos- Sector Empresarial ME Deposits Rates of the Banking System FC
V.B.1 Taxas de Câmbio nos Mercados Formal e Informal Formal and Informal Exchange Rates
1.1. Taxas de Câmbio de Referência e do Mercado Secundário Reference Exchange Rate on Secondary Market
V.B.2 Stock da Dívida Externa Total External Debt Total Stock
2.1. Stock da Dívida Externa Total External Debt Stock
V.C.1 Taxas de Inflação Inflation Rate
1.1. Taxas de Inflação Mensal Monthly Inflation Rate
1.2. Taxas de Inflação Acumulada Cumulate Inflation Rate
Table of Contents

I - ESTATÍSTICAS MONETÁRIAS E FINANCEIRAS
I - MONETARY AND FINANCIAL STATISTICS
8 •
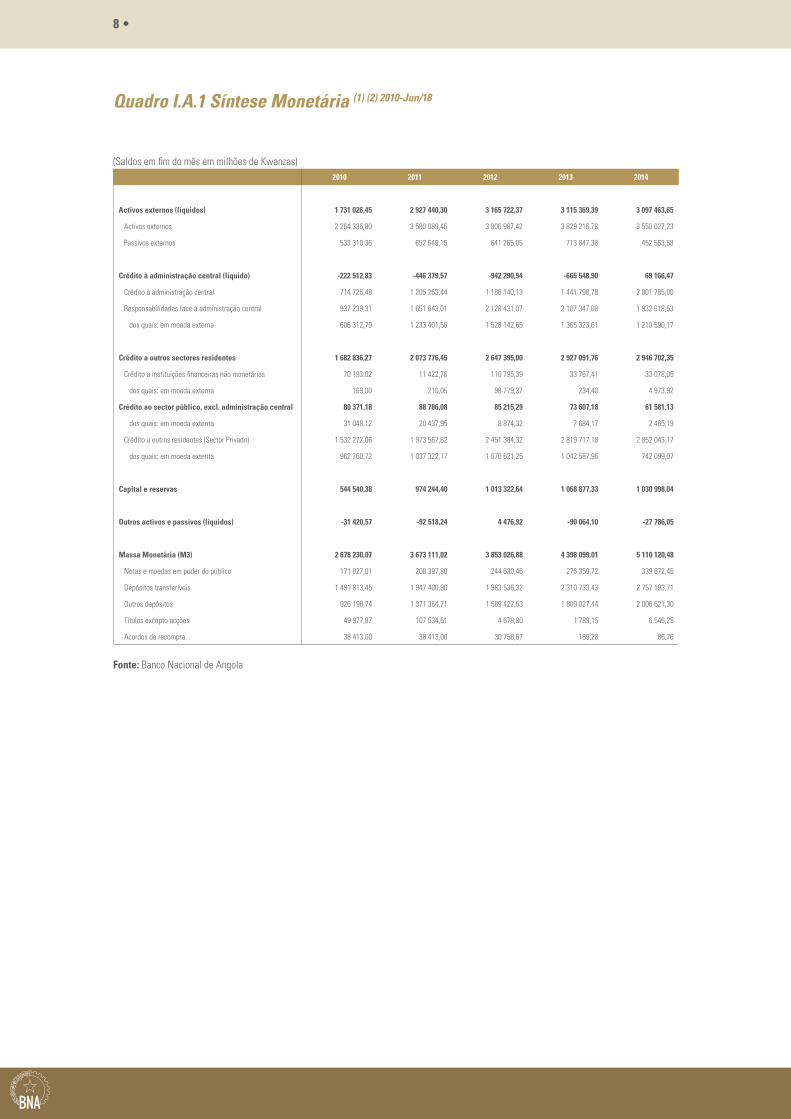
Quadro I.A.1 Síntese Monetária (1) (2) 2010-Jun/18
(Saldos em fim do mês em milhões de Kwanzas)2010 2011 2012 2013 2014
Activos externos (líquidos) 1 731 026,45 2 927 440,30 3 165 722,37 3 115 369,39 3 097 463,65
Activos externos 2 264 336,80 3 580 089,46 3 806 987,42 3 829 216,78 3 550 027,23
Passivos externos 533 310,36 652 649,15 641 265,05 713 847,38 452 563,58
Crédito à administração central (líquido) -222 512,83 -446 379,57 -942 290,94 -665 548,90 69 166,47
Crédito à administração central 714 726,48 1 205 263,44 1 186 140,13 1 441 798,78 2 001 785,00
Responsabilidades face à administração central 937 239,31 1 651 643,01 2 128 431,07 2 107 347,68 1 932 618,53
dos quais: em moeda externa 606 312,79 1 233 401,56 1 528 142,65 1 365 323,61 1 210 590,17
Crédito a outros sectores residentes 1 682 836,27 2 073 776,45 2 647 395,00 2 927 091,76 2 946 702,35
Crédito a instituições financeiras não monetárias 70 193,02 11 422,76 110 795,39 33 767,41 33 078,05
dos quais: em moeda externa 169,00 210,05 98 779,37 234,40 4 973,92
Crédito ao sector público, excl. administração central 80 371,18 88 786,08 85 215,29 73 607,18 61 581,13
dos quais: em moeda externa 31 048,12 20 437,95 8 874,32 7 684,17 2 465,19
Crédito a outros residentes (Sector Privado) 1 532 272,06 1 973 567,62 2 451 384,32 2 819 717,18 2 852 043,17
dos quais: em moeda externa 962 760,72 1 037 322,17 1 070 621,25 1 042 587,96 742 099,07
Capital e reservas 544 540,38 974 244,40 1 013 322,64 1 068 877,33 1 030 998,04
Outros activos e passivos (líquidos) -31 420,57 -92 518,24 4 476,92 -90 064,10 -27 786,05
Massa Monetária (M3) 2 678 230,07 3 673 111,02 3 853 026,88 4 398 099,01 5 110 120,48
Notas e moedas em poder do público 171 827,01 208 397,80 244 630,46 276 359,72 339 672,45
Depósitos transferíveis 1 491 813,45 1 947 400,90 1 983 536,32 2 310 733,43 2 757 193,71
Outros depósitos 926 198,74 1 371 364,71 1 589 422,63 1 809 027,44 2 006 621,30
Títulos excepto acções 49 977,87 107 534,61 4 678,80 1 789,15 6 546,25
Acordos de recompra 38 413,00 38 413,00 30 758,67 189,28 86,76
Fonte: Banco Nacional de Angola
I - ESTATÍSTICAS MONETÁRIAS E FINANCEIRAS | I - MONETARY AND FINANCIAL STATISTICS • 9
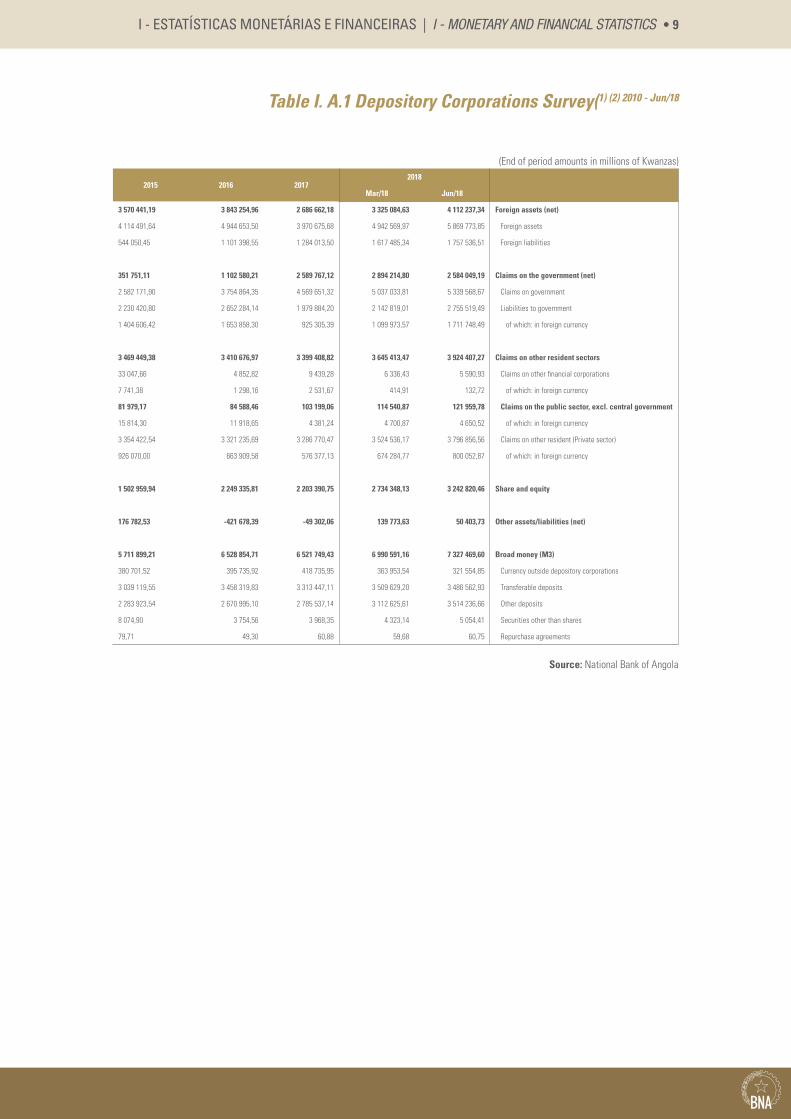
Table I. A.1 Depository Corporations Survey(1) (2) 2010 - Jun/18
(End of period amounts in millions of Kwanzas)
2015 2016 20172018
Mar/18 Jun/18
3 570 441,19 3 843 254,96 2 686 662,18 3 325 084,63 4 112 237,34 Foreign assets (net)
4 114 491,64 4 944 653,50 3 970 675,68 4 942 569,97 5 869 773,85 Foreign assets
544 050,45 1 101 398,55 1 284 013,50 1 617 485,34 1 757 536,51 Foreign liabilities
351 751,11 1 102 580,21 2 589 767,12 2 894 214,80 2 584 049,19 Claims on the government (net)
2 582 171,90 3 754 864,35 4 569 651,32 5 037 033,81 5 339 568,67 Claims on government
2 230 420,80 2 652 284,14 1 979 884,20 2 142 819,01 2 755 519,49 Liabilities to government
1 404 606,42 1 653 858,30 925 305,39 1 099 973,57 1 711 748,49 of which: in foreign currency
3 469 449,38 3 410 676,97 3 399 408,82 3 645 413,47 3 924 407,27 Claims on other resident sectors
33 047,66 4 852,82 9 439,28 6 336,43 5 590,93 Claims on other financial corporations
7 741,38 1 298,16 2 531,67 414,91 132,72 of which: in foreign currency
81 979,17 84 588,46 103 199,06 114 540,87 121 959,78 Claims on the public sector, excl. central government
15 814,30 11 918,65 4 381,24 4 700,87 4 650,52 of which: in foreign currency
3 354 422,54 3 321 235,69 3 286 770,47 3 524 536,17 3 796 856,56 Claims on other resident (Private sector)
926 070,00 663 909,58 576 377,13 674 284,77 800 052,87 of which: in foreign currency
1 502 959,94 2 249 335,81 2 203 390,75 2 734 348,13 3 242 820,46 Share and equity
176 782,53 -421 678,39 -49 302,06 139 773,63 50 403,73 Other assets/liabilities (net)
5 711 899,21 6 528 854,71 6 521 749,43 6 990 591,16 7 327 469,60 Broad money (M3)
380 701,52 395 735,92 418 735,95 363 953,54 321 554,85 Currency outside depository corporations
3 039 119,55 3 458 319,83 3 313 447,11 3 509 629,20 3 486 562,93 Transferable deposits
2 283 923,54 2 670 995,10 2 785 537,14 3 112 625,61 3 514 236,66 Other deposits
8 074,90 3 754,56 3 968,35 4 323,14 5 054,41 Securities other than shares
79,71 49,30 60,88 59,68 60,75 Repurchase agreements
Source: National Bank of Angola
10 •
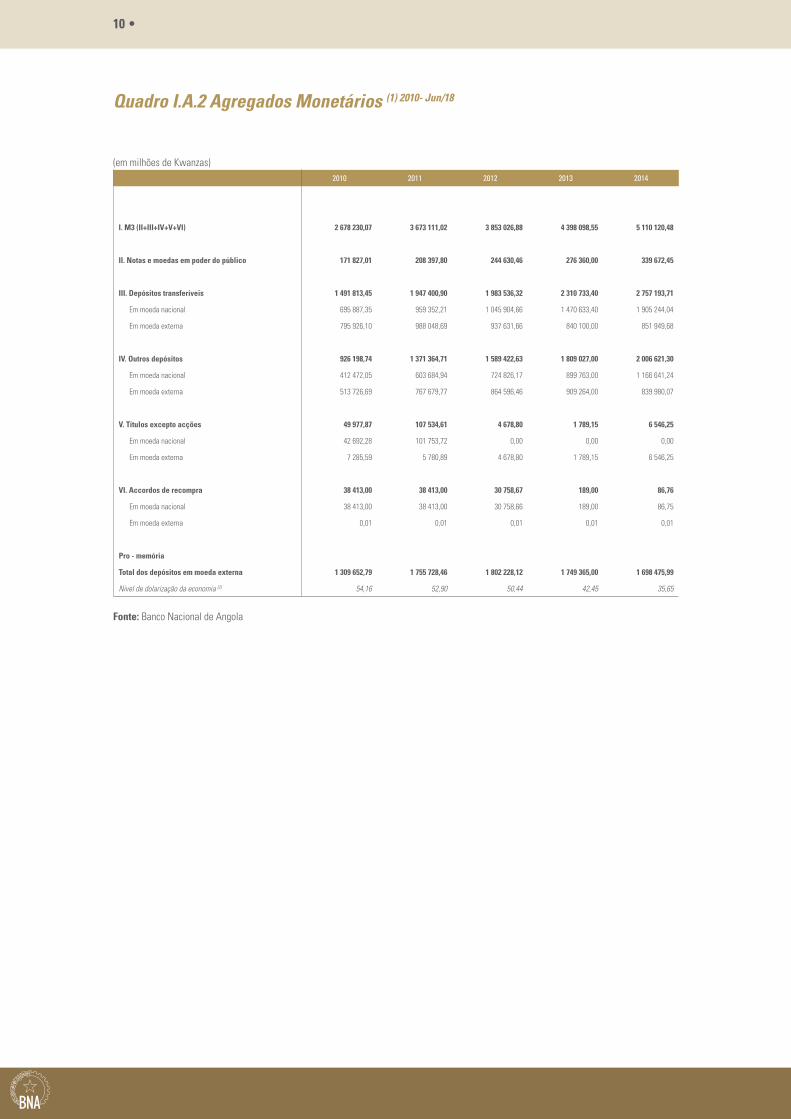
Quadro I.A.2 Agregados Monetários (1) 2010- Jun/18
(em milhões de Kwanzas)2010 2011 2012 2013 2014
I. M3 (II+III+IV+V+VI) 2 678 230,07 3 673 111,02 3 853 026,88 4 398 098,55 5 110 120,48
II. Notas e moedas em poder do público 171 827,01 208 397,80 244 630,46 276 360,00 339 672,45
III. Depósitos transferíveis 1 491 813,45 1 947 400,90 1 983 536,32 2 310 733,40 2 757 193,71
Em moeda nacional 695 887,35 959 352,21 1 045 904,66 1 470 633,40 1 905 244,04
Em moeda externa 795 926,10 988 048,69 937 631,66 840 100,00 851 949,68
IV. Outros depósitos 926 198,74 1 371 364,71 1 589 422,63 1 809 027,00 2 006 621,30
Em moeda nacional 412 472,05 603 684,94 724 826,17 899 763,00 1 166 641,24
Em moeda externa 513 726,69 767 679,77 864 596,46 909 264,00 839 980,07
V. Títulos excepto acções 49 977,87 107 534,61 4 678,80 1 789,15 6 546,25
Em moeda nacional 42 692,28 101 753,72 0,00 0,00 0,00
Em moeda externa 7 285,59 5 780,89 4 678,80 1 789,15 6 546,25
VI. Accordos de recompra 38 413,00 38 413,00 30 758,67 189,00 86,76
Em moeda nacional 38 413,00 38 413,00 30 758,66 189,00 86,75
Em moeda externa 0,01 0,01 0,01 0,01 0,01
Pro - memória
Total dos depósitos em moeda externa 1 309 652,79 1 755 728,46 1 802 228,12 1 749 365,00 1 698 475,99
Nivel de dolarização da economia (2) 54,16 52,90 50,44 42,45 35,65
Fonte: Banco Nacional de Angola
I - ESTATÍSTICAS MONETÁRIAS E FINANCEIRAS | I - MONETARY AND FINANCIAL STATISTICS • 11
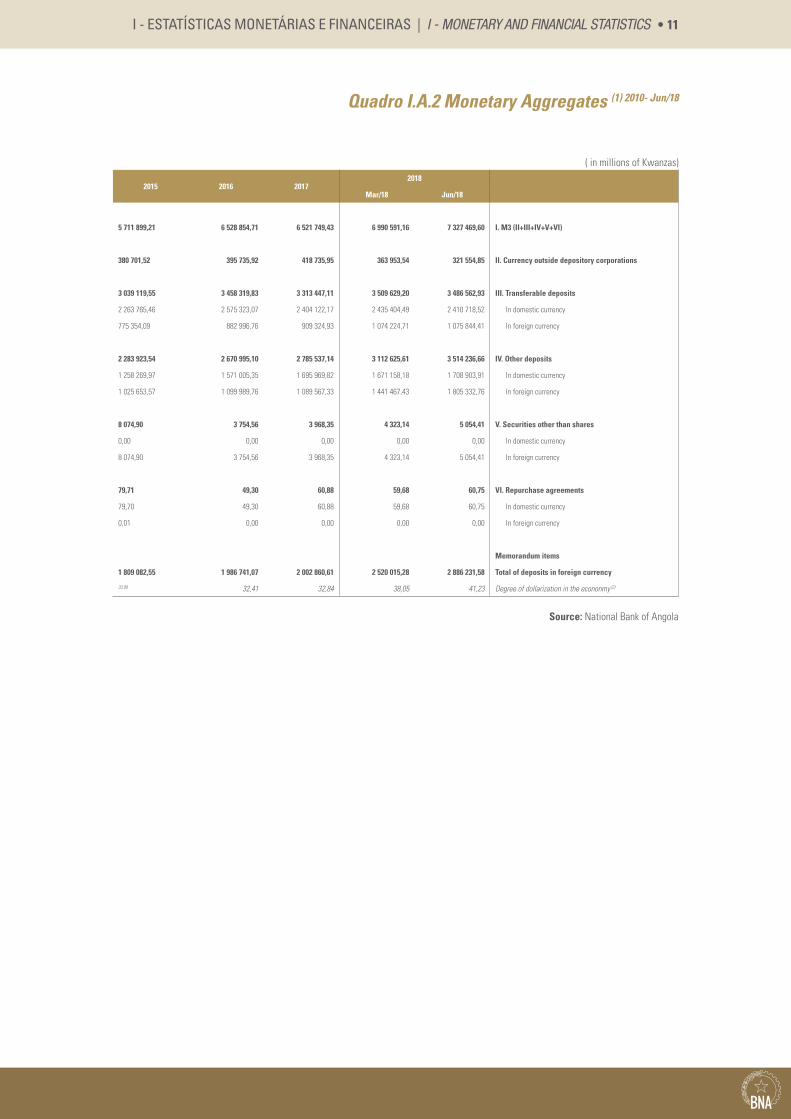
Quadro I.A.2 Monetary Aggregates (1) 2010- Jun/18
( in millions of Kwanzas)
2015 2016 20172018
Mar/18 Jun/18
5 711 899,21 6 528 854,71 6 521 749,43 6 990 591,16 7 327 469,60 I. M3 (II+III+IV+V+VI)
380 701,52 395 735,92 418 735,95 363 953,54 321 554,85 II. Currency outside depository corporations
3 039 119,55 3 458 319,83 3 313 447,11 3 509 629,20 3 486 562,93 III. Transferable deposits
2 263 765,46 2 575 323,07 2 404 122,17 2 435 404,49 2 410 718,52 In domestic currency
775 354,09 882 996,76 909 324,93 1 074 224,71 1 075 844,41 In foreign currency
2 283 923,54 2 670 995,10 2 785 537,14 3 112 625,61 3 514 236,66 IV. Other deposits
1 258 269,97 1 571 005,35 1 695 969,82 1 671 158,18 1 708 903,91 In domestic currency
1 025 653,57 1 099 989,76 1 089 567,33 1 441 467,43 1 805 332,76 In foreign currency
8 074,90 3 754,56 3 968,35 4 323,14 5 054,41 V. Securities other than shares
0,00 0,00 0,00 0,00 0,00 In domestic currency
8 074,90 3 754,56 3 968,35 4 323,14 5 054,41 In foreign currency
79,71 49,30 60,88 59,68 60,75 VI. Repurchase agreements
79,70 49,30 60,88 59,68 60,75 In domestic currency
0,01 0,00 0,00 0,00 0,00 In foreign currency
Memorandum items
1 809 082,55 1 986 741,07 2 002 860,61 2 520 015,28 2 886 231,58 Total of deposits in foreign currency
33,99 32,41 32,84 38,05 41,23 Degree of dollarization in the econonmy (2)
Source: National Bank of Angola
12 •
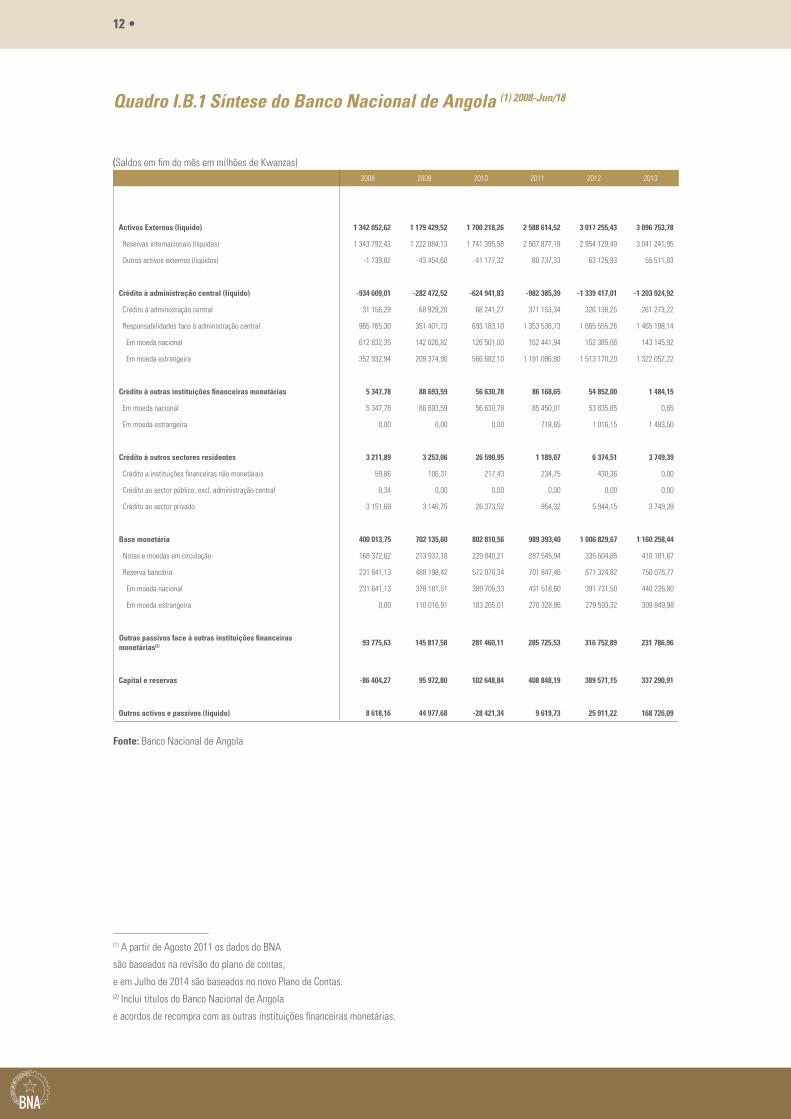
Quadro I.B.1 Síntese do Banco Nacional de Angola (1) 2008-Jun/18
(Saldos em fim do mês em milhões de Kwanzas)2008 2009 2010 2011 2012 2013
Activos Externos (líquido) 1 342 052,62 1 179 429,52 1 700 218,26 2 588 614,52 3 017 255,43 3 096 753,78
Reservas internacionais (líquidas) 1 343 792,43 1 222 884,13 1 741 395,58 2 507 877,19 2 954 129,49 3 041 241,95
Outros activos externos (líquidos) -1 739,82 -43 454,60 -41 177,32 80 737,33 63 125,93 55 511,83
Crédito à administração central (líquido) -934 609,01 -282 472,52 -624 941,83 -982 385,39 -1 339 417,01 -1 203 924,92
Crédito à administração central 31 156,29 68 929,20 68 241,27 371 153,34 326 138,25 261 273,22
Responsabilidades face à administração central 965 765,30 351 401,73 693 183,10 1 353 538,73 1 665 555,26 1 465 198,14
Em moeda nacional 612 832,35 142 026,82 126 501,00 162 441,94 152 385,06 143 145,92
Em moeda estrangeira 352 932,94 209 374,90 566 682,10 1 191 096,80 1 513 170,20 1 322 052,22
Crédito à outras instituições financeiras monetárias 5 347,78 88 693,59 56 630,78 86 168,65 54 852,00 1 484,15
Em moeda nacional 5 347,78 88 693,59 56 630,78 85 450,01 53 835,85 0,65
Em moeda estrangeira 0,00 0,00 0,00 718,65 1 016,15 1 483,50
Crédito à outros sectores residentes 3 211,89 3 253,06 26 590,95 1 189,07 6 374,51 3 749,39
Crédito a instituições financeiras não monetárais 59,86 106,31 217,43 234,75 430,36 0,00
Crédito ao sector público, excl. administração central 0,34 0,00 0,00 0,00 0,00 0,00
Crédito ao sector privado 3 151,69 3 146,75 26 373,52 954,32 5 944,15 3 749,39
Base monetária 400 013,75 702 135,60 802 810,56 989 393,40 1 006 829,67 1 160 258,44
Notas e moedas em circulação 168 372,62 213 937,18 229 840,21 287 545,94 335 504,85 410 181,67
Reserva bancária 231 641,13 488 198,42 572 970,34 701 847,46 671 324,82 750 076,77
Em moeda nacional 231 641,13 378 181,51 389 705,33 431 518,60 391 731,50 440 226,80
Em moeda estrangeira 0,00 110 016,91 183 265,01 270 328,86 279 593,32 309 849,98
Outras passivos face à outras instituições financeiras monetárias(2) 93 775,63 145 817,58 281 460,11 285 725,53 316 752,89 231 786,96
Capital e reservas -86 404,27 95 972,80 102 648,84 408 848,19 389 571,15 337 290,91
Outros activos e passivos (líquido) 8 618,16 44 977,68 -28 421,34 9 619,73 25 911,22 168 726,09
Fonte: Banco Nacional de Angola
(1) A partir de Agosto 2011 os dados do BNA
são baseados na revisão do plano de contas,
e em Julho de 2014 são baseados no novo Plano de Contas.(2) Inclui títulos do Banco Nacional de Angola
e acordos de recompra com as outras instituições financeiras monetárias.
I - ESTATÍSTICAS MONETÁRIAS E FINANCEIRAS | I - MONETARY AND FINANCIAL STATISTICS • 13
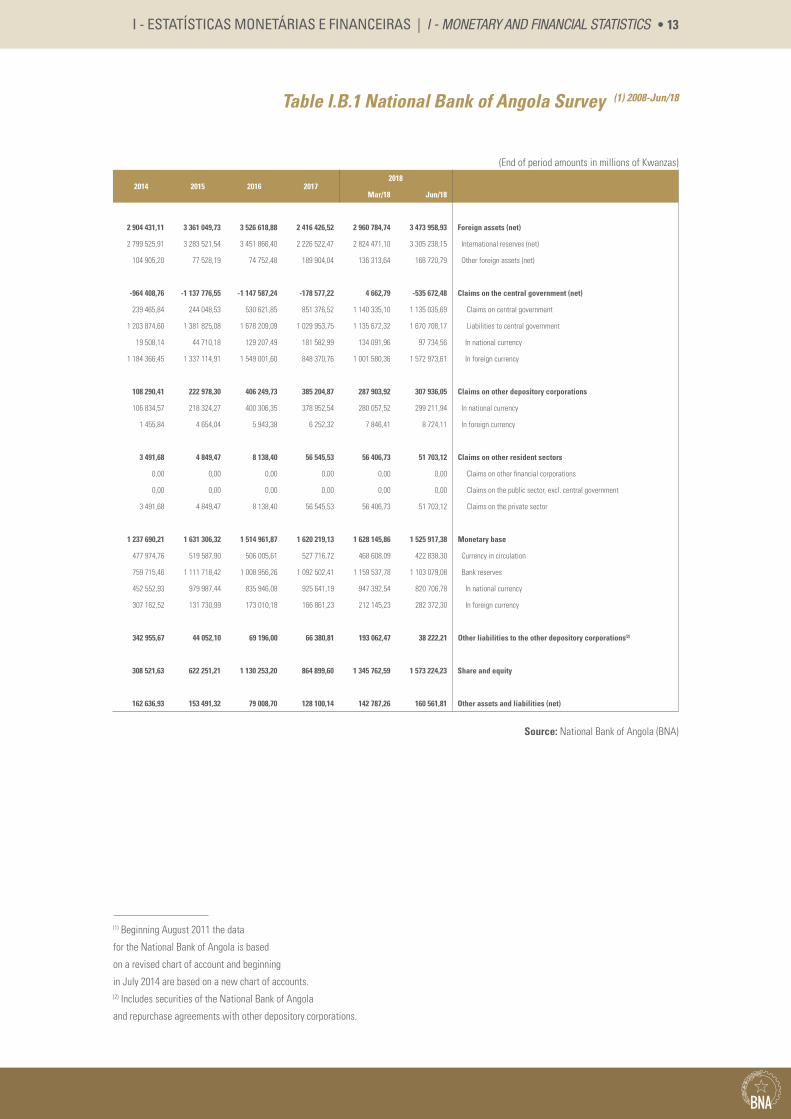
Table I.B.1 National Bank of Angola Survey (1) 2008-Jun/18
(End of period amounts in millions of Kwanzas)
2014 2015 2016 20172018
Mar/18 Jun/18
2 904 431,11 3 361 049,73 3 526 618,88 2 416 426,52 2 960 784,74 3 473 958,93 Foreign assets (net)
2 799 525,91 3 283 521,54 3 451 866,40 2 226 522,47 2 824 471,10 3 305 238,15 International reserves (net)
104 905,20 77 528,19 74 752,48 189 904,04 136 313,64 168 720,79 Other foreign assets (net)
-964 408,76 -1 137 776,55 -1 147 587,24 -178 577,22 4 662,79 -535 672,48 Claims on the central government (net)
239 465,84 244 048,53 530 621,85 851 376,52 1 140 335,10 1 135 035,69 Claims on central government
1 203 874,60 1 381 825,08 1 678 209,09 1 029 953,75 1 135 672,32 1 670 708,17 Liabilities to central government
19 508,14 44 710,18 129 207,49 181 582,99 134 091,96 97 734,56 In national currency
1 184 366,45 1 337 114,91 1 549 001,60 848 370,76 1 001 580,36 1 572 973,61 In foreign currency
108 290,41 222 978,30 406 249,73 385 204,87 287 903,92 307 936,05 Claims on other depository corporations
106 834,57 218 324,27 400 306,35 378 952,54 280 057,52 299 211,94 In national currency
1 455,84 4 654,04 5 943,38 6 252,32 7 846,41 8 724,11 In foreign currency
3 491,68 4 849,47 8 138,40 56 545,53 56 406,73 51 703,12 Claims on other resident sectors
0,00 0,00 0,00 0,00 0,00 0,00 Claims on other financial corporations
0,00 0,00 0,00 0,00 0,00 0,00 Claims on the public sector, excl. central government
3 491,68 4 849,47 8 138,40 56 545,53 56 406,73 51 703,12 Claims on the private sector
1 237 690,21 1 631 306,32 1 514 961,87 1 620 219,13 1 628 145,86 1 525 917,38 Monetary base
477 974,76 519 587,90 506 005,61 527 716,72 468 608,09 422 838,30 Currency in circulation
759 715,46 1 111 718,42 1 008 956,26 1 092 502,41 1 159 537,78 1 103 079,08 Bank reserves
452 552,93 979 987,44 835 946,08 925 641,19 947 392,54 820 706,78 In national currency
307 162,52 131 730,99 173 010,18 166 861,23 212 145,23 282 372,30 In foreign currency
342 955,67 44 052,10 69 196,00 66 380,81 193 062,47 38 222,21 Other liabilities to the other depository corporations(2)
308 521,63 622 251,21 1 130 253,20 864 899,60 1 345 762,59 1 573 224,23 Share and equity
162 636,93 153 491,32 79 008,70 128 100,14 142 787,26 160 561,81 Other assets and liabilities (net)
Source: National Bank of Angola (BNA)
(1) Beginning August 2011 the data
for the National Bank of Angola is based
on a revised chart of account and beginning
in July 2014 are based on a new chart of accounts.(2) Includes securities of the National Bank of Angola
and repurchase agreements with other depository corporations.
14 •
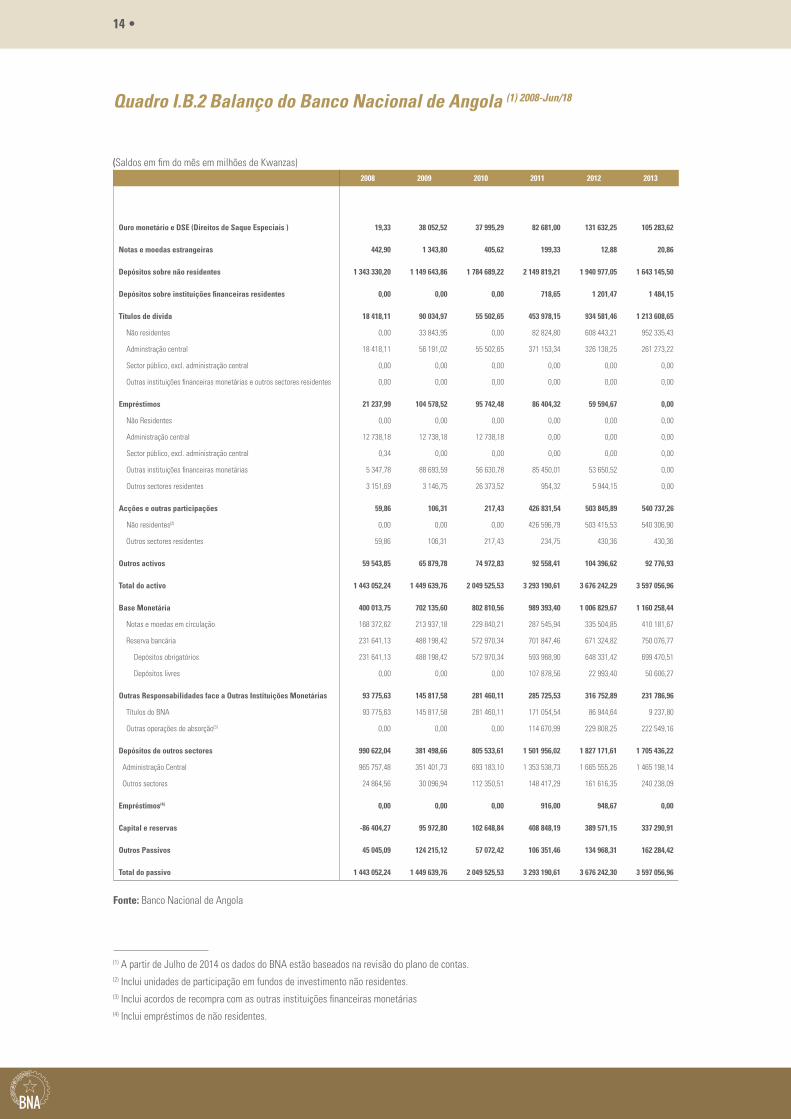
Quadro I.B.2 Balanço do Banco Nacional de Angola (1) 2008-Jun/18
(Saldos em fim do mês em milhões de Kwanzas)2008 2009 2010 2011 2012 2013
Ouro monetário e DSE (Direitos de Saque Especiais ) 19,33 38 052,52 37 995,29 82 681,00 131 632,25 105 283,62
Notas e moedas estrangeiras 442,90 1 343,80 405,62 199,33 12,88 20,86
Depósitos sobre não residentes 1 343 330,20 1 149 643,86 1 784 689,22 2 149 819,21 1 940 977,05 1 643 145,50
Depósitos sobre instituições financeiras residentes 0,00 0,00 0,00 718,65 1 201,47 1 484,15
Títulos de dívida 18 418,11 90 034,97 55 502,65 453 978,15 934 581,46 1 213 608,65
Não residentes 0,00 33 843,95 0,00 82 824,80 608 443,21 952 335,43
Adminstração central 18 418,11 56 191,02 55 502,65 371 153,34 326 138,25 261 273,22
Sector público, excl. administração central 0,00 0,00 0,00 0,00 0,00 0,00
Outras instituições financeiras monetárias e outros sectores residentes 0,00 0,00 0,00 0,00 0,00 0,00
Empréstimos 21 237,99 104 578,52 95 742,48 86 404,32 59 594,67 0,00
Não Residentes 0,00 0,00 0,00 0,00 0,00 0,00
Administração central 12 738,18 12 738,18 12 738,18 0,00 0,00 0,00
Sector público, excl. administração central 0,34 0,00 0,00 0,00 0,00 0,00
Outras instituições financeiras monetárias 5 347,78 88 693,59 56 630,78 85 450,01 53 650,52 0,00
Outros sectores residentes 3 151,69 3 146,75 26 373,52 954,32 5 944,15 0,00
Acções e outras participações 59,86 106,31 217,43 426 831,54 503 845,89 540 737,26
Não residentes(2) 0,00 0,00 0,00 426 596,79 503 415,53 540 306,90
Outros sectores residentes 59,86 106,31 217,43 234,75 430,36 430,36
Outros activos 59 543,85 65 879,78 74 972,83 92 558,41 104 396,62 92 776,93
Total do activo 1 443 052,24 1 449 639,76 2 049 525,53 3 293 190,61 3 676 242,29 3 597 056,96
Base Monetária 400 013,75 702 135,60 802 810,56 989 393,40 1 006 829,67 1 160 258,44
Notas e moedas em circulação 168 372,62 213 937,18 229 840,21 287 545,94 335 504,85 410 181,67
Reserva bancária 231 641,13 488 198,42 572 970,34 701 847,46 671 324,82 750 076,77
Depósitos obrigatórios 231 641,13 488 198,42 572 970,34 593 968,90 648 331,42 699 470,51
Depósitos livres 0,00 0,00 0,00 107 878,56 22 993,40 50 606,27
Outras Responsabilidades face a Outras Instituições Monetárias 93 775,63 145 817,58 281 460,11 285 725,53 316 752,89 231 786,96
Títulos do BNA 93 775,63 145 817,58 281 460,11 171 054,54 86 944,64 9 237,80
Outras operações de absorção(3) 0,00 0,00 0,00 114 670,99 229 808,25 222 549,16
Depósitos de outros sectores 990 622,04 381 498,66 805 533,61 1 501 956,02 1 827 171,61 1 705 436,22
Administração Central 965 757,48 351 401,73 693 183,10 1 353 538,73 1 665 555,26 1 465 198,14
Outros sectores 24 864,56 30 096,94 112 350,51 148 417,29 161 616,35 240 238,09
Empréstimos(4) 0,00 0,00 0,00 916,00 948,67 0,00
Capital e reservas -86 404,27 95 972,80 102 648,84 408 848,19 389 571,15 337 290,91
Outros Passivos 45 045,09 124 215,12 57 072,42 106 351,46 134 968,31 162 284,42
Total do passivo 1 443 052,24 1 449 639,76 2 049 525,53 3 293 190,61 3 676 242,30 3 597 056,96
Fonte: Banco Nacional de Angola
(1) A partir de Julho de 2014 os dados do BNA estão baseados na revisão do plano de contas.(2) Inclui unidades de participação em fundos de investimento não residentes.(3) Inclui acordos de recompra com as outras instituições financeiras monetárias(4) Inclui empréstimos de não residentes.
I - ESTATÍSTICAS MONETÁRIAS E FINANCEIRAS | I - MONETARY AND FINANCIAL STATISTICS • 15
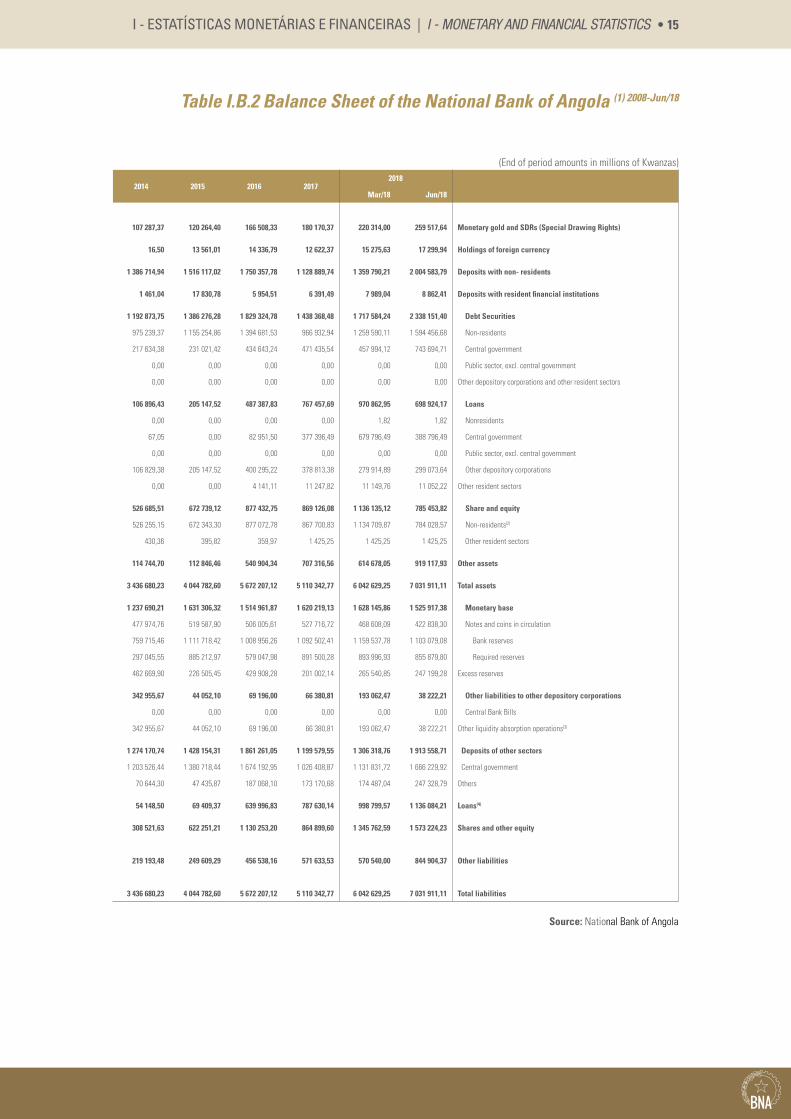
Table I.B.2 Balance Sheet of the National Bank of Angola (1) 2008-Jun/18
(End of period amounts in millions of Kwanzas)
2014 2015 2016 20172018
Mar/18 Jun/18
107 287,37 120 264,40 166 508,33 180 170,37 220 314,00 259 517,64 Monetary gold and SDRs (Special Drawing Rights)
16,50 13 561,01 14 336,79 12 622,37 15 275,63 17 299,94 Holdings of foreign currency
1 386 714,94 1 516 117,02 1 750 357,78 1 128 889,74 1 359 790,21 2 004 583,79 Deposits with non- residents
1 461,04 17 830,78 5 954,51 6 391,49 7 989,04 8 862,41 Deposits with resident financial institutions
1 192 873,75 1 386 276,28 1 829 324,78 1 438 368,48 1 717 584,24 2 338 151,40 Debt Securities
975 239,37 1 155 254,86 1 394 681,53 966 932,94 1 259 590,11 1 594 456,68 Non-residents
217 634,38 231 021,42 434 643,24 471 435,54 457 994,12 743 694,71 Central government
0,00 0,00 0,00 0,00 0,00 0,00 Public sector, excl. central government
0,00 0,00 0,00 0,00 0,00 0,00 Other depository corporations and other resident sectors
106 896,43 205 147,52 487 387,83 767 457,69 970 862,95 698 924,17 Loans
0,00 0,00 0,00 0,00 1,82 1,82 Nonresidents
67,05 0,00 82 951,50 377 396,49 679 796,49 388 796,49 Central government
0,00 0,00 0,00 0,00 0,00 0,00 Public sector, excl. central government
106 829,38 205 147,52 400 295,22 378 813,38 279 914,89 299 073,64 Other depository corporations
0,00 0,00 4 141,11 11 247,82 11 149,76 11 052,22 Other resident sectors
526 685,51 672 739,12 877 432,75 869 126,08 1 136 135,12 785 453,82 Share and equity
526 255,15 672 343,30 877 072,78 867 700,83 1 134 709,87 784 028,57 Non-residents(2)
430,36 395,82 359,97 1 425,25 1 425,25 1 425,25 Other resident sectors
114 744,70 112 846,46 540 904,34 707 316,56 614 678,05 919 117,93 Other assets
3 436 680,23 4 044 782,60 5 672 207,12 5 110 342,77 6 042 629,25 7 031 911,11 Total assets
1 237 690,21 1 631 306,32 1 514 961,87 1 620 219,13 1 628 145,86 1 525 917,38 Monetary base
477 974,76 519 587,90 506 005,61 527 716,72 468 608,09 422 838,30 Notes and coins in circulation
759 715,46 1 111 718,42 1 008 956,26 1 092 502,41 1 159 537,78 1 103 079,08 Bank reserves
297 045,55 885 212,97 579 047,98 891 500,28 893 996,93 855 879,80 Required reserves
462 669,90 226 505,45 429 908,28 201 002,14 265 540,85 247 199,28 Excess reserves
342 955,67 44 052,10 69 196,00 66 380,81 193 062,47 38 222,21 Other liabilities to other depository corporations
0,00 0,00 0,00 0,00 0,00 0,00 Central Bank Bills
342 955,67 44 052,10 69 196,00 66 380,81 193 062,47 38 222,21 Other liquidity absorption operations(3)
1 274 170,74 1 428 154,31 1 861 261,05 1 199 579,55 1 306 318,76 1 913 558,71 Deposits of other sectors
1 203 526,44 1 380 718,44 1 674 192,95 1 026 408,87 1 131 831,72 1 666 229,92 Central government
70 644,30 47 435,87 187 068,10 173 170,68 174 487,04 247 328,79 Others
54 148,50 69 409,37 639 996,83 787 630,14 998 799,57 1 136 084,21 Loans(4)
308 521,63 622 251,21 1 130 253,20 864 899,60 1 345 762,59 1 573 224,23 Shares and other equity
219 193,48 249 609,29 456 538,16 571 633,53 570 540,00 844 904,37 Other liabilities
3 436 680,23 4 044 782,60 5 672 207,12 5 110 342,77 6 042 629,25 7 031 911,11 Total liabilities
Source: National Bank of Angola
16 •
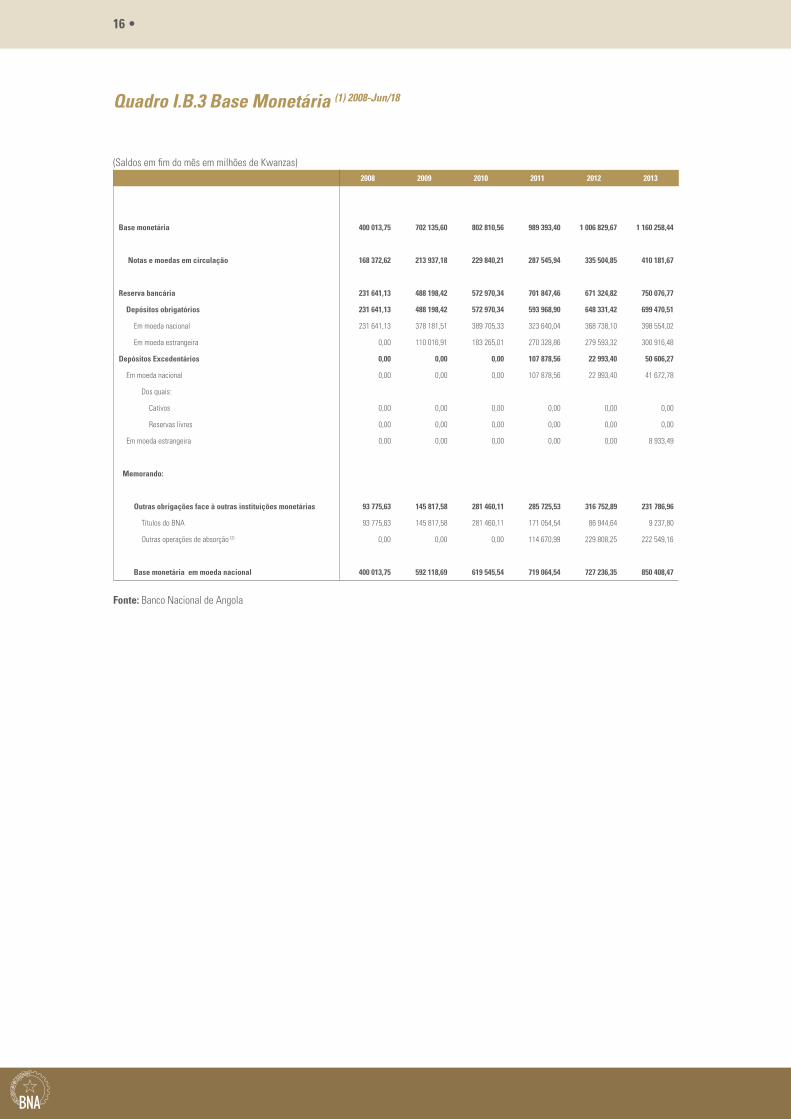
Quadro I.B.3 Base Monetária (1) 2008-Jun/18
(Saldos em fim do mês em milhões de Kwanzas)2008 2009 2010 2011 2012 2013
Base monetária 400 013,75 702 135,60 802 810,56 989 393,40 1 006 829,67 1 160 258,44
Notas e moedas em circulação 168 372,62 213 937,18 229 840,21 287 545,94 335 504,85 410 181,67
Reserva bancária 231 641,13 488 198,42 572 970,34 701 847,46 671 324,82 750 076,77
Depósitos obrigatórios 231 641,13 488 198,42 572 970,34 593 968,90 648 331,42 699 470,51
Em moeda nacional 231 641,13 378 181,51 389 705,33 323 640,04 368 738,10 398 554,02
Em moeda estrangeira 0,00 110 016,91 183 265,01 270 328,86 279 593,32 300 916,48
Depósitos Excedentários 0,00 0,00 0,00 107 878,56 22 993,40 50 606,27
Em moeda nacional 0,00 0,00 0,00 107 878,56 22 993,40 41 672,78
Dos quais:
Cativos 0,00 0,00 0,00 0,00 0,00 0,00
Reservas livres 0,00 0,00 0,00 0,00 0,00 0,00
Em moeda estrangeira 0,00 0,00 0,00 0,00 0,00 8 933,49
Memorando:
Outras obrigações face à outras instituições monetárias 93 775,63 145 817,58 281 460,11 285 725,53 316 752,89 231 786,96
Títulos do BNA 93 775,63 145 817,58 281 460,11 171 054,54 86 944,64 9 237,80
Outras operações de absorção (2) 0,00 0,00 0,00 114 670,99 229 808,25 222 549,16
Base monetária em moeda nacional 400 013,75 592 118,69 619 545,54 719 064,54 727 236,35 850 408,47
Fonte: Banco Nacional de Angola
I - ESTATÍSTICAS MONETÁRIAS E FINANCEIRAS | I - MONETARY AND FINANCIAL STATISTICS • 17
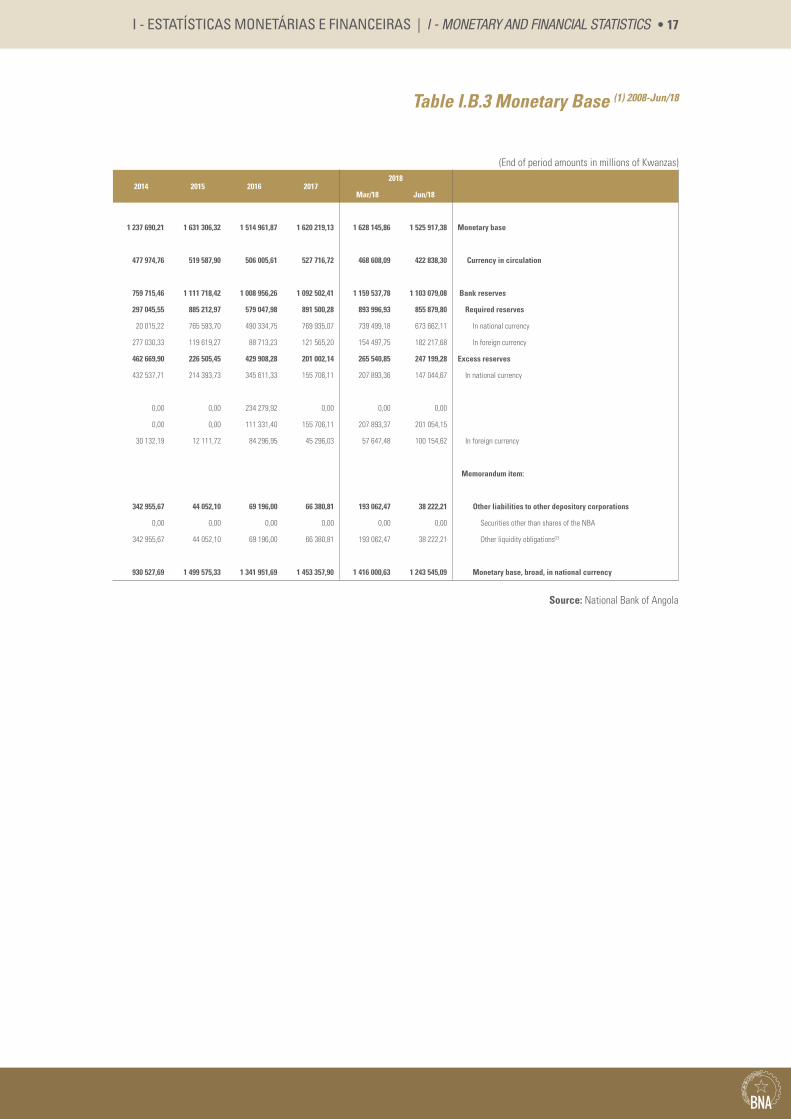
Table I.B.3 Monetary Base (1) 2008-Jun/18
(End of period amounts in millions of Kwanzas)
2014 2015 2016 20172018
Mar/18 Jun/18
1 237 690,21 1 631 306,32 1 514 961,87 1 620 219,13 1 628 145,86 1 525 917,38 Monetary base
477 974,76 519 587,90 506 005,61 527 716,72 468 608,09 422 838,30 Currency in circulation
759 715,46 1 111 718,42 1 008 956,26 1 092 502,41 1 159 537,78 1 103 079,08 Bank reserves
297 045,55 885 212,97 579 047,98 891 500,28 893 996,93 855 879,80 Required reserves
20 015,22 765 593,70 490 334,75 769 935,07 739 499,18 673 662,11 In national currency
277 030,33 119 619,27 88 713,23 121 565,20 154 497,75 182 217,68 In foreign currency
462 669,90 226 505,45 429 908,28 201 002,14 265 540,85 247 199,28 Excess reserves
432 537,71 214 393,73 345 611,33 155 706,11 207 893,36 147 044,67 In national currency
0,00 0,00 234 279,92 0,00 0,00 0,00
0,00 0,00 111 331,40 155 706,11 207 893,37 201 054,15
30 132,19 12 111,72 84 296,95 45 296,03 57 647,48 100 154,62 In foreign currency
Memorandum item:
342 955,67 44 052,10 69 196,00 66 380,81 193 062,47 38 222,21 Other liabilities to other depository corporations
0,00 0,00 0,00 0,00 0,00 0,00 Securities other than shares of the NBA
342 955,67 44 052,10 69 196,00 66 380,81 193 062,47 38 222,21 Other liquidity obligations(2)
930 527,69 1 499 575,33 1 341 951,69 1 453 357,90 1 416 000,63 1 243 545,09 Monetary base, broad, in national currency
Source: National Bank of Angola
18 •
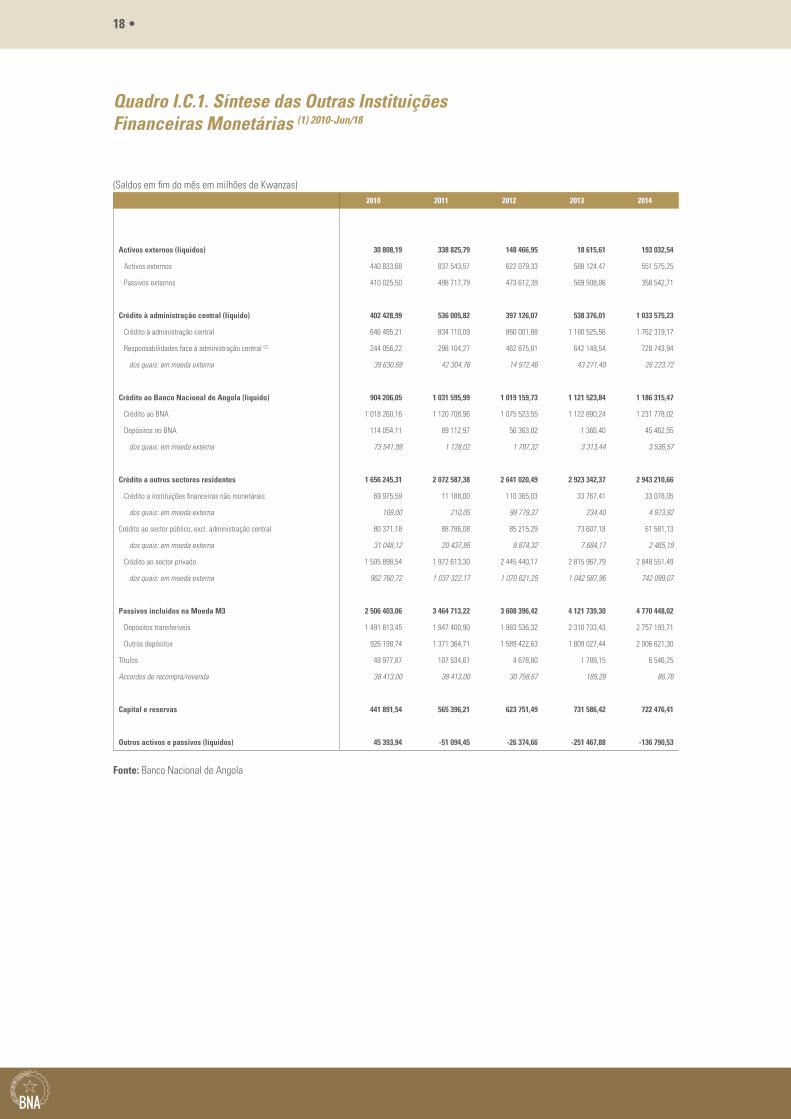
Quadro I.C.1. Síntese das Outras Instituições Financeiras Monetárias (1) 2010-Jun/18
(Saldos em fim do mês em milhões de Kwanzas)2010 2011 2012 2013 2014
Activos externos (líquidos) 30 808,19 338 825,79 148 466,95 18 615,61 193 032,54
Activos externos 440 833,68 837 543,57 622 079,33 588 124,47 551 575,25
Passivos externos 410 025,50 498 717,79 473 612,39 569 508,86 358 542,71
Crédito à administração central (líquido) 402 428,99 536 005,82 397 126,07 538 376,01 1 033 575,23
Crédito à administração central 646 485,21 834 110,09 860 001,88 1 180 525,56 1 762 319,17
Responsabilidades face à administração central (2) 244 056,22 298 104,27 462 875,81 642 149,54 728 743,94
dos quais: em moeda externa 39 630,69 42 304,76 14 972,46 43 271,40 26 223,72
Crédito ao Banco Nacional de Angola (líquido) 904 206,05 1 031 595,99 1 019 159,73 1 121 523,84 1 186 315,47
Crédito ao BNA 1 018 260,16 1 120 708,96 1 075 523,55 1 122 890,24 1 231 778,02
Depósitos no BNA 114 054,11 89 112,97 56 363,82 1 366,40 45 462,55
dos quais: em moeda externa 73 541,99 1 128,02 1 797,32 3 313,44 3 536,57
Crédito a outros sectores residentes 1 656 245,31 2 072 587,38 2 641 020,49 2 923 342,37 2 943 210,66
Crédito a instituições financeiras não monetárais 69 975,59 11 188,00 110 365,03 33 767,41 33 078,05
dos quais: em moeda externa 169,00 210,05 98 779,37 234,40 4 973,92
Crédito ao sector público, excl. administração central 80 371,18 88 786,08 85 215,29 73 607,18 61 581,13
dos quais: em moeda externa 31 048,12 20 437,95 8 874,32 7 684,17 2 465,19
Crédito ao sector privado 1 505 898,54 1 972 613,30 2 445 440,17 2 815 967,79 2 848 551,49
dos quais: em moeda externa 962 760,72 1 037 322,17 1 070 621,25 1 042 587,96 742 099,07
Passivos incluídos na Moeda M3 2 506 403,06 3 464 713,22 3 608 396,42 4 121 739,30 4 770 448,02
Depósitos transferíveis 1 491 813,45 1 947 400,90 1 983 536,32 2 310 733,43 2 757 193,71
Outros depósitos 926 198,74 1 371 364,71 1 589 422,63 1 809 027,44 2 006 621,30
Títulos 49 977,87 107 534,61 4 678,80 1 789,15 6 546,25
Accordos de recompra/revenda 38 413,00 38 413,00 30 758,67 189,28 86,76
Capital e reservas 441 891,54 565 396,21 623 751,49 731 586,42 722 476,41
Outros activos e passivos (líquidos) 45 393,94 -51 094,45 -26 374,66 -251 467,88 -136 790,53
Fonte: Banco Nacional de Angola
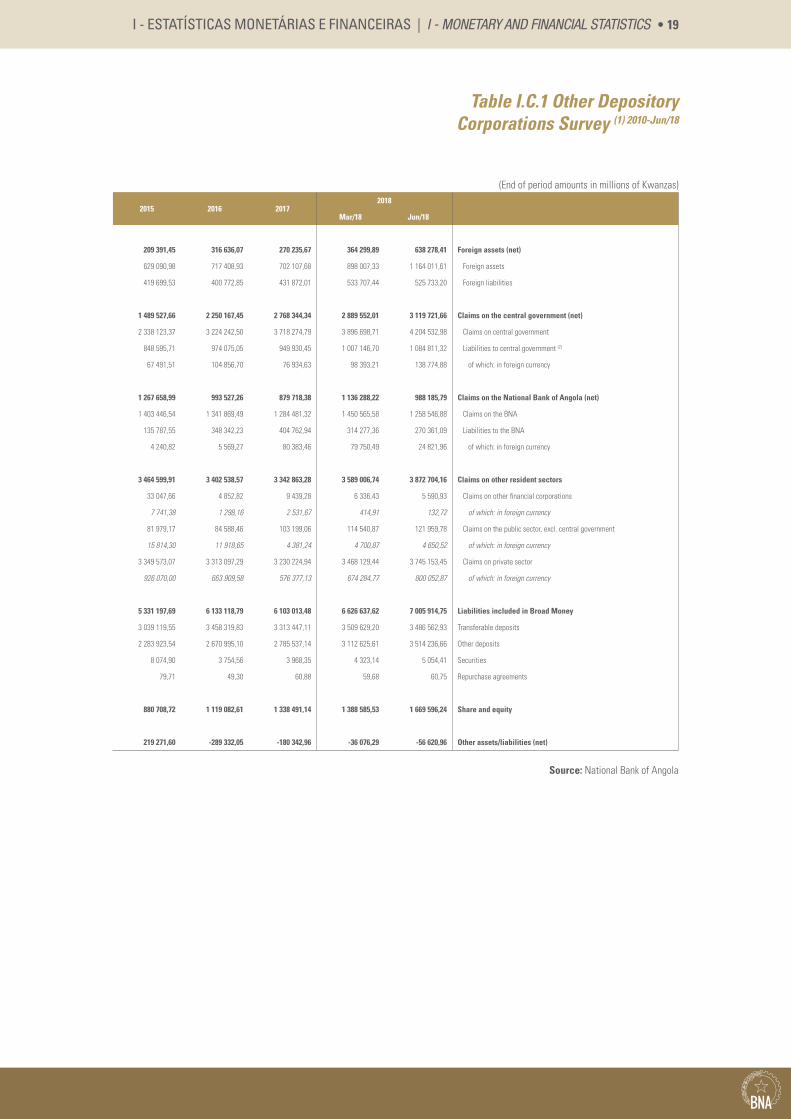
I - ESTATÍSTICAS MONETÁRIAS E FINANCEIRAS | I - MONETARY AND FINANCIAL STATISTICS • 19
Table I.C.1 Other Depository Corporations Survey (1) 2010-Jun/18
(End of period amounts in millions of Kwanzas)
2015 2016 20172018
Mar/18 Jun/18
209 391,45 316 636,07 270 235,67 364 299,89 638 278,41 Foreign assets (net)
629 090,98 717 408,93 702 107,68 898 007,33 1 164 011,61 Foreign assets
419 699,53 400 772,85 431 872,01 533 707,44 525 733,20 Foreign liabilities
1 489 527,66 2 250 167,45 2 768 344,34 2 889 552,01 3 119 721,66 Claims on the central government (net)
2 338 123,37 3 224 242,50 3 718 274,79 3 896 698,71 4 204 532,98 Claims on central government
848 595,71 974 075,05 949 930,45 1 007 146,70 1 084 811,32 Liabilities to central government (2)
67 491,51 104 856,70 76 934,63 98 393,21 138 774,88 of which: in foreign currency
1 267 658,99 993 527,26 879 718,38 1 136 288,22 988 185,79 Claims on the National Bank of Angola (net)
1 403 446,54 1 341 869,49 1 284 481,32 1 450 565,58 1 258 546,88 Claims on the BNA
135 787,55 348 342,23 404 762,94 314 277,36 270 361,09 Liabilities to the BNA
4 240,82 5 569,27 80 383,46 79 750,49 24 821,96 of which: in foreign currency
3 464 599,91 3 402 538,57 3 342 863,28 3 589 006,74 3 872 704,16 Claims on other resident sectors
33 047,66 4 852,82 9 439,28 6 336,43 5 590,93 Claims on other financial corporations
7 741,38 1 298,16 2 531,67 414,91 132,72 of which: in foreign currency
81 979,17 84 588,46 103 199,06 114 540,87 121 959,78 Claims on the public sector, excl. central government
15 814,30 11 918,65 4 381,24 4 700,87 4 650,52 of which: in foreign currency
3 349 573,07 3 313 097,29 3 230 224,94 3 468 129,44 3 745 153,45 Claims on private sector
926 070,00 663 909,58 576 377,13 674 284,77 800 052,87 of which: in foreign currency
5 331 197,69 6 133 118,79 6 103 013,48 6 626 637,62 7 005 914,75 Liabilities included in Broad Money
3 039 119,55 3 458 319,83 3 313 447,11 3 509 629,20 3 486 562,93 Transferable deposits
2 283 923,54 2 670 995,10 2 785 537,14 3 112 625,61 3 514 236,66 Other deposits
8 074,90 3 754,56 3 968,35 4 323,14 5 054,41 Securities
79,71 49,30 60,88 59,68 60,75 Repurchase agreements
880 708,72 1 119 082,61 1 338 491,14 1 388 585,53 1 669 596,24 Share and equity
219 271,60 -289 332,05 -180 342,96 -36 076,29 -56 620,96 Other assets/liabilities (net)
Source: National Bank of Angola
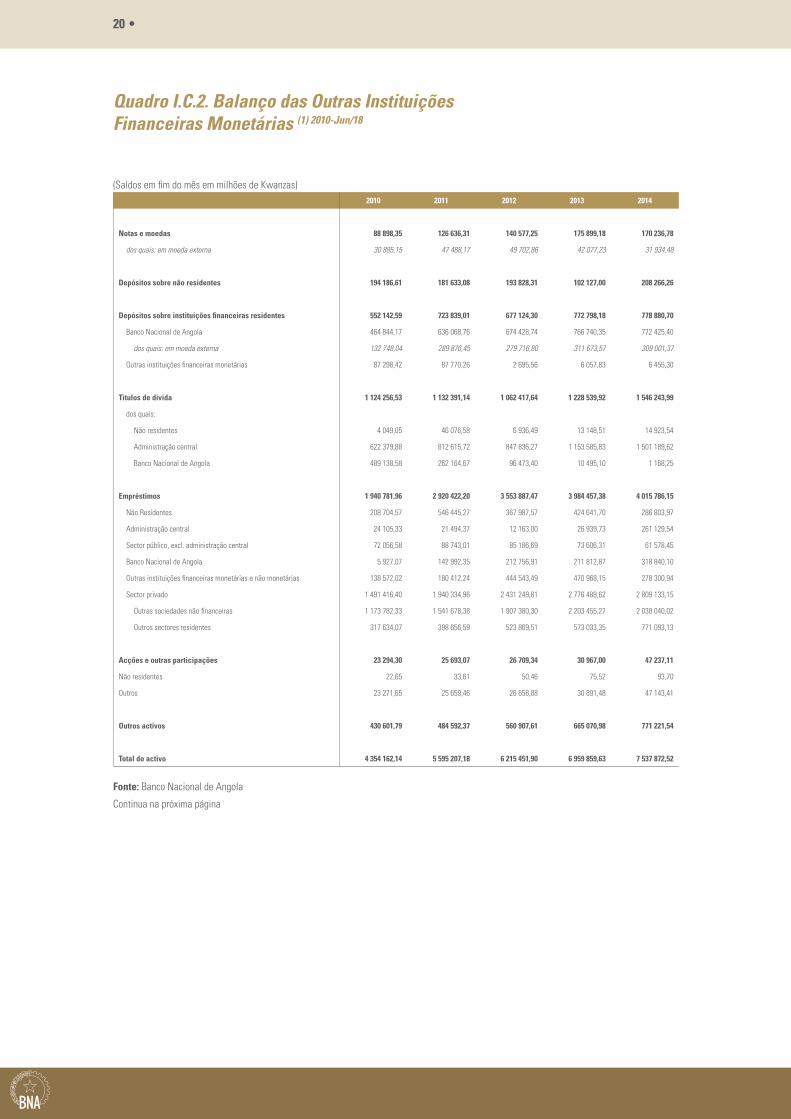
20 •
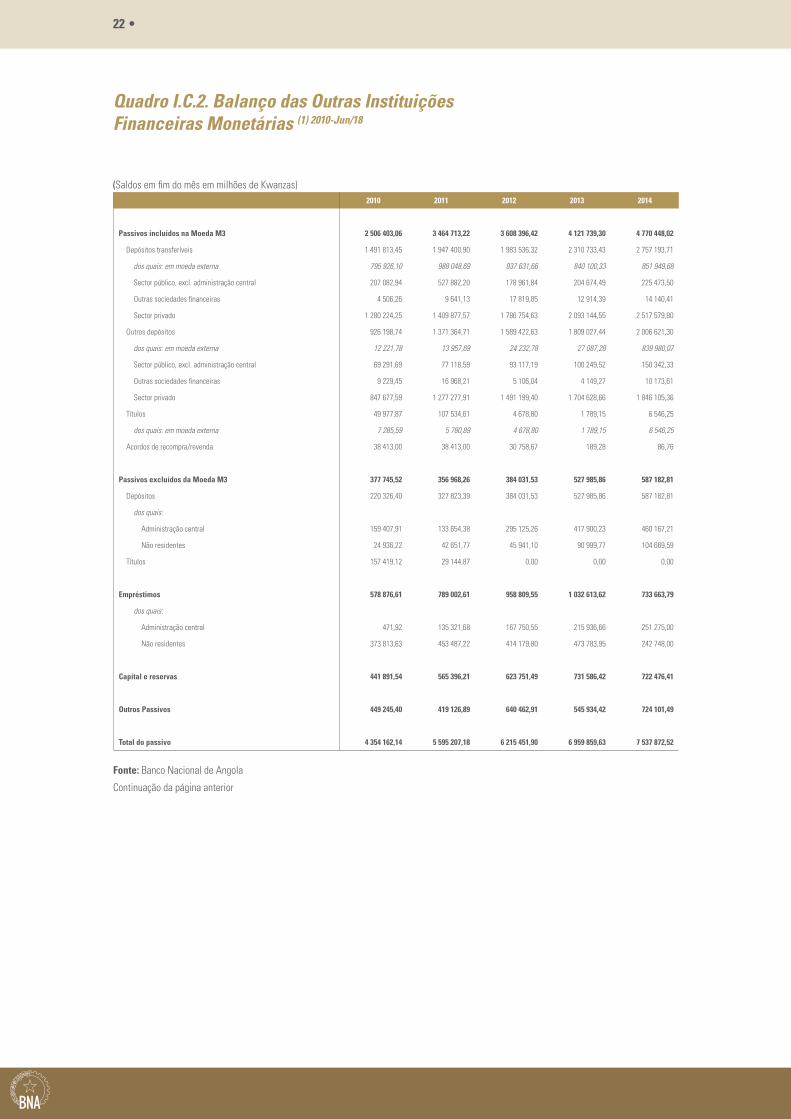
Quadro I.C.2. Balanço das Outras Instituições Financeiras Monetárias (1) 2010-Jun/18
(Saldos em fim do mês em milhões de Kwanzas)2010 2011 2012 2013 2014
Notas e moedas 88 898,35 126 636,31 140 577,25 175 899,18 170 236,78
dos quais: em moeda externa 30 885,15 47 488,17 49 702,86 42 077,23 31 934,48
Depósitos sobre não residentes 194 186,61 181 633,08 193 828,31 102 127,00 208 266,26
Depósitos sobre instituições financeiras residentes 552 142,59 723 839,01 677 124,30 772 798,18 778 880,70
Banco Nacional de Angola 464 844,17 636 068,76 674 428,74 766 740,35 772 425,40
dos quais: em moeda externa 132 748,04 289 876,45 279 716,80 311 673,57 309 001,37
Outras instituições financeiras monetárias 87 298,42 87 770,26 2 695,56 6 057,83 6 455,30
Títulos de dívida 1 124 256,53 1 132 391,14 1 062 417,64 1 228 539,92 1 546 243,99
dos quais:
Não residentes 4 049,05 46 076,58 6 936,49 13 148,51 14 923,54
Administração central 622 379,88 812 615,72 847 836,27 1 153 585,83 1 501 189,62
Banco Nacional de Angola 489 138,58 262 164,67 96 473,40 10 495,10 1 168,25
Empréstimos 1 940 781,96 2 920 422,20 3 553 887,47 3 984 457,38 4 015 786,15
Não Residentes 208 704,57 546 445,27 367 987,57 424 641,70 286 803,97
Administração central 24 105,33 21 494,37 12 163,00 26 939,73 261 129,54
Sector público, excl. administração central 72 056,58 88 743,01 85 186,69 73 606,31 61 578,45
Banco Nacional de Angola 5 927,07 142 992,35 212 756,91 211 812,87 318 840,10
Outras instituições financeiras monetárias e não monetárias 138 572,02 180 412,24 444 543,49 470 968,15 278 300,94
Sector privado 1 491 416,40 1 940 334,96 2 431 249,81 2 776 488,62 2 809 133,15
Outras sociedades não financeiras 1 173 782,33 1 541 678,38 1 907 380,30 2 203 455,27 2 038 040,02
Outros sectores residentes 317 634,07 398 656,59 523 869,51 573 033,35 771 093,13
Acções e outras participações 23 294,30 25 693,07 26 709,34 30 967,00 47 237,11
Não residentes 22,65 33,61 50,46 75,52 93,70
Outros 23 271,65 25 659,46 26 658,88 30 891,48 47 143,41
Outros activos 430 601,79 484 592,37 560 907,61 665 070,98 771 221,54
Total do activo 4 354 162,14 5 595 207,18 6 215 451,90 6 959 859,63 7 537 872,52
Fonte: Banco Nacional de Angola
Continua na próxima página
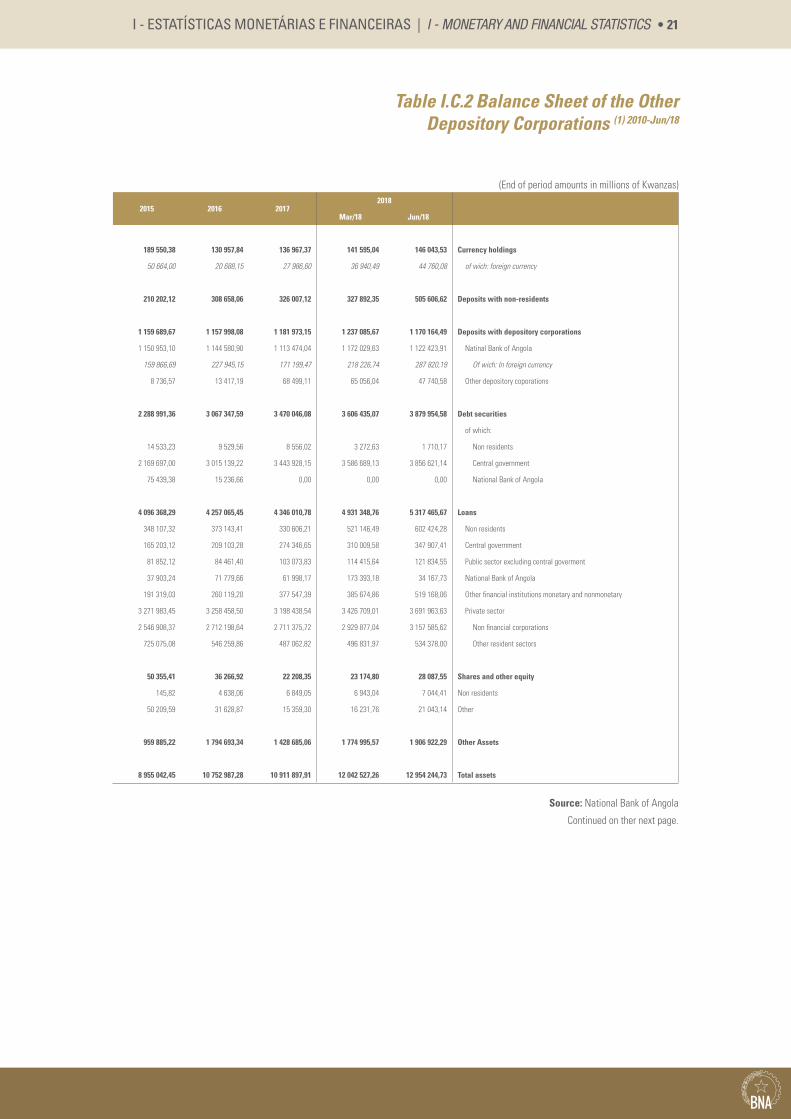
I - ESTATÍSTICAS MONETÁRIAS E FINANCEIRAS | I - MONETARY AND FINANCIAL STATISTICS • 21
Table I.C.2 Balance Sheet of the Other Depository Corporations (1) 2010-Jun/18
(End of period amounts in millions of Kwanzas)
2015 2016 20172018
Mar/18 Jun/18
189 550,38 130 957,84 136 967,37 141 595,04 146 043,53 Currency holdings
50 664,00 20 688,15 27 986,60 36 940,49 44 760,08 of wich: foreign currency
210 202,12 308 658,06 326 007,12 327 892,35 505 606,62 Deposits with non-residents
1 159 689,67 1 157 998,08 1 181 973,15 1 237 085,67 1 170 164,49 Deposits with depository corporations
1 150 953,10 1 144 580,90 1 113 474,04 1 172 029,63 1 122 423,91 Natinal Bank of Angola
159 866,69 227 945,15 171 199,47 218 226,74 287 820,19 Of wich: In foreign currency
8 736,57 13 417,19 68 499,11 65 056,04 47 740,58 Other depository coporations
2 288 991,36 3 067 347,59 3 470 046,08 3 606 435,07 3 879 954,58 Debt securities
of which:
14 533,23 9 529,56 8 556,02 3 272,63 1 710,17 Non residents
2 169 697,00 3 015 139,22 3 443 928,15 3 586 689,13 3 856 621,14 Central government
75 439,38 15 236,66 0,00 0,00 0,00 National Bank of Angola
4 096 368,29 4 257 065,45 4 346 010,78 4 931 348,76 5 317 465,67 Loans
348 107,32 373 143,41 330 606,21 521 146,49 602 424,28 Non residents
165 203,12 209 103,28 274 346,65 310 009,58 347 907,41 Central government
81 852,12 84 461,40 103 073,83 114 415,64 121 834,55 Public sector excluding central goverment
37 903,24 71 779,66 61 998,17 173 393,18 34 167,73 National Bank of Angola
191 319,03 260 119,20 377 547,39 385 674,86 519 168,06 Other financial institutions monetary and nonmonetary
3 271 983,45 3 258 458,50 3 198 438,54 3 426 709,01 3 691 963,63 Private sector
2 546 908,37 2 712 198,64 2 711 375,72 2 929 877,04 3 157 585,62 Non financial corporations
725 075,08 546 259,86 487 062,82 496 831,97 534 378,00 Other resident sectors
50 355,41 36 266,92 22 208,35 23 174,80 28 087,55 Shares and other equity
145,82 4 638,06 6 849,05 6 943,04 7 044,41 Non residents
50 209,59 31 628,87 15 359,30 16 231,76 21 043,14 Other
959 885,22 1 794 693,34 1 428 685,06 1 774 995,57 1 906 922,29 Other Assets
8 955 042,45 10 752 987,28 10 911 897,91 12 042 527,26 12 954 244,73 Total assets
Source: National Bank of Angola
Continued on ther next page.
22 •
Quadro I.C.2. Balanço das Outras Instituições Financeiras Monetárias (1) 2010-Jun/18
(Saldos em fim do mês em milhões de Kwanzas)2010 2011 2012 2013 2014
Passivos incluídos na Moeda M3 2 506 403,06 3 464 713,22 3 608 396,42 4 121 739,30 4 770 448,02
Depósitos transferíveis 1 491 813,45 1 947 400,90 1 983 536,32 2 310 733,43 2 757 193,71
dos quais: em moeda externa 795 926,10 988 048,69 937 631,66 840 100,33 851 949,68
Sector público, excl. administração central 207 082,94 527 882,20 178 961,84 204 674,49 225 473,50
Outras sociedades financeiras 4 506,26 9 641,13 17 819,85 12 914,39 14 140,41
Sector privado 1 280 224,25 1 409 877,57 1 786 754,63 2 093 144,55 2 517 579,80
Outros depósitos 926 198,74 1 371 364,71 1 589 422,63 1 809 027,44 2 006 621,30
dos quais: em moeda externa 12 221,78 13 957,69 24 232,78 27 087,28 839 980,07
Sector público, excl. administração central 69 291,69 77 118,59 93 117,19 100 249,52 150 342,33
Outras sociedades financeiras 9 229,45 16 968,21 5 106,04 4 149,27 10 173,61
Sector privado 847 677,59 1 277 277,91 1 491 199,40 1 704 628,66 1 846 105,36
Títulos 49 977,87 107 534,61 4 678,80 1 789,15 6 546,25
dos quais: em moeda externa 7 285,59 5 780,89 4 678,80 1 789,15 6 546,25
Acordos de recompra/revenda 38 413,00 38 413,00 30 758,67 189,28 86,76
Passivos excluídos da Moeda M3 377 745,52 356 968,26 384 031,53 527 985,86 587 182,81
Depósitos 220 326,40 327 823,39 384 031,53 527 985,86 587 182,81
dos quais:
Administração central 159 407,91 133 654,38 295 125,26 417 900,23 460 167,21
Não residentes 24 936,22 42 651,77 45 941,10 90 999,77 104 669,59
Títulos 157 419,12 29 144,87 0,00 0,00 0,00
Empréstimos 578 876,61 789 002,61 958 809,55 1 032 613,62 733 663,79
dos quais:
Administração central 471,92 135 321,68 167 750,55 215 936,66 251 275,00
Não residentes 373 813,63 453 487,22 414 179,80 473 783,95 242 748,00
Capital e reservas 441 891,54 565 396,21 623 751,49 731 586,42 722 476,41
Outros Passivos 449 245,40 419 126,89 640 462,91 545 934,42 724 101,49
Total do passivo 4 354 162,14 5 595 207,18 6 215 451,90 6 959 859,63 7 537 872,52
Fonte: Banco Nacional de Angola
Continuação da página anterior
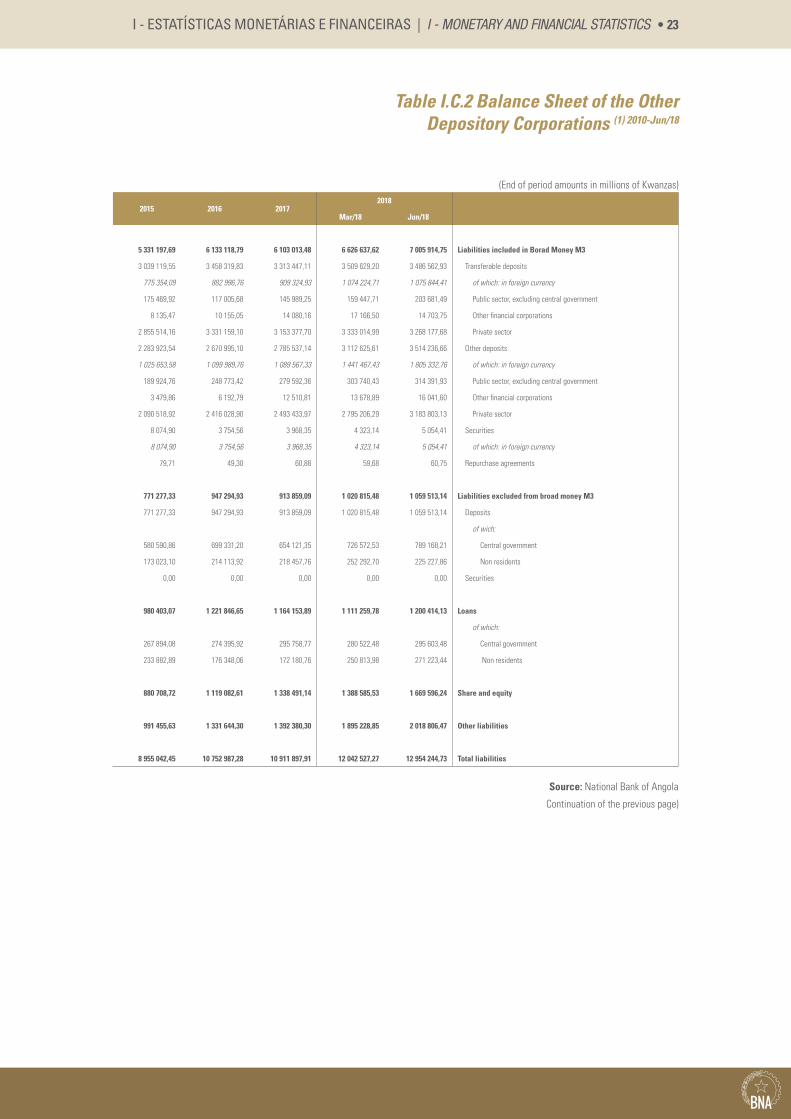
I - ESTATÍSTICAS MONETÁRIAS E FINANCEIRAS | I - MONETARY AND FINANCIAL STATISTICS • 23
Table I.C.2 Balance Sheet of the Other Depository Corporations (1) 2010-Jun/18
(End of period amounts in millions of Kwanzas)
2015 2016 20172018
Mar/18 Jun/18
5 331 197,69 6 133 118,79 6 103 013,48 6 626 637,62 7 005 914,75 Liabilities included in Borad Money M3
3 039 119,55 3 458 319,83 3 313 447,11 3 509 629,20 3 486 562,93 Transferable deposits
775 354,09 882 996,76 909 324,93 1 074 224,71 1 075 844,41 of which: in foreign currency
175 469,92 117 005,68 145 989,25 159 447,71 203 681,49 Public sector, excluding central government
8 135,47 10 155,05 14 080,16 17 166,50 14 703,75 Other financial corporations
2 855 514,16 3 331 159,10 3 153 377,70 3 333 014,99 3 268 177,68 Private sector
2 283 923,54 2 670 995,10 2 785 537,14 3 112 625,61 3 514 236,66 Other deposits
1 025 653,58 1 099 989,76 1 089 567,33 1 441 467,43 1 805 332,76 of which: in foreign currency
189 924,76 248 773,42 279 592,36 303 740,43 314 391,93 Public sector, excluding central government
3 479,86 6 192,79 12 510,81 13 678,89 16 041,60 Other financial corporations
2 090 518,92 2 416 028,90 2 493 433,97 2 795 206,29 3 183 803,13 Private sector
8 074,90 3 754,56 3 968,35 4 323,14 5 054,41 Securities
8 074,90 3 754,56 3 968,35 4 323,14 5 054,41 of which: in foreign currency
79,71 49,30 60,88 59,68 60,75 Repurchase agreements
771 277,33 947 294,93 913 859,09 1 020 815,48 1 059 513,14 Liabilities excluded from broad money M3
771 277,33 947 294,93 913 859,09 1 020 815,48 1 059 513,14 Deposits
of wich:
580 590,86 699 331,20 654 121,35 726 572,53 789 168,21 Central government
173 023,10 214 113,92 218 457,76 252 292,70 225 227,86 Non residents
0,00 0,00 0,00 0,00 0,00 Securities
980 403,07 1 221 846,65 1 164 153,89 1 111 259,78 1 200 414,13 Loans
of which:
267 894,08 274 395,92 295 758,77 280 522,48 295 603,48 Central government
233 882,89 176 348,06 172 180,76 250 813,98 271 223,44 Non residents
880 708,72 1 119 082,61 1 338 491,14 1 388 585,53 1 669 596,24 Share and equity
991 455,63 1 331 644,30 1 392 380,30 1 895 228,85 2 018 806,47 Other liabilities
8 955 042,45 10 752 987,28 10 911 897,91 12 042 527,27 12 954 244,73 Total liabilities
Source: National Bank of Angola
Continuation of the previous page)
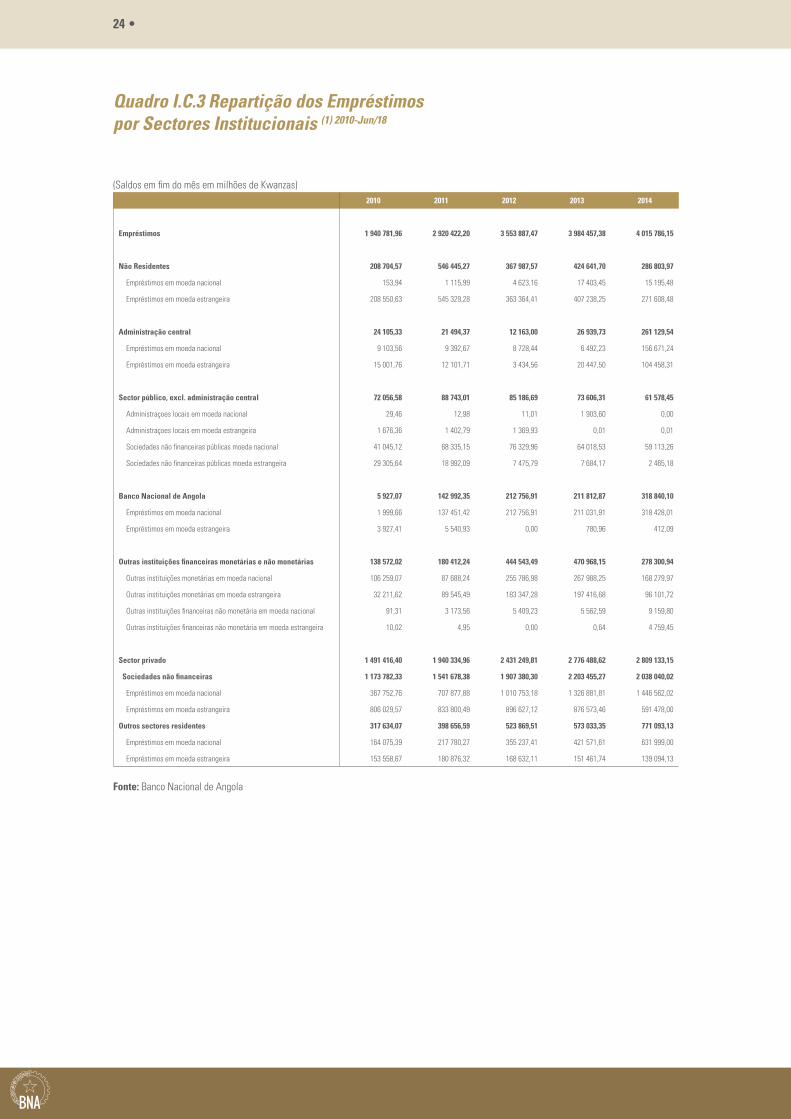
24 •
Quadro I.C.3 Repartição dos Empréstimos por Sectores Institucionais (1) 2010-Jun/18
(Saldos em fim do mês em milhões de Kwanzas)2010 2011 2012 2013 2014
Empréstimos 1 940 781,96 2 920 422,20 3 553 887,47 3 984 457,38 4 015 786,15
Não Residentes 208 704,57 546 445,27 367 987,57 424 641,70 286 803,97
Empréstimos em moeda nacional 153,94 1 115,99 4 623,16 17 403,45 15 195,48
Empréstimos em moeda estrangeira 208 550,63 545 329,28 363 364,41 407 238,25 271 608,48
Administração central 24 105,33 21 494,37 12 163,00 26 939,73 261 129,54
Empréstimos em moeda nacional 9 103,56 9 392,67 8 728,44 6 492,23 156 671,24
Empréstimos em moeda estrangeira 15 001,76 12 101,71 3 434,56 20 447,50 104 458,31
Sector público, excl. administração central 72 056,58 88 743,01 85 186,69 73 606,31 61 578,45
Administraçoes locais em moeda nacional 29,46 12,98 11,01 1 903,60 0,00
Administraçoes locais em moeda estrangeira 1 676,36 1 402,79 1 369,93 0,01 0,01
Sociedades não financeiras públicas moeda nacional 41 045,12 68 335,15 76 329,96 64 018,53 59 113,26
Sociedades não financeiras públicas moeda estrangeira 29 305,64 18 992,09 7 475,79 7 684,17 2 465,18
Banco Nacional de Angola 5 927,07 142 992,35 212 756,91 211 812,87 318 840,10
Empréstimos em moeda nacional 1 999,66 137 451,42 212 756,91 211 031,91 318 428,01
Empréstimos em moeda estrangeira 3 927,41 5 540,93 0,00 780,96 412,09
Outras instituições financeiras monetárias e não monetárias 138 572,02 180 412,24 444 543,49 470 968,15 278 300,94
Outras instituições monetárias em moeda nacional 106 259,07 87 688,24 255 786,98 267 988,25 168 279,97
Outras instituições monetárias em moeda estrangeira 32 211,62 89 545,49 183 347,28 197 416,68 96 101,72
Outras instituições financeiras não monetária em moeda nacional 91,31 3 173,56 5 409,23 5 562,59 9 159,80
Outras instituições financeiras não monetária em moeda estrangeira 10,02 4,95 0,00 0,64 4 759,45
Sector privado 1 491 416,40 1 940 334,96 2 431 249,81 2 776 488,62 2 809 133,15
Sociedades não financeiras 1 173 782,33 1 541 678,38 1 907 380,30 2 203 455,27 2 038 040,02
Empréstimos em moeda nacional 367 752,76 707 877,88 1 010 753,18 1 326 881,81 1 446 562,02
Empréstimos em moeda estrangeira 806 029,57 833 800,49 896 627,12 876 573,46 591 478,00
Outros sectores residentes 317 634,07 398 656,59 523 869,51 573 033,35 771 093,13
Empréstimos em moeda nacional 164 075,39 217 780,27 355 237,41 421 571,61 631 999,00
Empréstimos em moeda estrangeira 153 558,67 180 876,32 168 632,11 151 461,74 139 094,13
Fonte: Banco Nacional de Angola
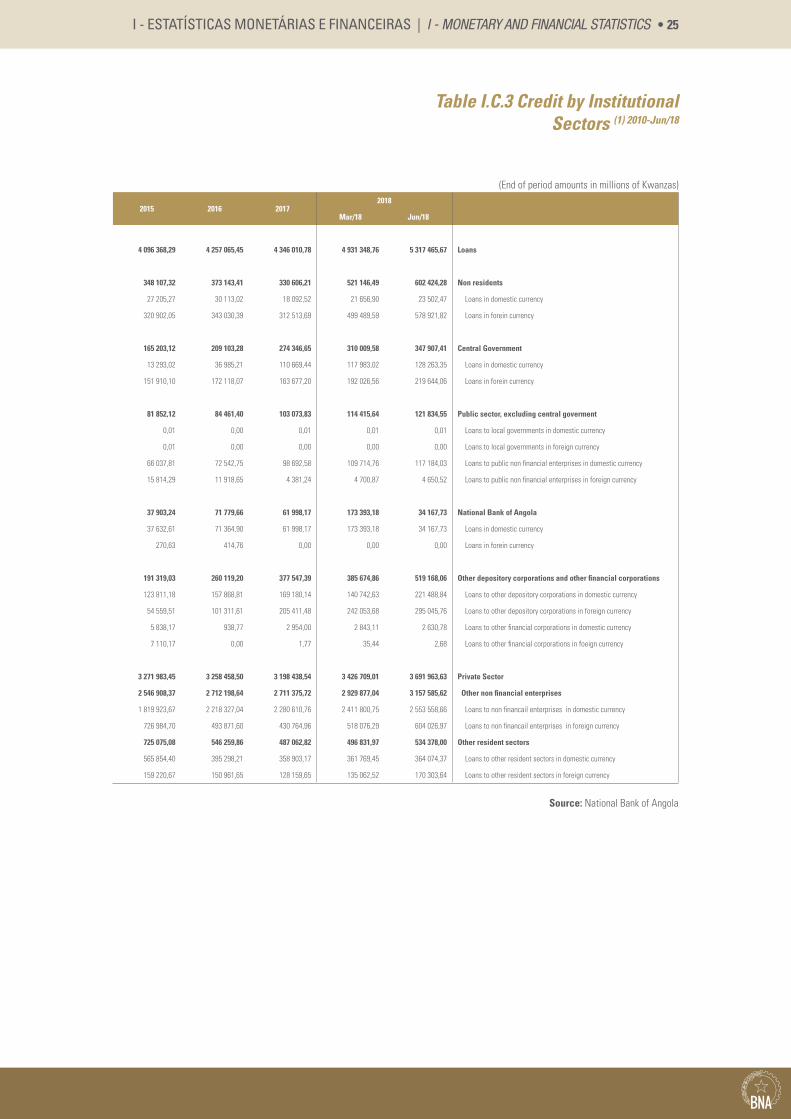
I - ESTATÍSTICAS MONETÁRIAS E FINANCEIRAS | I - MONETARY AND FINANCIAL STATISTICS • 25
Table I.C.3 Credit by Institutional Sectors (1) 2010-Jun/18
(End of period amounts in millions of Kwanzas)
2015 2016 20172018
Mar/18 Jun/18
4 096 368,29 4 257 065,45 4 346 010,78 4 931 348,76 5 317 465,67 Loans
348 107,32 373 143,41 330 606,21 521 146,49 602 424,28 Non residents
27 205,27 30 113,02 18 092,52 21 656,90 23 502,47 Loans in domestic currency
320 902,05 343 030,39 312 513,69 499 489,59 578 921,82 Loans in forein currency
165 203,12 209 103,28 274 346,65 310 009,58 347 907,41 Central Government
13 293,02 36 985,21 110 669,44 117 983,02 128 263,35 Loans in domestic currency
151 910,10 172 118,07 163 677,20 192 026,56 219 644,06 Loans in forein currency
81 852,12 84 461,40 103 073,83 114 415,64 121 834,55 Public sector, excluding central goverment
0,01 0,00 0,01 0,01 0,01 Loans to local governments in domestic currency
0,01 0,00 0,00 0,00 0,00 Loans to local governments in foreign currency
66 037,81 72 542,75 98 692,58 109 714,76 117 184,03 Loans to public non financial enterprises in domestic currency
15 814,29 11 918,65 4 381,24 4 700,87 4 650,52 Loans to public non financial enterprises in foreign currency
37 903,24 71 779,66 61 998,17 173 393,18 34 167,73 National Bank of Angola
37 632,61 71 364,90 61 998,17 173 393,18 34 167,73 Loans in domestic currency
270,63 414,76 0,00 0,00 0,00 Loans in forein currency
191 319,03 260 119,20 377 547,39 385 674,86 519 168,06 Other depository corporations and other financial corporations
123 811,18 157 868,81 169 180,14 140 742,63 221 488,84 Loans to other depository corporations in domestic currency
54 559,51 101 311,61 205 411,48 242 053,68 295 045,76 Loans to other depository corporations in foreign currency
5 838,17 938,77 2 954,00 2 843,11 2 630,78 Loans to other financial corporations in domestic currency
7 110,17 0,00 1,77 35,44 2,68 Loans to other financial corporations in foeign currency
3 271 983,45 3 258 458,50 3 198 438,54 3 426 709,01 3 691 963,63 Private Sector
2 546 908,37 2 712 198,64 2 711 375,72 2 929 877,04 3 157 585,62 Other non financial enterprises
1 819 923,67 2 218 327,04 2 280 610,76 2 411 800,75 2 553 558,66 Loans to non financail enterprises in domestic currency
726 984,70 493 871,60 430 764,96 518 076,29 604 026,97 Loans to non financail enterprises in foreign currency
725 075,08 546 259,86 487 062,82 496 831,97 534 378,00 Other resident sectors
565 854,40 395 298,21 358 903,17 361 769,45 364 074,37 Loans to other resident sectors in domestic currency
159 220,67 150 961,65 128 159,65 135 062,52 170 303,64 Loans to other resident sectors in foreign currency
Source: National Bank of Angola
26 •
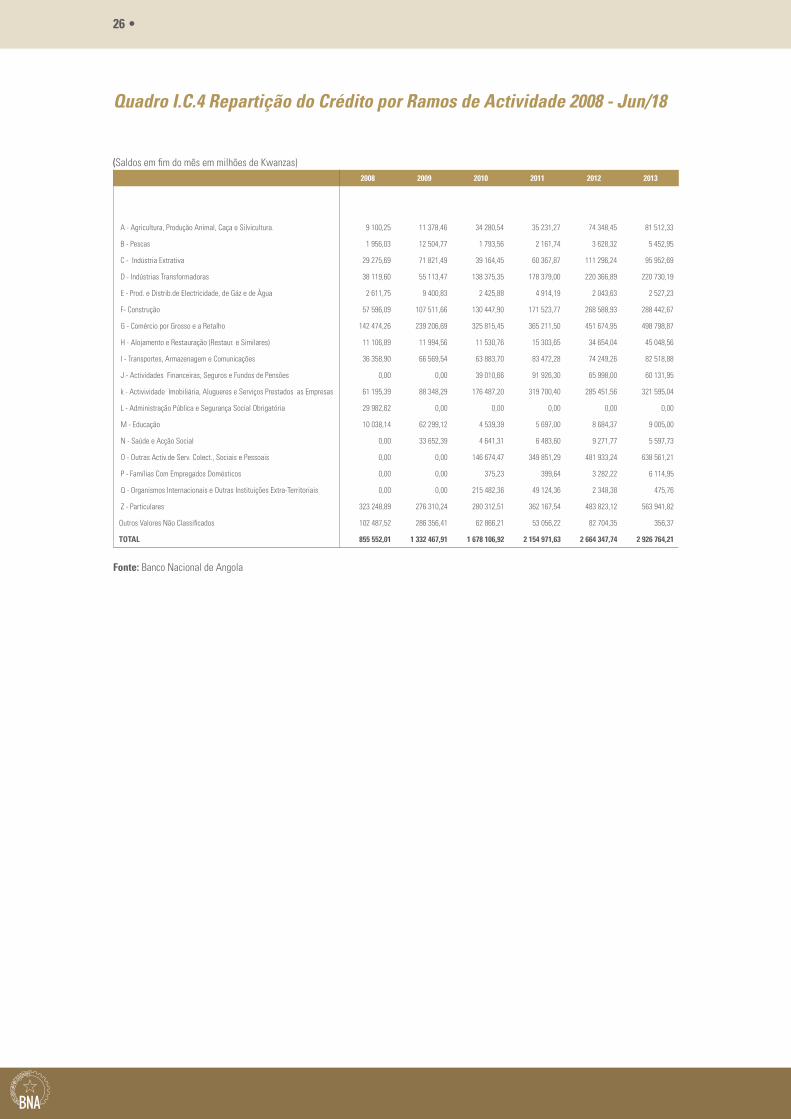
Quadro I.C.4 Repartição do Crédito por Ramos de Actividade 2008 - Jun/18
(Saldos em fim do mês em milhões de Kwanzas)2008 2009 2010 2011 2012 2013
A - Agricultura, Produção Animal, Caça e Silvicultura. 9 100,25 11 378,46 34 280,54 35 231,27 74 348,45 81 512,33
B - Pescas 1 956,03 12 504,77 1 793,56 2 161,74 3 628,32 5 452,95
C - Indústria Extrativa 29 275,69 71 821,49 39 164,45 60 367,87 111 296,24 95 952,69
D - Indústrias Transformadoras 38 119,60 55 113,47 138 375,35 178 379,00 220 366,89 220 730,19
E - Prod. e Distrib.de Electricidade, de Gáz e de Àgua 2 611,75 9 400,83 2 425,88 4 914,19 2 043,63 2 527,23
F- Construção 57 596,09 107 511,66 130 447,90 171 523,77 268 588,93 288 442,67
G - Comércio por Grosso e a Retalho 142 474,26 239 206,69 325 815,45 365 211,50 451 674,95 498 798,87
H - Alojamento e Restauração (Restaur. e Similares) 11 106,89 11 994,56 11 530,76 15 303,65 34 654,04 45 048,56
I - Transportes, Armazenagem e Comunicações 36 358,90 66 569,54 63 883,70 83 472,28 74 249,26 82 518,88
J - Actividades Financeiras, Seguros e Fundos de Pensões 0,00 0,00 39 010,66 91 926,30 65 998,00 60 131,95
k - Activividade Imobiliária, Alugueres e Serviços Prestados as Empresas 61 195,39 88 348,29 176 487,20 319 700,40 285 451,56 321 595,04
L - Administração Pública e Segurança Social Obrigatória 29 982,62 0,00 0,00 0,00 0,00 0,00
M - Educação 10 038,14 62 299,12 4 539,39 5 697,00 8 684,37 9 005,00
N - Saúde e Acção Social 0,00 33 652,39 4 641,31 6 483,60 9 271,77 5 597,73
O - Outras Activ.de Serv. Colect., Sociais e Pessoais 0,00 0,00 146 674,47 349 851,29 481 933,24 638 561,21
P - Famílias Com Empregados Domésticos 0,00 0,00 375,23 399,64 3 282,22 6 114,95
Q - Organismos Internacionais e Outras Instituições Extra-Territoriais 0,00 0,00 215 482,36 49 124,36 2 348,38 475,76
Z - Particulares 323 248,89 276 310,24 280 312,51 362 167,54 483 823,12 563 941,82
Outros Valores Não Classificados 102 487,52 286 356,41 62 866,21 53 056,22 82 704,35 356,37
TOTAL 855 552,01 1 332 467,91 1 678 106,92 2 154 971,63 2 664 347,74 2 926 764,21
Fonte: Banco Nacional de Angola
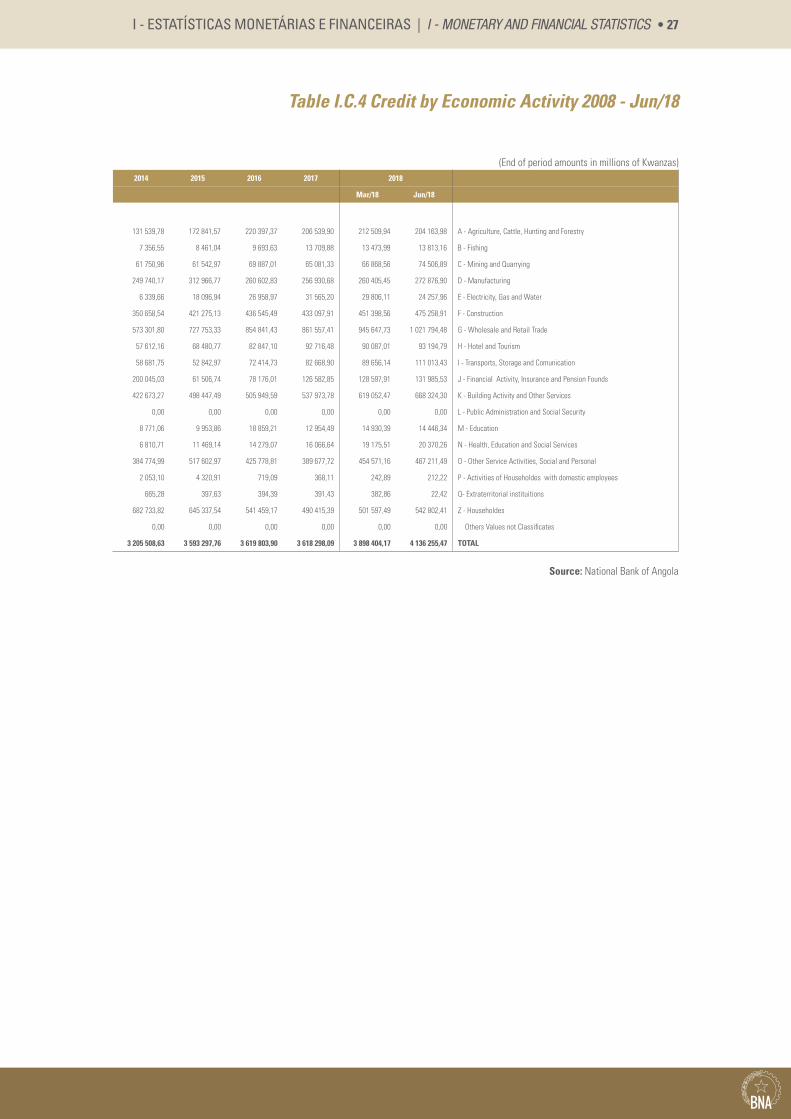
I - ESTATÍSTICAS MONETÁRIAS E FINANCEIRAS | I - MONETARY AND FINANCIAL STATISTICS • 27
Table I.C.4 Credit by Economic Activity 2008 - Jun/18
(End of period amounts in millions of Kwanzas)2014 2015 2016 2017 2018
Mar/18 Jun/18
131 539,78 172 841,57 220 397,37 206 539,90 212 509,94 204 163,98 A - Agriculture, Cattle, Hunting and Forestry
7 356,55 8 461,04 9 693,63 13 709,88 13 473,99 13 813,16 B - Fishing
61 750,96 61 542,97 69 887,01 65 081,33 66 868,56 74 506,89 C - Mining and Quarrying
249 740,17 312 966,77 260 602,83 256 930,68 260 405,45 272 876,90 D - Manufacturing
6 339,66 18 096,94 26 958,97 31 565,20 29 806,11 24 257,96 E - Electricity, Gas and Water
350 658,54 421 275,13 436 545,49 433 097,91 451 398,56 475 258,91 F - Construction
573 301,80 727 753,33 854 841,43 861 557,41 945 647,73 1 021 794,48 G - Wholesale and Retail Trade
57 612,16 68 480,77 82 847,10 92 716,48 90 087,01 93 194,79 H - Hotel and Tourism
58 681,75 52 842,97 72 414,73 82 668,90 89 656,14 111 013,43 I - Transports, Storage and Comunication
200 045,03 61 506,74 78 176,01 126 582,85 128 597,91 131 985,53 J - Financial Activity, Insurance and Pension Founds
422 673,27 498 447,49 505 949,59 537 973,78 619 052,47 668 324,30 K - Building Activity and Other Services
0,00 0,00 0,00 0,00 0,00 0,00 L - Public Administration and Social Security
8 771,06 9 953,86 18 859,21 12 954,49 14 930,39 14 446,34 M - Education
6 810,71 11 469,14 14 279,07 16 066,64 19 175,51 20 370,26 N - Health, Education and Social Services
384 774,99 517 602,97 425 778,81 389 677,72 454 571,16 467 211,49 O - Other Service Activities, Social and Personal
2 053,10 4 320,91 719,09 368,11 242,89 212,22 P - Activities of Householdes with domestic employees
665,28 397,63 394,39 391,43 382,86 22,42 Q- Extraterritorial instituitions
682 733,82 645 337,54 541 459,17 490 415,39 501 597,49 542 802,41 Z - Householdes
0,00 0,00 0,00 0,00 0,00 0,00 Others Values not Classificates
3 205 508,63 3 593 297,76 3 619 803,90 3 618 298,09 3 898 404,17 4 136 255,47 TOTAL
Source: National Bank of Angola
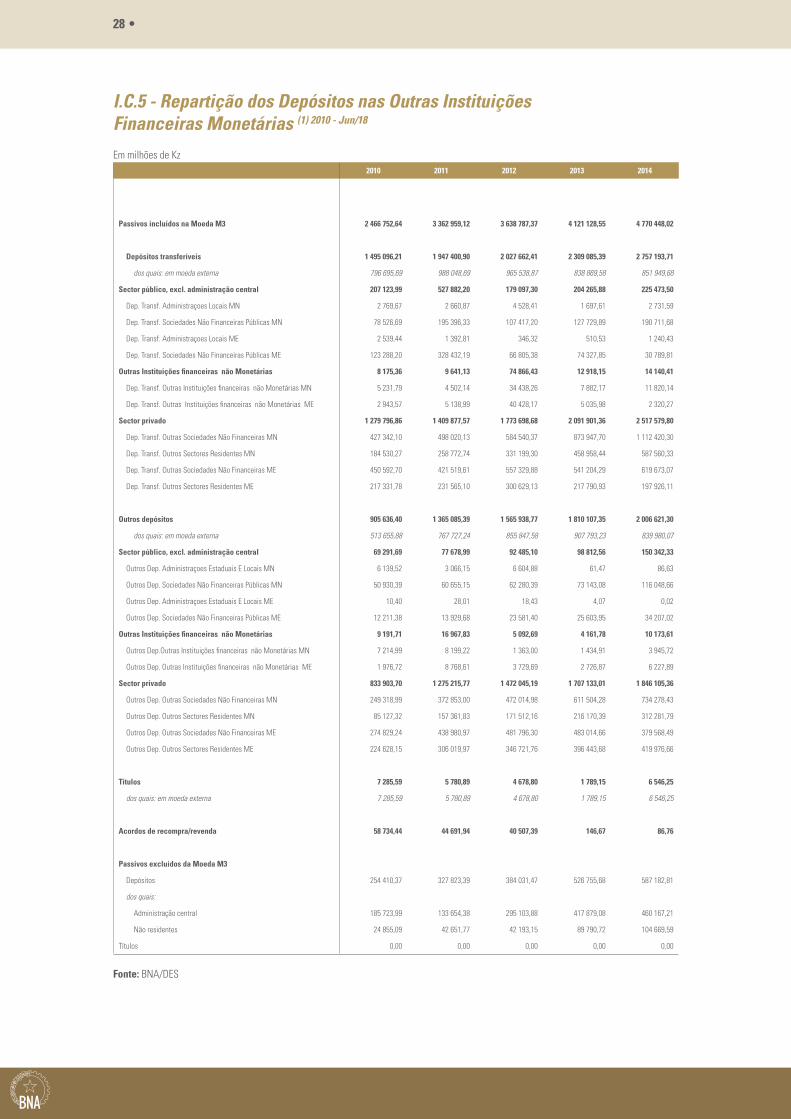
28 •
I.C.5 - Repartição dos Depósitos nas Outras Instituições Financeiras Monetárias (1) 2010 - Jun/18
Em milhões de Kz2010 2011 2012 2013 2014
Passivos incluídos na Moeda M3 2 466 752,64 3 362 959,12 3 638 787,37 4 121 128,55 4 770 448,02
Depósitos transferíveis 1 495 096,21 1 947 400,90 2 027 662,41 2 309 085,39 2 757 193,71
dos quais: em moeda externa 796 695,69 988 048,69 965 538,87 838 869,58 851 949,68
Sector público, excl. administração central 207 123,99 527 882,20 179 097,30 204 265,88 225 473,50
Dep. Transf. Administraçoes Locais MN 2 769,67 2 660,87 4 528,41 1 697,61 2 731,59
Dep. Transf. Sociedades Não Financeiras Públicas MN 78 526,69 195 396,33 107 417,20 127 729,89 190 711,68
Dep. Transf. Administraçoes Locais ME 2 539,44 1 392,81 346,32 510,53 1 240,43
Dep. Transf. Sociedades Não Financeiras Públicas ME 123 288,20 328 432,19 66 805,38 74 327,85 30 789,81
Outras Instituições financeiras não Monetárias 8 175,36 9 641,13 74 866,43 12 918,15 14 140,41
Dep. Transf. Outras Instituições financeiras não Monetárias MN 5 231,79 4 502,14 34 438,26 7 882,17 11 820,14
Dep. Transf. Outras Instituições financeiras não Monetárias ME 2 943,57 5 138,99 40 428,17 5 035,98 2 320,27
Sector privado 1 279 796,86 1 409 877,57 1 773 698,68 2 091 901,36 2 517 579,80
Dep. Transf. Outras Sociedades Não Financeiras MN 427 342,10 498 020,13 584 540,37 873 947,70 1 112 420,30
Dep. Transf. Outros Sectores Residentes MN 184 530,27 258 772,74 331 199,30 458 958,44 587 560,33
Dep. Transf. Outras Sociedades Não Financeiras ME 450 592,70 421 519,61 557 329,88 541 204,29 619 673,07
Dep. Transf. Outros Sectores Residentes ME 217 331,78 231 565,10 300 629,13 217 790,93 197 926,11
Outros depósitos 905 636,40 1 365 085,39 1 565 938,77 1 810 107,35 2 006 621,30
dos quais: em moeda externa 513 655,88 767 727,24 855 847,58 907 793,23 839 980,07
Sector público, excl. administração central 69 291,69 77 678,99 92 485,10 98 812,56 150 342,33
Outros Dep. Administraçoes Estaduais E Locais MN 6 139,52 3 066,15 6 604,88 61,47 86,63
Outros Dep. Sociedades Não Financeiras Públicas MN 50 930,39 60 655,15 62 280,39 73 143,08 116 048,66
Outros Dep. Administraçoes Estaduais E Locais ME 10,40 28,01 18,43 4,07 0,02
Outros Dep. Sociedades Não Financeiras Públicas ME 12 211,38 13 929,68 23 581,40 25 603,95 34 207,02
Outras Instituições financeiras não Monetárias 9 191,71 16 967,83 5 092,69 4 161,78 10 173,61
Outros Dep.Outras Instituições financeiras não Monetárias MN 7 214,99 8 199,22 1 363,00 1 434,91 3 945,72
Outros Dep. Outras Instituições financeiras não Monetárias ME 1 976,72 8 768,61 3 729,69 2 726,87 6 227,89
Sector privado 833 903,70 1 275 215,77 1 472 045,19 1 707 133,01 1 846 105,36
Outros Dep. Outras Sociedades Não Financeiras MN 249 318,99 372 853,00 472 014,98 611 504,28 734 278,43
Outros Dep. Outros Sectores Residentes MN 85 127,32 157 361,83 171 512,16 216 170,39 312 281,79
Outros Dep. Outras Sociedades Não Financeiras ME 274 829,24 438 980,97 481 796,30 483 014,66 379 568,49
Outros Dep. Outros Sectores Residentes ME 224 628,15 306 019,97 346 721,76 396 443,68 419 976,66
Títulos 7 285,59 5 780,89 4 678,80 1 789,15 6 546,25
dos quais: em moeda externa 7 285,59 5 780,89 4 678,80 1 789,15 6 546,25
Acordos de recompra/revenda 58 734,44 44 691,94 40 507,39 146,67 86,76
Passivos excluídos da Moeda M3
Depósitos 254 410,37 327 823,39 384 031,47 526 755,68 587 182,81
dos quais:
Administração central 185 723,99 133 654,38 295 103,88 417 879,08 460 167,21
Não residentes 24 855,09 42 651,77 42 193,15 89 790,72 104 669,59
Títulos 0,00 0,00 0,00 0,00 0,00
Fonte: BNA/DES
I - ESTATÍSTICAS MONETÁRIAS E FINANCEIRAS | I - MONETARY AND FINANCIAL STATISTICS • 29
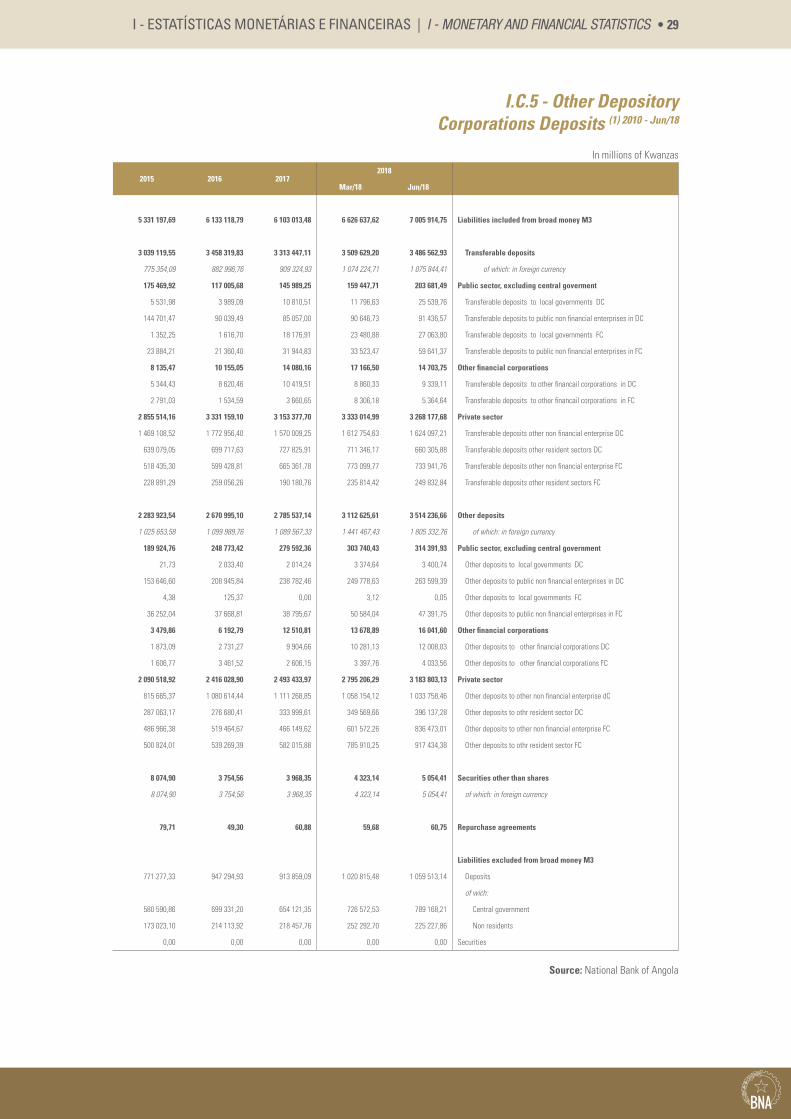
I.C.5 - Other Depository Corporations Deposits (1) 2010 - Jun/18
In millions of Kwanzas
2015 2016 20172018
Mar/18 Jun/18
5 331 197,69 6 133 118,79 6 103 013,48 6 626 637,62 7 005 914,75 Liabilities included from broad money M3
3 039 119,55 3 458 319,83 3 313 447,11 3 509 629,20 3 486 562,93 Transferable deposits
775 354,09 882 996,76 909 324,93 1 074 224,71 1 075 844,41 of which: in foreign currency
175 469,92 117 005,68 145 989,25 159 447,71 203 681,49 Public sector, excluding central goverment
5 531,98 3 989,09 10 810,51 11 796,63 25 539,76 Transferable deposits to local governments DC
144 701,47 90 039,49 85 057,00 90 646,73 91 436,57 Transferable deposits to public non financial enterprises in DC
1 352,25 1 616,70 18 176,91 23 480,88 27 063,80 Transferable deposits to local governments FC
23 884,21 21 360,40 31 944,83 33 523,47 59 641,37 Transferable deposits to public non financial enterprises in FC
8 135,47 10 155,05 14 080,16 17 166,50 14 703,75 Other financial corporations
5 344,43 8 620,46 10 419,51 8 860,33 9 339,11 Transferable deposits to other financail corporations in DC
2 791,03 1 534,59 3 660,65 8 306,18 5 364,64 Transferable deposits to other financail corporations in FC
2 855 514,16 3 331 159,10 3 153 377,70 3 333 014,99 3 268 177,68 Private sector
1 469 108,52 1 772 956,40 1 570 009,25 1 612 754,63 1 624 097,21 Transferable deposits other non financial enterprise DC
639 079,05 699 717,63 727 825,91 711 346,17 660 305,88 Transferable deposits other resident sectors DC
518 435,30 599 428,81 665 361,78 773 099,77 733 941,76 Transferable deposits other non financial enterprise FC
228 891,29 259 056,26 190 180,76 235 814,42 249 832,84 Transferable deposits other resident sectors FC
2 283 923,54 2 670 995,10 2 785 537,14 3 112 625,61 3 514 236,66 Other deposits
1 025 653,58 1 099 989,76 1 089 567,33 1 441 467,43 1 805 332,76 of which: in foreign currency
189 924,76 248 773,42 279 592,36 303 740,43 314 391,93 Public sector, excluding central government
21,73 2 033,40 2 014,24 3 374,64 3 400,74 Other deposits to local governments DC
153 646,60 208 945,84 238 782,46 249 778,63 263 599,39 Other deposits to public non financial enterprises in DC
4,38 125,37 0,00 3,12 0,05 Other deposits to local governments FC
36 252,04 37 668,81 38 795,67 50 584,04 47 391,75 Other deposits to public non financial enterprises in FC
3 479,86 6 192,79 12 510,81 13 678,89 16 041,60 Other financial corporations
1 873,09 2 731,27 9 904,66 10 281,13 12 008,03 Other deposits to other financial corporations DC
1 606,77 3 461,52 2 606,15 3 397,76 4 033,56 Other deposits to other financial corporations FC
2 090 518,92 2 416 028,90 2 493 433,97 2 795 206,29 3 183 803,13 Private sector
815 665,37 1 080 614,44 1 111 268,85 1 058 154,12 1 033 758,46 Other deposits to other non financial enterprise dC
287 063,17 276 680,41 333 999,61 349 569,66 396 137,28 Other deposits to othr resident sector DC
486 966,38 519 464,67 466 149,62 601 572,26 836 473,01 Other deposits to other non financial enterprise FC
500 824,01 539 269,39 582 015,88 785 910,25 917 434,38 Other deposits to othr resident sector FC
8 074,90 3 754,56 3 968,35 4 323,14 5 054,41 Securities other than shares
8 074,90 3 754,56 3 968,35 4 323,14 5 054,41 of which: in foreign currency
79,71 49,30 60,88 59,68 60,75 Repurchase agreements
Liabilities excluded from broad money M3
771 277,33 947 294,93 913 859,09 1 020 815,48 1 059 513,14 Deposits
of wich:
580 590,86 699 331,20 654 121,35 726 572,53 789 168,21 Central government
173 023,10 214 113,92 218 457,76 252 292,70 225 227,86 Non residents
0,00 0,00 0,00 0,00 0,00 Securities
Source: National Bank of Angola
30 •
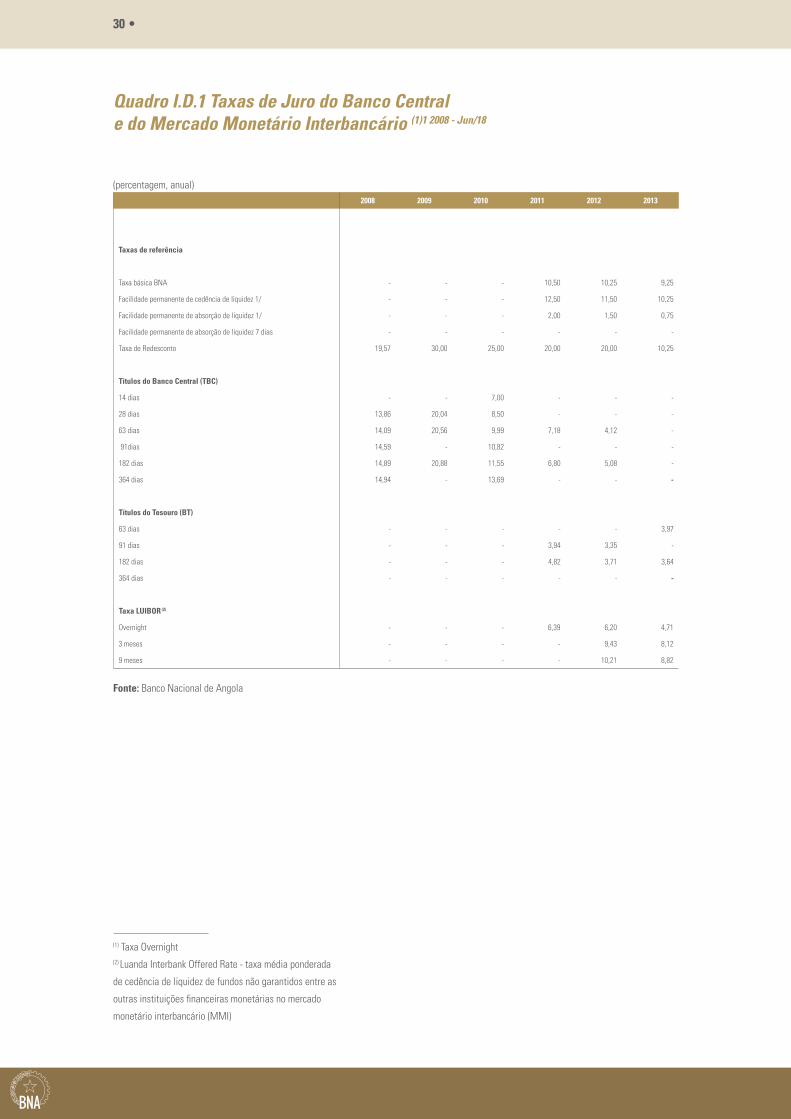
Quadro I.D.1 Taxas de Juro do Banco Central e do Mercado Monetário Interbancário (1)1 2008 - Jun/18
(percentagem, anual)2008 2009 2010 2011 2012 2013
Taxas de referência
Taxa básica BNA - - - 10,50 10,25 9,25
Facilidade permanente de cedência de liquidez 1/ - - - 12,50 11,50 10,25
Facilidade permanente de absorção de liquidez 1/ - - - 2,00 1,50 0,75
Facilidade permanente de absorção de liquidez 7 dias - - - - - -
Taxa de Redesconto 19,57 30,00 25,00 20,00 20,00 10,25
Títulos do Banco Central (TBC)
14 dias - - 7,00 - - -
28 dias 13,86 20,04 8,50 - - -
63 dias 14,09 20,56 9,99 7,18 4,12 -
91dias 14,59 - 10,82 - - -
182 dias 14,89 20,88 11,55 6,80 5,08 -
364 dias 14,94 - 13,69 - - -
Títulos do Tesouro (BT)
63 dias - - - - - 3,97
91 dias - - - 3,94 3,35 -
182 dias - - - 4,82 3,71 3,64
364 dias - - - - - -
Taxa LUIBOR (2)
Overnight - - - 6,39 6,20 4,71
3 meses - - - - 9,43 8,12
9 meses - - - - 10,21 8,82
Fonte: Banco Nacional de Angola
(1) Taxa Overnight (2) Luanda Interbank Offered Rate - taxa média ponderada
de cedência de liquidez de fundos não garantidos entre as
outras instituições financeiras monetárias no mercado
monetário interbancário (MMI)
I - ESTATÍSTICAS MONETÁRIAS E FINANCEIRAS | I - MONETARY AND FINANCIAL STATISTICS • 31
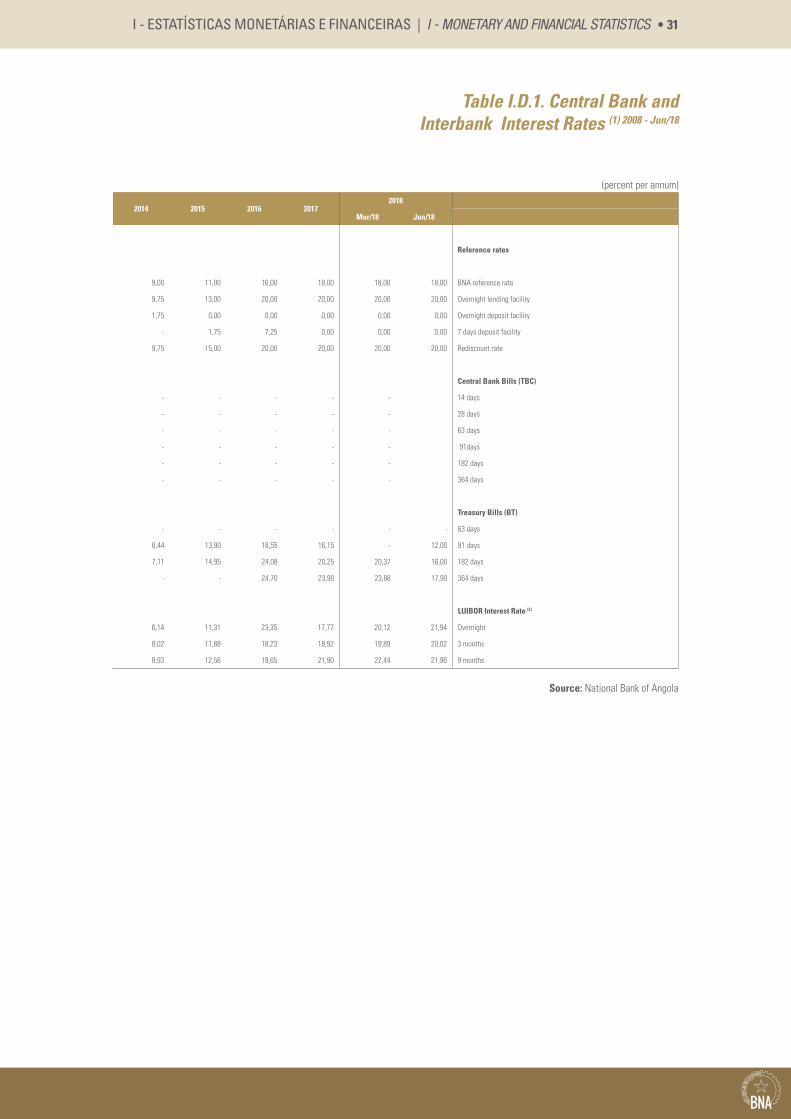
Table I.D.1. Central Bank and Interbank Interest Rates (1) 2008 - Jun/18
(percent per annum)
2014 2015 2016 20172018
Mar/18 Jun/18
Reference rates
9,00 11,00 16,00 18,00 18,00 18,00 BNA reference rate
9,75 13,00 20,00 20,00 20,00 20,00 Overnight lending facility
1,75 0,00 0,00 0,00 0,00 0,00 Overnight deposit facility
- 1,75 7,25 0,00 0,00 0,00 7 days deposit facility
9,75 15,00 20,00 20,00 20,00 20,00 Rediscount rate
Central Bank Bills (TBC)
- - - - - 14 days
- - - - - 28 days
- - - - - 63 days
- - - - - 91days
- - - - - 182 days
- - - - - 364 days
Treasury Bills (BT)
- - - - - - 63 days
6,44 13,90 18,55 16,15 - 12,00 91 days
7,11 14,95 24,08 20,25 20,37 16,00 182 days
- - 24,70 23,90 23,88 17,90 364 days
LUIBOR Interest Rate (2)
6,14 11,31 23,35 17,77 20,12 21,94 Overnight
8,02 11,88 18,23 18,92 19,89 20,02 3 months
8,93 12,56 19,65 21,90 22,44 21,96 9 months
Source: National Bank of Angola
32 •
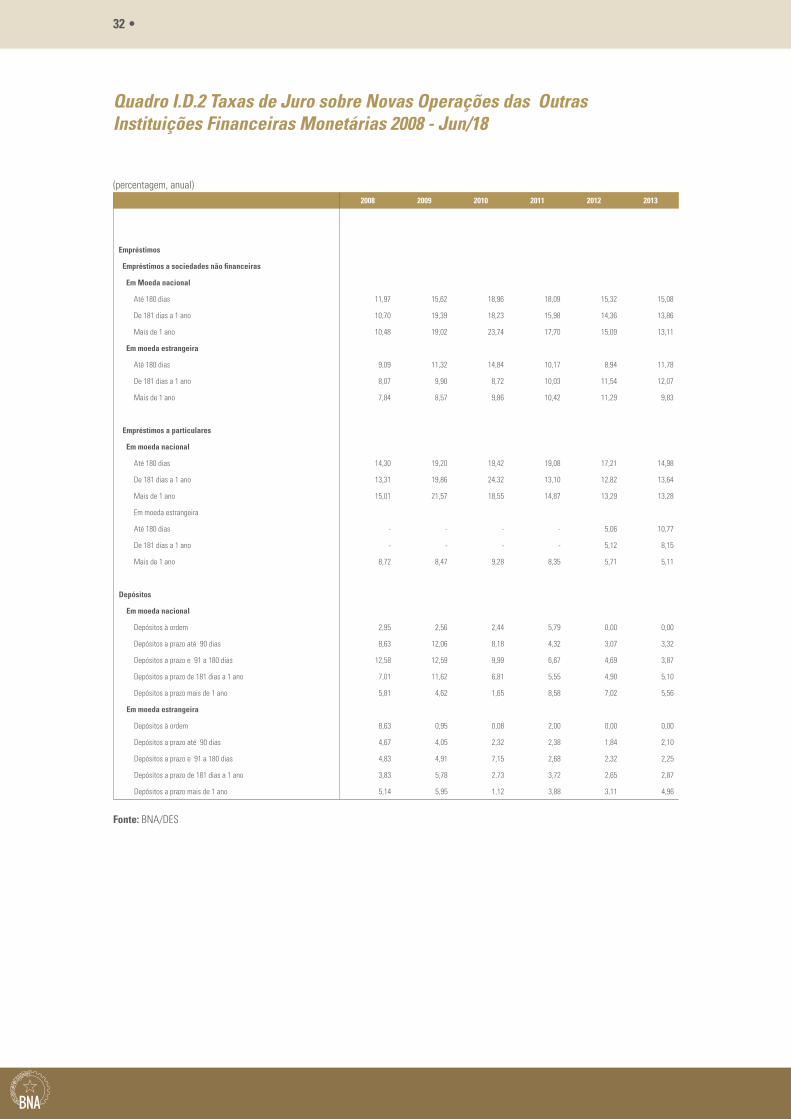
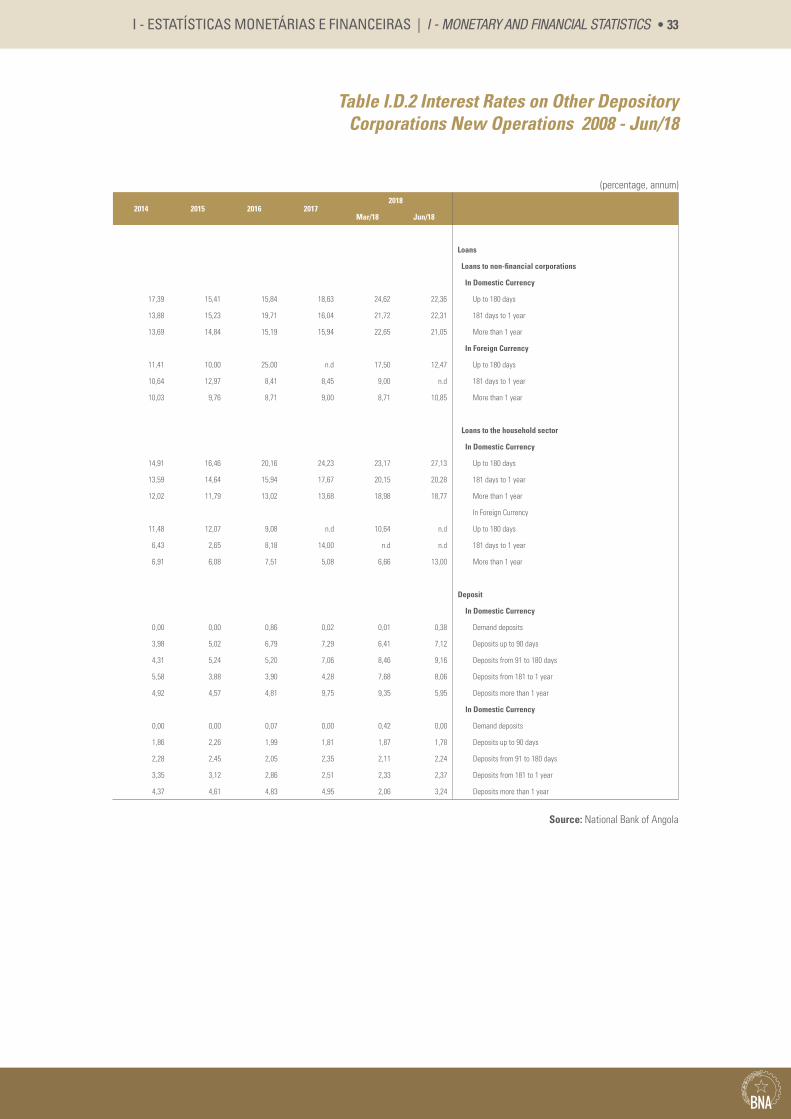
Quadro I.D.2 Taxas de Juro sobre Novas Operações das Outras Instituições Financeiras Monetárias 2008 - Jun/18
(percentagem, anual)2008 2009 2010 2011 2012 2013
Empréstimos
Empréstimos a sociedades não financeiras
Em Moeda nacional
Até 180 dias 11,97 15,62 18,96 18,09 15,32 15,08
De 181 dias a 1 ano 10,70 19,39 18,23 15,98 14,36 13,86
Mais de 1 ano 10,48 19,02 23,74 17,70 15,09 13,11
Em moeda estrangeira
Até 180 dias 9,09 11,32 14,84 10,17 8,94 11,78
De 181 dias a 1 ano 8,07 9,90 8,72 10,03 11,54 12,07
Mais de 1 ano 7,84 8,57 9,86 10,42 11,29 9,83
Empréstimos a particulares
Em moeda nacional
Até 180 dias 14,30 19,20 19,42 19,08 17,21 14,98
De 181 dias a 1 ano 13,31 19,86 24,32 13,10 12,82 13,64
Mais de 1 ano 15,01 21,57 18,55 14,87 13,29 13,28
Em moeda estrangeira
Até 180 dias - - - - 5,06 10,77
De 181 dias a 1 ano - - - - 5,12 8,15
Mais de 1 ano 8,72 8,47 9,28 8,35 5,71 5,11
Depósitos
Em moeda nacional
Depósitos à ordem 2,95 2,56 2,44 5,79 0,00 0,00
Depósitos a prazo até 90 dias 8,63 12,06 8,18 4,32 3,07 3,32
Depósitos a prazo e 91 a 180 dias 12,58 12,59 9,99 6,67 4,69 3,87
Depósitos a prazo de 181 dias a 1 ano 7,01 11,62 6,81 5,55 4,90 5,10
Depósitos a prazo mais de 1 ano 5,81 4,62 1,65 8,58 7,02 5,56
Em moeda estrangeira
Depósitos à ordem 8,63 0,95 0,08 2,00 0,00 0,00
Depósitos a prazo até 90 dias 4,67 4,05 2,32 2,38 1,84 2,10
Depósitos a prazo e 91 a 180 dias 4,83 4,91 7,15 2,68 2,32 2,25
Depósitos a prazo de 181 dias a 1 ano 3,83 5,78 2,73 3,72 2,65 2,87
Depósitos a prazo mais de 1 ano 5,14 5,95 1,12 3,88 3,11 4,96
Fonte: BNA/DES
I - ESTATÍSTICAS MONETÁRIAS E FINANCEIRAS | I - MONETARY AND FINANCIAL STATISTICS • 33
Table I.D.2 Interest Rates on Other Depository Corporations New Operations 2008 - Jun/18
(percentage, annum)
2014 2015 2016 20172018
Mar/18 Jun/18
Loans
Loans to non-financial corporations
In Domestic Currency
17,39 15,41 15,84 18,63 24,62 22,36 Up to 180 days
13,88 15,23 19,71 16,04 21,72 22,31 181 days to 1 year
13,69 14,84 15,19 15,94 22,65 21,05 More than 1 year
In Foreign Currency
11,41 10,00 25,00 n.d 17,50 12,47 Up to 180 days
10,64 12,97 8,41 8,45 9,00 n.d 181 days to 1 year
10,03 9,76 8,71 9,00 8,71 10,85 More than 1 year
Loans to the household sector
In Domestic Currency
14,91 16,46 20,16 24,23 23,17 27,13 Up to 180 days
13,59 14,64 15,94 17,67 20,15 20,28 181 days to 1 year
12,02 11,79 13,02 13,68 18,98 18,77 More than 1 year
In Foreign Currency
11,48 12,07 9,08 n.d 10,64 n.d Up to 180 days
6,43 2,65 8,18 14,00 n.d n.d 181 days to 1 year
6,91 6,08 7,51 5,08 6,66 13,00 More than 1 year
Deposit
In Domestic Currency
0,00 0,00 0,86 0,02 0,01 0,38 Demand deposits
3,98 5,02 6,79 7,29 6,41 7,12 Deposits up to 90 days
4,31 5,24 5,20 7,06 8,46 9,16 Deposits from 91 to 180 days
5,58 3,88 3,90 4,28 7,68 8,06 Deposits from 181 to 1 year
4,92 4,57 4,81 9,75 9,35 5,95 Deposits more than 1 year
In Domestic Currency
0,00 0,00 0,07 0,00 0,42 0,00 Demand deposits
1,86 2,26 1,99 1,81 1,87 1,78 Deposits up to 90 days
2,28 2,45 2,05 2,35 2,11 2,24 Deposits from 91 to 180 days
3,35 3,12 2,86 2,51 2,33 2,37 Deposits from 181 to 1 year
4,37 4,61 4,83 4,95 2,06 3,24 Deposits more than 1 year
Source: National Bank of Angola


II - ESTATÍSTICAS DO SECTOR EXTERNO
II - EXTERNAL SECTOR STATISTICS
36 •
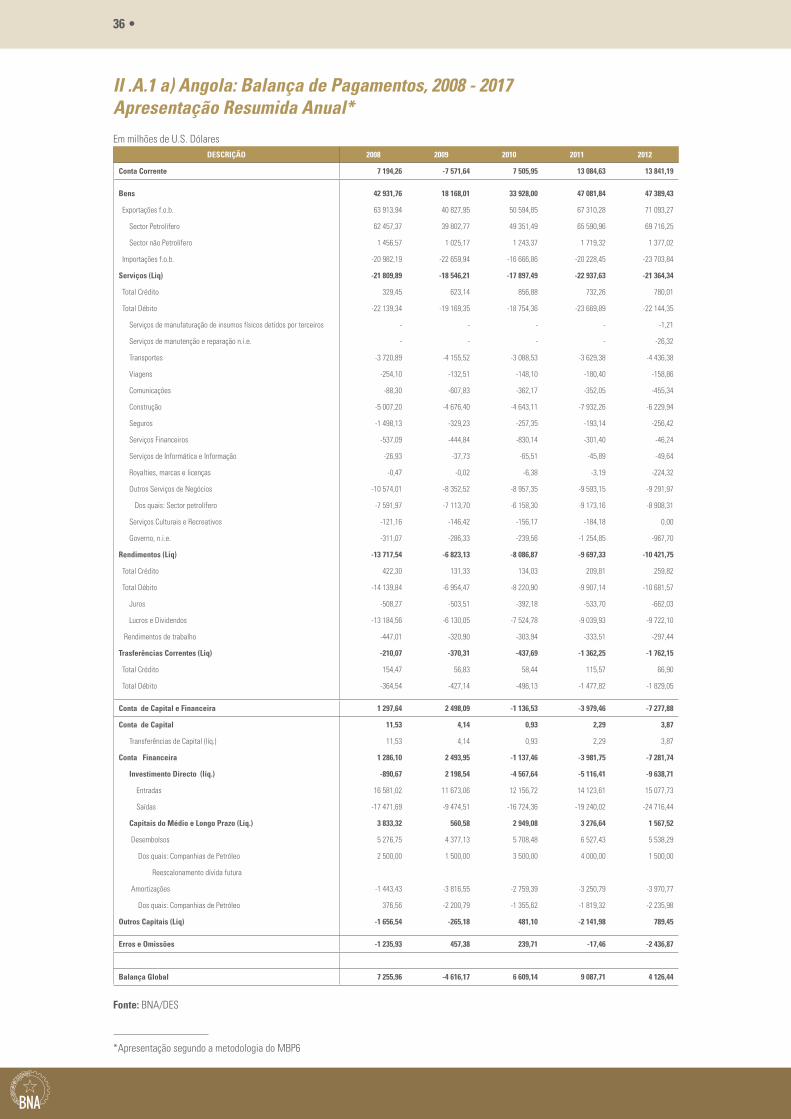
II .A.1 a) Angola: Balança de Pagamentos, 2008 - 2017 Apresentação Resumida Anual*Em milhões de U.S. Dólares
DESCRIÇÃO 2008 2009 2010 2011 2012
Conta Corrente 7 194,26 -7 571,64 7 505,95 13 084,63 13 841,19
Bens 42 931,76 18 168,01 33 928,00 47 081,84 47 389,43
Exportações f.o.b. 63 913,94 40 827,95 50 594,85 67 310,28 71 093,27
Sector Petrolífero 62 457,37 39 802,77 49 351,49 65 590,96 69 716,25
Sector não Petrolífero 1 456,57 1 025,17 1 243,37 1 719,32 1 377,02
Importações f.o.b. -20 982,19 -22 659,94 -16 666,86 -20 228,45 -23 703,84
Serviços (Liq) -21 809,89 -18 546,21 -17 897,49 -22 937,63 -21 364,34
Total Crédito 329,45 623,14 856,88 732,26 780,01
Total Débito -22 139,34 -19 169,35 -18 754,36 -23 669,89 -22 144,35
Serviços de manufaturação de insumos físicos detidos por terceiros - - - - -1,21
Serviços de manutenção e reparação n.i.e. - - - - -26,32
Transportes -3 720,89 -4 155,52 -3 088,53 -3 629,38 -4 436,38
Viagens -254,10 -132,51 -148,10 -180,40 -158,86
Comunicações -88,30 -607,83 -362,17 -352,05 -455,34
Construção -5 007,20 -4 676,40 -4 643,11 -7 932,26 -6 229,94
Seguros -1 498,13 -329,23 -257,35 -193,14 -256,42
Serviços Financeiros -537,09 -444,84 -830,14 -301,40 -46,24
Serviços de Informática e Informação -26,93 -37,73 -65,51 -45,89 -49,64
Royalties, marcas e licenças -0,47 -0,02 -6,38 -3,19 -224,32
Outros Serviços de Negócios -10 574,01 -8 352,52 -8 957,35 -9 593,15 -9 291,97
Dos quais: Sector petrolífero -7 591,97 -7 113,70 -6 158,30 -9 173,16 -8 908,31
Serviços Culturais e Recreativos -121,16 -146,42 -156,17 -184,18 0,00
Governo, n.i.e. -311,07 -286,33 -239,56 -1 254,85 -967,70
Rendimentos (Liq) -13 717,54 -6 823,13 -8 086,87 -9 697,33 -10 421,75
Total Crédito 422,30 131,33 134,03 209,81 259,82
Total Débito -14 139,84 -6 954,47 -8 220,90 -9 907,14 -10 681,57
Juros -508,27 -503,51 -392,18 -533,70 -662,03
Lucros e Dividendos -13 184,56 -6 130,05 -7 524,78 -9 039,93 -9 722,10
Rendimentos de trabalho -447,01 -320,90 -303,94 -333,51 -297,44
Trasferências Correntes (Liq) -210,07 -370,31 -437,69 -1 362,25 -1 762,15
Total Crédito 154,47 56,83 58,44 115,57 66,90
Total Débito -364,54 -427,14 -496,13 -1 477,82 -1 829,05
Conta de Capital e Financeira 1 297,64 2 498,09 -1 136,53 -3 979,46 -7 277,88
Conta de Capital 11,53 4,14 0,93 2,29 3,87
Transferências de Capital (líq.) 11,53 4,14 0,93 2,29 3,87
Conta Financeira 1 286,10 2 493,95 -1 137,46 -3 981,75 -7 281,74
Investimento Directo (líq.) -890,67 2 198,54 -4 567,64 -5 116,41 -9 638,71
Entradas 16 581,02 11 673,06 12 156,72 14 123,61 15 077,73
Saídas -17 471,69 -9 474,51 -16 724,36 -19 240,02 -24 716,44
Capitais do Médio e Longo Prazo (Líq.) 3 833,32 560,58 2 949,08 3 276,64 1 567,52
Desembolsos 5 276,75 4 377,13 5 708,48 6 527,43 5 538,29
Dos quais: Companhias de Petróleo 2 500,00 1 500,00 3 500,00 4 000,00 1 500,00
Reescalonamento dívida futura
Amortizações -1 443,43 -3 816,55 -2 759,39 -3 250,79 -3 970,77
Dos quais: Companhias de Petróleo 376,56 -2 200,79 -1 355,62 -1 819,32 -2 235,98
Outros Capitais (Liq) -1 656,54 -265,18 481,10 -2 141,98 789,45
Erros e Omissões -1 235,93 457,38 239,71 -17,46 -2 436,87
Balança Global 7 255,96 -4 616,17 6 609,14 9 087,71 4 126,44
Fonte: BNA/DES
*Apresentação segundo a metodologia do MBP6
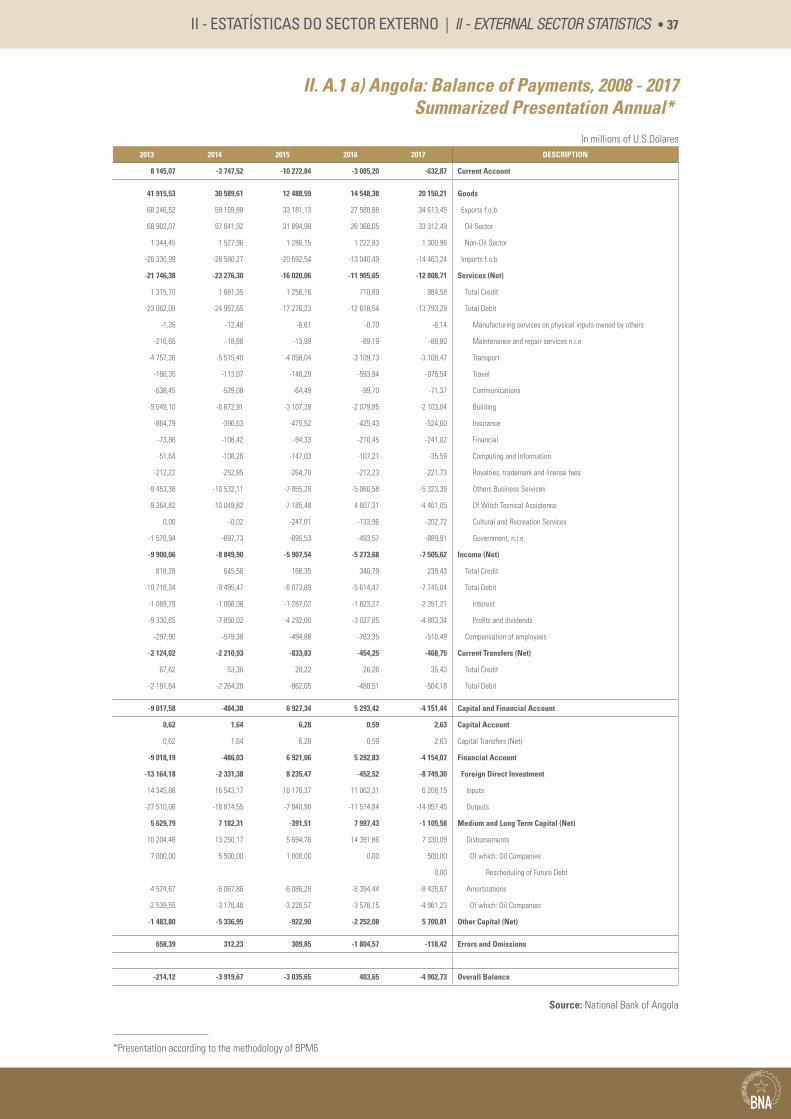
II - ESTATÍSTICAS DO SECTOR EXTERNO | II - EXTERNAL SECTOR STATISTICS • 37
II. A.1 a) Angola: Balance of Payments, 2008 - 2017 Summarized Presentation Annual*
In millions of U.S.Dólares2013 2014 2015 2016 2017 DESCRIPTION
8 145,07 -3 747,52 -10 272,84 -3 085,20 -632,87 Current Account
41 915,53 30 589,61 12 488,59 14 548,38 20 150,21 Goods
68 246,52 59 169,88 33 181,13 27 588,88 34 613,45 Exports f.o.b
66 902,07 57 641,92 31 894,98 26 366,05 33 312,49 Oil Sector
1 344,45 1 527,96 1 286,15 1 222,83 1 300,96 Non-Oil Sector
-26 330,99 -28 580,27 -20 692,54 -13 040,49 -14 463,24 Imports f.o.b
-21 746,38 -23 276,30 -16 020,06 -11 905,65 -12 808,71 Services (Net)
1 315,70 1 681,35 1 256,16 710,89 984,58 Total Credit
-23 062,09 -24 957,65 -17 276,23 -12 616,54 -13 793,29 Total Debit
-1,35 -12,48 -6,61 -0,70 -6,14 Manufacturing services on physical inputs owned by others
-216,65 -18,68 -13,99 -89,19 -88,80 Maintenance and repair services n.i.e
-4 757,36 -5 515,40 -4 058,04 -3 109,73 -3 108,47 Transport
-166,35 -113,07 -146,29 -593,94 -976,54 Travel
-638,45 -529,08 -64,49 -99,70 -71,37 Communications
-5 049,10 -6 672,91 -3 107,39 -2 079,85 -2 103,04 Building
-864,79 -396,63 -475,52 -425,43 -524,60 Insurance
-73,86 -108,42 -94,33 -210,45 -241,02 Financial
-51,64 -108,26 -147,03 -107,21 -35,59 Computing and Information
-212,22 -252,85 -264,70 -212,23 -221,73 Royalties, trademark and license fees
-9 453,38 -10 532,11 -7 955,28 -5 060,58 -5 323,39 Others Business Services
-9 264,82 -10 049,82 -7 185,48 4 607,31 -4 461,05 Of Witch Tecnical Assistence
0,00 -0,02 -247,01 -133,96 -202,72 Cultural and Recreation Services
-1 576,94 -697,73 -695,53 -493,57 -889,91 Government, n.i.e.
-9 900,06 -8 849,90 -5 907,54 -5 273,68 -7 505,62 Income (Net)
818,28 645,56 166,35 340,79 239,43 Total Credit
-10 718,34 -9 495,47 -6 073,89 -5 614,47 -7 745,04 Total Debit
-1 089,79 -1 066,06 -1 287,02 -1 823,27 -2 351,21 Interest
-9 330,65 -7 850,02 -4 292,00 -3 027,85 -4 883,34 Profits and dividends
-297,90 -579,38 -494,88 -763,35 -510,49 Compensation of employees
-2 124,02 -2 210,93 -833,83 -454,25 -468,75 Current Transfers (Net)
67,62 53,36 28,22 26,26 35,43 Total Credit
-2 191,64 -2 264,28 -862,05 -480,51 -504,18 Total Debit
-9 017,58 -484,38 6 927,34 5 293,42 -4 151,44 Capital and Financial Account
0,62 1,64 6,28 0,59 2,63 Capital Account
0,62 1,64 6,28 0,59 2,63 Capital Transfers (Net)
-9 018,19 -486,03 6 921,06 5 292,83 -4 154,07 Financial Account
-13 164,18 -2 331,38 8 235,47 -452,52 -8 749,30 Foreign Direct Investment
14 345,88 16 543,17 16 176,37 11 062,31 6 208,15 Inputs
-27 510,06 -18 874,55 -7 940,90 -11 514,84 -14 957,45 Outputs
5 629,79 7 182,31 -391,51 7 997,43 -1 105,58 Medium and Long Term Capital (Net)
10 204,46 13 250,17 5 694,76 14 391,86 7 330,09 Disbursements
7 000,00 5 500,00 1 000,00 0,00 500,00 Of which: Oil Companies
0,00 Rescheduling of Future Debt
-4 574,67 -6 067,86 -6 086,28 -6 394,44 -8 435,67 Amortizations
-2 539,55 -3 176,46 -3 226,57 -3 578,15 -4 961,23 Of which: Oil Companies
-1 483,80 -5 336,95 -922,90 -2 252,08 5 700,81 Other Capital (Net)
658,39 312,23 309,85 -1 804,57 -118,42 Errors and Omissions
-214,12 -3 919,67 -3 035,65 403,65 -4 902,73 Overall Balance
Source: National Bank of Angola
*Presentation according to the methodology of BPM6
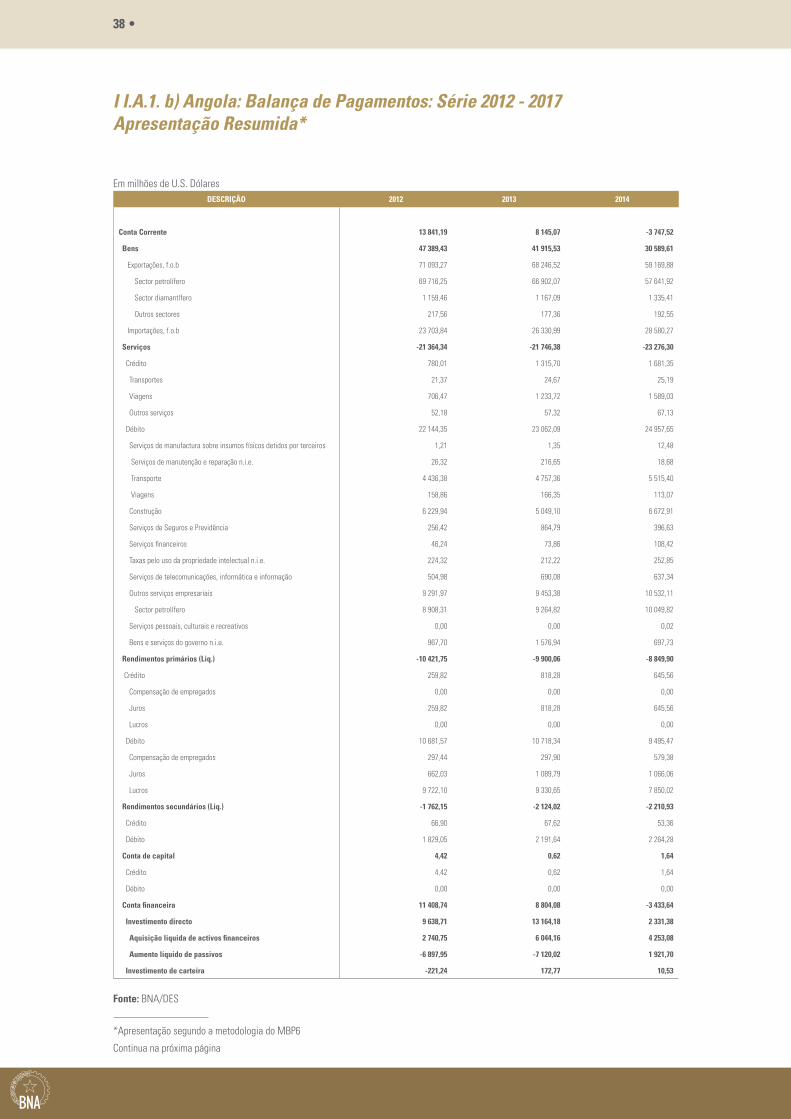
38 •
I I.A.1. b) Angola: Balança de Pagamentos: Série 2012 - 2017 Apresentação Resumida*
Em milhões de U.S. DólaresDESCRIÇÃO 2012 2013 2014
Conta Corrente 13 841,19 8 145,07 -3 747,52
Bens 47 389,43 41 915,53 30 589,61
Exportações, f.o.b 71 093,27 68 246,52 59 169,88
Sector petrolífero 69 716,25 66 902,07 57 641,92
Sector diamantífero 1 159,46 1 167,09 1 335,41
Outros sectores 217,56 177,36 192,55
Importações, f.o.b 23 703,84 26 330,99 28 580,27
Serviços -21 364,34 -21 746,38 -23 276,30
Crédito 780,01 1 315,70 1 681,35
Transportes 21,37 24,67 25,19
Viagens 706,47 1 233,72 1 589,03
Outros serviços 52,18 57,32 67,13
Débito 22 144,35 23 062,09 24 957,65
Serviços de manufactura sobre insumos físicos detidos por terceiros 1,21 1,35 12,48
Serviços de manutenção e reparação n.i.e. 26,32 216,65 18,68
Transporte 4 436,38 4 757,36 5 515,40
Viagens 158,86 166,35 113,07
Construção 6 229,94 5 049,10 6 672,91
Serviços de Seguros e Previdência 256,42 864,79 396,63
Serviços financeiros 46,24 73,86 108,42
Taxas pelo uso da propriedade intelectual n.i.e. 224,32 212,22 252,85
Serviços de telecomunicações, informática e informação 504,98 690,08 637,34
Outros serviços empresariais 9 291,97 9 453,38 10 532,11
Sector petrolífero 8 908,31 9 264,82 10 049,82
Serviços pessoais, culturais e recreativos 0,00 0,00 0,02
Bens e serviços do governo n.i.e. 967,70 1 576,94 697,73
Rendimentos primários (Liq.) -10 421,75 -9 900,06 -8 849,90
Crédito 259,82 818,28 645,56
Compensação de empregados 0,00 0,00 0,00
Juros 259,82 818,28 645,56
Lucros 0,00 0,00 0,00
Débito 10 681,57 10 718,34 9 495,47
Compensação de empregados 297,44 297,90 579,38
Juros 662,03 1 089,79 1 066,06
Lucros 9 722,10 9 330,65 7 850,02
Rendimentos secundários (Liq.) -1 762,15 -2 124,02 -2 210,93
Crédito 66,90 67,62 53,36
Débito 1 829,05 2 191,64 2 264,28
Conta de capital 4,42 0,62 1,64
Crédito 4,42 0,62 1,64
Débito 0,00 0,00 0,00
Conta financeira 11 408,74 8 804,08 -3 433,64
Investimento directo 9 638,71 13 164,18 2 331,38
Aquisição líquida de activos financeiros 2 740,75 6 044,16 4 253,08
Aumento líquido de passivos -6 897,95 -7 120,02 1 921,70
Investimento de carteira -221,24 172,77 10,53
Fonte: BNA/DES
*Apresentação segundo a metodologia do MBP6
Continua na próxima página
II - ESTATÍSTICAS DO SECTOR EXTERNO | II - EXTERNAL SECTOR STATISTICS • 39
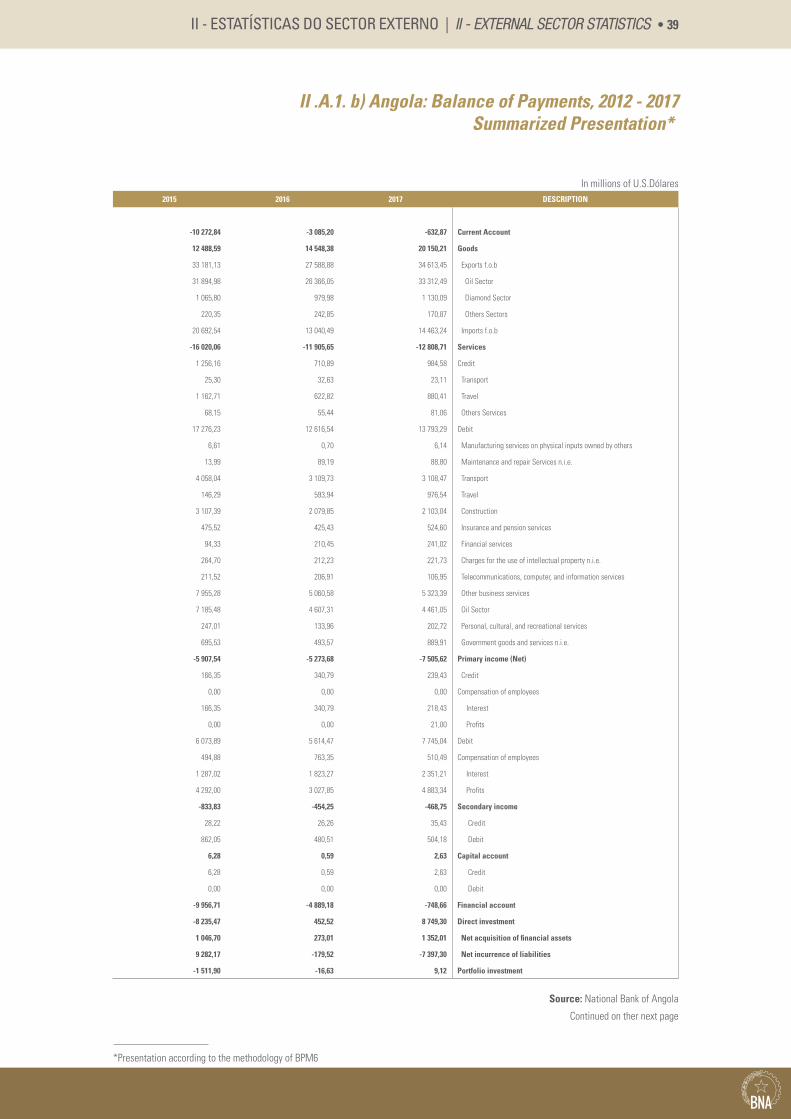
II .A.1. b) Angola: Balance of Payments, 2012 - 2017 Summarized Presentation*
In millions of U.S.Dólares2015 2016 2017 DESCRIPTION
-10 272,84 -3 085,20 -632,87 Current Account
12 488,59 14 548,38 20 150,21 Goods
33 181,13 27 588,88 34 613,45 Exports f.o.b
31 894,98 26 366,05 33 312,49 Oil Sector
1 065,80 979,98 1 130,09 Diamond Sector
220,35 242,85 170,87 Others Sectors
20 692,54 13 040,49 14 463,24 Imports f.o.b
-16 020,06 -11 905,65 -12 808,71 Services
1 256,16 710,89 984,58 Credit
25,30 32,63 23,11 Transport
1 162,71 622,82 880,41 Travel
68,15 55,44 81,06 Others Services
17 276,23 12 616,54 13 793,29 Debit
6,61 0,70 6,14 Manufacturing services on physical inputs owned by others
13,99 89,19 88,80 Maintenance and repair Services n.i.e.
4 058,04 3 109,73 3 108,47 Transport
146,29 593,94 976,54 Travel
3 107,39 2 079,85 2 103,04 Construction
475,52 425,43 524,60 Insurance and pension services
94,33 210,45 241,02 Financial services
264,70 212,23 221,73 Charges for the use of intellectual property n.i.e.
211,52 206,91 106,95 Telecommunications, computer, and information services
7 955,28 5 060,58 5 323,39 Other business services
7 185,48 4 607,31 4 461,05 Oil Sector
247,01 133,96 202,72 Personal, cultural, and recreational services
695,53 493,57 889,91 Government goods and services n.i.e.
-5 907,54 -5 273,68 -7 505,62 Primary income (Net)
166,35 340,79 239,43 Credit
0,00 0,00 0,00 Compensation of employees
166,35 340,79 218,43 Interest
0,00 0,00 21,00 Profits
6 073,89 5 614,47 7 745,04 Debit
494,88 763,35 510,49 Compensation of employees
1 287,02 1 823,27 2 351,21 Interest
4 292,00 3 027,85 4 883,34 Profits
-833,83 -454,25 -468,75 Secondary income
28,22 26,26 35,43 Credit
862,05 480,51 504,18 Debit
6,28 0,59 2,63 Capital account
6,28 0,59 2,63 Credit
0,00 0,00 0,00 Debit
-9 956,71 -4 889,18 -748,66 Financial account
-8 235,47 452,52 8 749,30 Direct investment
1 046,70 273,01 1 352,01 Net acquisition of financial assets
9 282,17 -179,52 -7 397,30 Net incurrence of liabilities
-1 511,90 -16,63 9,12 Portfolio investment
Source: National Bank of Angola
Continued on ther next page
*Presentation according to the methodology of BPM6
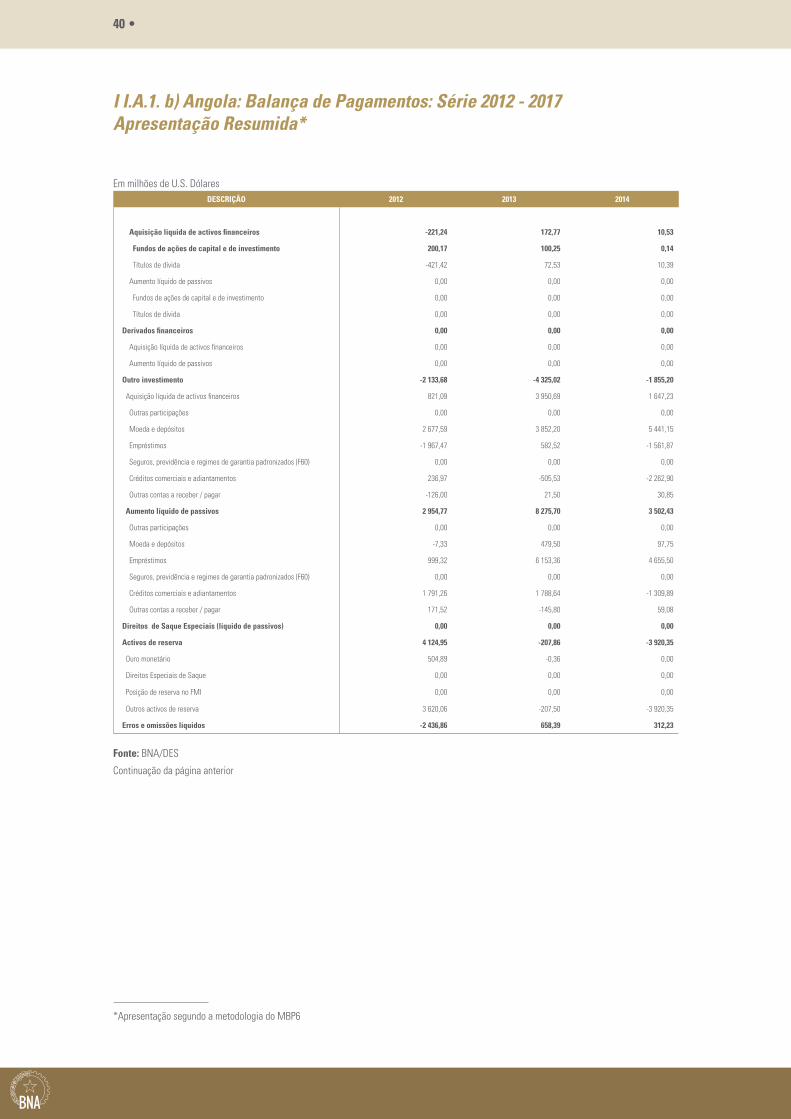
40 •
I I.A.1. b) Angola: Balança de Pagamentos: Série 2012 - 2017 Apresentação Resumida*
Em milhões de U.S. DólaresDESCRIÇÃO 2012 2013 2014
Aquisição líquida de activos financeiros -221,24 172,77 10,53
Fundos de ações de capital e de investimento 200,17 100,25 0,14
Títulos de dívida -421,42 72,53 10,39
Aumento líquido de passivos 0,00 0,00 0,00
Fundos de ações de capital e de investimento 0,00 0,00 0,00
Títulos de dívida 0,00 0,00 0,00
Derivados financeiros 0,00 0,00 0,00
Aquisição líquida de activos financeiros 0,00 0,00 0,00
Aumento líquido de passivos 0,00 0,00 0,00
Outro investimento -2 133,68 -4 325,02 -1 855,20
Aquisição líquida de activos financeiros 821,09 3 950,69 1 647,23
Outras participações 0,00 0,00 0,00
Moeda e depósitos 2 677,59 3 852,20 5 441,15
Empréstimos -1 967,47 582,52 -1 561,87
Seguros, previdência e regimes de garantia padronizados (F60) 0,00 0,00 0,00
Créditos comerciais e adiantamentos 236,97 -505,53 -2 262,90
Outras contas a receber / pagar -126,00 21,50 30,85
Aumento líquido de passivos 2 954,77 8 275,70 3 502,43
Outras participações 0,00 0,00 0,00
Moeda e depósitos -7,33 479,50 97,75
Empréstimos 999,32 6 153,36 4 655,50
Seguros, previdência e regimes de garantia padronizados (F60) 0,00 0,00 0,00
Créditos comerciais e adiantamentos 1 791,26 1 788,64 -1 309,89
Outras contas a receber / pagar 171,52 -145,80 59,08
Direitos de Saque Especiais (líquido de passivos) 0,00 0,00 0,00
Activos de reserva 4 124,95 -207,86 -3 920,35
Ouro monetário 504,89 -0,36 0,00
Direitos Especiais de Saque 0,00 0,00 0,00
Posição de reserva no FMI 0,00 0,00 0,00
Outros activos de reserva 3 620,06 -207,50 -3 920,35
Erros e omissões líquidos -2 436,86 658,39 312,23
Fonte: BNA/DES
Continuação da página anterior
*Apresentação segundo a metodologia do MBP6
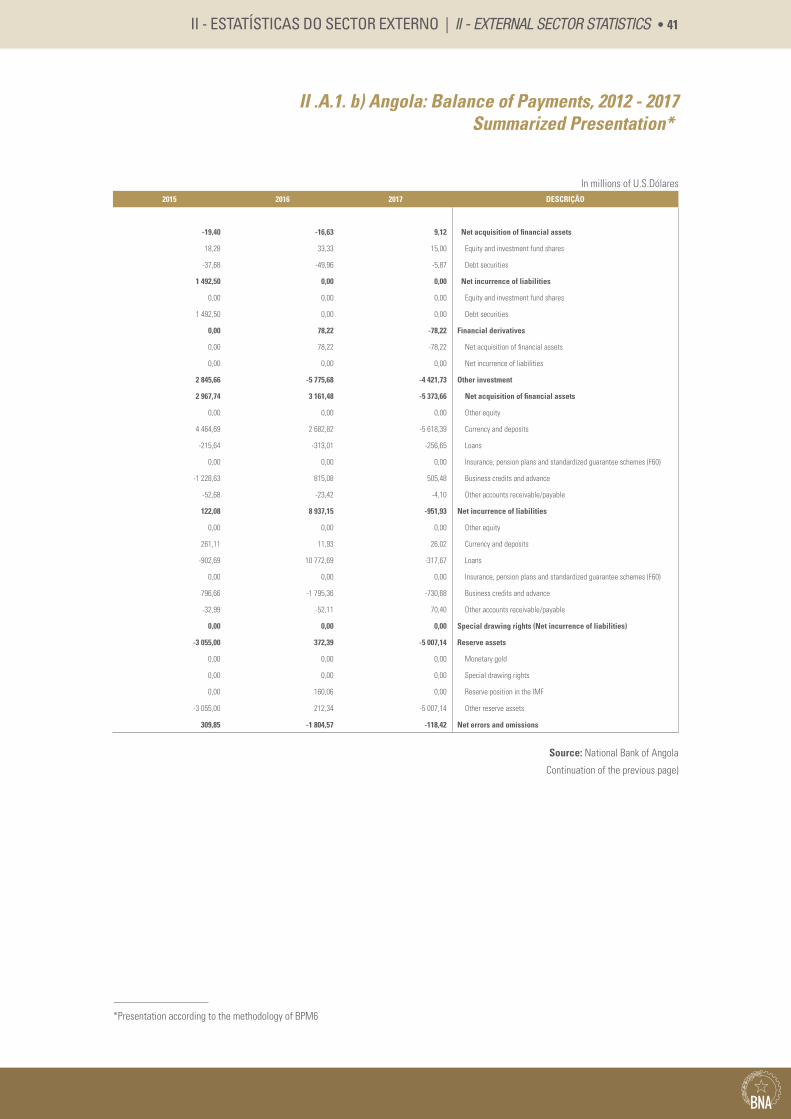
II - ESTATÍSTICAS DO SECTOR EXTERNO | II - EXTERNAL SECTOR STATISTICS • 41
II .A.1. b) Angola: Balance of Payments, 2012 - 2017 Summarized Presentation*
In millions of U.S.Dólares2015 2016 2017 DESCRIÇÃO
-19,40 -16,63 9,12 Net acquisition of financial assets
18,28 33,33 15,00 Equity and investment fund shares
-37,68 -49,96 -5,87 Debt securities
1 492,50 0,00 0,00 Net incurrence of liabilities
0,00 0,00 0,00 Equity and investment fund shares
1 492,50 0,00 0,00 Debt securities
0,00 78,22 -78,22 Financial derivatives
0,00 78,22 -78,22 Net acquisition of financial assets
0,00 0,00 0,00 Net incurrence of liabilities
2 845,66 -5 775,68 -4 421,73 Other investment
2 967,74 3 161,48 -5 373,66 Net acquisition of financial assets
0,00 0,00 0,00 Other equity
4 464,69 2 682,82 -5 618,39 Currency and deposits
-215,64 -313,01 -256,65 Loans
0,00 0,00 0,00 Insurance, pension plans and standardized guarantee schemes (F60)
-1 228,63 815,08 505,48 Business credits and advance
-52,68 -23,42 -4,10 Other accounts receivable/payable
122,08 8 937,15 -951,93 Net incurrence of liabilities
0,00 0,00 0,00 Other equity
261,11 11,93 26,02 Currency and deposits
-902,69 10 772,69 -317,67 Loans
0,00 0,00 0,00 Insurance, pension plans and standardized guarantee schemes (F60)
796,66 -1 795,36 -730,68 Business credits and advance
-32,99 -52,11 70,40 Other accounts receivable/payable
0,00 0,00 0,00 Special drawing rights (Net incurrence of liabilities)
-3 055,00 372,39 -5 007,14 Reserve assets
0,00 0,00 0,00 Monetary gold
0,00 0,00 0,00 Special drawing rights
0,00 160,06 0,00 Reserve position in the IMF
-3 055,00 212,34 -5 007,14 Other reserve assets
309,85 -1 804,57 -118,42 Net errors and omissions
Source: National Bank of Angola
Continuation of the previous page)
*Presentation according to the methodology of BPM6
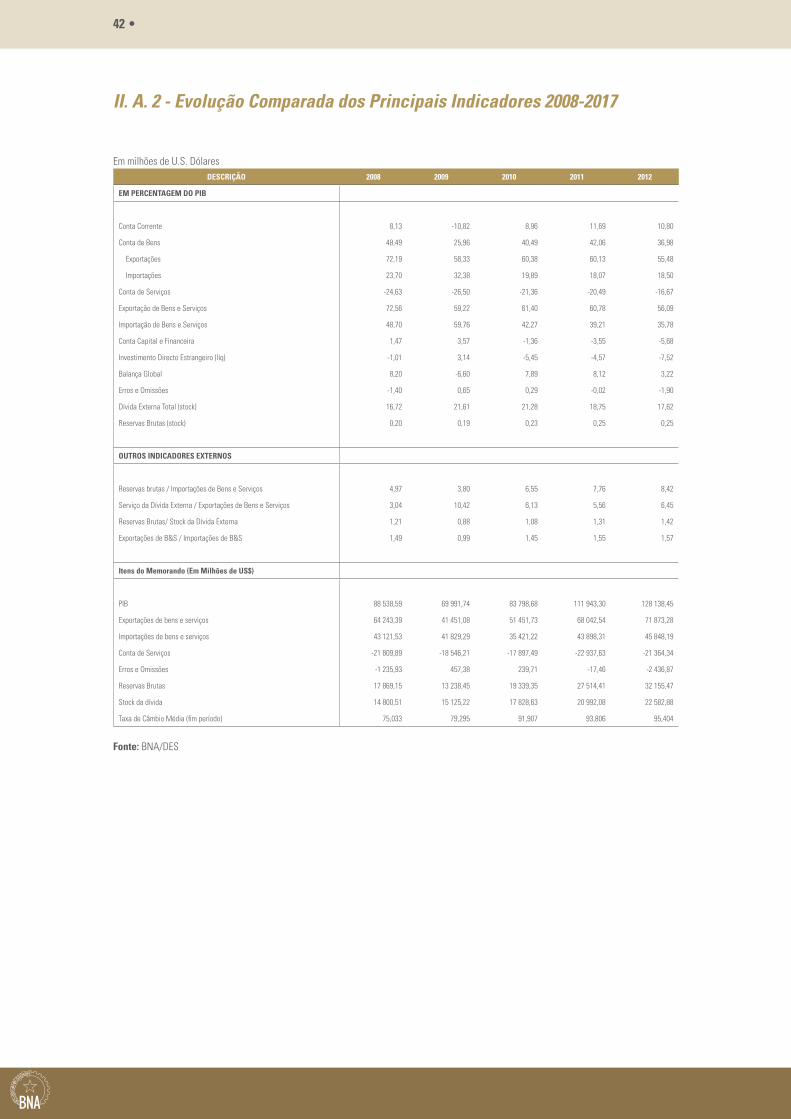
42 •
II. A. 2 - Evolução Comparada dos Principais Indicadores 2008-2017
Em milhões de U.S. DólaresDESCRIÇÃO 2008 2009 2010 2011 2012
EM PERCENTAGEM DO PIB
Conta Corrente 8,13 -10,82 8,96 11,69 10,80
Conta de Bens 48,49 25,96 40,49 42,06 36,98
Exportações 72,19 58,33 60,38 60,13 55,48
Importações 23,70 32,38 19,89 18,07 18,50
Conta de Serviços -24,63 -26,50 -21,36 -20,49 -16,67
Exportação de Bens e Serviços 72,56 59,22 61,40 60,78 56,09
Importação de Bens e Serviços 48,70 59,76 42,27 39,21 35,78
Conta Capital e Financeira 1,47 3,57 -1,36 -3,55 -5,68
Investimento Directo Estrangeiro (líq) -1,01 3,14 -5,45 -4,57 -7,52
Balança Global 8,20 -6,60 7,89 8,12 3,22
Erros e Omissões -1,40 0,65 0,29 -0,02 -1,90
Dívida Externa Total (stock) 16,72 21,61 21,28 18,75 17,62
Reservas Brutas (stock) 0,20 0,19 0,23 0,25 0,25
OUTROS INDICADORES EXTERNOS
Reservas brutas / Importações de Bens e Serviços 4,97 3,80 6,55 7,76 8,42
Serviço da Dívida Externa / Exportações de Bens e Serviços 3,04 10,42 6,13 5,56 6,45
Reservas Brutas/ Stock da Dívida Externa 1,21 0,88 1,08 1,31 1,42
Exportações de B&S / Importações de B&S 1,49 0,99 1,45 1,55 1,57
Itens do Memorando (Em Milhões de US$)
PIB 88 538,59 69 991,74 83 798,68 111 943,30 128 138,45
Exportações de bens e serviços 64 243,39 41 451,08 51 451,73 68 042,54 71 873,28
Importações de bens e serviços 43 121,53 41 829,29 35 421,22 43 898,31 45 848,19
Conta de Serviços -21 809,89 -18 546,21 -17 897,49 -22 937,63 -21 364,34
Erros e Omissões -1 235,93 457,38 239,71 -17,46 -2 436,87
Reservas Brutas 17 869,15 13 238,45 19 339,35 27 514,41 32 155,47
Stock da dívida 14 800,51 15 125,22 17 828,63 20 992,08 22 582,88
Taxa de Câmbio Média (fim período) 75,033 79,295 91,907 93,806 95,404
Fonte: BNA/DES
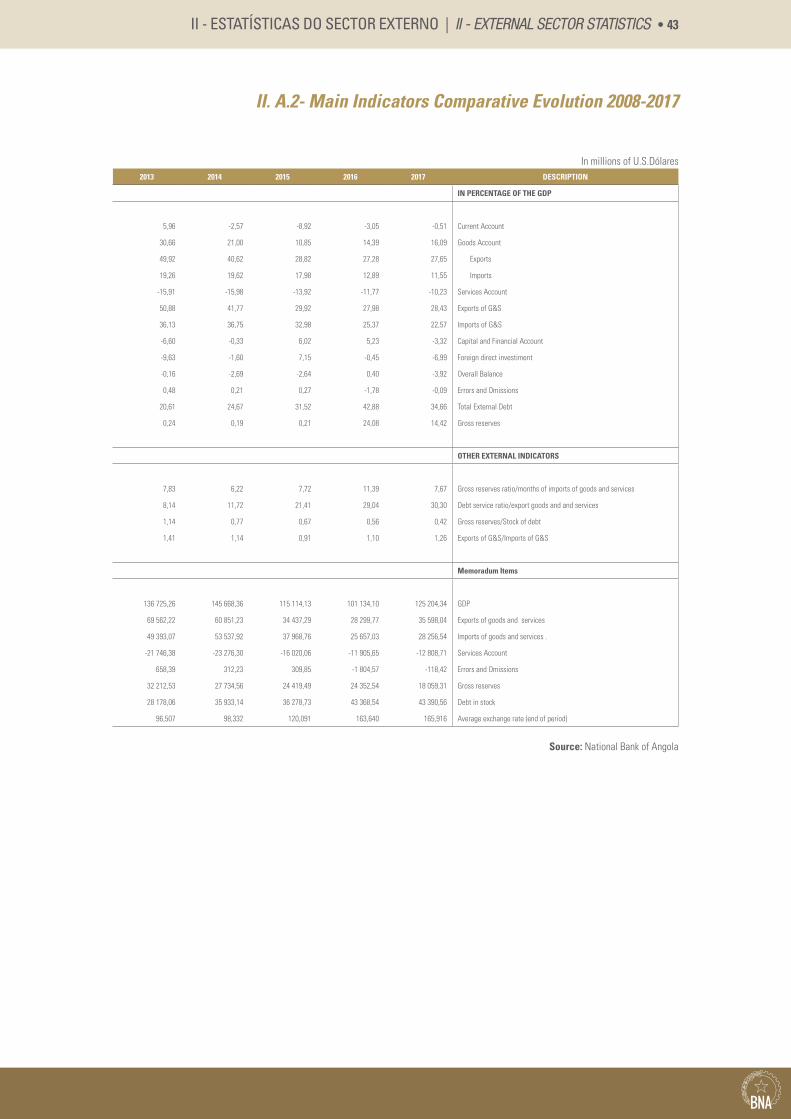
II - ESTATÍSTICAS DO SECTOR EXTERNO | II - EXTERNAL SECTOR STATISTICS • 43
II. A.2- Main Indicators Comparative Evolution 2008-2017
In millions of U.S.Dólares2013 2014 2015 2016 2017 DESCRIPTION
IN PERCENTAGE OF THE GDP
5,96 -2,57 -8,92 -3,05 -0,51 Current Account
30,66 21,00 10,85 14,39 16,09 Goods Account
49,92 40,62 28,82 27,28 27,65 Exports
19,26 19,62 17,98 12,89 11,55 Imports
-15,91 -15,98 -13,92 -11,77 -10,23 Services Account
50,88 41,77 29,92 27,98 28,43 Exports of G&S
36,13 36,75 32,98 25,37 22,57 Imports of G&S
-6,60 -0,33 6,02 5,23 -3,32 Capital and Financial Account
-9,63 -1,60 7,15 -0,45 -6,99 Foreign direct investiment
-0,16 -2,69 -2,64 0,40 -3,92 Overall Balance
0,48 0,21 0,27 -1,78 -0,09 Errors and Omissions
20,61 24,67 31,52 42,88 34,66 Total External Debt
0,24 0,19 0,21 24,08 14,42 Gross reserves
OTHER EXTERNAL INDICATORS
7,83 6,22 7,72 11,39 7,67 Gross reserves ratio/months of imports of goods and services
8,14 11,72 21,41 29,04 30,30 Debt service ratio/export goods and and services
1,14 0,77 0,67 0,56 0,42 Gross reserves/Stock of debt
1,41 1,14 0,91 1,10 1,26 Exports of G&S/Imports of G&S
Memoradum Items
136 725,26 145 668,36 115 114,13 101 134,10 125 204,34 GDP
69 562,22 60 851,23 34 437,29 28 299,77 35 598,04 Exports of goods and services
49 393,07 53 537,92 37 968,76 25 657,03 28 256,54 Imports of goods and services .
-21 746,38 -23 276,30 -16 020,06 -11 905,65 -12 808,71 Services Account
658,39 312,23 309,85 -1 804,57 -118,42 Errors and Omissions
32 212,53 27 734,56 24 419,49 24 352,54 18 059,31 Gross reserves
28 178,06 35 933,14 36 278,73 43 368,54 43 390,56 Debt in stock
96,507 98,332 120,091 163,640 165,916 Average exchange rate (end of period)
Source: National Bank of Angola
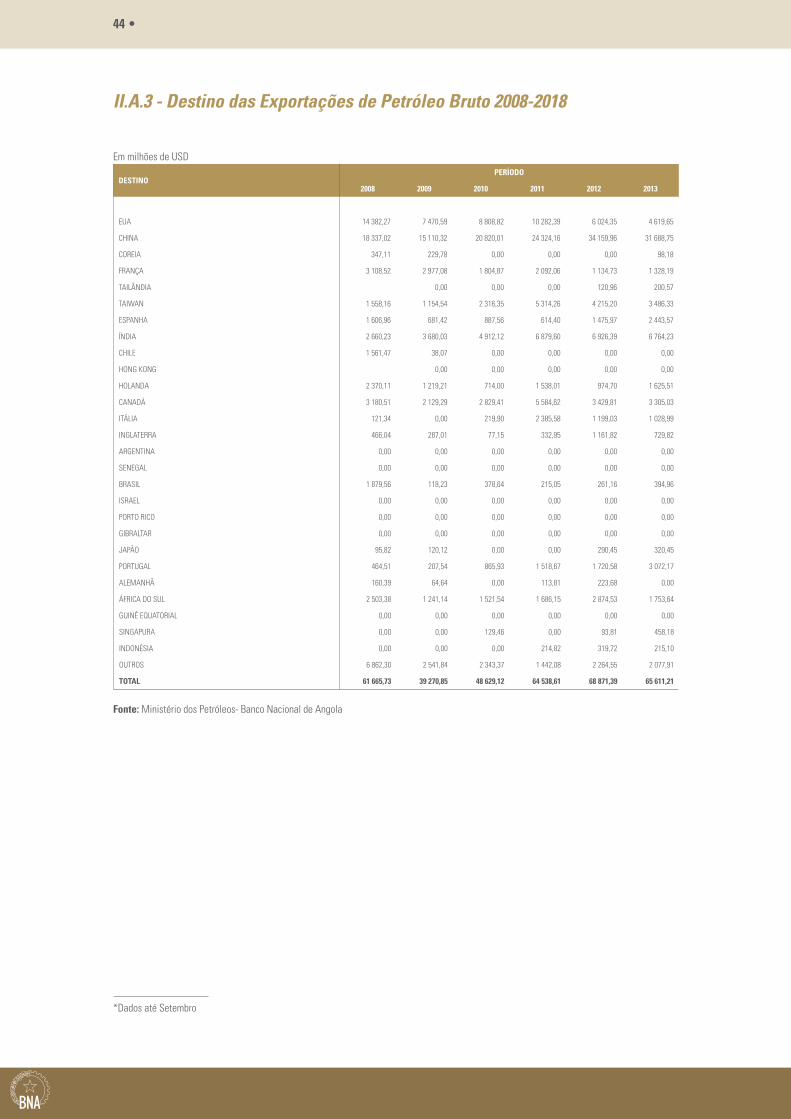
44 •
II.A.3 - Destino das Exportações de Petróleo Bruto 2008-2018
Em milhões de USD
DESTINOPERÍODO
2008 2009 2010 2011 2012 2013
EUA 14 382,27 7 470,59 8 808,82 10 282,39 6 024,35 4 619,65
CHINA 18 337,02 15 110,32 20 820,01 24 324,16 34 159,96 31 688,75
COREIA 347,11 229,78 0,00 0,00 0,00 98,18
FRANÇA 3 108,52 2 977,08 1 804,87 2 092,06 1 134,73 1 328,19
TAILÂNDIA 0,00 0,00 0,00 120,96 200,57
TAIWAN 1 558,16 1 154,54 2 316,35 5 314,26 4 215,20 3 486,33
ESPANHA 1 606,96 681,42 887,56 614,40 1 475,97 2 443,57
ÍNDIA 2 660,23 3 680,03 4 912,12 6 879,60 6 926,39 6 764,23
CHILE 1 561,47 38,07 0,00 0,00 0,00 0,00
HONG KONG 0,00 0,00 0,00 0,00 0,00
HOLANDA 2 370,11 1 219,21 714,00 1 538,01 974,70 1 625,51
CANADÁ 3 180,51 2 129,29 2 829,41 5 584,62 3 429,81 3 305,03
ITÁLIA 121,34 0,00 219,90 2 385,58 1 199,03 1 028,99
INGLATERRA 466,04 287,01 77,15 332,95 1 161,82 729,82
ARGENTINA 0,00 0,00 0,00 0,00 0,00 0,00
SENEGAL 0,00 0,00 0,00 0,00 0,00 0,00
BRASIL 1 879,56 118,23 378,64 215,05 261,16 394,96
ISRAEL 0,00 0,00 0,00 0,00 0,00 0,00
PORTO RICO 0,00 0,00 0,00 0,00 0,00 0,00
GIBRALTAR 0,00 0,00 0,00 0,00 0,00 0,00
JAPÃO 95,82 120,12 0,00 0,00 290,45 320,45
PORTUGAL 464,51 207,54 865,93 1 518,67 1 720,58 3 072,17
ALEMANHÃ 160,39 64,64 0,00 113,81 223,68 0,00
ÁFRICA DO SUL 2 503,38 1 241,14 1 521,54 1 686,15 2 874,53 1 753,64
GUINÉ EQUATORIAL 0,00 0,00 0,00 0,00 0,00 0,00
SINGAPURA 0,00 0,00 129,46 0,00 93,81 458,18
INDONÉSIA 0,00 0,00 0,00 214,82 319,72 215,10
OUTROS 6 862,30 2 541,84 2 343,37 1 442,08 2 264,55 2 077,91
TOTAL 61 665,73 39 270,85 48 629,12 64 538,61 68 871,39 65 611,21
Fonte: Ministério dos Petróleos- Banco Nacional de Angola
*Dados até Setembro
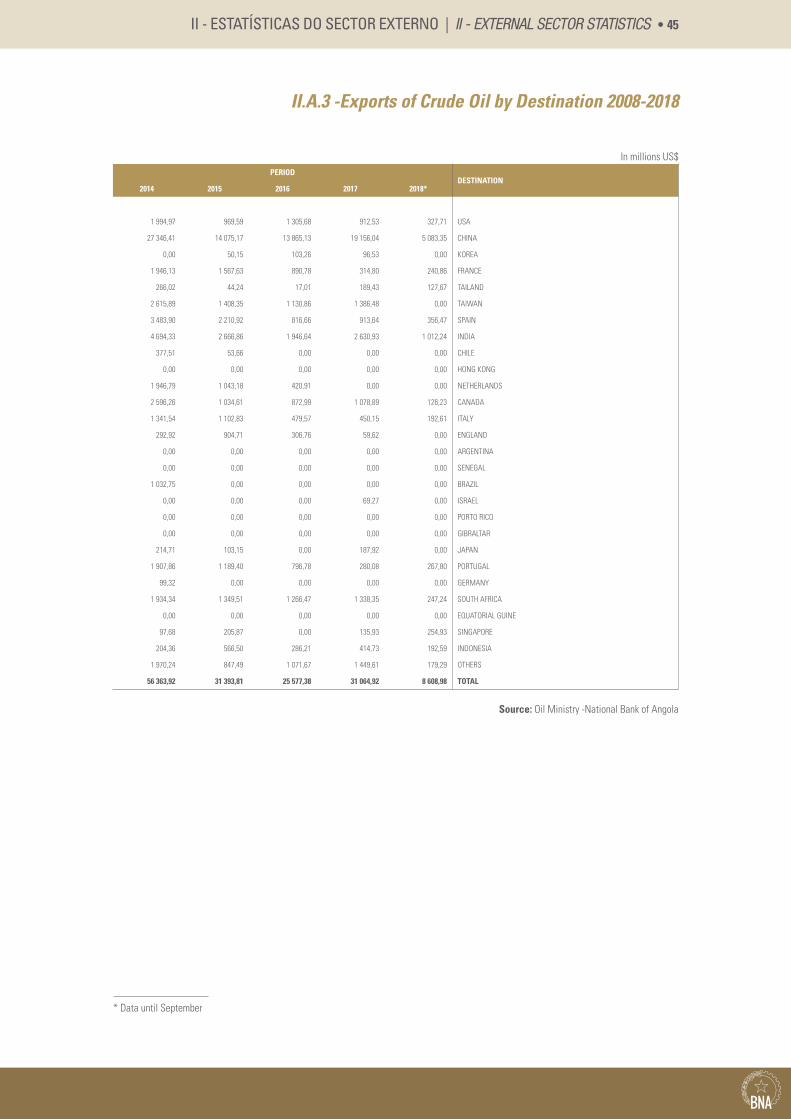
II - ESTATÍSTICAS DO SECTOR EXTERNO | II - EXTERNAL SECTOR STATISTICS • 45
II.A.3 -Exports of Crude Oil by Destination 2008-2018
In millions US$PERIOD
DESTINATION2014 2015 2016 2017 2018*
1 994,97 969,59 1 305,68 912,53 327,71 USA
27 346,41 14 075,17 13 865,13 19 156,04 5 083,35 CHINA
0,00 50,15 103,26 96,53 0,00 KOREA
1 946,13 1 567,63 890,78 314,80 240,86 FRANCE
266,02 44,24 17,01 189,43 127,67 TAILAND
2 615,89 1 408,35 1 130,86 1 386,48 0,00 TAIWAN
3 483,90 2 210,92 816,66 913,64 356,47 SPAIN
4 694,33 2 666,86 1 946,64 2 630,93 1 012,24 INDIA
377,51 53,66 0,00 0,00 0,00 CHILE
0,00 0,00 0,00 0,00 0,00 HONG KONG
1 946,79 1 043,18 420,91 0,00 0,00 NETHERLANDS
2 596,26 1 034,61 872,99 1 078,89 126,23 CANADA
1 341,54 1 102,83 479,57 450,15 192,61 ITALY
292,92 904,71 306,76 59,62 0,00 ENGLAND
0,00 0,00 0,00 0,00 0,00 ARGENTINA
0,00 0,00 0,00 0,00 0,00 SENEGAL
1 032,75 0,00 0,00 0,00 0,00 BRAZIL
0,00 0,00 0,00 69,27 0,00 ISRAEL
0,00 0,00 0,00 0,00 0,00 PORTO RICO
0,00 0,00 0,00 0,00 0,00 GIBRALTAR
214,71 103,15 0,00 187,92 0,00 JAPAN
1 907,86 1 189,40 796,78 280,08 267,80 PORTUGAL
99,32 0,00 0,00 0,00 0,00 GERMANY
1 934,34 1 349,51 1 266,47 1 338,35 247,24 SOUTH AFRICA
0,00 0,00 0,00 0,00 0,00 EQUATORIAL GUINE
97,68 205,87 0,00 135,93 254,93 SINGAPORE
204,36 566,50 286,21 414,73 192,59 INDONESIA
1 970,24 847,49 1 071,67 1 449,61 179,29 OTHERS
56 363,92 31 393,81 25 577,38 31 064,92 8 608,98 TOTAL
Source: Oil Ministry -National Bank of Angola
* Data until September
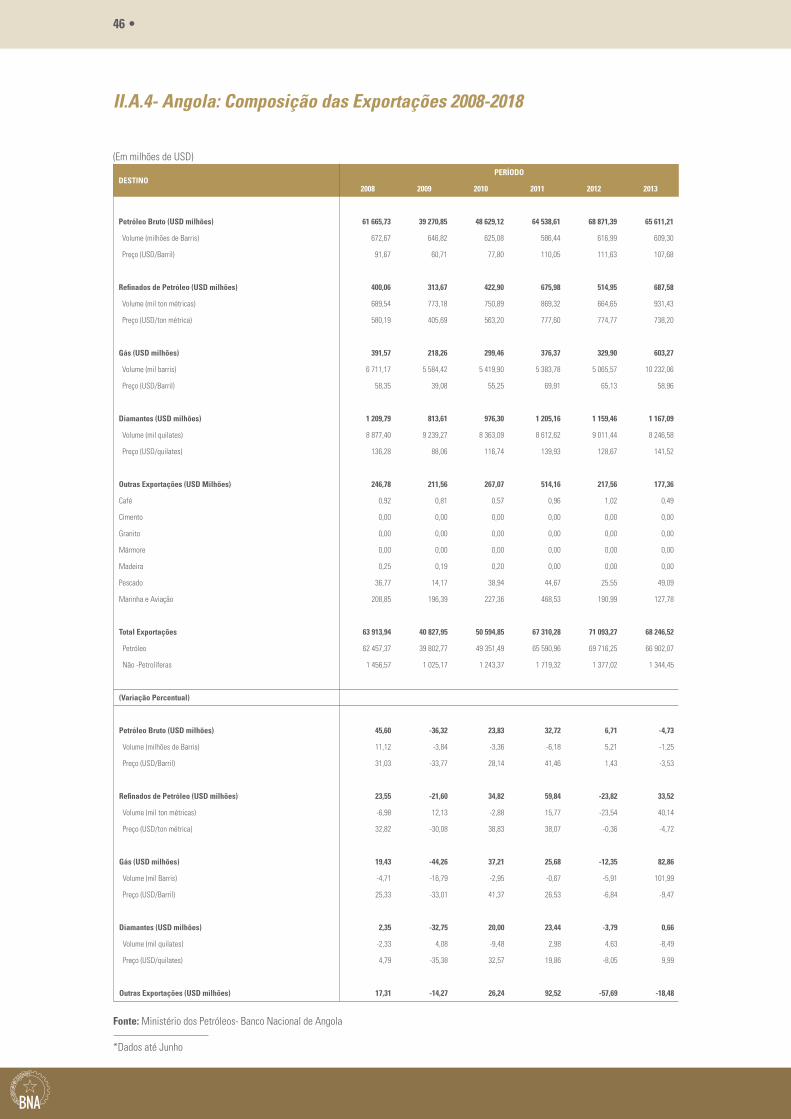
46 •
II.A.4- Angola: Composição das Exportações 2008-2018
(Em milhões de USD)
DESTINOPERÍODO
2008 2009 2010 2011 2012 2013
Petróleo Bruto (USD milhões) 61 665,73 39 270,85 48 629,12 64 538,61 68 871,39 65 611,21
Volume (milhões de Barris) 672,67 646,82 625,08 586,44 616,99 609,30
Preço (USD/Barril) 91,67 60,71 77,80 110,05 111,63 107,68
Refinados de Petróleo (USD milhões) 400,06 313,67 422,90 675,98 514,95 687,58
Volume (mil ton métricas) 689,54 773,18 750,89 869,32 664,65 931,43
Preço (USD/ton métrica) 580,19 405,69 563,20 777,60 774,77 738,20
Gás (USD milhões) 391,57 218,26 299,46 376,37 329,90 603,27
Volume (mil barris) 6 711,17 5 584,42 5 419,90 5 383,78 5 065,57 10 232,06
Preço (USD/Barril) 58,35 39,08 55,25 69,91 65,13 58,96
Diamantes (USD milhões) 1 209,79 813,61 976,30 1 205,16 1 159,46 1 167,09
Volume (mil quilates) 8 877,40 9 239,27 8 363,09 8 612,62 9 011,44 8 246,58
Preço (USD/quilates) 136,28 88,06 116,74 139,93 128,67 141,52
Outras Exportações (USD Milhões) 246,78 211,56 267,07 514,16 217,56 177,36
Café 0,92 0,81 0,57 0,96 1,02 0,49
Cimento 0,00 0,00 0,00 0,00 0,00 0,00
Granito 0,00 0,00 0,00 0,00 0,00 0,00
Mármore 0,00 0,00 0,00 0,00 0,00 0,00
Madeira 0,25 0,19 0,20 0,00 0,00 0,00
Pescado 36,77 14,17 38,94 44,67 25,55 49,09
Marinha e Aviação 208,85 196,39 227,36 468,53 190,99 127,78
Total Exportações 63 913,94 40 827,95 50 594,85 67 310,28 71 093,27 68 246,52
Petróleo 62 457,37 39 802,77 49 351,49 65 590,96 69 716,25 66 902,07
Não -Petrolíferas 1 456,57 1 025,17 1 243,37 1 719,32 1 377,02 1 344,45
(Variação Percentual)
Petróleo Bruto (USD milhões) 45,60 -36,32 23,83 32,72 6,71 -4,73
Volume (milhões de Barris) 11,12 -3,84 -3,36 -6,18 5,21 -1,25
Preço (USD/Barril) 31,03 -33,77 28,14 41,46 1,43 -3,53
Refinados de Petróleo (USD milhões) 23,55 -21,60 34,82 59,84 -23,82 33,52
Volume (mil ton métricas) -6,98 12,13 -2,88 15,77 -23,54 40,14
Preço (USD/ton métrica) 32,82 -30,08 38,83 38,07 -0,36 -4,72
Gás (USD milhões) 19,43 -44,26 37,21 25,68 -12,35 82,86
Volume (mil Barris) -4,71 -16,79 -2,95 -0,67 -5,91 101,99
Preço (USD/Barril) 25,33 -33,01 41,37 26,53 -6,84 -9,47
Diamantes (USD milhões) 2,35 -32,75 20,00 23,44 -3,79 0,66
Volume (mil quilates) -2,33 4,08 -9,48 2,98 4,63 -8,49
Preço (USD/quilates) 4,79 -35,38 32,57 19,86 -8,05 9,99
Outras Exportações (USD milhões) 17,31 -14,27 26,24 92,52 -57,69 -18,48
Fonte: Ministério dos Petróleos- Banco Nacional de Angola
*Dados até Junho
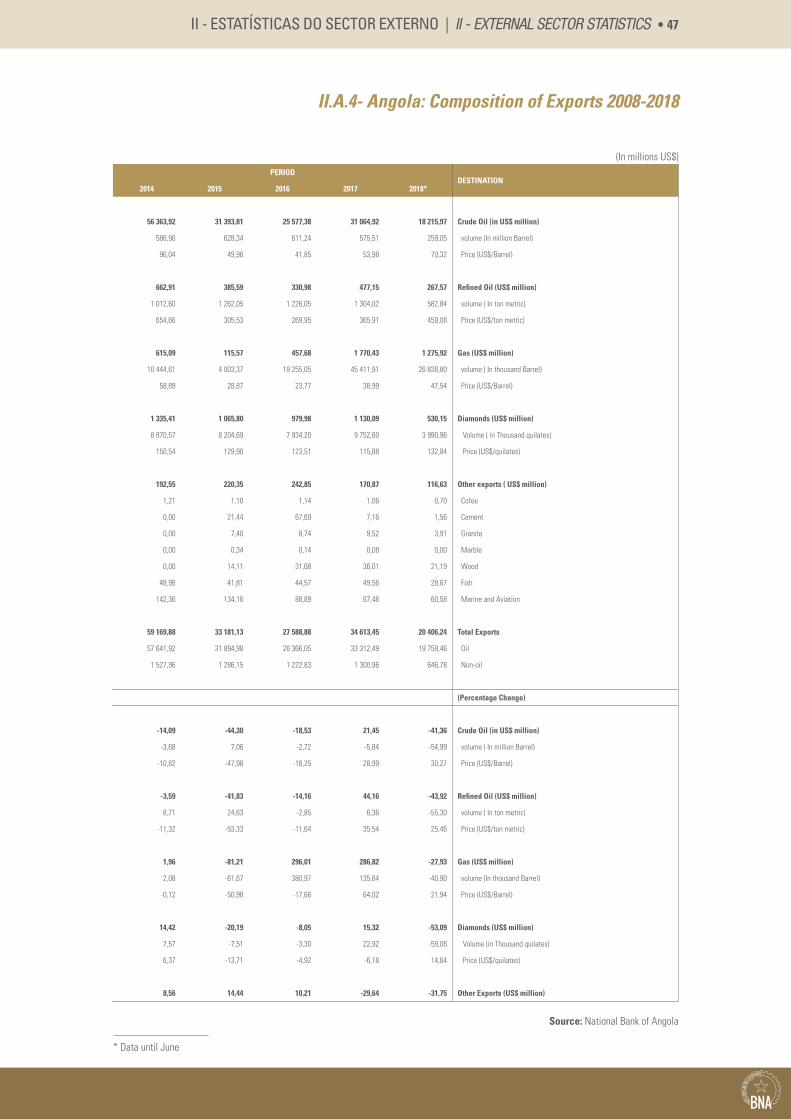
II - ESTATÍSTICAS DO SECTOR EXTERNO | II - EXTERNAL SECTOR STATISTICS • 47
II.A.4- Angola: Composition of Exports 2008-2018
(In millions US$)PERIOD
DESTINATION2014 2015 2016 2017 2018*
56 363,92 31 393,81 25 577,38 31 064,92 18 215,97 Crude Oil (in US$ million)
586,90 628,34 611,24 575,51 259,05 volume (In million Barrel)
96,04 49,96 41,85 53,98 70,32 Price (US$/Barrel)
662,91 385,59 330,98 477,15 267,57 Refined Oil (US$ million)
1 012,60 1 262,05 1 226,05 1 304,02 582,84 volume ( In ton metric)
654,66 305,53 269,95 365,91 459,08 Price (US$/ton metric)
615,09 115,57 457,68 1 770,43 1 275,92 Gas (US$ million)
10 444,61 4 003,37 19 255,05 45 411,91 26 838,80 volume ( In thousand Barrel)
58,89 28,87 23,77 38,99 47,54 Price (US$/Barrel)
1 335,41 1 065,80 979,98 1 130,09 530,15 Diamonds (US$ million)
8 870,57 8 204,69 7 934,20 9 752,60 3 990,96 Volume ( in Thousand quilates)
150,54 129,90 123,51 115,88 132,84 Price (US$/quilates)
192,55 220,35 242,85 170,87 116,63 Other exports ( US$ million)
1,21 1,10 1,14 1,06 0,70 Cofee
0,00 21,44 67,69 7,16 1,56 Cement
0,00 7,40 8,74 9,52 3,91 Granite
0,00 0,34 0,14 0,08 0,00 Marble
0,00 14,11 31,68 36,01 21,19 Wood
48,98 41,81 44,57 49,56 28,67 Fish
142,36 134,16 88,89 67,48 60,58 Marine and Aviation
59 169,88 33 181,13 27 588,88 34 613,45 20 406,24 Total Exports
57 641,92 31 894,98 26 366,05 33 312,49 19 759,46 Oil
1 527,96 1 286,15 1 222,83 1 300,96 646,78 Non-oil
(Percentage Change)
-14,09 -44,30 -18,53 21,45 -41,36 Crude Oil (in US$ million)
-3,68 7,06 -2,72 -5,84 -54,99 volume ( In million Barrel)
-10,82 -47,98 -16,25 28,99 30,27 Price (US$/Barrel)
-3,59 -41,83 -14,16 44,16 -43,92 Refined Oil (US$ million)
8,71 24,63 -2,85 6,36 -55,30 volume ( In ton metric)
-11,32 -53,33 -11,64 35,54 25,46 Price (US$/ton metric)
1,96 -81,21 296,01 286,82 -27,93 Gas (US$ million)
2,08 -61,67 380,97 135,84 -40,90 volume (In thousand Barrel)
-0,12 -50,98 -17,66 64,02 21,94 Price (US$/Barrel)
14,42 -20,19 -8,05 15,32 -53,09 Diamonds (US$ million)
7,57 -7,51 -3,30 22,92 -59,08 Volume (in Thousand quilates)
6,37 -13,71 -4,92 -6,18 14,64 Price (US$/quilates)
8,56 14,44 10,21 -29,64 -31,75 Other Exports (US$ million)
Source: National Bank of Angola
* Data until June
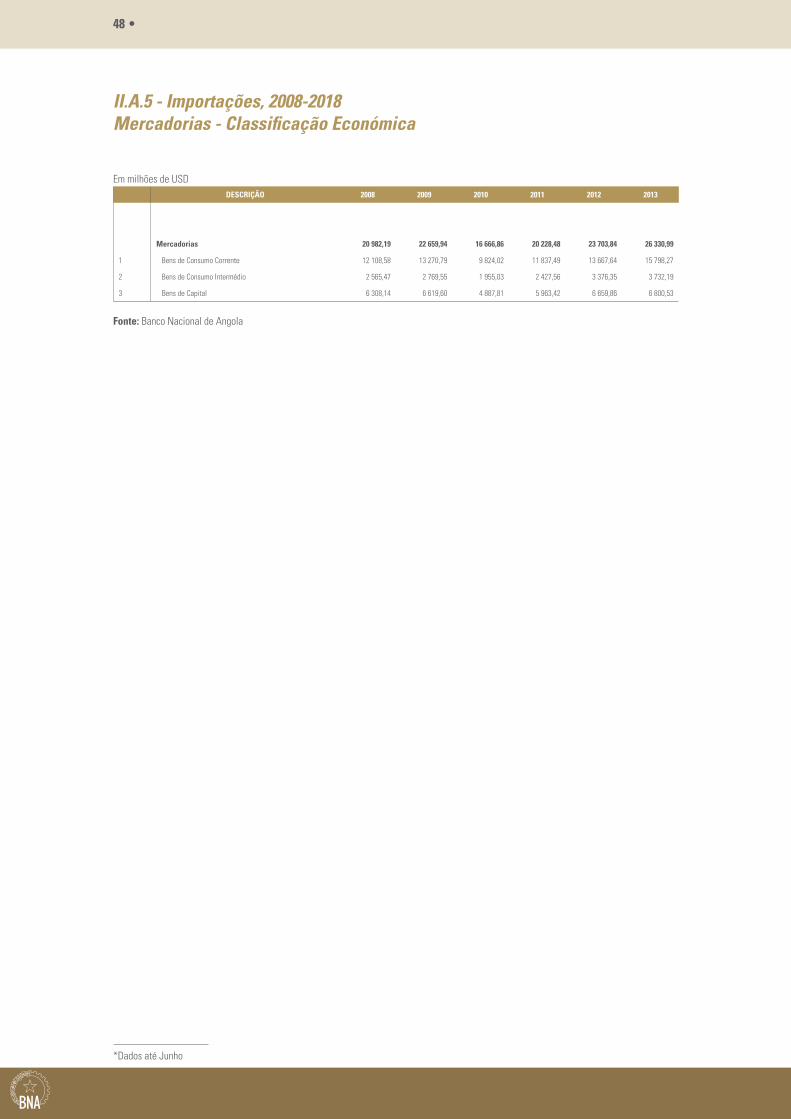
48 •
II.A.5 - Importações, 2008-2018 Mercadorias - Classificação Económica
Em milhões de USDDESCRIÇÃO 2008 2009 2010 2011 2012 2013
Mercadorias 20 982,19 22 659,94 16 666,86 20 228,48 23 703,84 26 330,99
1 Bens de Consumo Corrente 12 108,58 13 270,79 9 824,02 11 837,49 13 667,64 15 798,27
2 Bens de Consumo Intermédio 2 565,47 2 769,55 1 955,03 2 427,56 3 376,35 3 732,19
3 Bens de Capital 6 308,14 6 619,60 4 887,81 5 963,42 6 659,86 6 800,53
Fonte: Banco Nacional de Angola
*Dados até Junho
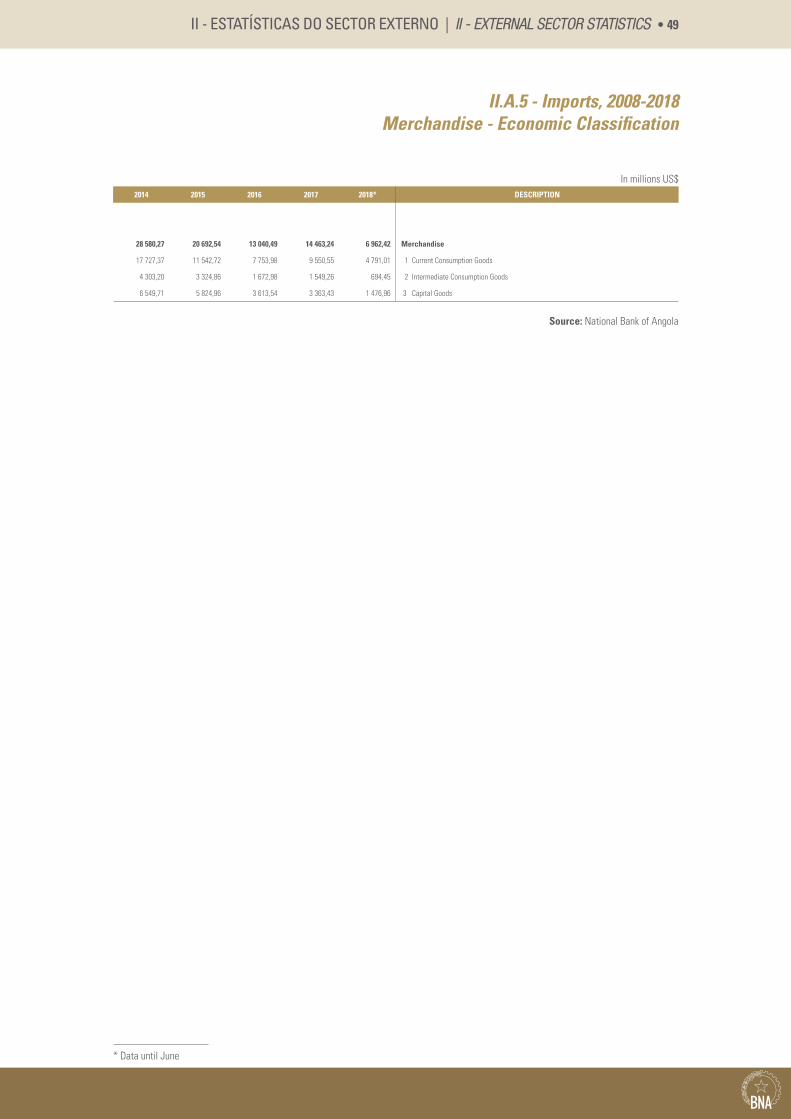
II - ESTATÍSTICAS DO SECTOR EXTERNO | II - EXTERNAL SECTOR STATISTICS • 49
II.A.5 - Imports, 2008-2018 Merchandise - Economic Classification
In millions US$2014 2015 2016 2017 2018* DESCRIPTION
28 580,27 20 692,54 13 040,49 14 463,24 6 962,42 Merchandise
17 727,37 11 542,72 7 753,98 9 550,55 4 791,01 1 Current Consumption Goods
4 303,20 3 324,86 1 672,98 1 549,26 694,45 2 Intermediate Consumption Goods
6 549,71 5 824,96 3 613,54 3 363,43 1 476,96 3 Capital Goods
Source: National Bank of Angola
* Data until June
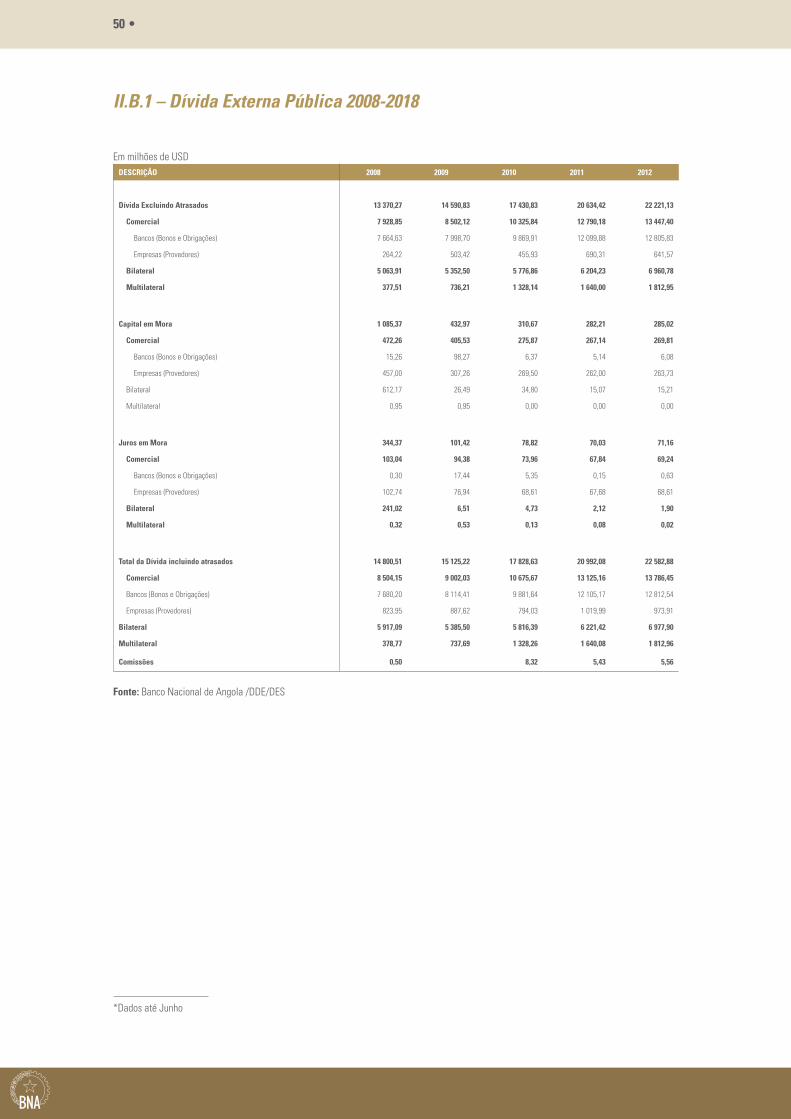
50 •
II.B.1 – Dívida Externa Pública 2008-2018
Em milhões de USDDESCRIÇÃO 2008 2009 2010 2011 2012
Dívida Excluindo Atrasados 13 370,27 14 590,83 17 430,83 20 634,42 22 221,13
Comercial 7 928,85 8 502,12 10 325,84 12 790,18 13 447,40
Bancos (Bonos e Obrigações) 7 664,63 7 998,70 9 869,91 12 099,88 12 805,83
Empresas (Provedores) 264,22 503,42 455,93 690,31 641,57
Bilateral 5 063,91 5 352,50 5 776,86 6 204,23 6 960,78
Multilateral 377,51 736,21 1 328,14 1 640,00 1 812,95
Capital em Mora 1 085,37 432,97 310,67 282,21 285,02
Comercial 472,26 405,53 275,87 267,14 269,81
Bancos (Bonos e Obrigações) 15,26 98,27 6,37 5,14 6,08
Empresas (Provedores) 457,00 307,26 269,50 262,00 263,73
Bilateral 612,17 26,49 34,80 15,07 15,21
Multilateral 0,95 0,95 0,00 0,00 0,00
Juros em Mora 344,37 101,42 78,82 70,03 71,16
Comercial 103,04 94,38 73,96 67,84 69,24
Bancos (Bonos e Obrigações) 0,30 17,44 5,35 0,15 0,63
Empresas (Provedores) 102,74 76,94 68,61 67,68 68,61
Bilateral 241,02 6,51 4,73 2,12 1,90
Multilateral 0,32 0,53 0,13 0,08 0,02
Total da Dívida incluindo atrasados 14 800,51 15 125,22 17 828,63 20 992,08 22 582,88
Comercial 8 504,15 9 002,03 10 675,67 13 125,16 13 786,45
Bancos (Bonos e Obrigações) 7 680,20 8 114,41 9 881,64 12 105,17 12 812,54
Empresas (Provedores) 823,95 887,62 794,03 1 019,99 973,91
Bilateral 5 917,09 5 385,50 5 816,39 6 221,42 6 977,90
Multilateral 378,77 737,69 1 328,26 1 640,08 1 812,96
Comissões 0,50 8,32 5,43 5,56
Fonte: Banco Nacional de Angola /DDE/DES
*Dados até Junho
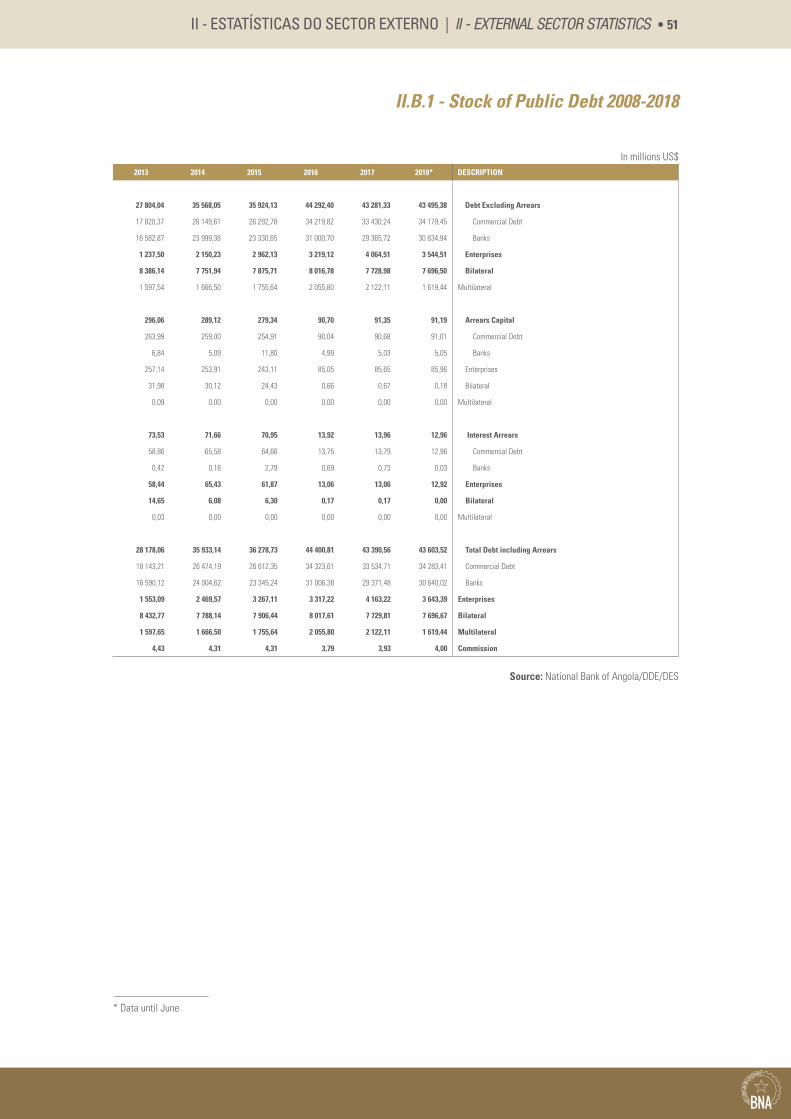
II - ESTATÍSTICAS DO SECTOR EXTERNO | II - EXTERNAL SECTOR STATISTICS • 51
II.B.1 - Stock of Public Debt 2008-2018
In millions US$2013 2014 2015 2016 2017 2018* DESCRIPTION
27 804,04 35 568,05 35 924,13 44 292,40 43 281,33 43 495,38 Debt Excluding Arrears
17 820,37 26 149,61 26 292,78 34 219,82 33 430,24 34 179,45 Commercial Debt
16 582,87 23 999,38 23 330,65 31 000,70 29 365,72 30 634,94 Banks
1 237,50 2 150,23 2 962,13 3 219,12 4 064,51 3 544,51 Enterprises
8 386,14 7 751,94 7 875,71 8 016,78 7 728,98 7 696,50 Bilateral
1 597,54 1 666,50 1 755,64 2 055,80 2 122,11 1 619,44 Multilateral
296,06 289,12 279,34 90,70 91,35 91,19 Arrears Capital
263,99 259,00 254,91 90,04 90,68 91,01 Commercial Debt
6,84 5,09 11,80 4,99 5,03 5,05 Banks
257,14 253,91 243,11 85,05 85,65 85,96 Enterprises
31,98 30,12 24,43 0,66 0,67 0,18 Bilateral
0,09 0,00 0,00 0,00 0,00 0,00 Multilateral
73,53 71,66 70,95 13,92 13,96 12,96 Interest Arrears
58,86 65,58 64,66 13,75 13,79 12,96 Commercial Debt
0,42 0,16 2,79 0,69 0,73 0,03 Banks
58,44 65,43 61,87 13,06 13,06 12,92 Enterprises
14,65 6,08 6,30 0,17 0,17 0,00 Bilateral
0,03 0,00 0,00 0,00 0,00 0,00 Multilateral
28 178,06 35 933,14 36 278,73 44 400,81 43 390,56 43 603,52 Total Debt including Arrears
18 143,21 26 474,19 26 612,35 34 323,61 33 534,71 34 283,41 Commercial Debt
16 590,12 24 004,62 23 345,24 31 006,38 29 371,48 30 640,02 Banks
1 553,09 2 469,57 3 267,11 3 317,22 4 163,22 3 643,39 Enterprises
8 432,77 7 788,14 7 906,44 8 017,61 7 729,81 7 696,67 Bilateral
1 597,65 1 666,50 1 755,64 2 055,80 2 122,11 1 619,44 Multilateral
4,43 4,31 4,31 3,79 3,93 4,00 Commission
Source: National Bank of Angola/DDE/DES
* Data until June
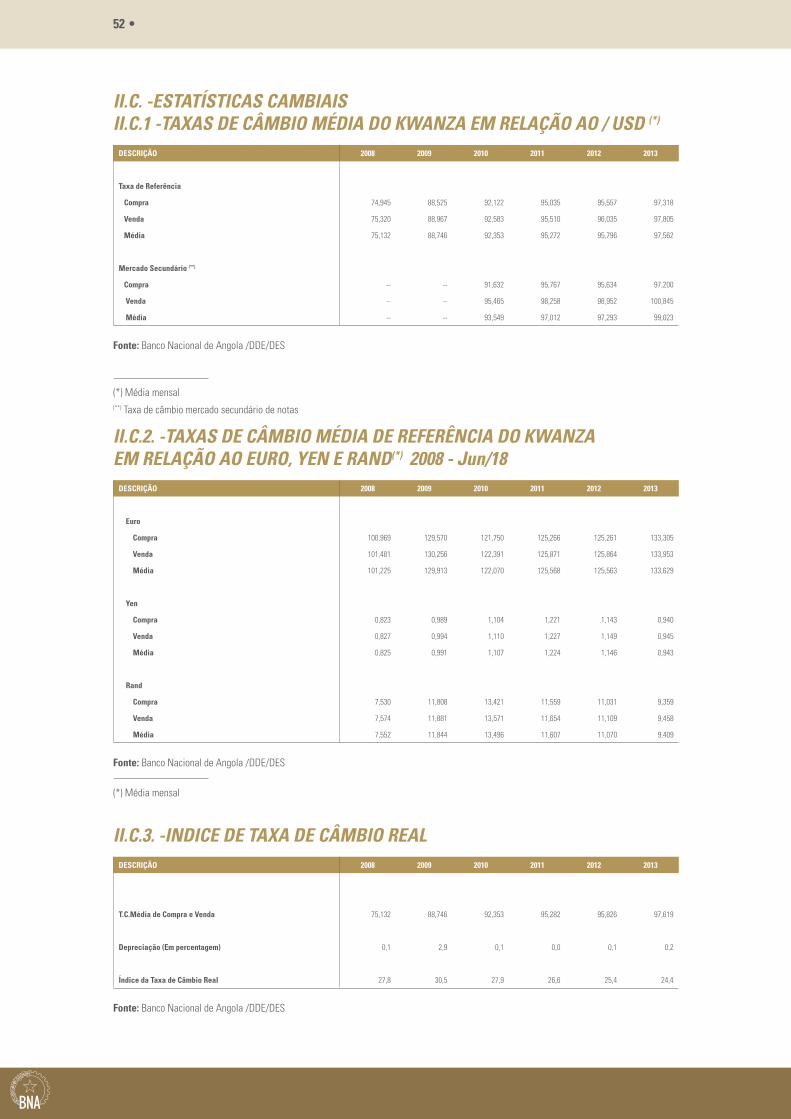
52 •
II.C. -ESTATÍSTICAS CAMBIAIS II.C.1 -TAXAS DE CÂMBIO MÉDIA DO KWANZA EM RELAÇÃO AO / USD (*) 1
DESCRIÇÃO 2008 2009 2010 2011 2012 2013
Taxa de Referência
Compra 74,945 88,525 92,122 95,035 95,557 97,318
Venda 75,320 88,967 92,583 95,510 96,035 97,805
Média 75,132 88,746 92,353 95,272 95,796 97,562
Mercado Secundário (**)
Compra -- -- 91,632 95,767 95,634 97,200
Venda -- -- 95,465 98,258 98,952 100,845
Média -- -- 93,549 97,012 97,293 99,023
Fonte: Banco Nacional de Angola /DDE/DES
(*) Média mensal(**) Taxa de câmbio mercado secundário de notas
II.C.2. -TAXAS DE CÂMBIO MÉDIA DE REFERÊNCIA DO KWANZA EM RELAÇÃO AO EURO, YEN E RAND(*) 2008 - Jun/18
DESCRIÇÃO 2008 2009 2010 2011 2012 2013
Euro
Compra 100,969 129,570 121,750 125,266 125,261 133,305
Venda 101,481 130,256 122,391 125,871 125,864 133,953
Média 101,225 129,913 122,070 125,568 125,563 133,629
Yen
Compra 0,823 0,989 1,104 1,221 1,143 0,940
Venda 0,827 0,994 1,110 1,227 1,149 0,945
Média 0,825 0,991 1,107 1,224 1,146 0,943
Rand
Compra 7,530 11,808 13,421 11,559 11,031 9,359
Venda 7,574 11,881 13,571 11,654 11,109 9,458
Média 7,552 11,844 13,496 11,607 11,070 9,409
Fonte: Banco Nacional de Angola /DDE/DES
(*) Média mensal
II.C.3. -INDICE DE TAXA DE CÂMBIO REALDESCRIÇÃO 2008 2009 2010 2011 2012 2013
T.C.Média de Compra e Venda 75,132 88,746 92,353 95,282 95,826 97,619
Depreciação (Em percentagem) 0,1 2,9 0,1 0,0 0,1 0,2
Índice da Taxa de Câmbio Real 27,8 30,5 27,9 26,6 25,4 24,4
Fonte: Banco Nacional de Angola /DDE/DES
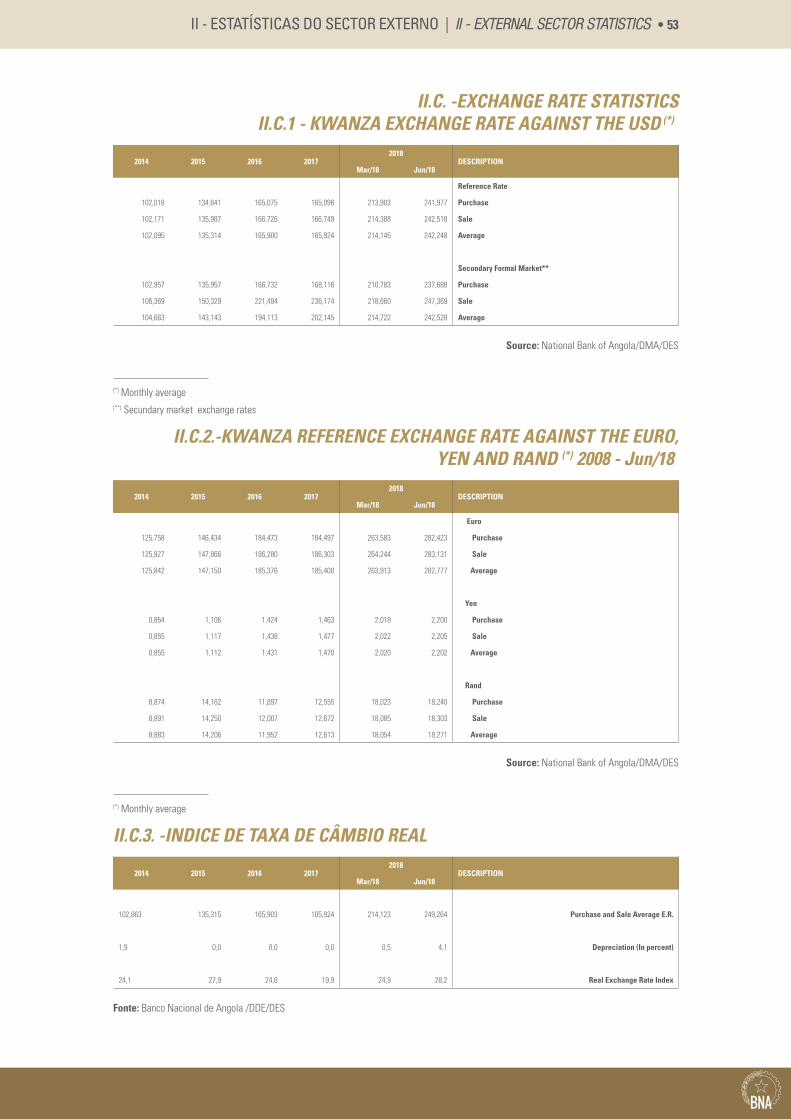
II - ESTATÍSTICAS DO SECTOR EXTERNO | II - EXTERNAL SECTOR STATISTICS • 53
II.C.2.-KWANZA REFERENCE EXCHANGE RATE AGAINST THE EURO, YEN AND RAND (*) 2008 - Jun/181
2014 2015 2016 20172018
DESCRIPTIONMar/18 Jun/18
Euro
125,758 146,434 184,473 184,497 263,583 282,423 Purchase
125,927 147,866 186,280 186,303 264,244 283,131 Sale
125,842 147,150 185,376 185,400 263,913 282,777 Average
Yen
0,854 1,106 1,424 1,463 2,018 2,200 Purchase
0,855 1,117 1,438 1,477 2,022 2,205 Sale
0,855 1,112 1,431 1,470 2,020 2,202 Average
Rand
8,874 14,162 11,897 12,555 18,023 18,240 Purchase
8,891 14,250 12,007 12,672 18,085 18,303 Sale
8,883 14,206 11,952 12,613 18,054 18,271 Average
Source: National Bank of Angola/DMA/DES
(*) Monthly average
II.C. -EXCHANGE RATE STATISTICS II.C.1 - KWANZA EXCHANGE RATE AGAINST THE USD (*)1
2014 2015 2016 20172018
DESCRIPTIONMar/18 Jun/18
Reference Rate
102,018 134,641 165,075 165,098 213,903 241,977 Purchase
102,171 135,987 166,726 166,749 214,388 242,518 Sale
102,095 135,314 165,900 165,924 214,145 242,248 Average
Secondary Formal Market**
102,957 135,957 166,732 168,116 210,783 237,688 Purchase
106,369 150,329 221,494 236,174 218,660 247,369 Sale
104,663 143,143 194,113 202,145 214,722 242,528 Average
Source: National Bank of Angola/DMA/DES
(*) Monthly average (**) Secundary market exchange rates
II.C.3. -INDICE DE TAXA DE CÂMBIO REAL
2014 2015 2016 20172018
DESCRIPTIONMar/18 Jun/18
102,863 135,315 165,903 165,924 214,123 249,264 Purchase and Sale Average E.R.
1,9 0,0 0,0 0,0 0,5 4,1 Depreciation (In percent)
24,1 27,9 24,6 19,9 24,9 28,2 Real Exchange Rate Index
Fonte: Banco Nacional de Angola /DDE/DES
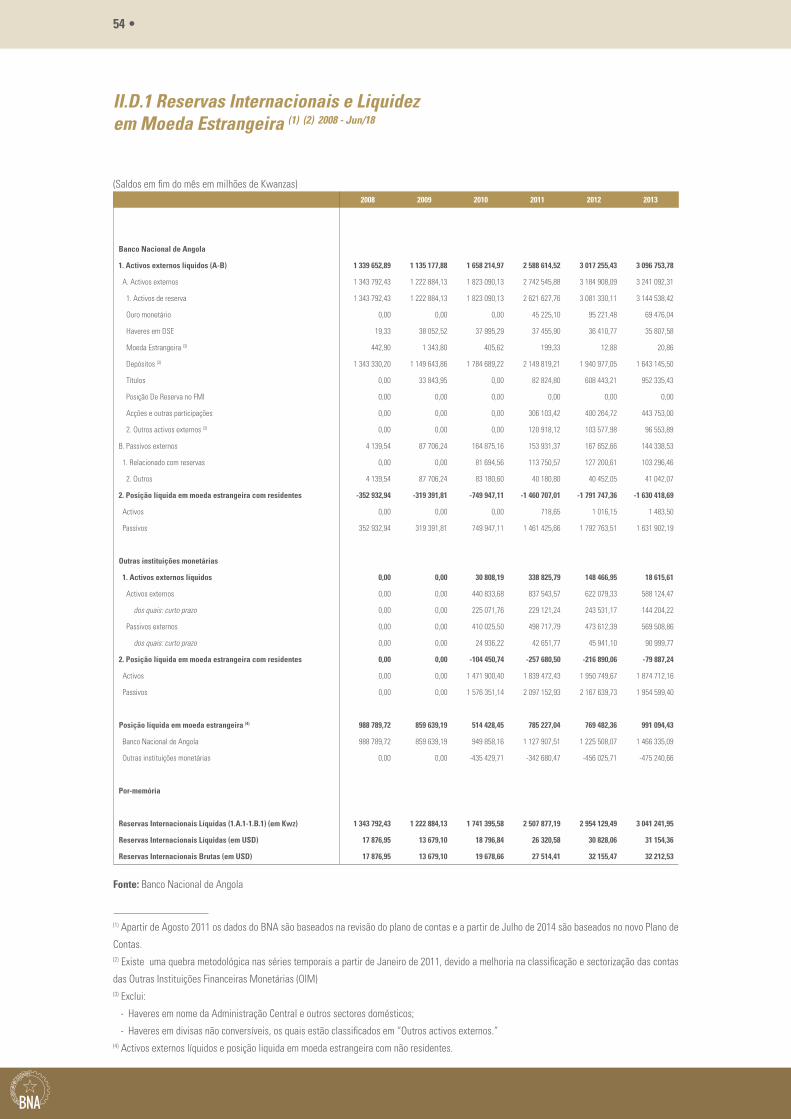
54 •
II.D.1 Reservas Internacionais e Liquidez em Moeda Estrangeira (1) (2) 2008 - Jun/18
(Saldos em fim do mês em milhões de Kwanzas)2008 2009 2010 2011 2012 2013
Banco Nacional de Angola
1. Activos externos líquidos (A-B) 1 339 652,89 1 135 177,88 1 658 214,97 2 588 614,52 3 017 255,43 3 096 753,78
A. Activos externos 1 343 792,43 1 222 884,13 1 823 090,13 2 742 545,88 3 184 908,09 3 241 092,31
1. Activos de reserva 1 343 792,43 1 222 884,13 1 823 090,13 2 621 627,76 3 081 330,11 3 144 538,42
Ouro monetário 0,00 0,00 0,00 45 225,10 95 221,48 69 476,04
Haveres em DSE 19,33 38 052,52 37 995,29 37 455,90 36 410,77 35 807,58
Moeda Estrangeira (3) 442,90 1 343,80 405,62 199,33 12,88 20,86
Depósitos (3) 1 343 330,20 1 149 643,86 1 784 689,22 2 149 819,21 1 940 977,05 1 643 145,50
Títulos 0,00 33 843,95 0,00 82 824,80 608 443,21 952 335,43
Posição De Reserva no FMI 0,00 0,00 0,00 0,00 0,00 0,00
Acções e outras participações 0,00 0,00 0,00 306 103,42 400 264,72 443 753,00
2. Outros activos externos (3) 0,00 0,00 0,00 120 918,12 103 577,98 96 553,89
B. Passivos externos 4 139,54 87 706,24 164 875,16 153 931,37 167 652,66 144 338,53
1. Relacionado com reservas 0,00 0,00 81 694,56 113 750,57 127 200,61 103 296,46
2. Outros 4 139,54 87 706,24 83 180,60 40 180,80 40 452,05 41 042,07
2. Posição líquida em moeda estrangeira com residentes -352 932,94 -319 391,81 -749 947,11 -1 460 707,01 -1 791 747,36 -1 630 418,69
Activos 0,00 0,00 0,00 718,65 1 016,15 1 483,50
Passivos 352 932,94 319 391,81 749 947,11 1 461 425,66 1 792 763,51 1 631 902,19
Outras instituições monetárias
1. Activos externos líquidos 0,00 0,00 30 808,19 338 825,79 148 466,95 18 615,61
Activos externos 0,00 0,00 440 833,68 837 543,57 622 079,33 588 124,47
dos quais: curto prazo 0,00 0,00 225 071,76 229 121,24 243 531,17 144 204,22
Passivos externos 0,00 0,00 410 025,50 498 717,79 473 612,39 569 508,86
dos quais: curto prazo 0,00 0,00 24 936,22 42 651,77 45 941,10 90 999,77
2. Posição líquida em moeda estrangeira com residentes 0,00 0,00 -104 450,74 -257 680,50 -216 890,06 -79 887,24
Activos 0,00 0,00 1 471 900,40 1 839 472,43 1 950 749,67 1 874 712,16
Passivos 0,00 0,00 1 576 351,14 2 097 152,93 2 167 639,73 1 954 599,40
Posição líquida em moeda estrangeira (4) 988 789,72 859 639,19 514 428,45 785 227,04 769 482,36 991 094,43
Banco Nacional de Angola 988 789,72 859 639,19 949 858,16 1 127 907,51 1 225 508,07 1 466 335,09
Outras instituições monetárias 0,00 0,00 -435 429,71 -342 680,47 -456 025,71 -475 240,66
Por-memória
Reservas Internacionais Líquidas (1.A.1-1.B.1) (em Kwz) 1 343 792,43 1 222 884,13 1 741 395,58 2 507 877,19 2 954 129,49 3 041 241,95
Reservas Internacionais Líquidas (em USD) 17 876,95 13 679,10 18 796,84 26 320,58 30 828,06 31 154,36
Reservas Internacionais Brutas (em USD) 17 876,95 13 679,10 19 678,66 27 514,41 32 155,47 32 212,53
Fonte: Banco Nacional de Angola
(1) Apartir de Agosto 2011 os dados do BNA são baseados na revisão do plano de contas e a partir de Julho de 2014 são baseados no novo Plano de
Contas.(2) Existe uma quebra metodológica nas séries temporais a partir de Janeiro de 2011, devido a melhoria na classificação e sectorização das contas
das Outras Instituições Financeiras Monetárias (OIM) (3) Exclui:
- Haveres em nome da Administração Central e outros sectores domésticos;
- Haveres em divisas não conversíveis, os quais estão classificados em “Outros activos externos.”(4) Activos externos líquidos e posição liquida em moeda estrangeira com não residentes.
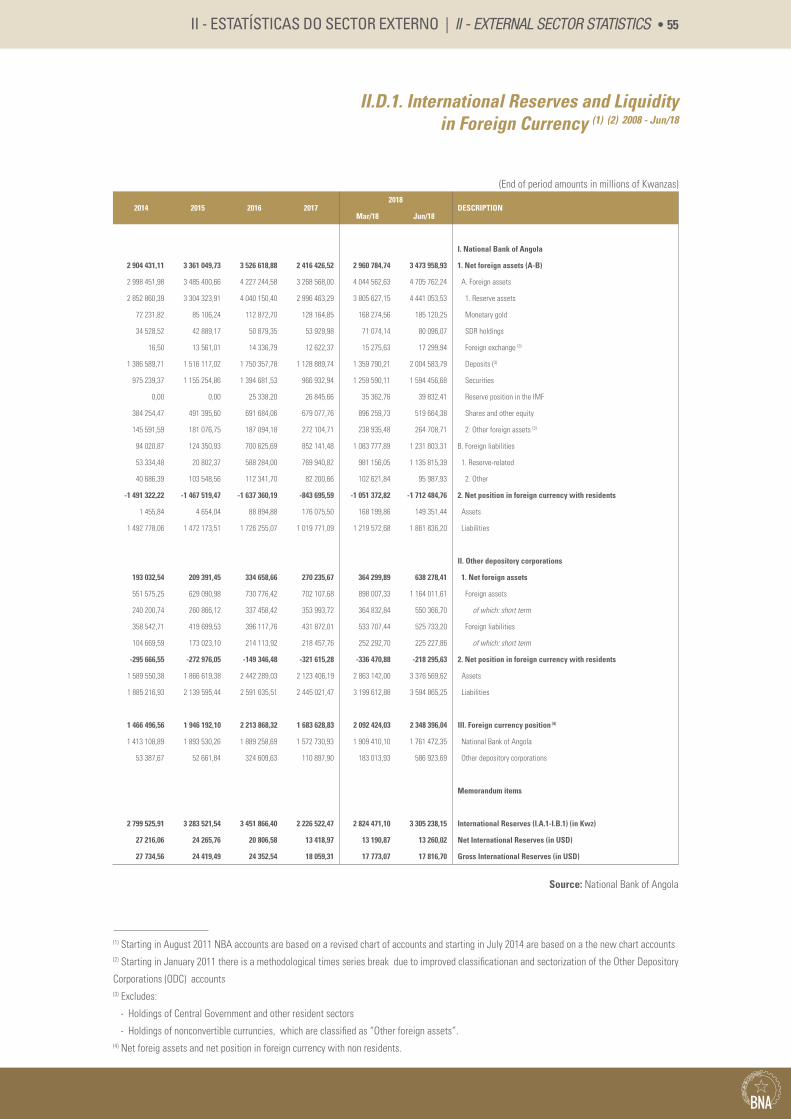
II - ESTATÍSTICAS DO SECTOR EXTERNO | II - EXTERNAL SECTOR STATISTICS • 55
II.D.1. International Reserves and Liquidity in Foreign Currency (1) (2) 2008 - Jun/18
(End of period amounts in millions of Kwanzas)
2014 2015 2016 20172018
DESCRIPTIONMar/18 Jun/18
I. National Bank of Angola
2 904 431,11 3 361 049,73 3 526 618,88 2 416 426,52 2 960 784,74 3 473 958,93 1. Net foreign assets (A-B)
2 998 451,98 3 485 400,66 4 227 244,58 3 268 568,00 4 044 562,63 4 705 762,24 A. Foreign assets
2 852 860,39 3 304 323,91 4 040 150,40 2 996 463,29 3 805 627,15 4 441 053,53 1. Reserve assets
72 231,82 85 106,24 112 872,70 128 164,85 168 274,56 185 120,25 Monetary gold
34 528,52 42 889,17 50 879,35 53 929,98 71 074,14 80 096,07 SDR holdings
16,50 13 561,01 14 336,79 12 622,37 15 275,63 17 299,94 Foreign exchange (3)
1 386 589,71 1 516 117,02 1 750 357,78 1 128 889,74 1 359 790,21 2 004 583,79 Deposits (3)
975 239,37 1 155 254,86 1 394 681,53 966 932,94 1 259 590,11 1 594 456,68 Securities
0,00 0,00 25 338,20 26 845,66 35 362,76 39 832,41 Reserve position in the IMF
384 254,47 491 395,60 691 684,06 679 077,76 896 259,73 519 664,38 Shares and other equity
145 591,59 181 076,75 187 094,18 272 104,71 238 935,48 264 708,71 2. Other foreign assets (3)
94 020,87 124 350,93 700 625,69 852 141,48 1 083 777,89 1 231 803,31 B. Foreign liabilities
53 334,48 20 802,37 588 284,00 769 940,82 981 156,05 1 135 815,39 1. Reserve-related
40 686,39 103 548,56 112 341,70 82 200,66 102 621,84 95 987,93 2. Other
-1 491 322,22 -1 467 519,47 -1 637 360,19 -843 695,59 -1 051 372,82 -1 712 484,76 2. Net position in foreign currency with residents
1 455,84 4 654,04 88 894,88 176 075,50 168 199,86 149 351,44 Assets
1 492 778,06 1 472 173,51 1 726 255,07 1 019 771,09 1 219 572,68 1 861 836,20 Liabilities
II. Other depository corporations
193 032,54 209 391,45 334 658,66 270 235,67 364 299,89 638 278,41 1. Net foreign assets
551 575,25 629 090,98 730 776,42 702 107,68 898 007,33 1 164 011,61 Foreign assets
240 200,74 260 866,12 337 458,42 353 993,72 364 832,84 550 366,70 of which: short term
358 542,71 419 699,53 396 117,76 431 872,01 533 707,44 525 733,20 Foreign liabilities
104 669,59 173 023,10 214 113,92 218 457,76 252 292,70 225 227,86 of which: short term
-295 666,55 -272 976,05 -149 346,48 -321 615,28 -336 470,88 -218 295,63 2. Net position in foreign currency with residents
1 589 550,38 1 866 619,38 2 442 289,03 2 123 406,19 2 863 142,00 3 376 569,62 Assets
1 885 216,93 2 139 595,44 2 591 635,51 2 445 021,47 3 199 612,88 3 594 865,25 Liabilities
1 466 496,56 1 946 192,10 2 213 868,32 1 683 628,83 2 092 424,03 2 348 396,04 III. Foreign currency position (4)
1 413 108,89 1 893 530,26 1 889 258,69 1 572 730,93 1 909 410,10 1 761 472,35 National Bank of Angola
53 387,67 52 661,84 324 609,63 110 897,90 183 013,93 586 923,69 Other depository corporations
Memorandum items
2 799 525,91 3 283 521,54 3 451 866,40 2 226 522,47 2 824 471,10 3 305 238,15 International Reserves (I.A.1-I.B.1) (in Kwz)
27 216,06 24 265,76 20 806,58 13 418,97 13 190,87 13 260,02 Net International Reserves (in USD)
27 734,56 24 419,49 24 352,54 18 059,31 17 773,07 17 816,70 Gross International Reserves (in USD)
Source: National Bank of Angola
(1) Starting in August 2011 NBA accounts are based on a revised chart of accounts and starting in July 2014 are based on a the new chart accounts(2) Starting in January 2011 there is a methodological times series break due to improved classificationan and sectorization of the Other Depository
Corporations (ODC) accounts (3) Excludes:
- Holdings of Central Government and other resident sectors
- Holdings of nonconvertible curruncies, which are classified as “Other foreign assets”. (4) Net foreig assets and net position in foreign currency with non residents.


III - ESTATÍSTICAS DO SECTOR REAL
III - REAL SECTOR STATISTICS
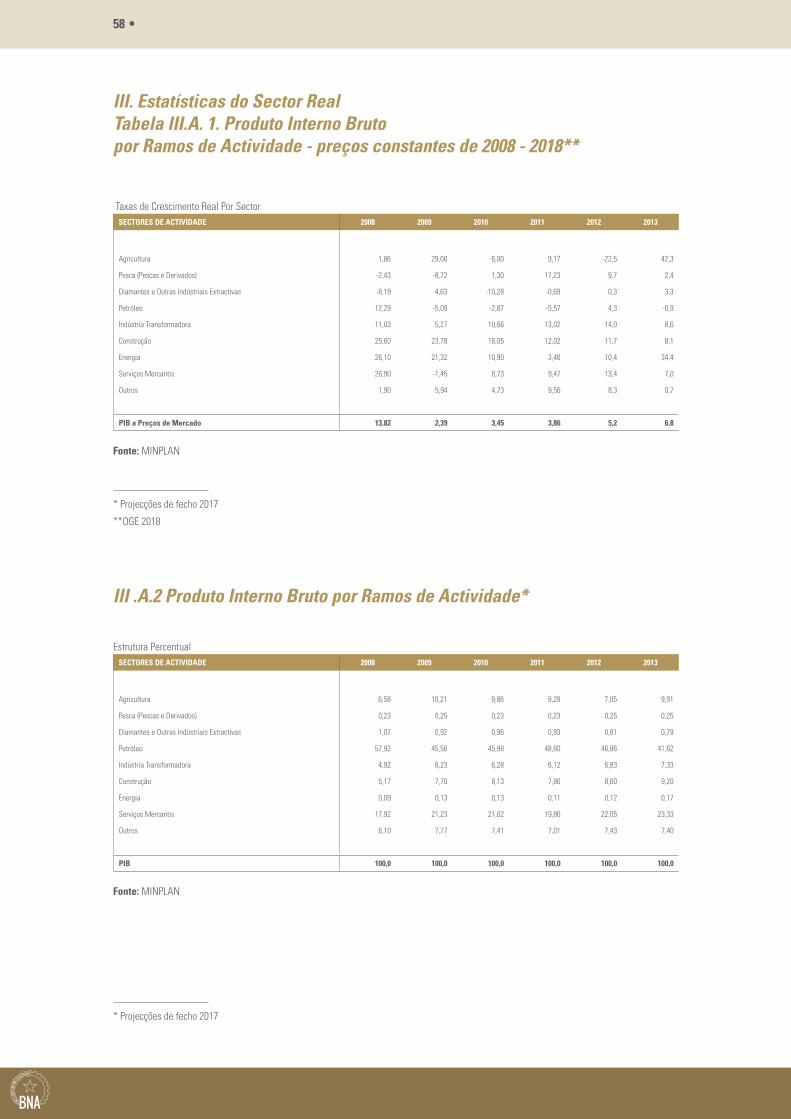
58 •
III. Estatísticas do Sector Real Tabela III.A. 1. Produto Interno Bruto por Ramos de Actividade - preços constantes de 2008 - 2018**
Taxas de Crescimento Real Por SectorSECTORES DE ACTIVIDADE 2008 2009 2010 2011 2012 2013
Agricultura 1,86 29,00 6,00 9,17 -22,5 42,3
Pesca (Pescas e Derivados) -2,43 -8,72 1,30 17,23 9,7 2,4
Diamantes e Outras Indústriais Extractivas -8,19 4,63 -10,28 -0,69 0,3 3,3
Petróleo 12,29 -5,09 -2,87 -5,57 4,3 -0,9
Indústria Transformadora 11,03 5,27 10,66 13,02 14,0 8,6
Construção 25,60 23,78 16,05 12,02 11,7 8,1
Energia 26,10 21,32 10,90 3,46 10,4 34,4
Serviços Mercantis 26,90 -1,45 8,73 9,47 13,4 7,0
Outros 1,90 5,94 4,73 9,56 8,3 0,7
PIB a Preços de Mercado 13,82 2,39 3,45 3,86 5,2 6,8
Fonte: MINPLAN
* Projecções de fecho 2017
**OGE 2018
III .A.2 Produto Interno Bruto por Ramos de Actividade*
Estrutura PercentualSECTORES DE ACTIVIDADE 2008 2009 2010 2011 2012 2013
Agricultura 6,58 10,21 9,86 9,28 7,05 9,91
Pesca (Pescas e Derivados) 0,23 0,25 0,23 0,23 0,25 0,25
Diamantes e Outras Indústriais Extractivas 1,07 0,92 0,96 0,93 0,81 0,79
Petróleo 57,92 45,56 45,98 48,60 46,86 41,62
Indústria Transformadora 4,92 6,23 6,28 6,12 6,83 7,33
Construção 5,17 7,70 8,13 7,86 8,60 9,20
Energia 0,09 0,13 0,13 0,11 0,12 0,17
Serviços Mercantis 17,92 21,23 21,02 19,86 22,05 23,33
Outros 6,10 7,77 7,41 7,01 7,43 7,40
PIB 100,0 100,0 100,0 100,0 100,0 100,0
Fonte: MINPLAN
* Projecções de fecho 2017
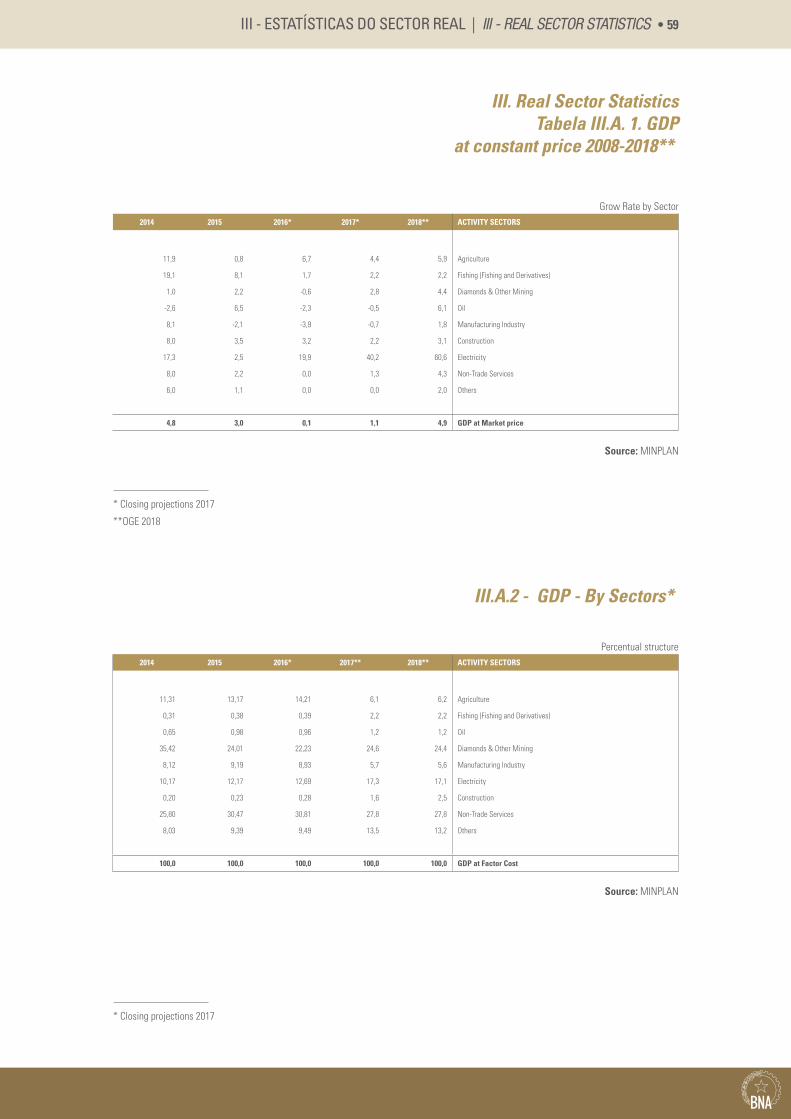
III - ESTATÍSTICAS DO SECTOR REAL | III - REAL SECTOR STATISTICS • 59
III. Real Sector Statistics Tabela III.A. 1. GDP
at constant price 2008-2018**
Grow Rate by Sector2014 2015 2016* 2017* 2018** ACTIVITY SECTORS
11,9 0,8 6,7 4,4 5,9 Agriculture
19,1 8,1 1,7 2,2 2,2 Fishing (Fishing and Derivatives)
1,0 2,2 -0,6 2,8 4,4 Diamonds & Other Mining
-2,6 6,5 -2,3 -0,5 6,1 Oil
8,1 -2,1 -3,9 -0,7 1,8 Manufacturing Industry
8,0 3,5 3,2 2,2 3,1 Construction
17,3 2,5 19,9 40,2 60,6 Electricity
8,0 2,2 0,0 1,3 4,3 Non-Trade Services
6,0 1,1 0,0 0,0 2,0 Others
4,8 3,0 0,1 1,1 4,9 GDP at Market price
Source: MINPLAN
* Closing projections 2017
**OGE 2018
III.A.2 - GDP - By Sectors*
Percentual structure2014 2015 2016* 2017** 2018** ACTIVITY SECTORS
11,31 13,17 14,21 6,1 6,2 Agriculture
0,31 0,38 0,39 2,2 2,2 Fishing (Fishing and Derivatives)
0,65 0,98 0,96 1,2 1,2 Oil
35,42 24,01 22,23 24,6 24,4 Diamonds & Other Mining
8,12 9,19 8,93 5,7 5,6 Manufacturing Industry
10,17 12,17 12,69 17,3 17,1 Electricity
0,20 0,23 0,28 1,6 2,5 Construction
25,80 30,47 30,81 27,8 27,8 Non-Trade Services
8,03 9,39 9,49 13,5 13,2 Others
100,0 100,0 100,0 100,0 100,0 GDP at Factor Cost
Source: MINPLAN
* Closing projections 2017


IV - PREÇOS
IV - PRICES
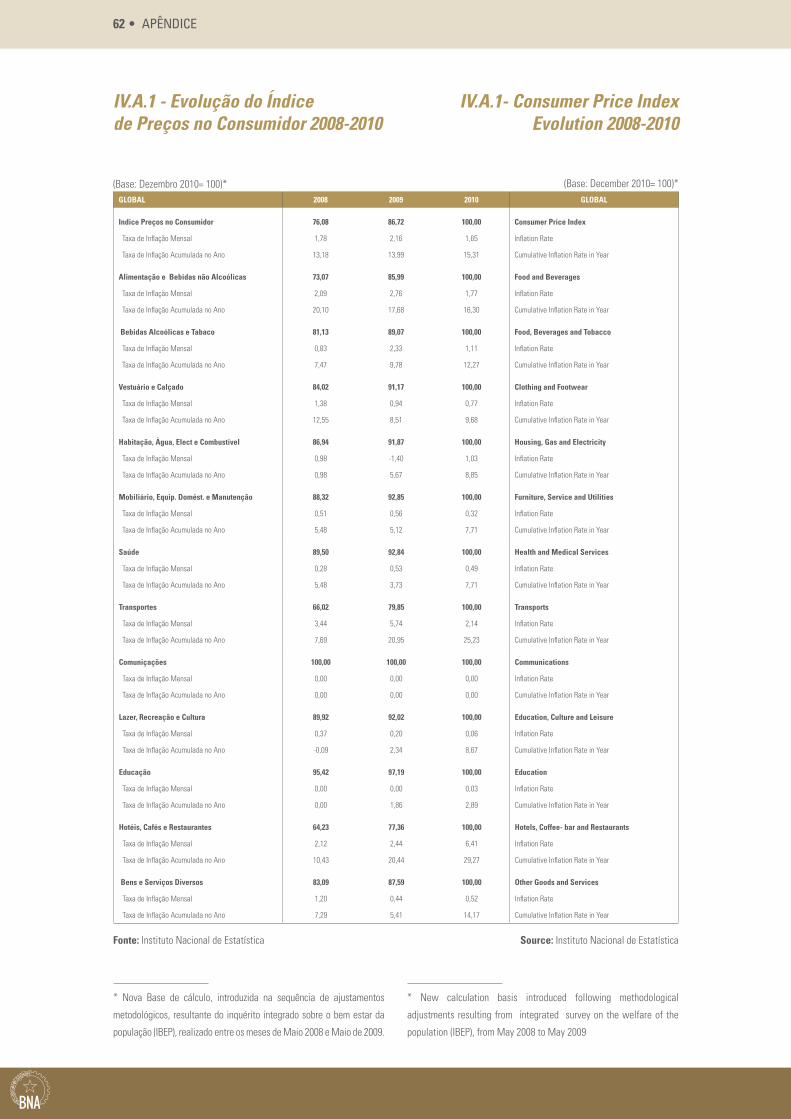
62 • APÊNDICE
IV.A.1 - Evolução do Índice de Preços no Consumidor 2008-2010
(Base: Dezembro 2010= 100)*GLOBAL 2008 2009 2010 GLOBAL
Indice Preços no Consumidor 76,08 86,72 100,00 Consumer Price Index
Taxa de Inflação Mensal 1,78 2,16 1,65 Inflation Rate
Taxa de Inflação Acumulada no Ano 13,18 13,99 15,31 Cumulative Inflation Rate in Year
Alimentação e Bebidas não Alcoólicas 73,07 85,99 100,00 Food and Beverages
Taxa de Inflação Mensal 2,09 2,76 1,77 Inflation Rate
Taxa de Inflação Acumulada no Ano 20,10 17,68 16,30 Cumulative Inflation Rate in Year
Bebidas Alcoólicas e Tabaco 81,13 89,07 100,00 Food, Beverages and Tobacco
Taxa de Inflação Mensal 0,83 2,33 1,11 Inflation Rate
Taxa de Inflação Acumulada no Ano 7,47 9,78 12,27 Cumulative Inflation Rate in Year
Vestuário e Calçado 84,02 91,17 100,00 Clothing and Footwear
Taxa de Inflação Mensal 1,38 0,94 0,77 Inflation Rate
Taxa de Inflação Acumulada no Ano 12,55 8,51 9,68 Cumulative Inflation Rate in Year
Habitação, Àgua, Elect e Combustível 86,94 91,87 100,00 Housing, Gas and Electricity
Taxa de Inflação Mensal 0,98 -1,40 1,03 Inflation Rate
Taxa de Inflação Acumulada no Ano 0,98 5,67 8,85 Cumulative Inflation Rate in Year
Mobiliário, Equip. Domést. e Manutenção 88,32 92,85 100,00 Furniture, Service and Utilities
Taxa de Inflação Mensal 0,51 0,56 0,32 Inflation Rate
Taxa de Inflação Acumulada no Ano 5,48 5,12 7,71 Cumulative Inflation Rate in Year
Saúde 89,50 92,84 100,00 Health and Medical Services
Taxa de Inflação Mensal 0,28 0,53 0,49 Inflation Rate
Taxa de Inflação Acumulada no Ano 5,48 3,73 7,71 Cumulative Inflation Rate in Year
Transportes 66,02 79,85 100,00 Transports
Taxa de Inflação Mensal 3,44 5,74 2,14 Inflation Rate
Taxa de Inflação Acumulada no Ano 7,69 20,95 25,23 Cumulative Inflation Rate in Year
Comuniçações 100,00 100,00 100,00 Communications
Taxa de Inflação Mensal 0,00 0,00 0,00 Inflation Rate
Taxa de Inflação Acumulada no Ano 0,00 0,00 0,00 Cumulative Inflation Rate in Year
Lazer, Recreação e Cultura 89,92 92,02 100,00 Education, Culture and Leisure
Taxa de Inflação Mensal 0,37 0,20 0,06 Inflation Rate
Taxa de Inflação Acumulada no Ano -0,09 2,34 8,67 Cumulative Inflation Rate in Year
Educação 95,42 97,19 100,00 Education
Taxa de Inflação Mensal 0,00 0,00 0,03 Inflation Rate
Taxa de Inflação Acumulada no Ano 0,00 1,86 2,89 Cumulative Inflation Rate in Year
Hotéis, Cafés e Restaurantes 64,23 77,36 100,00 Hotels, Coffee- bar and Restaurants
Taxa de Inflação Mensal 2,12 2,44 6,41 Inflation Rate
Taxa de Inflação Acumulada no Ano 10,43 20,44 29,27 Cumulative Inflation Rate in Year
Bens e Serviços Diversos 83,09 87,59 100,00 Other Goods and Services
Taxa de Inflação Mensal 1,20 0,44 0,52 Inflation Rate
Taxa de Inflação Acumulada no Ano 7,29 5,41 14,17 Cumulative Inflation Rate in Year
IV.A.1- Consumer Price Index Evolution 2008-2010
(Base: December 2010= 100)*
* Nova Base de cálculo, introduzida na sequência de ajustamentos
metodológicos, resultante do inquérito integrado sobre o bem estar da
população (IBEP), realizado entre os meses de Maio 2008 e Maio de 2009.
* New calculation basis introduced following methodological
adjustments resulting from integrated survey on the welfare of the
population (IBEP), from May 2008 to May 2009
Fonte: Instituto Nacional de Estatística Source: Instituto Nacional de Estatística

IV - PREÇOS | IV - PRICES • 63
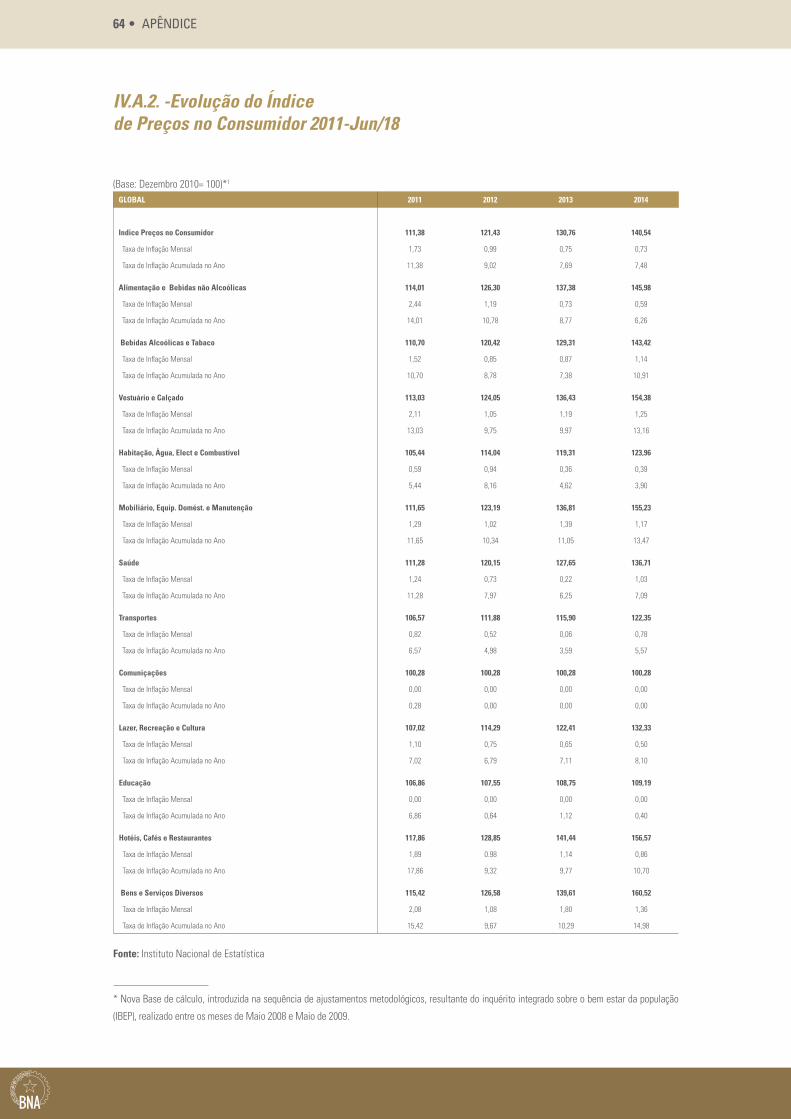
64 • APÊNDICE
IV.A.2. -Evolução do Índice de Preços no Consumidor 2011-Jun/18
(Base: Dezembro 2010= 100)*1
GLOBAL 2011 2012 2013 2014
Indice Preços no Consumidor 111,38 121,43 130,76 140,54
Taxa de Inflação Mensal 1,73 0,99 0,75 0,73
Taxa de Inflação Acumulada no Ano 11,38 9,02 7,69 7,48
Alimentação e Bebidas não Alcoólicas 114,01 126,30 137,38 145,98
Taxa de Inflação Mensal 2,44 1,19 0,73 0,59
Taxa de Inflação Acumulada no Ano 14,01 10,78 8,77 6,26
Bebidas Alcoólicas e Tabaco 110,70 120,42 129,31 143,42
Taxa de Inflação Mensal 1,52 0,85 0,87 1,14
Taxa de Inflação Acumulada no Ano 10,70 8,78 7,38 10,91
Vestuário e Calçado 113,03 124,05 136,43 154,38
Taxa de Inflação Mensal 2,11 1,05 1,19 1,25
Taxa de Inflação Acumulada no Ano 13,03 9,75 9,97 13,16
Habitação, Àgua, Elect e Combustível 105,44 114,04 119,31 123,96
Taxa de Inflação Mensal 0,59 0,94 0,36 0,39
Taxa de Inflação Acumulada no Ano 5,44 8,16 4,62 3,90
Mobiliário, Equip. Domést. e Manutenção 111,65 123,19 136,81 155,23
Taxa de Inflação Mensal 1,29 1,02 1,39 1,17
Taxa de Inflação Acumulada no Ano 11,65 10,34 11,05 13,47
Saúde 111,28 120,15 127,65 136,71
Taxa de Inflação Mensal 1,24 0,73 0,22 1,03
Taxa de Inflação Acumulada no Ano 11,28 7,97 6,25 7,09
Transportes 106,57 111,88 115,90 122,35
Taxa de Inflação Mensal 0,82 0,52 0,06 0,78
Taxa de Inflação Acumulada no Ano 6,57 4,98 3,59 5,57
Comuniçações 100,28 100,28 100,28 100,28
Taxa de Inflação Mensal 0,00 0,00 0,00 0,00
Taxa de Inflação Acumulada no Ano 0,28 0,00 0,00 0,00
Lazer, Recreação e Cultura 107,02 114,29 122,41 132,33
Taxa de Inflação Mensal 1,10 0,75 0,65 0,50
Taxa de Inflação Acumulada no Ano 7,02 6,79 7,11 8,10
Educação 106,86 107,55 108,75 109,19
Taxa de Inflação Mensal 0,00 0,00 0,00 0,00
Taxa de Inflação Acumulada no Ano 6,86 0,64 1,12 0,40
Hotéis, Cafés e Restaurantes 117,86 128,85 141,44 156,57
Taxa de Inflação Mensal 1,89 0.98 1,14 0,86
Taxa de Inflação Acumulada no Ano 17,86 9,32 9,77 10,70
Bens e Serviços Diversos 115,42 126,58 139,61 160,52
Taxa de Inflação Mensal 2,08 1,08 1,80 1,36
Taxa de Inflação Acumulada no Ano 15,42 9,67 10,29 14,98
Fonte: Instituto Nacional de Estatística
* Nova Base de cálculo, introduzida na sequência de ajustamentos metodológicos, resultante do inquérito integrado sobre o bem estar da população
(IBEP), realizado entre os meses de Maio 2008 e Maio de 2009.
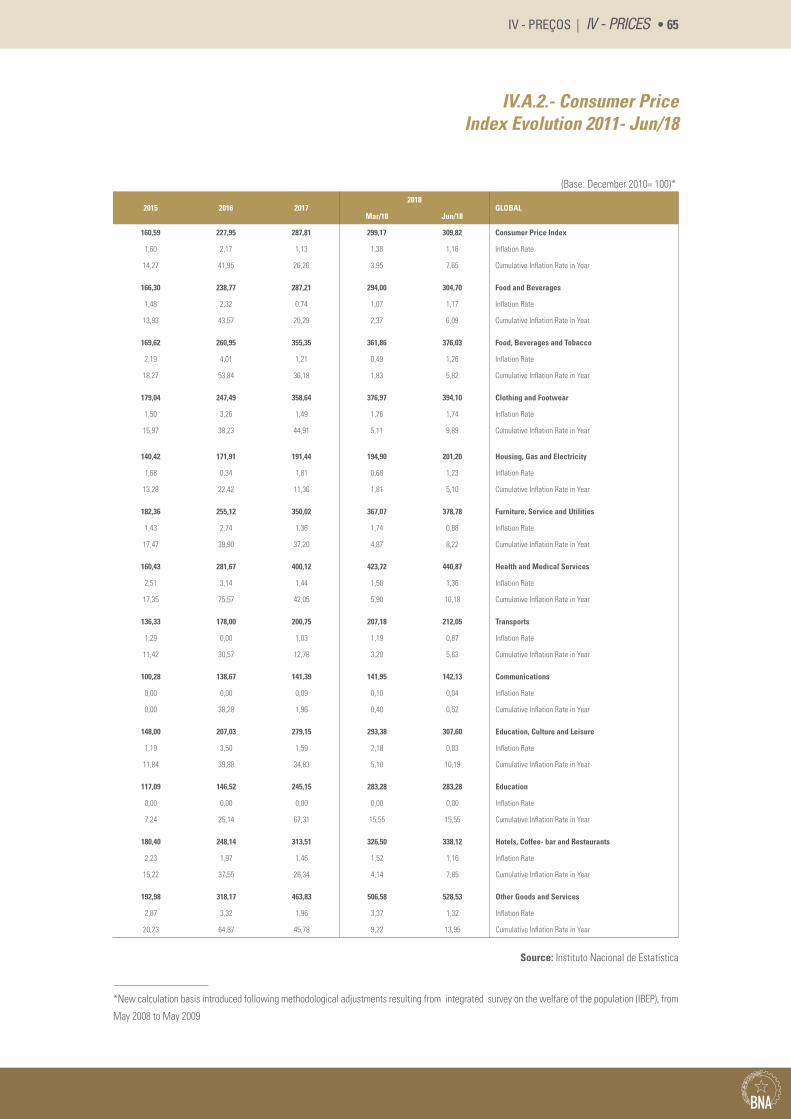
IV - PREÇOS | IV - PRICES • 65
IV.A.2.- Consumer Price Index Evolution 2011- Jun/18
(Base: December 2010= 100)*
2015 2016 20172018
GLOBALMar/18 Jun/18
160,59 227,95 287,81 299,17 309,82 Consumer Price Index
1,60 2,17 1,13 1,38 1,16 Inflation Rate
14,27 41,95 26,26 3,95 7,65 Cumulative Inflation Rate in Year
166,30 238,77 287,21 294,00 304,70 Food and Beverages
1,48 2,32 0,74 1,07 1,17 Inflation Rate
13,93 43,57 20,29 2,37 6,09 Cumulative Inflation Rate in Year
169,62 260,95 355,35 361,86 376,03 Food, Beverages and Tobacco
2,19 4,01 1,21 0,49 1,26 Inflation Rate
18,27 53,84 36,18 1,83 5,82 Cumulative Inflation Rate in Year
179,04 247,49 358,64 376,97 394,10 Clothing and Footwear
1,50 3,26 1,49 1,76 1,74 Inflation Rate
15,97 38,23 44,91 5,11 9,89 Cumulative Inflation Rate in Year
140,42 171,91 191,44 194,90 201,20 Housing, Gas and Electricity
1,68 0,34 1,81 0,68 1,23 Inflation Rate
13,28 22,42 11,36 1,81 5,10 Cumulative Inflation Rate in Year
182,36 255,12 350,02 367,07 378,78 Furniture, Service and Utilities
1,43 2,74 1,36 1,74 0,88 Inflation Rate
17,47 39,90 37,20 4,87 8,22 Cumulative Inflation Rate in Year
160,43 281,67 400,12 423,72 440,87 Health and Medical Services
2,51 3,14 1,44 1,56 1,36 Inflation Rate
17,35 75,57 42,05 5,90 10,18 Cumulative Inflation Rate in Year
136,33 178,00 200,75 207,18 212,05 Transports
1,29 0,00 1,03 1,19 0,87 Inflation Rate
11,42 30,57 12,78 3,20 5,63 Cumulative Inflation Rate in Year
100,28 138,67 141,39 141,95 142,13 Communications
0,00 0,00 0,09 0,10 0,04 Inflation Rate
0,00 38,28 1,96 0,40 0,52 Cumulative Inflation Rate in Year
148,00 207,03 279,15 293,38 307,60 Education, Culture and Leisure
1,19 3,50 1,59 2,18 0,83 Inflation Rate
11,84 39,88 34,83 5,10 10,19 Cumulative Inflation Rate in Year
117,09 146,52 245,15 283,28 283,28 Education
0,00 0,00 0,00 0,00 0,00 Inflation Rate
7,24 25,14 67,31 15,55 15,55 Cumulative Inflation Rate in Year
180,40 248,14 313,51 326,50 338,12 Hotels, Coffee- bar and Restaurants
2,23 1,97 1,46 1,52 1,16 Inflation Rate
15,22 37,55 26,34 4,14 7,85 Cumulative Inflation Rate in Year
192,98 318,17 463,83 506,58 528,53 Other Goods and Services
2,87 3,32 1,96 3,37 1,32 Inflation Rate
20,23 64,87 45,78 9,22 13,95 Cumulative Inflation Rate in Year
Source: Instituto Nacional de Estatística
*New calculation basis introduced following methodological adjustments resulting from integrated survey on the welfare of the population (IBEP), from
May 2008 to May 2009
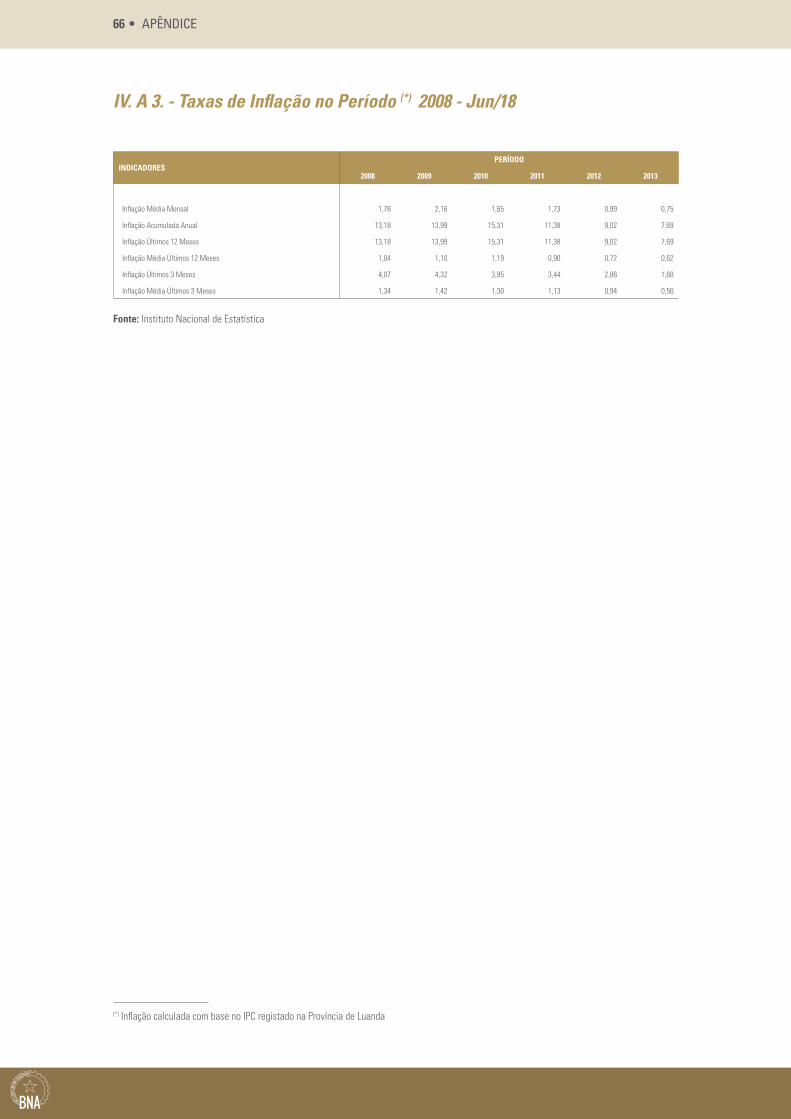
66 • APÊNDICE
IV. A 3. - Taxas de Inflação no Período (*) 2008 - Jun/18
INDICADORESPERÍODO
2008 2009 2010 2011 2012 2013
Inflação Média Mensal 1,78 2,16 1,65 1,73 0,99 0,75
Inflação Acumulada Anual 13,18 13,99 15,31 11,38 9,02 7,69
Inflação Últimos 12 Meses 13,18 13,99 15,31 11,38 9,02 7,69
Inflação Média Últimos 12 Meses 1,04 1,10 1,19 0,90 0,72 0,62
Inflação Últimos 3 Meses 4,07 4,32 3,95 3,44 2,86 1,68
Inflação Média Últimos 3 Meses 1,34 1,42 1,30 1,13 0,94 0,56
Fonte: Instituto Nacional de Estatística
(*) Inflação calculada com base no IPC registado na Província de Luanda
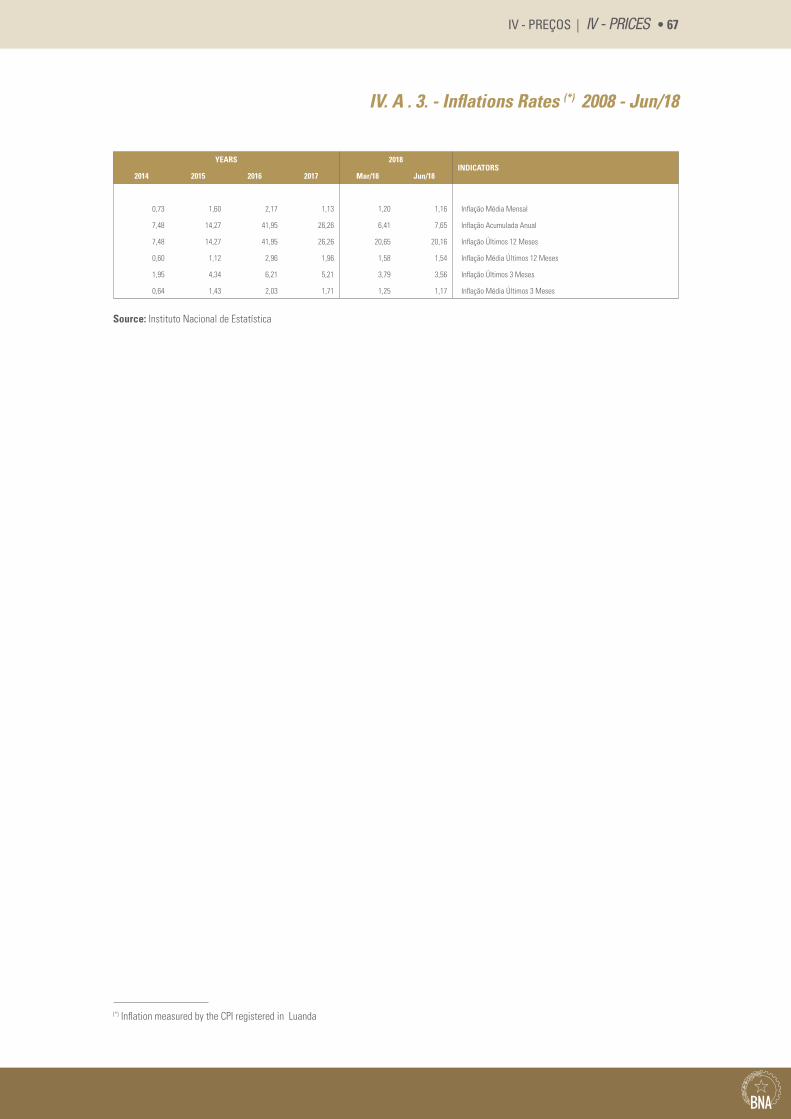
IV - PREÇOS | IV - PRICES • 67
IV. A . 3. - Inflations Rates (*) 2008 - Jun/18
YEARS 2018INDICATORS
2014 2015 2016 2017 Mar/18 Jun/18
0,73 1,60 2,17 1,13 1,20 1,16 Inflação Média Mensal
7,48 14,27 41,95 26,26 6,41 7,65 Inflação Acumulada Anual
7,48 14,27 41,95 26,26 20,65 20,16 Inflação Últimos 12 Meses
0,60 1,12 2,96 1,96 1,58 1,54 Inflação Média Últimos 12 Meses
1,95 4,34 6,21 5,21 3,79 3,56 Inflação Últimos 3 Meses
0,64 1,43 2,03 1,71 1,25 1,17 Inflação Média Últimos 3 Meses
Source: Instituto Nacional de Estatística
(*) Inflation measured by the CPI registered in Luanda


V - GRÁFICOS
V - GRAPHICS
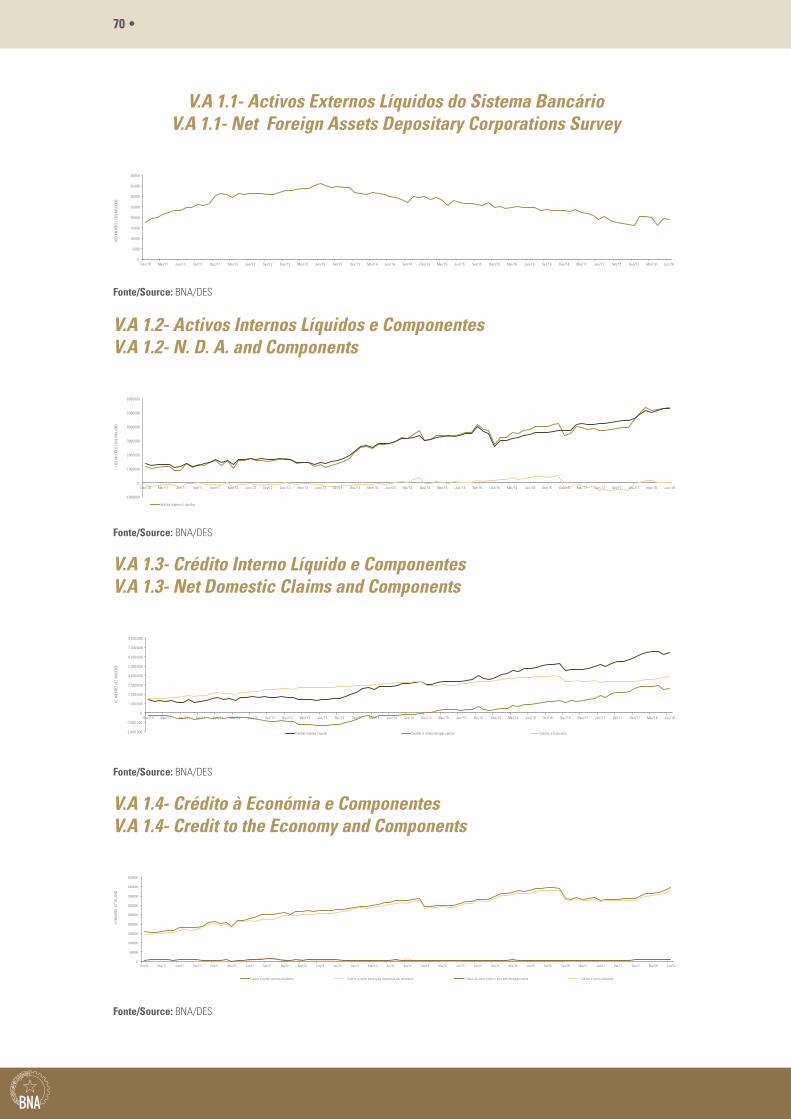
70 •
V.A 1.1- Activos Externos Líquidos do Sistema Bancário V.A 1.1- Net Foreign Assets Depositary Corporations Survey
0
5000
10000
15000
20000
25000
30000
35000
40000
Dez/10 Mar/11 Jun/11 Set/11 Dez/11 Mar/12 Jun/12 Set/12 Dez/12 Mar/13 Jun/13 Set/13 Dez/13 Mar/14 Jun/14 Set/14 Dez/14 Mar/15 Jun/15 Set/15 Dez/15 Mar/16 Jun/16 Set/16 Dez/16 Mar/17 Jun/17 Set/17 Dez/17 Mar/18 Jun/18
USD
MIL
HÕES
/ U
S$ M
ILLI
ONS
Fonte/Source: BNA/DES
V.A 1.2- Activos Internos Líquidos e Componentes V.A 1.2- N. D. A. and Components
-1000000
0
1000000
2000000
3000000
4000000
5000000
6000000
Dez/10 Mar/11 Jun/11 Set/11 Dez/11 Mar/12 Jun/12 Set/12 Dez/12 Mar/13 Jun/13 Set/13 Dez/13 Mar/14 Jun/14 Set/14 Dez/14 Mar/15 Jun/15 Set/15 Dez/15 Mar/16 Jun/16 Set/16 Dez/16 Mar/17 Jun/17 Set/17 Dez/17 Mar/18 Jun/18
USD
MIL
HÕES
/ U
S$ M
ILLI
ONS
Activos Internos Líquidos
Fonte/Source: BNA/DES
V.A 1.3- Crédito Interno Líquido e Componentes V.A 1.3- Net Domestic Claims and Components
-
-Dez/10 Mar/11 Jun/11 Set/11 Dez/11 Mar/12 Jun/12 Set/12 Dez/12 Mar/13 Jun/13 Set/13 Dez/13 Mar/14 Jun/14 Set/14 Dez/14 Mar/15 Jun/15 Set/15 Dez/15 Mar/16 Jun/16 Set/16 Dez/16 Mar/17 Jun/17 Set/17 Dez/17 Mar/18 Jun/18
2.000.000
1.000.000
0
1.000.000
2.000.000
3.000.000
4.000.000
5.000.000
6.000.000
7.000.000
8.000.000
KZ M
ILHÕ
ES /
KZ M
ILLI
ONS
Crédito Interno Líquido Crédito à administração central Crédito a Economia
Fonte/Source: BNA/DES
V.A 1.4- Crédito à Económia e Componentes V.A 1.4- Credit to the Economy and Components
0
500000
1000000
1500000
2000000
2500000
3000000
3500000
4000000
4500000
Dez/10 Mar/11 Jun/11 Set/11 Dez/11 Mar/12 Jun/12 Set/12 Dez/12 Mar/13 Jun/13 Set/13 Dez/13 Mar/14 Jun/14 Set/14 Dez/14 Mar/15 Jun/15 Set/15 Dez/15 Mar/16 Jun/16 Set/16 Dez/16 Mar/17 Jun/17 Set/17 Dez/17 Mar/18 Jun/18
KZ M
ILHÕ
ES /K
Z M
ILLIO
NS
Crédito a outros sectores residentes Crédito a outras instituições financeiras não monetárais Credito ao sector publico, excl. administração central Crédito a outros residentes
Fonte/Source: BNA/DES
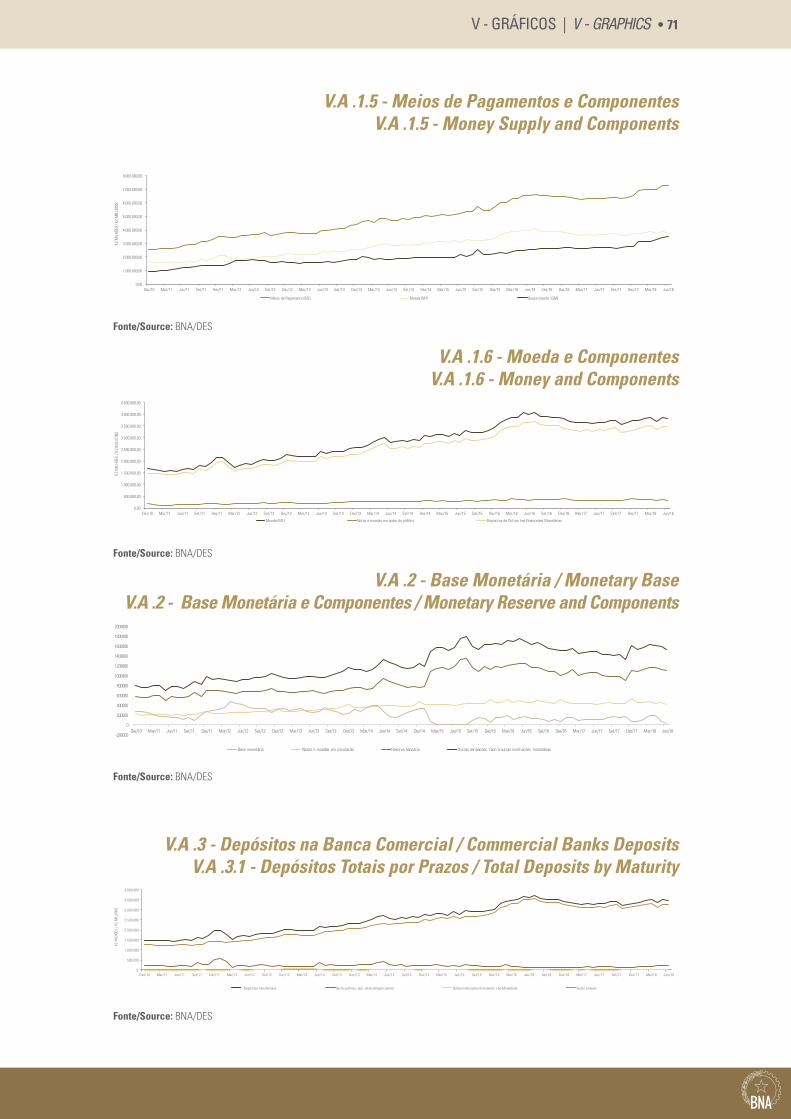
V - GRÁFICOS | V - GRAPHICS • 71
V.A .1.5 - Meios de Pagamentos e Componentes V.A .1.5 - Money Supply and Components
0,00
1.000.000,00
2.000.000,00
3.000.000,00
4.000.000,00
5.000.000,00
6.000.000,00
7.000.000,00
8.000.000,00
Dez/10 Mar/11 Jun/11 Set/11 Dez/11 Mar/12 Jun/12 Set/12 Dez/12 Mar/13 Jun/13 Set/13 Dez/13 Mar/14 Jun/14 Set/14 Dez/14 Mar/15 Jun/15 Set/15 Dez/15 Mar/16 Jun/16 Set/16 Dez/16 Mar/17 Jun/17 Set/17 Dez/17 Mar/18 Jun/18
KZ M
ILHÕ
ES/ K
Z M
ILLI
ONS
Meios de Pagamento (M2) Moeda (M1) Quase-moeda (QM)
Fonte/Source: BNA/DES
V.A .1.6 - Moeda e Componentes V.A .1.6 - Money and Components
Dez/10 Mar/11 Jun/11 Set/11 Dez/11 Mar/12 Jun/12 Set/12 Dez/12 Mar/13 Jun/13 Set/13 Dez/13 Mar/14 Jun/14 Set/14 Dez/14 Mar/15 Jun/15 Set/15 Dez/15 Mar/16 Jun/16 Set/16 Dez/16 Mar/17 Jun/17 Set/17 Dez/17 Mar/18 Jun/180,00
500.000,00
1.000.000,00
1.500.000,00
2.000.000,00
2.500.000,00
3.000.000,00
3.500.000,00
4.000.000,00
4.500.000,00
KZ M
ILHÕ
ES /
KZ M
ILLI
ONS
Moeda (M1) Notas e moedas em poder do público Depósitos de Outras Inst.Financeiras Monetárias
Fonte/Source: BNA/DES
V.A .2 - Base Monetária / Monetary Base V.A .2 - Base Monetária e Componentes / Monetary Reserve and Components
-200000
0
200000
400000
600000
800000
1000000
1200000
1400000
1600000
1800000
2000000
Dez/10 Mar/11 Jun/11 Set/11 Dez/11 Mar/12 Jun/12 Set/12 Dez/12 Mar/13 Jun/13 Set/13 Dez/13 Mar/14 Jun/14 Set/14 Dez/14 Mar/15 Jun/15 Set/15 Dez/15 Mar/16 Jun/16 Set/16 Dez/16 Mar/17 Jun/17 Set/17 Dez/17 Mar/18 Jun/18
Base monetária Notas e moedas em circulação Reserva bancária Outras obrigações face à outras instituições monetárias
Fonte/Source: BNA/DES
V.A .3 - Depósitos na Banca Comercial / Commercial Banks Deposits V.A .3.1 - Depósitos Totais por Prazos / Total Deposits by Maturity
0
500.000
1.000.000
1.500.000
2.000.000
2.500.000
3.000.000
3.500.000
4.000.000
Dez/10 Mar/11 Jun/11 Set/11 Dez/11 Mar/12 Jun/12 Set/12 Dez/12 Mar/13 Jun/13 Set/13 Dez/13 Mar/14 Jun/14 Set/14 Dez/14 Mar/15 Jun/15 Set/15 Dez/15 Mar/16 Jun/16 Set/16 Dez/16 Mar/17 Jun/17 Set/17 Dez/17 Mar/18 Jun/18
KZ M
ILHÕ
ES /
KZ
MIL
LION
S
Depósitos transferíveis Sector público, excl. administração central Outras Instituições financeiras não Monetárias Sector privado
Fonte/Source: BNA/DES
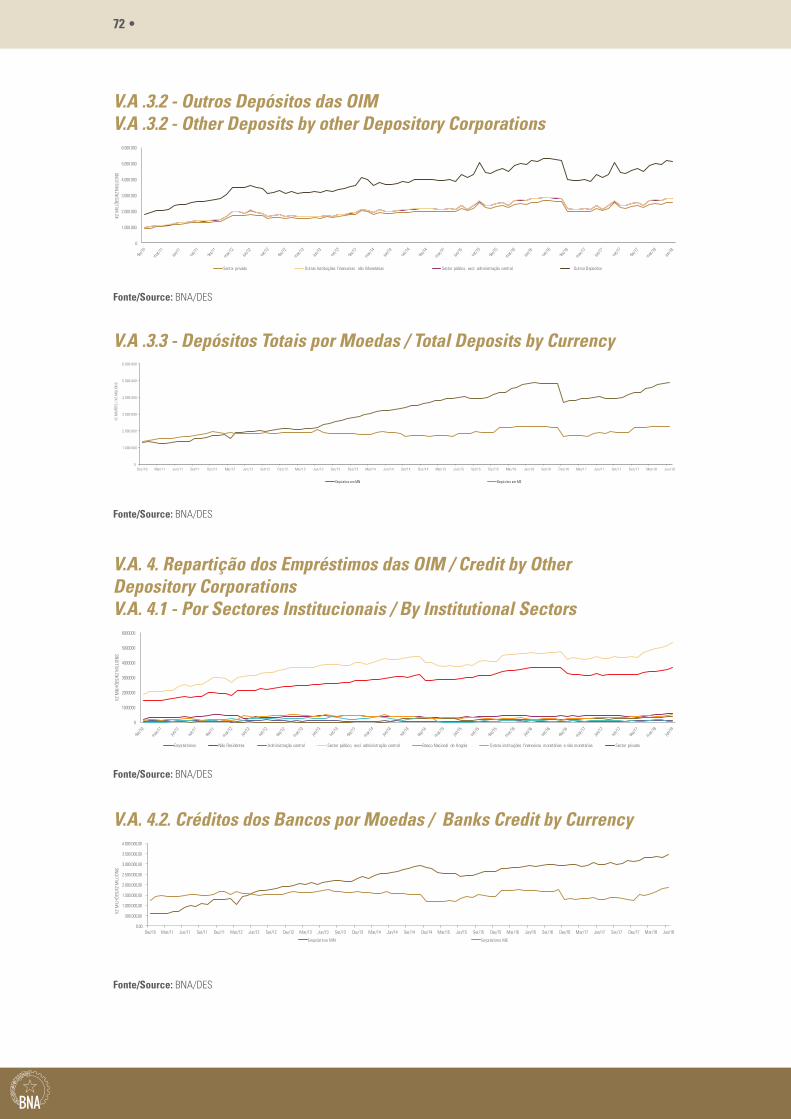
72 •
V.A .3.2 - Outros Depósitos das OIM V.A .3.2 - Other Deposits by other Depository Corporations
0
1.000.000
2.000.000
3.000.000
4.000.000
5.000.000
6.000.000
KZ M
ILLÕE
S/KZ
MiIL
LIONS
Sector privado Outras Instituições financeiras não Monetárias Sector público, excl. administração central Outrso Depósitos
Fonte/Source: BNA/DES
V.A .3.3 - Depósitos Totais por Moedas / Total Deposits by Currency
Dez/10 Mar/11 Jun/11 Set/11 Dez/11 Mar/12 Jun/12 Set/12 Dez/12 Mar/13 Jun/13 Set/13 Dez/13 Mar/14 Jun/14 Set/14 Dez/14 Mar/15 Jun/15 Set/15 Dez/15 Mar/16 Jun/16 Set/16 Dez/16 Mar/17 Jun/17 Set/17 Dez/17 Mar/18 Jun/180
1.000.000
2.000.000
3.000.000
4.000.000
5.000.000
6.000.000
KZ M
ILHÕ
ES /
KZ
MIL
LION
S
Depósitos em MN Depósitos em ME
Fonte/Source: BNA/DES
V.A. 4. Repartição dos Empréstimos das OIM / Credit by Other Depository Corporations V.A. 4.1 - Por Sectores Institucionais / By Institutional Sectors
0
1000000
2000000
3000000
4000000
5000000
6000000
KZ M
ILHÕE
S/KZ
MILL
IONS
Empréstimos Não Residentes Administração central Sector público, excl. administração central Banco Nacional de Angola Outras instituições financeiras monetárias e não monetárias Sector privado
Fonte/Source: BNA/DES
V.A. 4.2. Créditos dos Bancos por Moedas / Banks Credit by Currency
0,00
500.000,00
1.000.000,00
1.500.000,00
2.000.000,00
2.500.000,00
3.000.000,00
3.500.000,00
4.000.000,00
Dez/10 Mar/11 Jun/11 Set/11 Dez/11 Mar/12 Jun/12 Set/12 Dez/12 Mar/13 Jun/13 Set/13 Dez/13 Mar/14 Jun/14 Set/14 Dez/14 Mar/15 Jun/15 Set/15 Dez/15 Mar/16 Jun/16 Set/16 Dez/16 Mar/17 Jun/17 Set/17 Dez/17 Mar/18 Jun/18
KZ M
ILHÕE
S/KZ
MILL
IONS
Empréstimo MN Empréstimo ME
Fonte/Source: BNA/DES
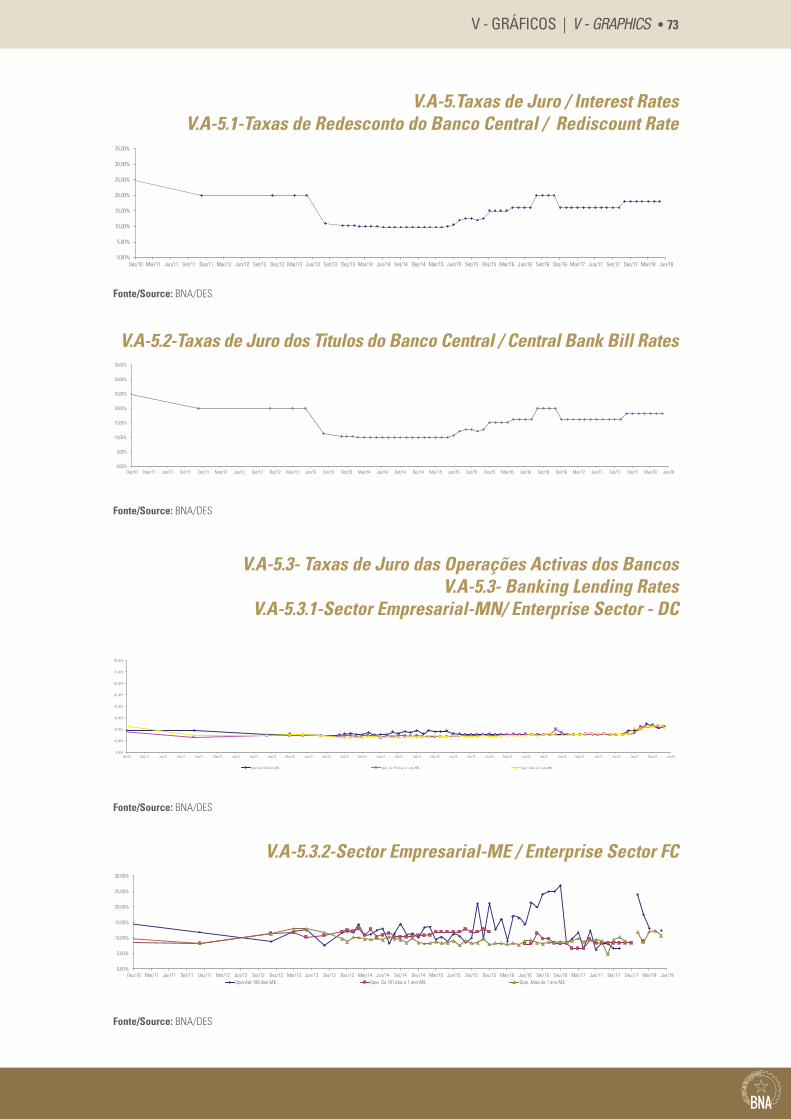
V - GRÁFICOS | V - GRAPHICS • 73
V.A-5.Taxas de Juro / Interest Rates V.A-5.1-Taxas de Redesconto do Banco Central / Rediscount Rate
0,00%
5,00%
10,00%
15,00%
20,00%
25,00%
30,00%
35,00%
Dez/10 Mar/11 Jun/11 Set/11 Dez/11 Mar/12 Jun/12 Set/12 Dez/12 Mar/13 Jun/13 Set/13 Dez/13 Mar/14 Jun/14 Set/14 Dez/14 Mar/15 Jun/15 Set/15 Dez/15 Mar/16 Jun/16 Set/16 Dez/16 Mar/17 Jun/17 Set/17 Dez/17 Mar/18 Jun/18
Fonte/Source: BNA/DES
V.A-5.3- Taxas de Juro das Operações Activas dos Bancos V.A-5.3- Banking Lending Rates
V.A-5.3.1-Sector Empresarial-MN/ Enterprise Sector - DC
0,00%
10,00%
20,00%
30,00%
40,00%
50,00%
60,00%
70,00%
80,00%
Dez/10 Mar/11 Jun/11 Set/11 Dez/11 Mar/12 Jun/12 Set/12 Dez/12 Mar/13 Jun/13 Set/13 Dez/13 Mar/14 Jun/14 Set/14 Dez/14 Mar/15 Jun/15 Set/15 Dez/15 Mar/16 Jun/16 Set/16 Dez/16 Mar/17 Jun/17 Set/17 Dez/17 Mar/18 Jun/18
Oper.Até 180 dias-MN Oper. De 181 dias a 1 ano-MN Oper. Mais de 1 ano-MN
Fonte/Source: BNA/DES
V.A-5.3.2-Sector Empresarial-ME / Enterprise Sector FC
0,00%
5,00%
10,00%
15,00%
20,00%
25,00%
30,00%
Oper.Até 180 dias-MEDez/10 Mar/11 Jun/11 Set/11 Dez/11 Mar/12 Jun/12 Set/12 Dez/12 Mar/13 Jun/13 Set/13 Dez/13 Mar/14 Jun/15 Set/15 Dez/15 Mar/16 Jun/16 Set/16 Dez/16 Mar/17 Jun/17 Set/17 Dez/17 Mar/18 Jun/18Jun/14 Set/14 Dez/14 Mar/15
Oper. De 181 dias a 1 ano-ME Oper. Mais de 1 ano-ME
Fonte/Source: BNA/DES
V.A-5.2-Taxas de Juro dos Titulos do Banco Central / Central Bank Bill Rates
0,00%
5,00%
10,00%
15,00%
20,00%
25,00%
30,00%
35,00%
Dez/10 Mar/11 Jun/11 Set/11 Dez/11 Mar/12 Jun/12 Set/12 Dez/12 Mar/13 Jun/13 Set/13 Dez/13 Mar/14 Jun/14 Set/14 Dez/14 Mar/15 Jun/15 Set/15 Dez/15 Mar/16 Jun/16 Set/16 Dez/16 Mar/17 Jun/17 Set/17 Dez/17 Mar/18 Jun/18
Fonte/Source: BNA/DES
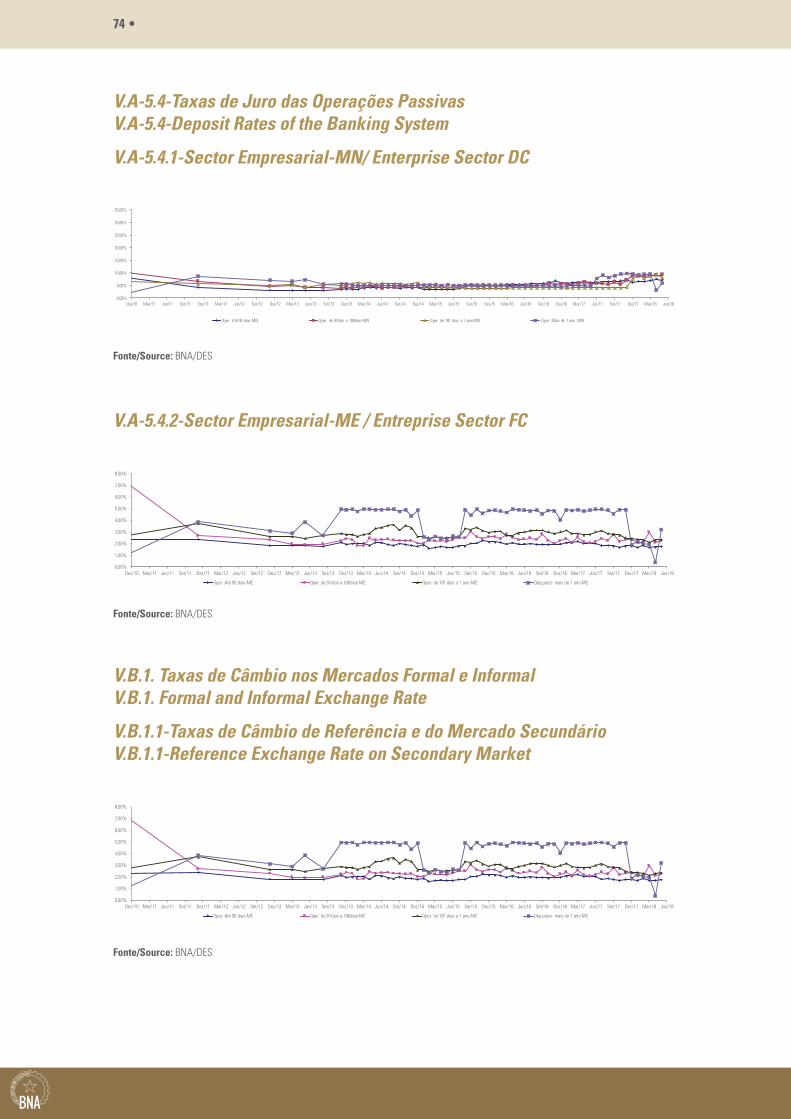
74 •
V.A-5.4-Taxas de Juro das Operações Passivas V.A-5.4-Deposit Rates of the Banking System
V.A-5.4.1-Sector Empresarial-MN/ Enterprise Sector DC
0,00%
5,00%
10,00%
15,00%
20,00%
25,00%
30,00%
35,00%
Dez/10 Mar/11 Jun/11 Set/11 Dez/11 Mar/12 Jun/12 Set/12 Dez/12 Mar/13 Jun/13 Set/13 Dez/13 Mar/14 Jun/14 Set/14 Dez/14 Mar/15 Jun/15 Set/15 Dez/15 Mar/16 Jun/16 Set/16 Dez/16 Mar/17 Jun/17 Set/17 Dez/17 Mar/18 Jun/18
Oper. Até 90 dias-MN Oper. de 91dias a 180dias-MN Oper. de 181 dias a 1 ano-MN Oper. Mais de 1 ano MN
Fonte/Source: BNA/DES
V.A-5.4.2-Sector Empresarial-ME / Entreprise Sector FC
0,00%
1,00%
2,00%
3,00%
4,00%
5,00%
6,00%
7,00%
8,00%
Dez/10 Mar/11 Jun/11 Set/11 Dez/11 Mar/12 Jun/12 Set/12 Dez/12 Mar/13 Jun/13 Set/13 Dez/13 Mar/14 Jun/14 Set/14 Dez/14 Mar/15 Jun/15 Set/15 Dez/15 Mar/16 Jun/16 Set/16 Dez/16 Mar/17 Jun/17 Set/17 Dez/17 Mar/18 Jun/18
Oper. Até 90 dias-ME Oper. de 91dias a 180dias-ME Oper. de 181 dias a 1 ano-ME Dep.prazo mais de 1 ano ME
Fonte/Source: BNA/DES
V.B.1. Taxas de Câmbio nos Mercados Formal e Informal V.B.1. Formal and Informal Exchange Rate
V.B.1.1-Taxas de Câmbio de Referência e do Mercado Secundário V.B.1.1-Reference Exchange Rate on Secondary Market
0,00%
1,00%
2,00%
3,00%
4,00%
5,00%
6,00%
7,00%
8,00%
Dez/10 Mar/11 Jun/11 Set/11 Dez/11 Mar/12 Jun/12 Set/12 Dez/12 Mar/13 Jun/13 Set/13 Dez/13 Mar/14 Jun/14 Set/14 Dez/14 Mar/15 Jun/15 Set/15 Dez/15 Mar/16 Jun/16 Set/16 Dez/16 Mar/17 Jun/17 Set/17 Dez/17 Mar/18 Jun/18
Oper. Até 90 dias-ME Oper. de 91dias a 180dias-ME Oper. de 181 dias a 1 ano-ME Dep.prazo mais de 1 ano ME
Fonte/Source: BNA/DES
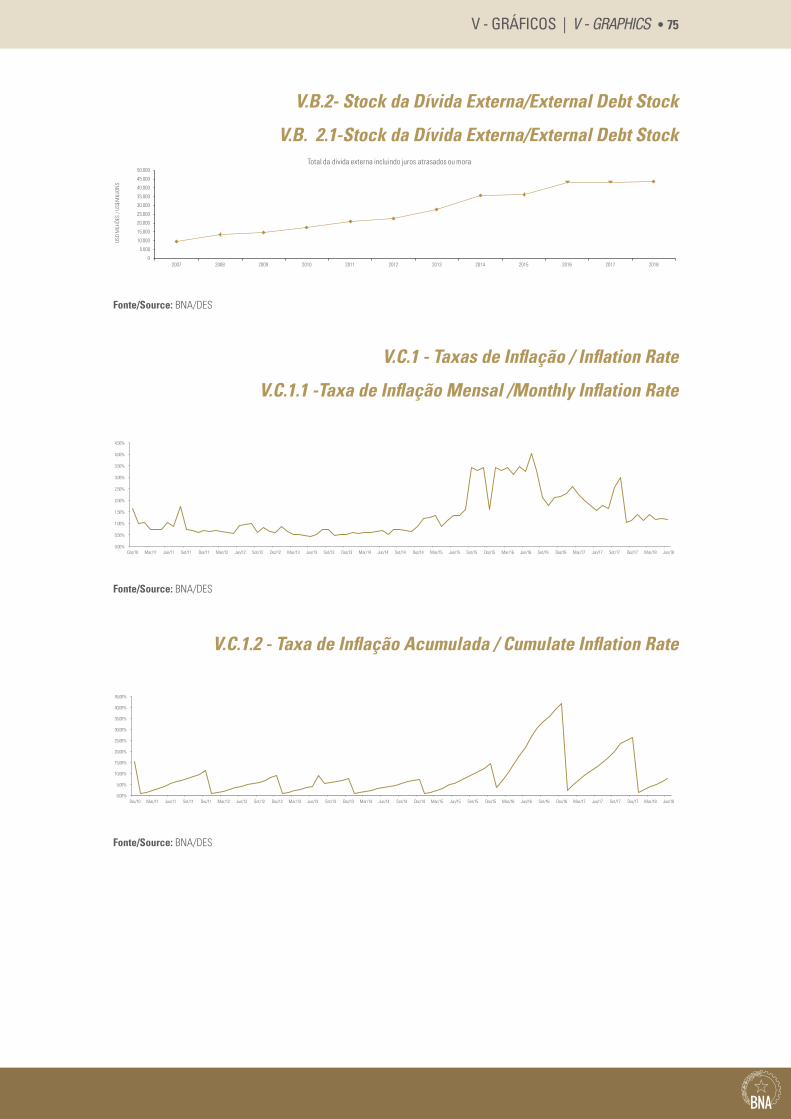
V - GRÁFICOS | V - GRAPHICS • 75
V.B.2- Stock da Dívida Externa/External Debt Stock
V.B. 2.1-Stock da Dívida Externa/External Debt Stock
2007 2008 2009 2010 2011 2012 2013 2014 2015 2016 2017 20180
5.000
10.000
15.000
20.000
25.000
30.000
35.000
40.000
45.000
50.000
USD
MILH
ÕES
/ US$
MILL
ION
S
Total da divida externa incluindo juros atrasados ou mora
Fonte/Source: BNA/DES
V.C.1 - Taxas de Inflação / Inflation Rate
V.C.1.1 -Taxa de Inflação Mensal /Monthly Inflation Rate
0,00%
0,50%
1,00%
1,50%
2,00%
2,50%
3,00%
3,50%
4,00%
4,50%
Dez/10 Mar/11 Jun/11 Set/11 Dez/11 Mar/12 Jun/12 Set/12 Dez/12 Mar/13 Jun/13 Set/13 Dez/13 Mar/14 Jun/14 Set/14 Dez/14 Mar/15 Jun/15 Set/15 Dez/15 Mar/16 Jun/16 Set/16 Dez/16 Mar/17 Jun/17 Set/17 Dez/17 Mar/18 Jun/18
Fonte/Source: BNA/DES
V.C.1.2 - Taxa de Inflação Acumulada / Cumulate Inflation Rate
0,00%
5,00%
10,00%
15,00%
20,00%
25,00%
30,00%
35,00%
40,00%
45,00%
Dez/10 Mar/11 Jun/11 Set/11 Dez/11 Mar/12 Jun/12 Set/12 Dez/12 Mar/13 Jun/13 Set/13 Dez/13 Mar/14 Jun/14 Set/14 Dez/14 Mar/15 Jun/15 Set/15 Dez/15 Mar/16 Jun/16 Set/16 Dez/16 Mar/17 Jun/17 Set/17 Dez/17 Mar/18 Jun/18
Fonte/Source: BNA/DES

Av. 4 de Fevereiro nº 151 - Luanda - Angola Caixa Postal 1243Tel: (+244) 222 679200 - Fax: (+244) 222 339 125www.bna.ao