Embed Size (px)
Citation preview
Compensation: Basic Principles
Bonus topic: Daytime Stargazing
Mario RoedererImmunoTechnology SectionVaccine Research Center, NIAID, NIH
Monday, June 20, 2011
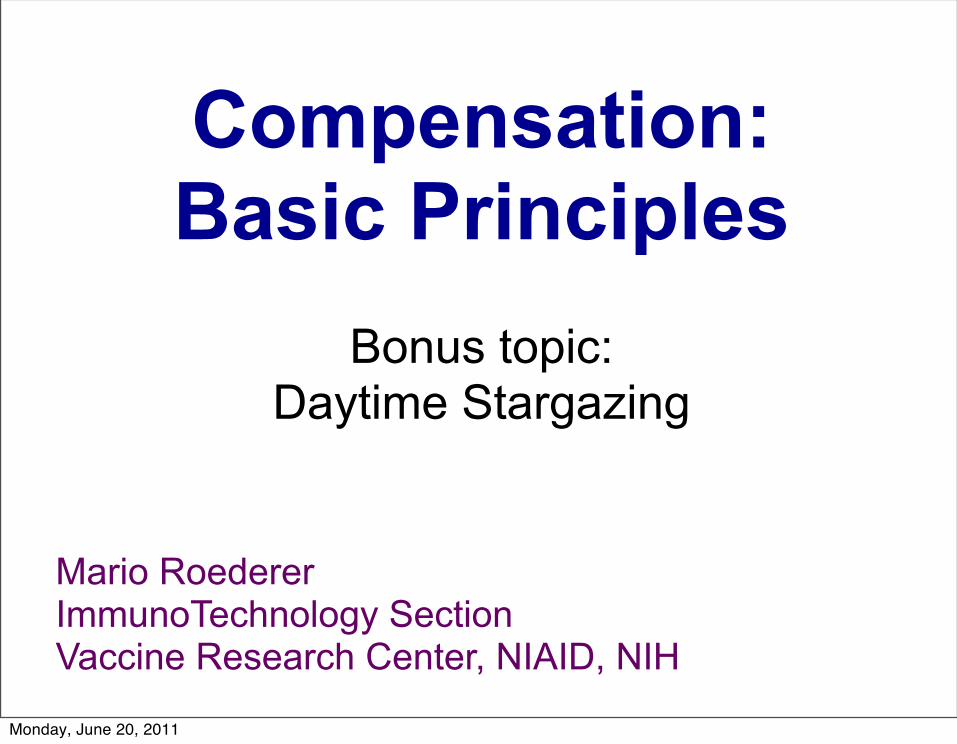
FL1 FL2
Spectral Spillover Necessitates Compensation
450 500 550 600
Argon Laser
FITC PE
Monday, June 20, 2011
FL1 FL2
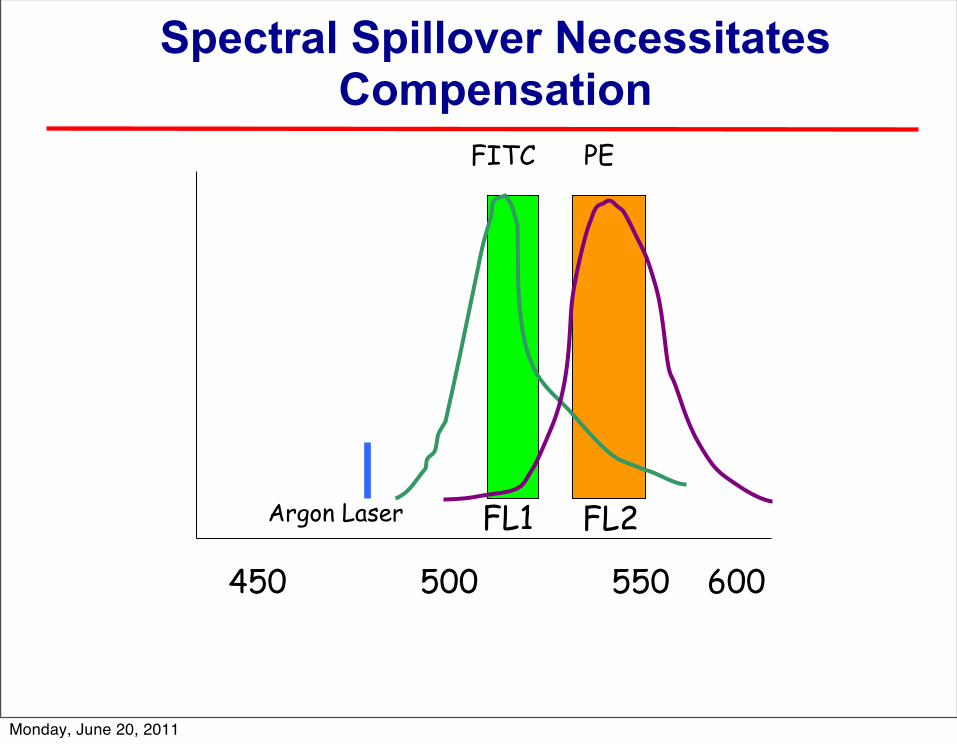
Spectral Spillover Necessitates Compensation
450 500 550 600
Argon Laser
FITC PETotal signal detected in FL1 Unwanted signal
detected in FL2
= roughly 15%
True PE = Total FL2 – 15% FL1Monday, June 20, 2011
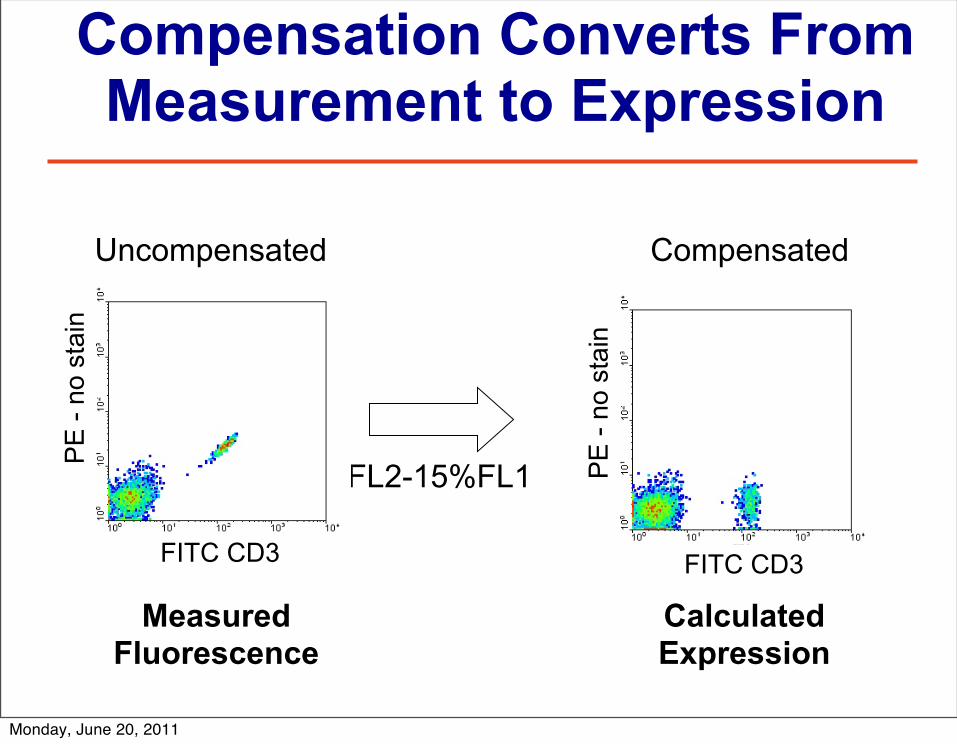
Measured Fluorescence
Compensation Converts From Measurement to Expression
FL2-15%FL1
Uncompensated Compensated
FITC CD3FITC CD3
PE
- no
sta
in
PE
- no
sta
inCalculated Expression
Monday, June 20, 2011
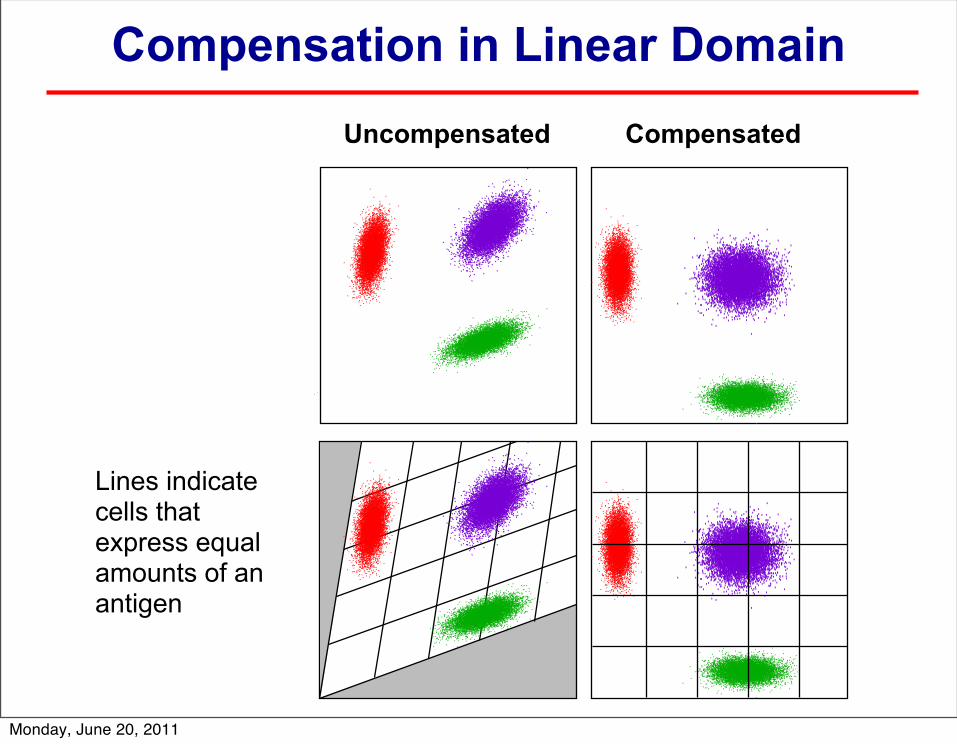
Compensation in Linear DomainCompensatedUncompensated
Lines indicate cells that express equal amounts of an antigen
Monday, June 20, 2011
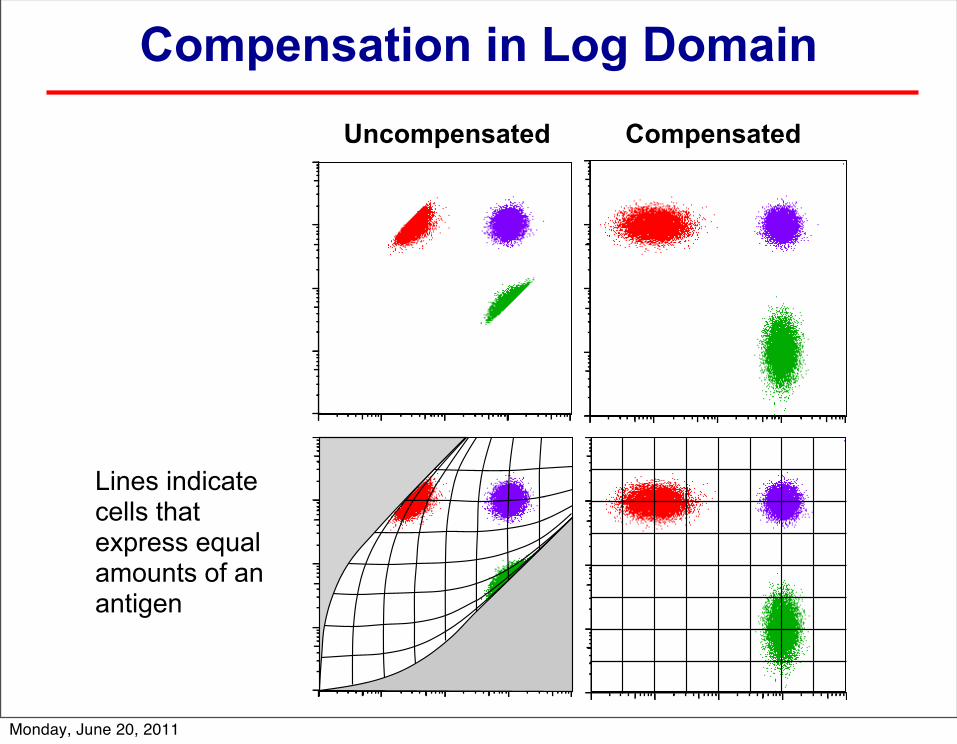
Compensation in Log DomainCompensatedUncompensated
Lines indicate cells that express equal amounts of an antigen
Monday, June 20, 2011
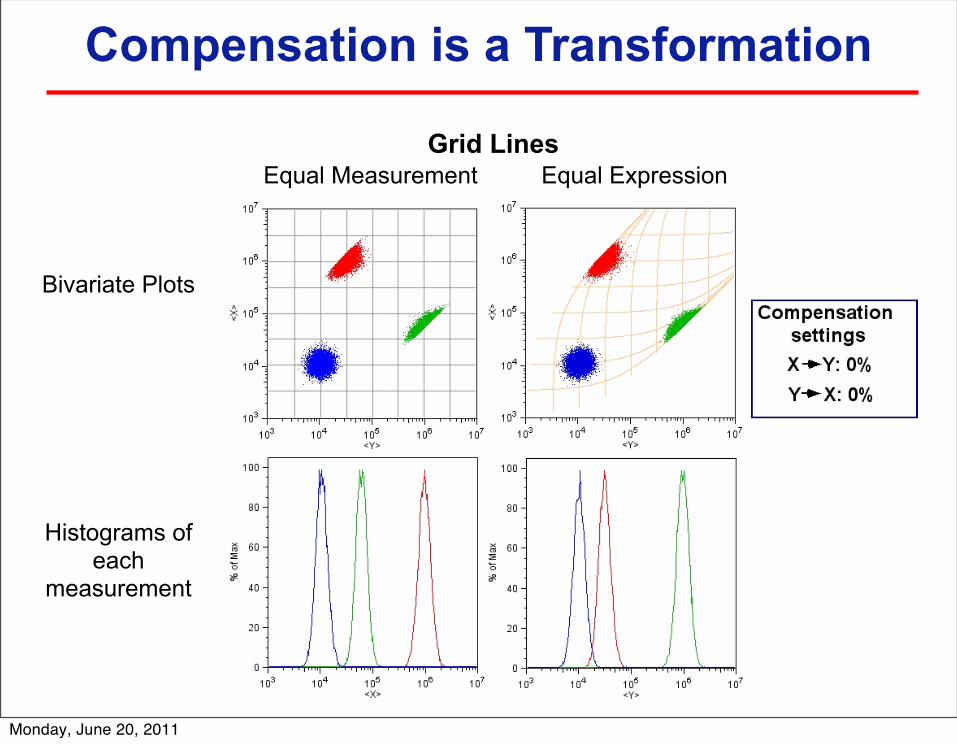
Compensation is a Transformation
Grid LinesEqual Measurement Equal Expression
Histograms of each
measurement
Bivariate Plots
Monday, June 20, 2011
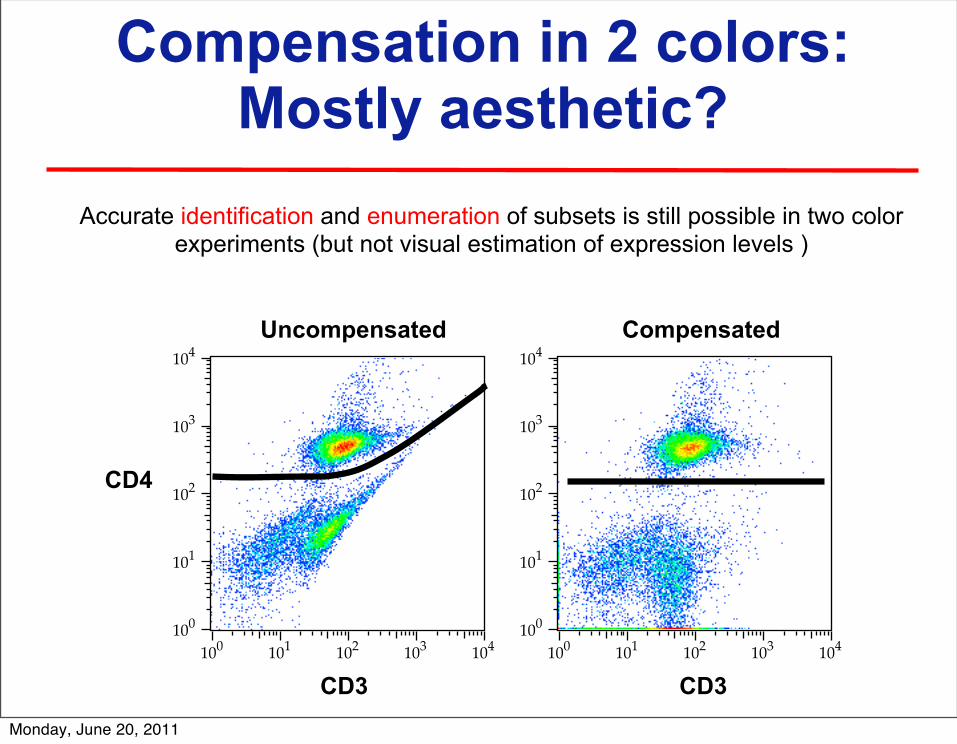
Compensation in 2 colors:Mostly aesthetic?
100 101 102 103 104100
101
102
103
104
100 101 102 103 104100
101
102
103
104
CD3
CD4
CD3
CompensatedUncompensated
Accurate identification and enumeration of subsets is still possible in two color experiments (but not visual estimation of expression levels )
Monday, June 20, 2011
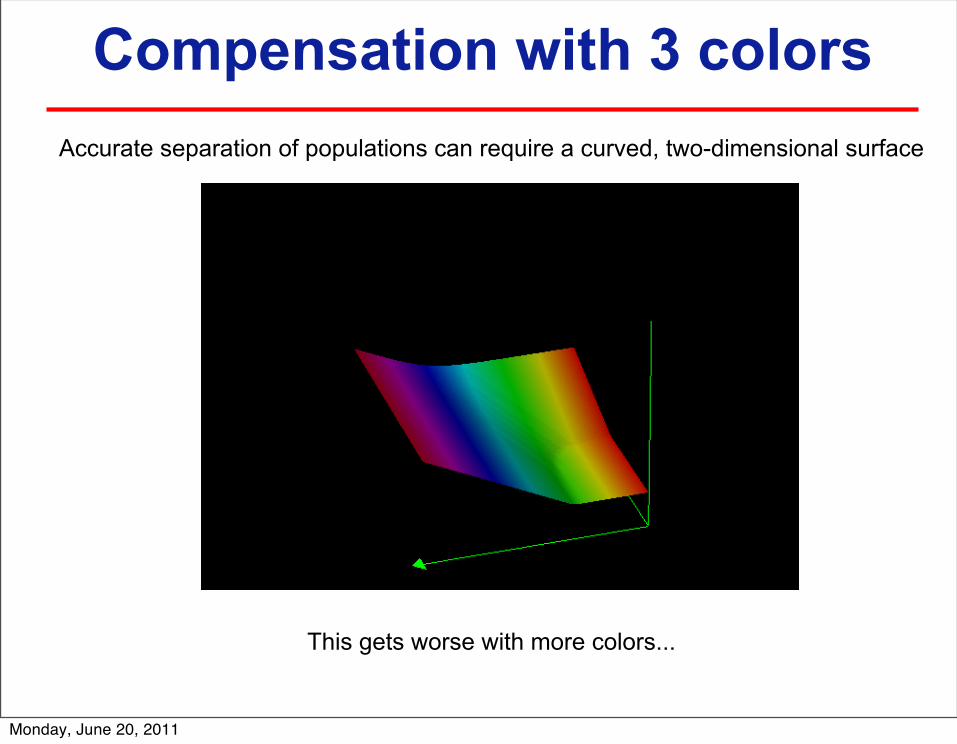
Compensation with 3 colorsAccurate separation of populations can require a curved, two-dimensional surface
This gets worse with more colors...
Monday, June 20, 2011
Compensation: Not just aesthetic
• Accurate discrimination of subsets is possible with uncompensated data
• However, this is true only when the expression of all antigens is uniform on each subset (e.g., CD45 / CD3 / CD4 / CD8)
• Separation of populations may require multi-dimensional surfaces.
Monday, June 20, 2011
Compensation for more colors:It’s not just pretty pictures
• Spillover from unviewed measurement channel can alter event positions– without obvious visual evidence (no diagnostic diagonals!)
• Thus, gate positions may depend on unviewed measurement channels and be different for various tubes in a panel
• Gates could also be highly dependant on which subset is being analyzed!
Monday, June 20, 2011
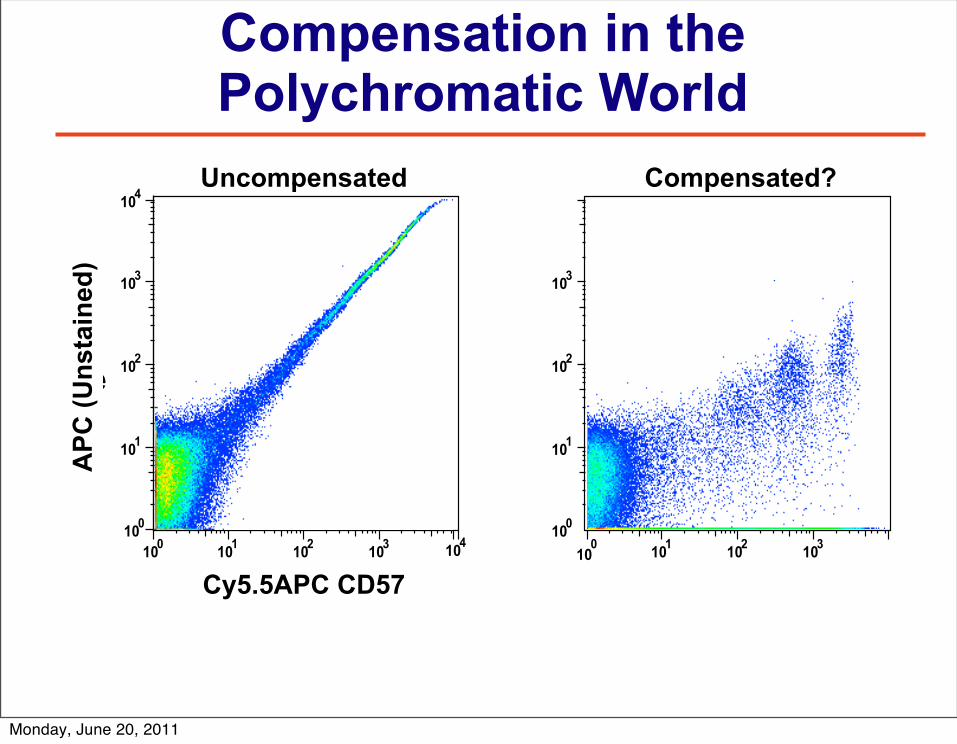
Compensation in the Polychromatic World
100
101
102
103
100
101
102
103
CompensatedCompensated?
100
104
101
102
103
104
SpilloverFluorescence
100
101
102
103
Primary Fluorescence
UncompensatedUncompensated
Cy5.5APC CD57
APC
(Uns
tain
ed)
Monday, June 20, 2011
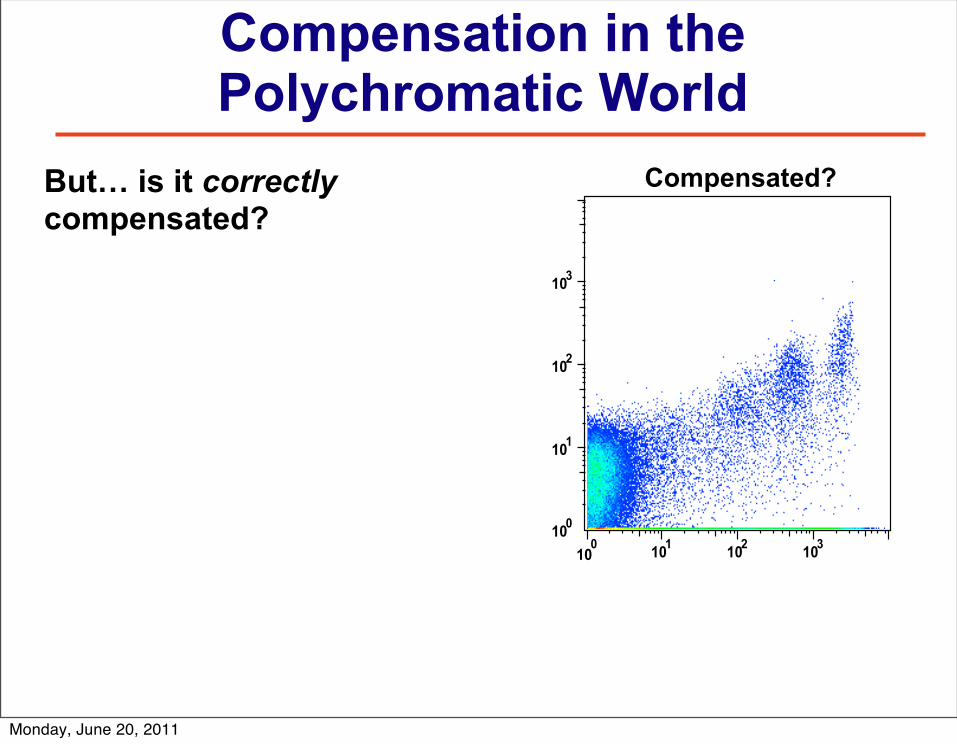
Compensation in the Polychromatic World
100
101
102
103
100
101
102
103
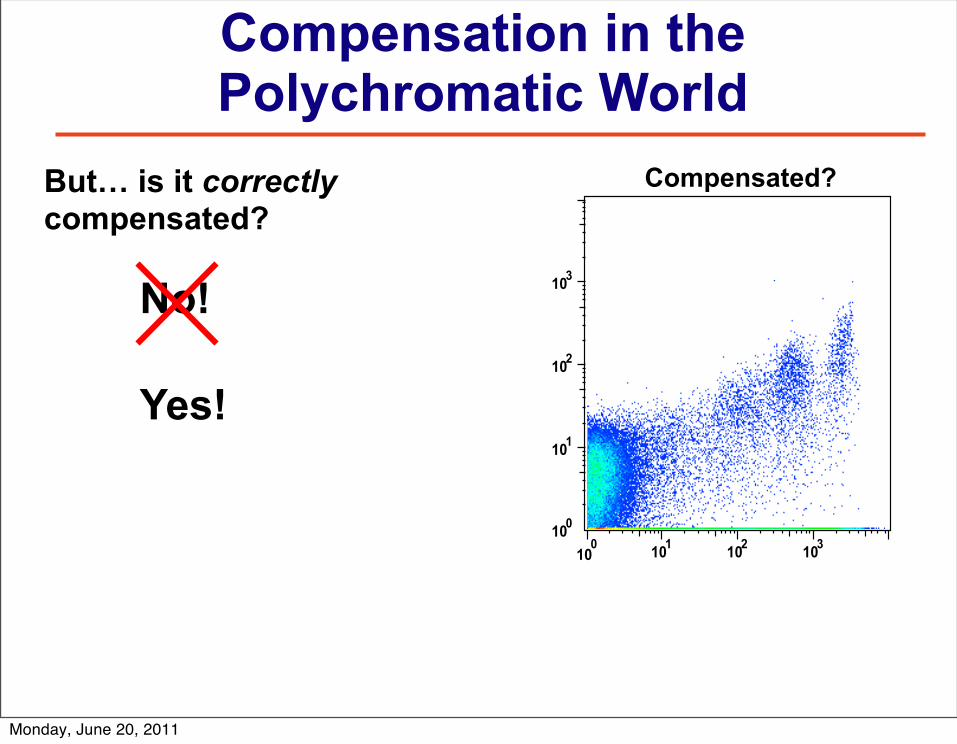
CompensatedCompensated?But… is it correctly compensated?
Monday, June 20, 2011
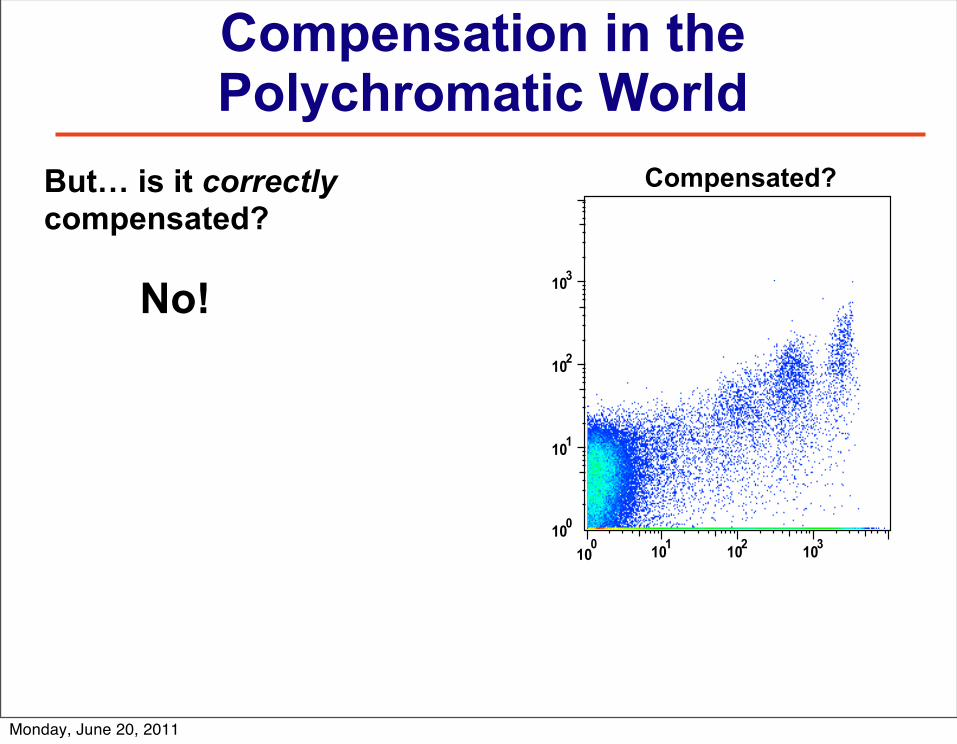
Compensation in the Polychromatic World
100
101
102
103
100
101
102
103
CompensatedCompensated?But… is it correctly compensated?
No!
Monday, June 20, 2011
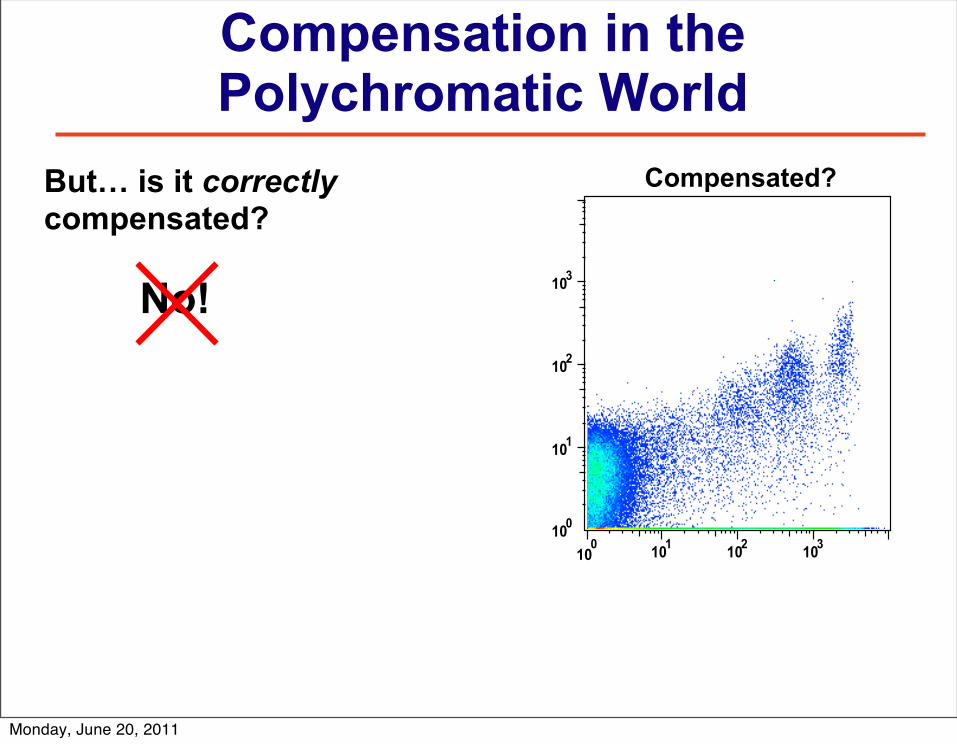
Compensation in the Polychromatic World
100
101
102
103
100
101
102
103
CompensatedCompensated?But… is it correctly compensated?
No!
Monday, June 20, 2011
Compensation in the Polychromatic World
100
101
102
103
100
101
102
103
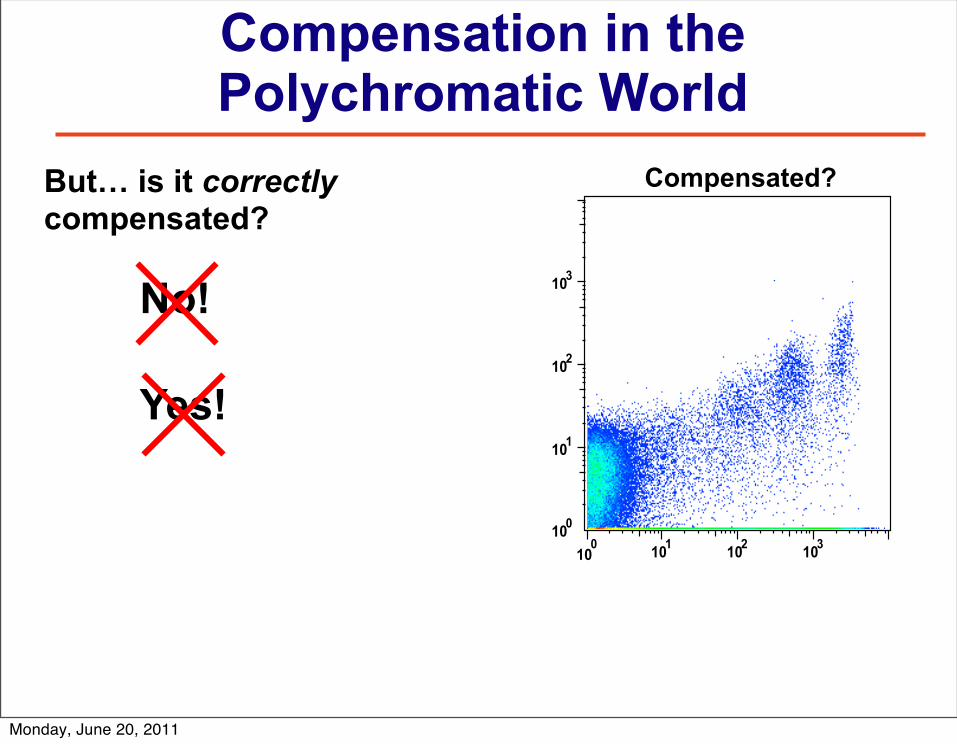
CompensatedCompensated?But… is it correctly compensated?
No!
Yes!
Monday, June 20, 2011
Compensation in the Polychromatic World
100
101
102
103
100
101
102
103
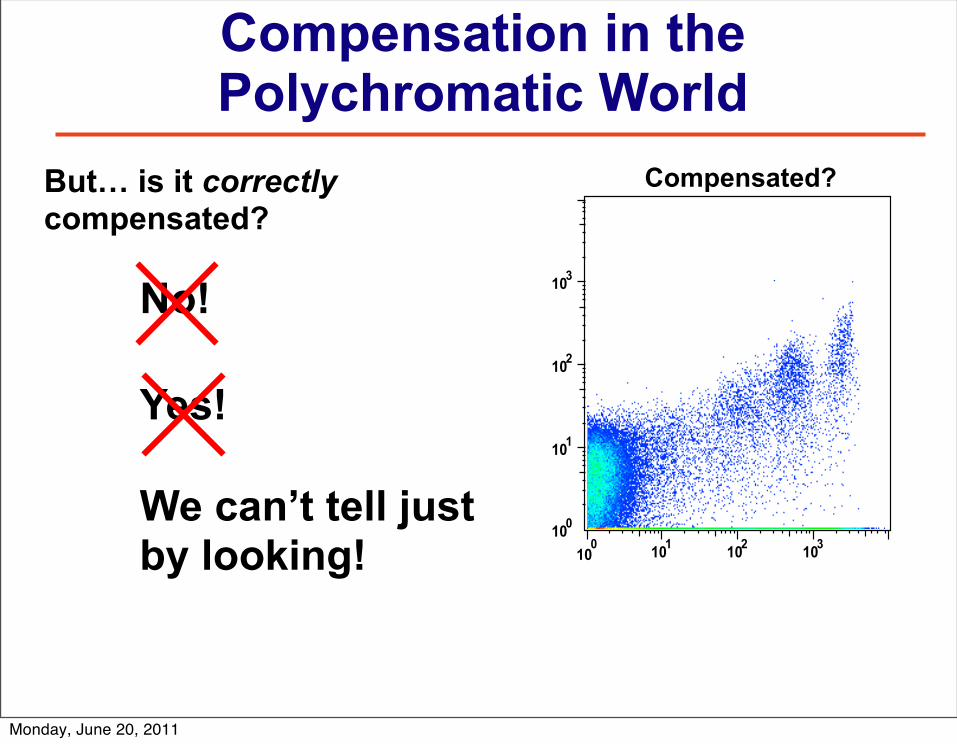
CompensatedCompensated?But… is it correctly compensated?
No!
Yes!
Monday, June 20, 2011
Compensation in the Polychromatic World
100
101
102
103
100
101
102
103
CompensatedCompensated?But… is it correctly compensated?
No!
Yes!
We can’t tell just by looking!
Monday, June 20, 2011
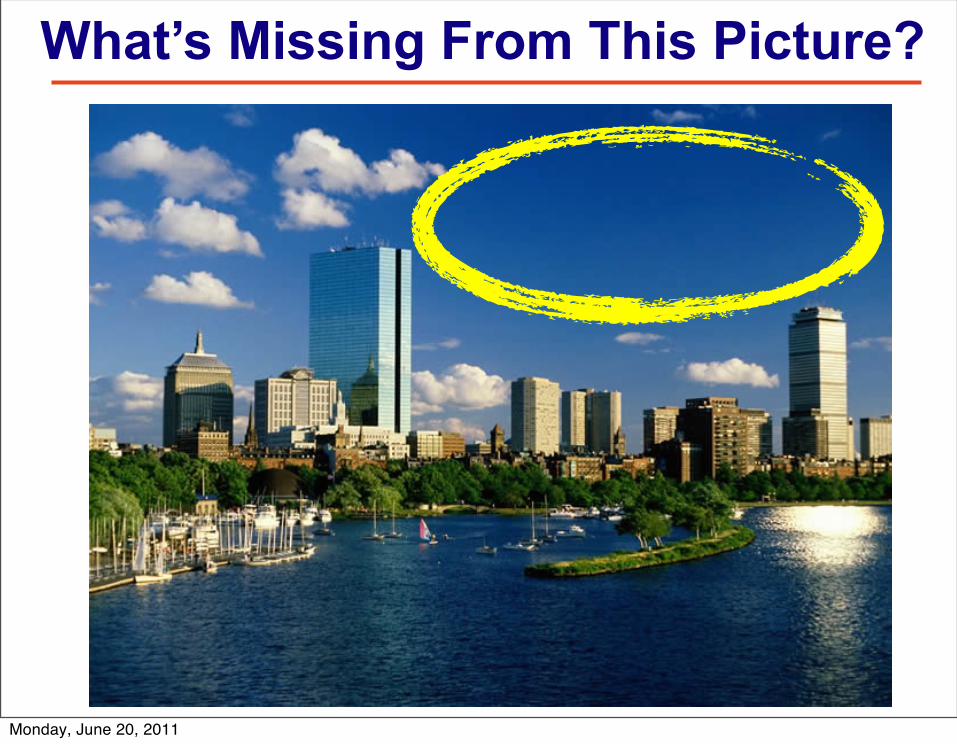
What’s Missing From This Picture?
Monday, June 20, 2011
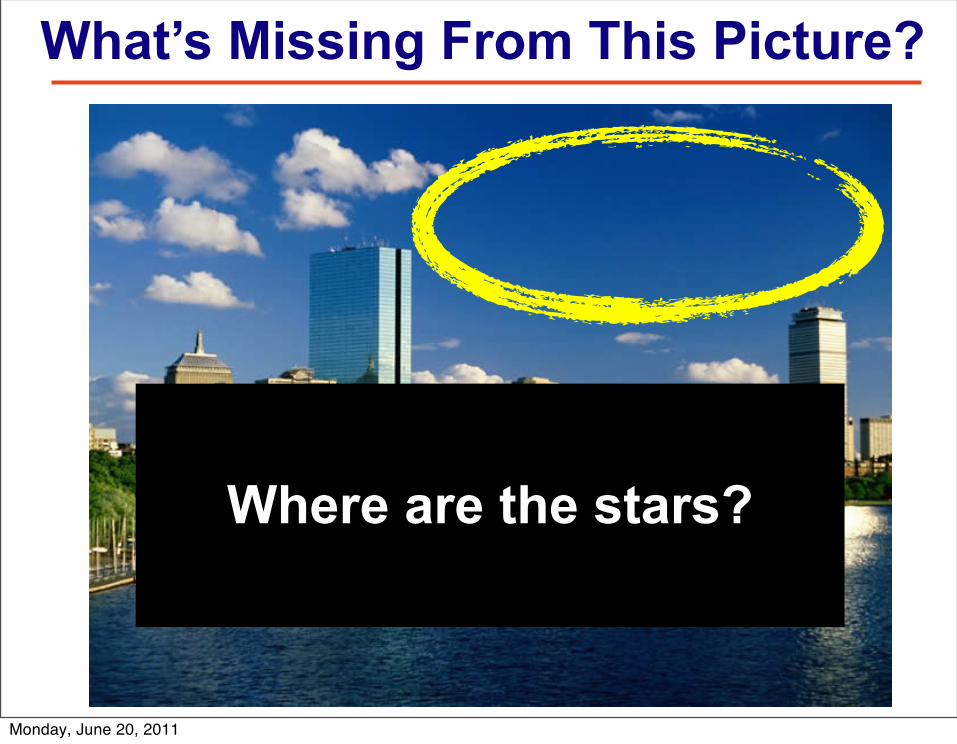
What’s Missing From This Picture?
Where are the stars?
Monday, June 20, 2011
We call this the “Blue Sky Effect.”
But….. Why?
Why can’t we see stars during the day?
On cloudless nights, we see lots of stars.On cloudless days, we rarely see stars.
Nowhere on the web is this commonly-asked question answered correctly.
Monday, June 20, 2011
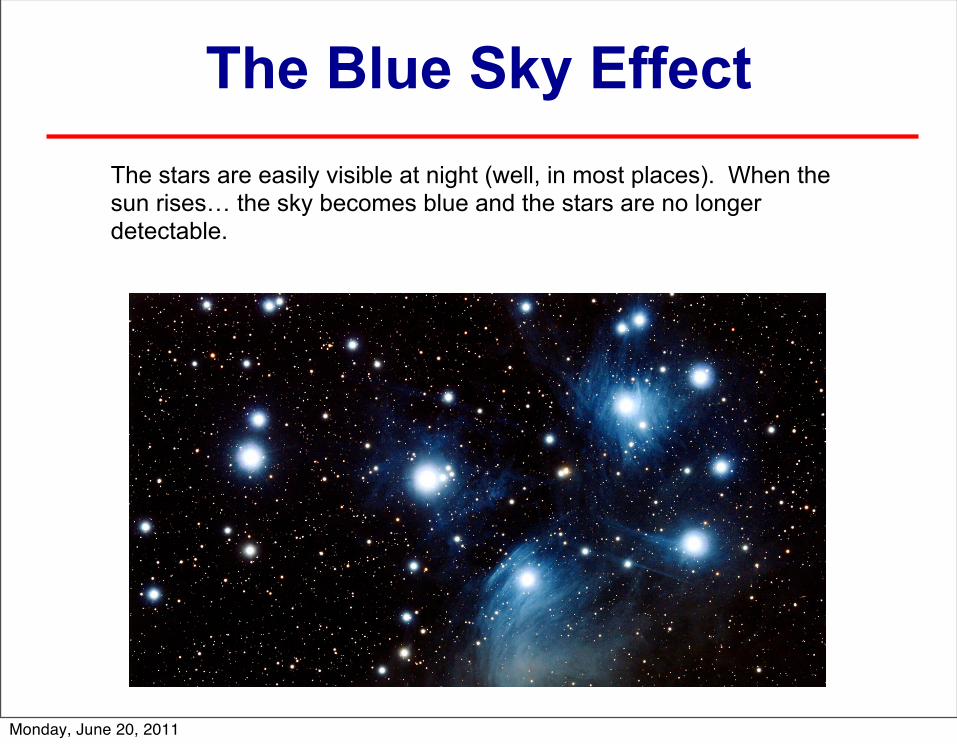
The Blue Sky EffectThe stars are easily visible at night (well, in most places). When the sun rises… the sky becomes blue and the stars are no longer detectable.
Monday, June 20, 2011
The Blue Sky EffectThe stars are easily visible at night (well, in most places). When the sun rises… the sky becomes blue and the stars are no longer detectable.
Monday, June 20, 2011
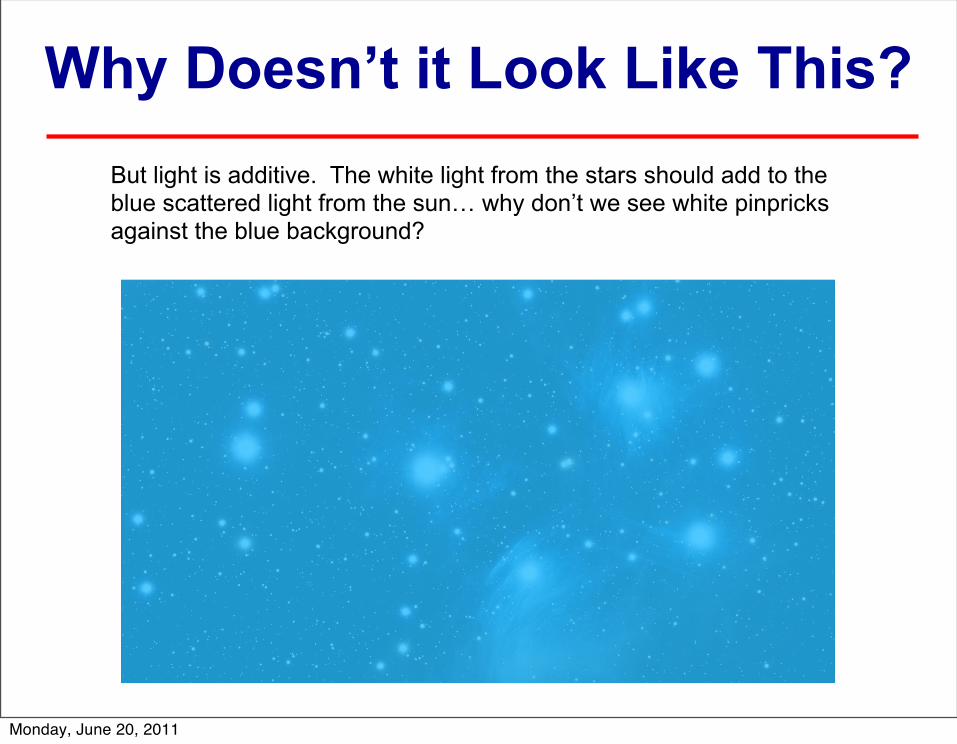
Why Doesn’t it Look Like This?But light is additive. The white light from the stars should add to the blue scattered light from the sun… why don’t we see white pinpricks against the blue background?
Monday, June 20, 2011
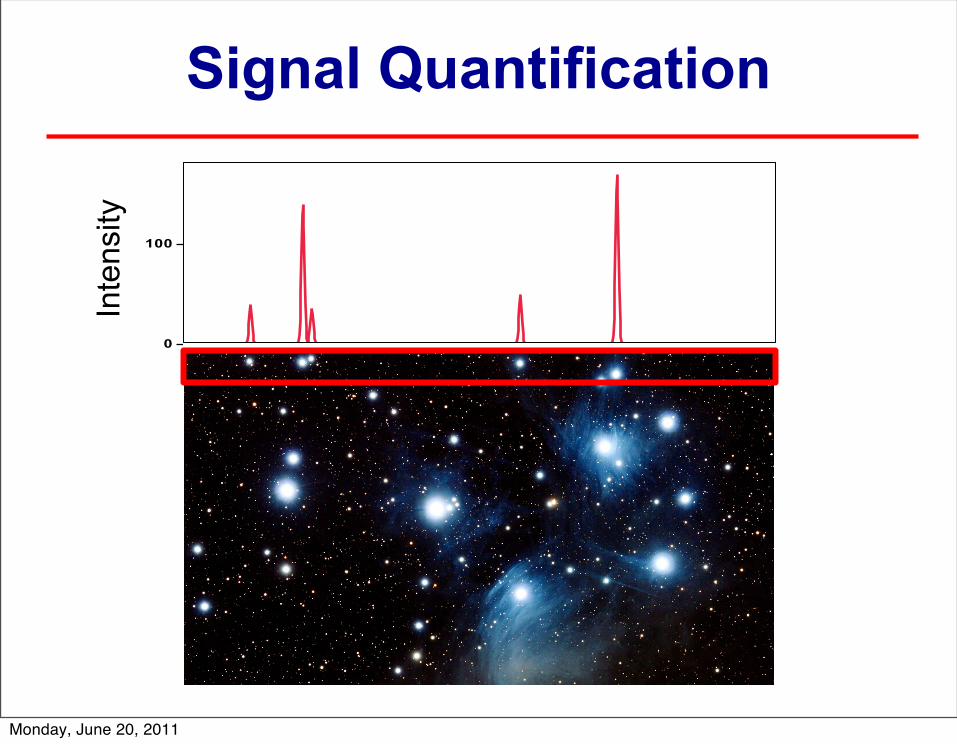
Signal Quantification
0
100
Inte
nsity
Monday, June 20, 2011
0
100
Inte
nsity
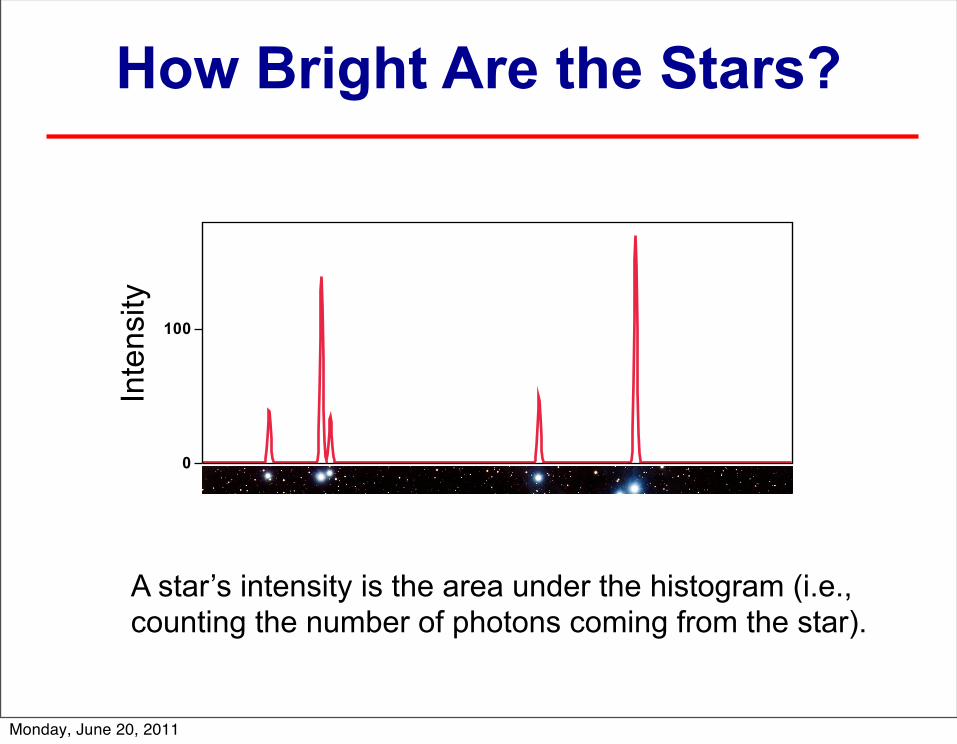
How Bright Are the Stars?
A star’s intensity is the area under the histogram (i.e., counting the number of photons coming from the star).
Monday, June 20, 2011
0
500
1000
1500
YIn
tens
ity
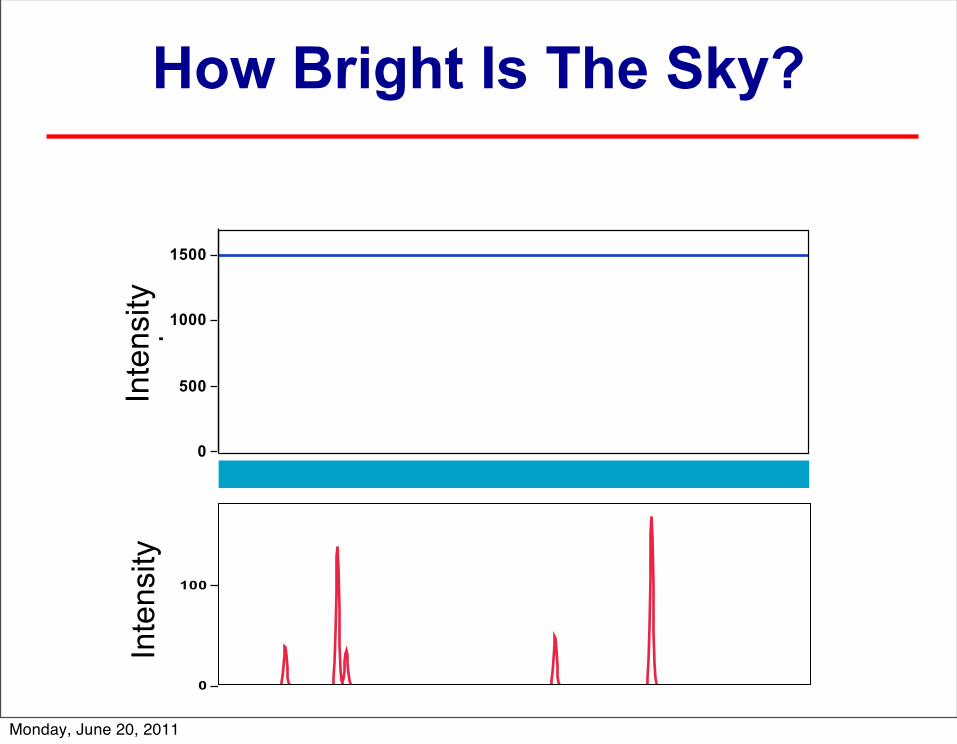
How Bright Is The Sky?
0
100
Inte
nsity
Monday, June 20, 2011
0
500
1000
1500
Inte
nsity
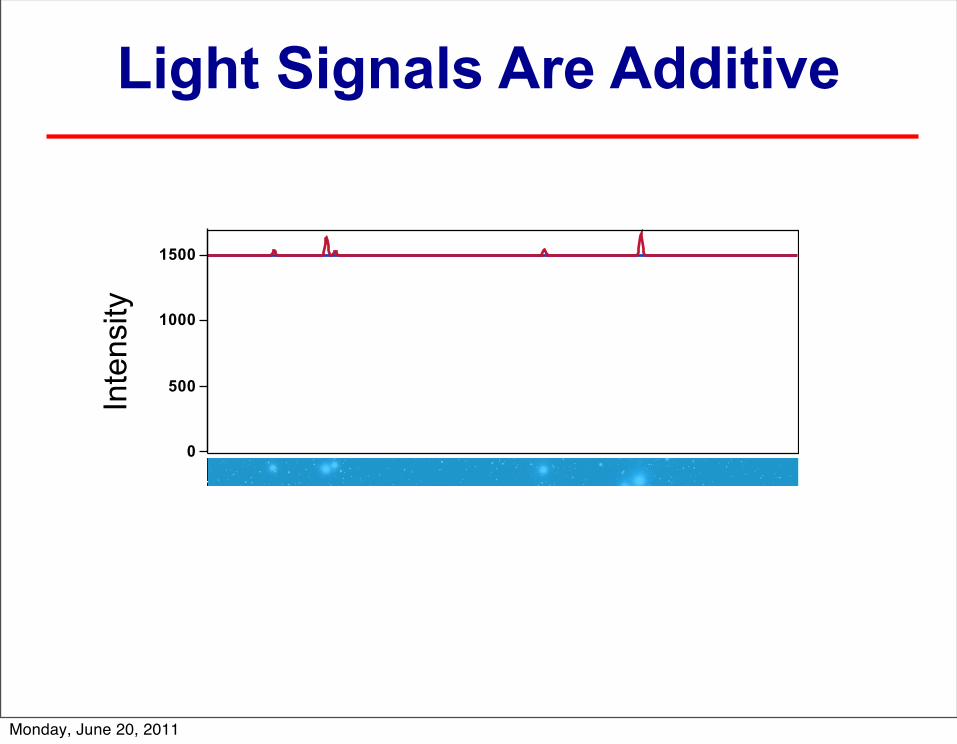
Light Signals Are Additive
Monday, June 20, 2011

1500
1550
1600
1650
1700
Inte
nsity
Star Light Brightness Is Unchanged
We determine the intensity of a star by subtracting the background. Here, the sky (background) is 1500 units, so subtract 1500 units from the measurements.
A star’s intensity is now the area under the histogram (# of photons only from the star)
0
50
100
150
200
Background-subtracted
Intensity
Monday, June 20, 2011
But Measurements Are Not Perfect
Every measurement we make has an error associated with it.
The variance in a measurement is the distribution of values that you would get if you made the same measurement on exactly the same object time and again (and the object did not change over time).
Variances can arise from a variety of sources: e.g., inherent variability, measurement error. The final variance is the sum of all of these.
Measurement error can arise from many sources. When counting photons, for example, the minimum error is governed by Poisson statistics.
Monday, June 20, 2011
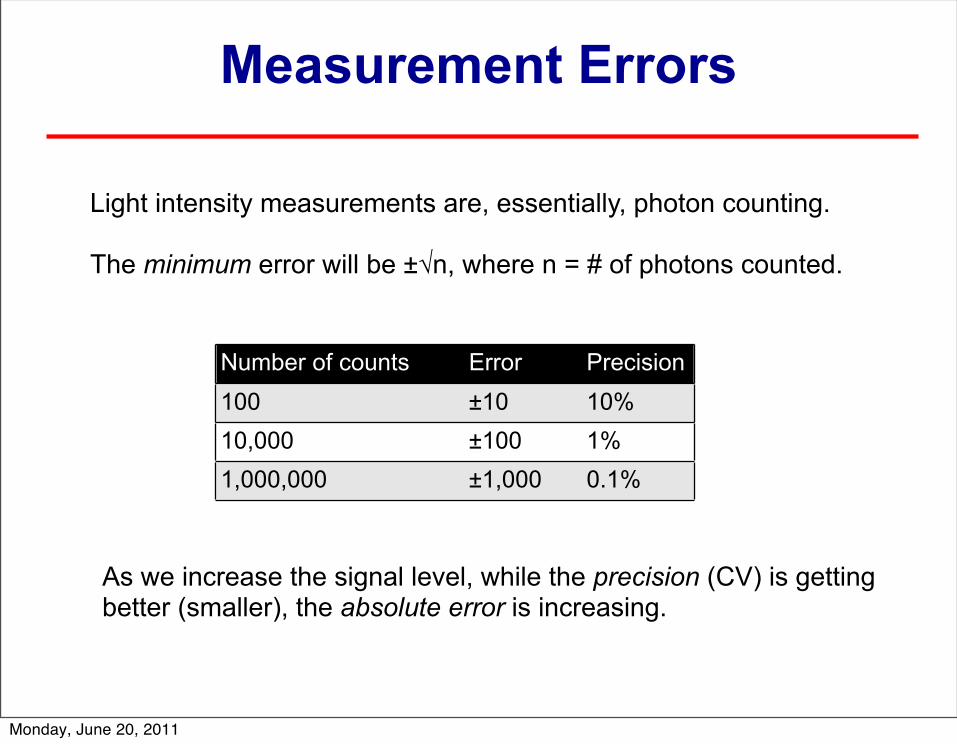
Measurement Errors
Light intensity measurements are, essentially, photon counting.
The minimum error will be ±√n, where n = # of photons counted.
Number of counts Error Precision100 ±10 10%10,000 ±100 1%1,000,000 ±1,000 0.1%
As we increase the signal level, while the precision (CV) is getting better (smaller), the absolute error is increasing.
Monday, June 20, 2011
0
500
1000
1500
Inte
nsity
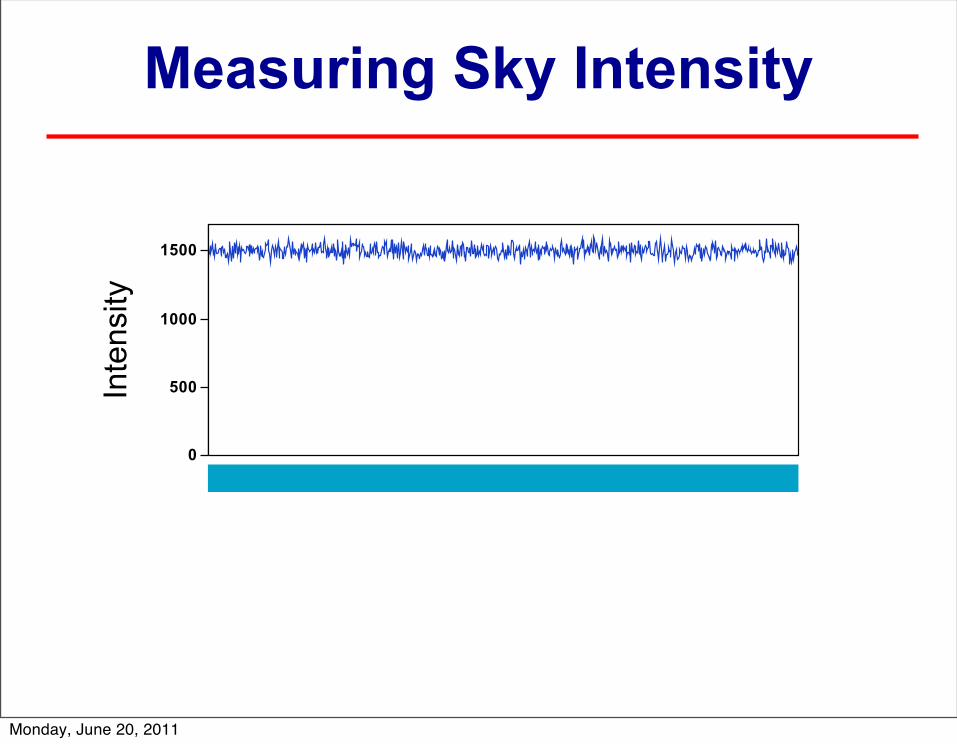
Measuring Sky Intensity
Monday, June 20, 2011

0
500
1000
1500
Inte
nsity
Star Light is Still Additive
Monday, June 20, 2011
1400
1500
1600
Inte
nsity
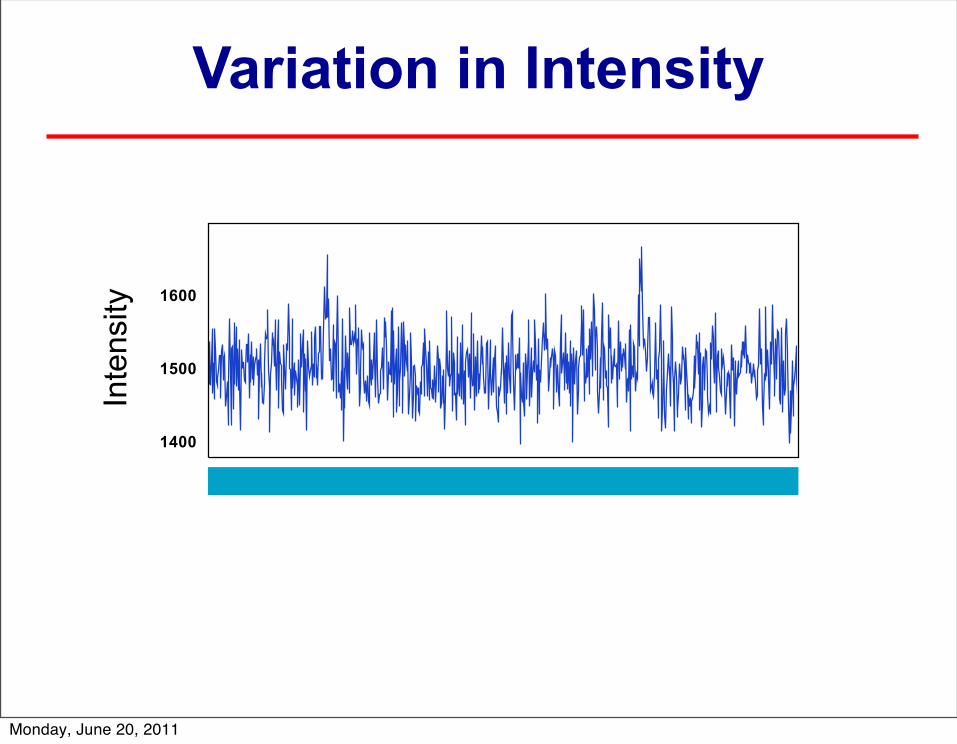
Variation in Intensity
Monday, June 20, 2011
1400
1500
1600
Inte
nsity
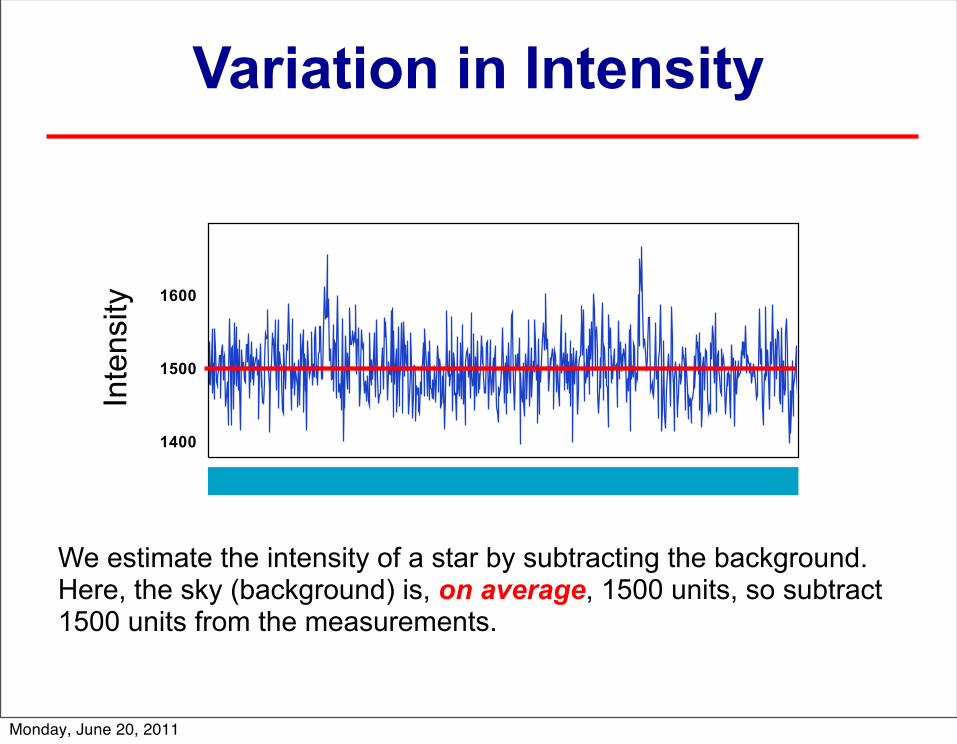
Variation in Intensity
We estimate the intensity of a star by subtracting the background. Here, the sky (background) is, on average, 1500 units, so subtract 1500 units from the measurements.
Monday, June 20, 2011
-100
0
100
Inte
nsity
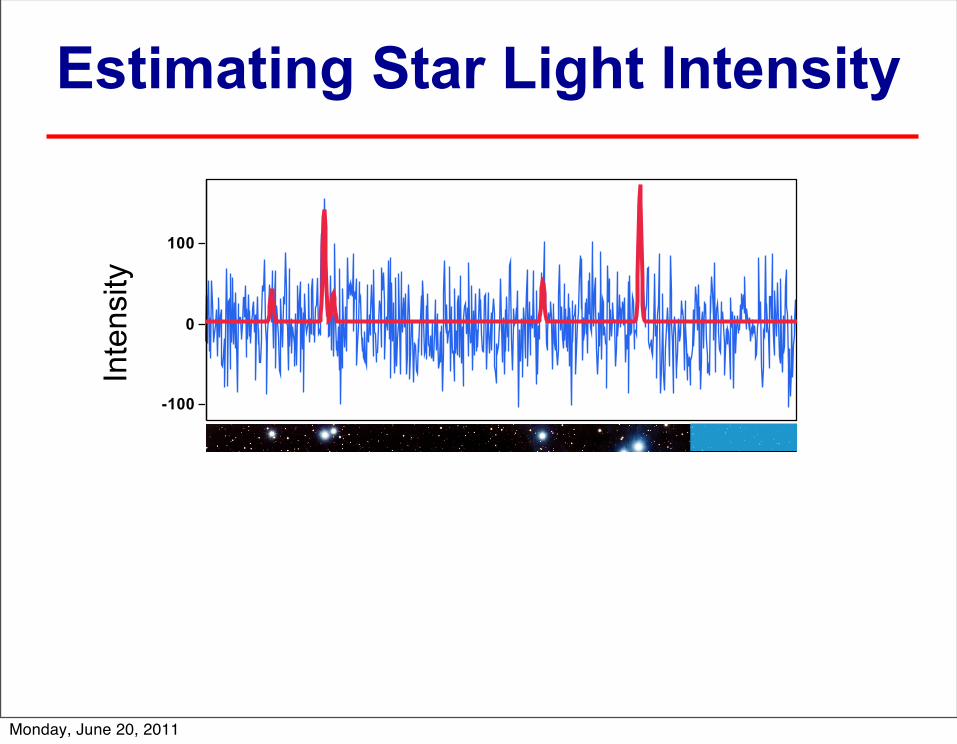
Estimating Star Light Intensity
Monday, June 20, 2011
-100
0
100
Inte
nsity
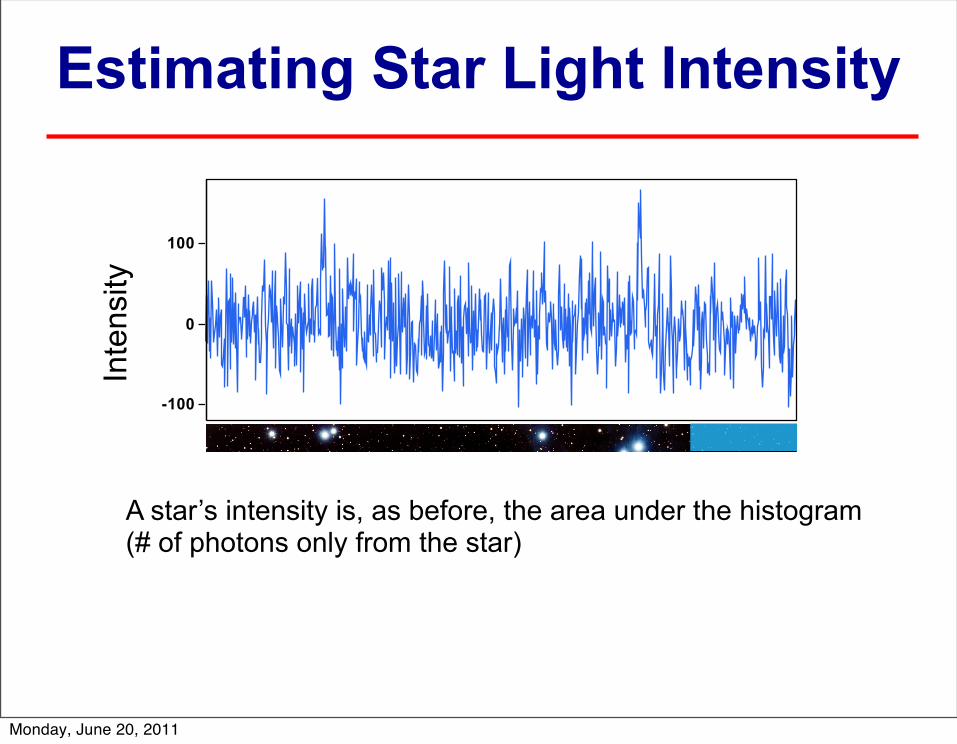
Estimating Star Light Intensity
A star’s intensity is, as before, the area under the histogram (# of photons only from the star)
Monday, June 20, 2011
-100
0
100
-100
0
100
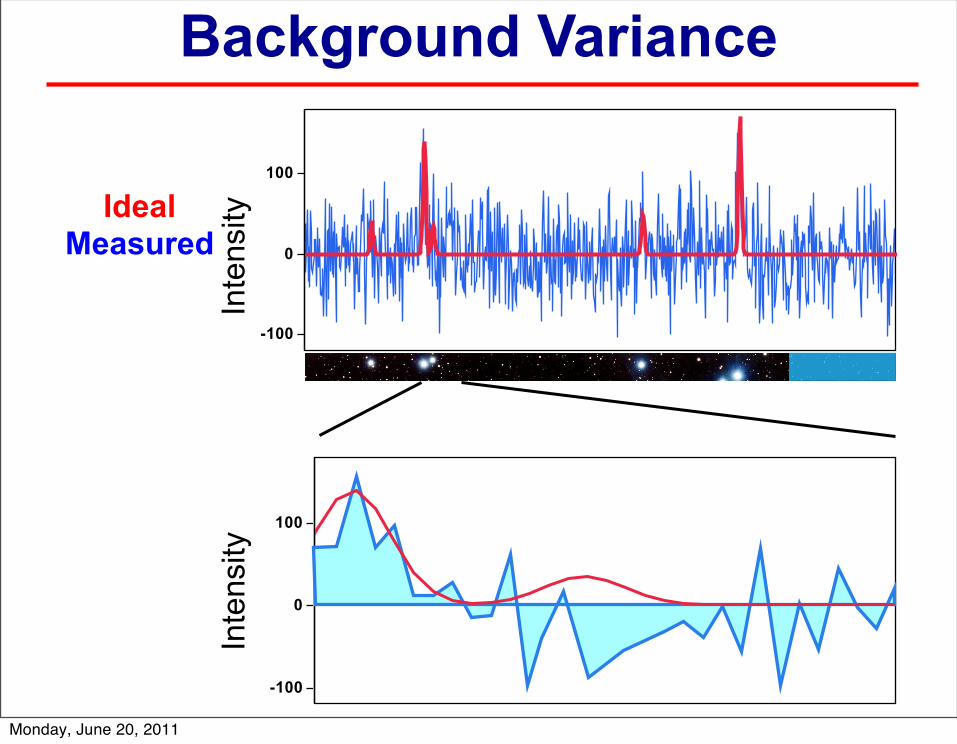
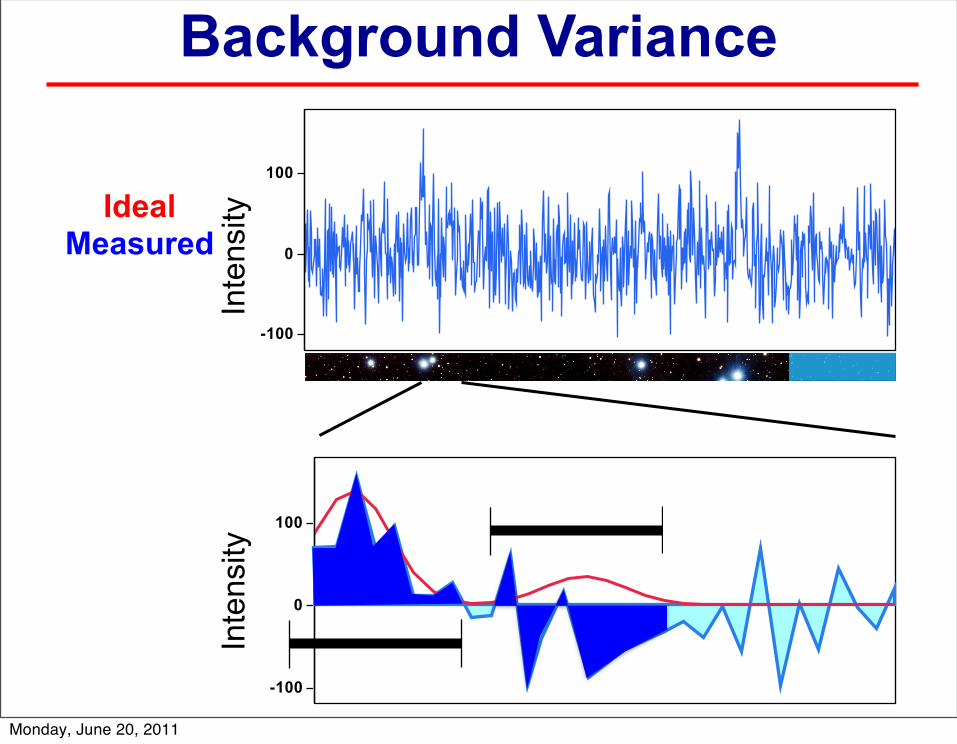
IdealMeasured
Inte
nsity
Inte
nsity
Background Variance
Monday, June 20, 2011
-100
0
100
-100
0
100
IdealMeasured
Inte
nsity
Inte
nsity
Background Variance
Monday, June 20, 2011
-100
0
100
Inte
nsity
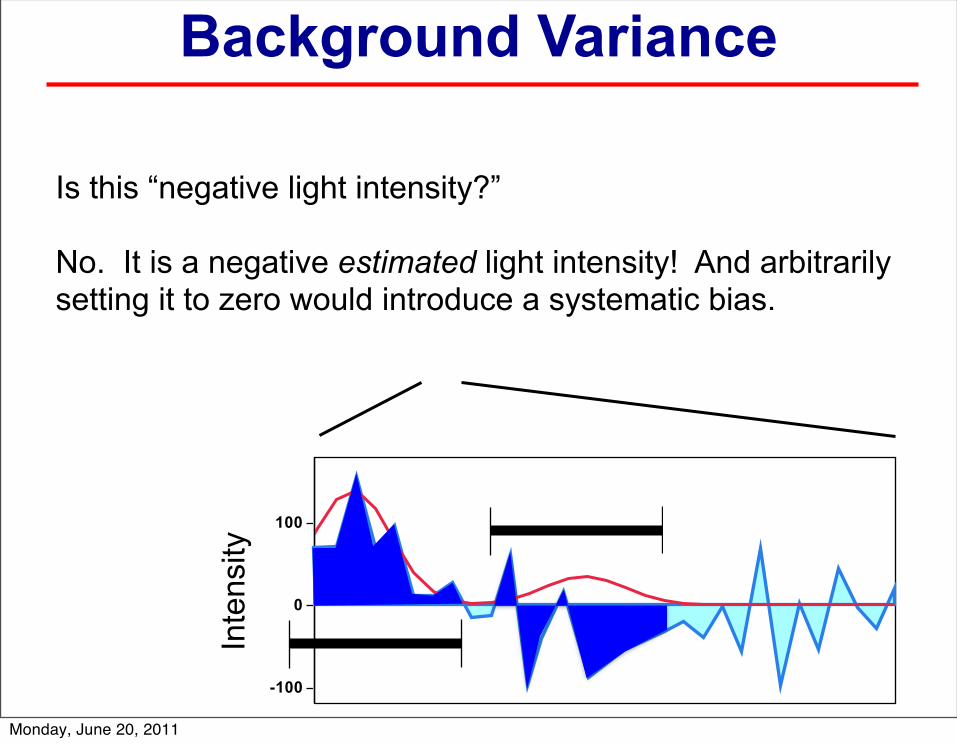
Background Variance
Is this “negative light intensity?”
No. It is a negative estimated light intensity! And arbitrarily setting it to zero would introduce a systematic bias.
Monday, June 20, 2011

Why Can’t We See Stars During the Day?
Because the intensity of the star light is less than the variance of the intensity of the day light.
Stars that are brighter than this variance can still be seen.
The error on estimating the intensity of the star light will be at least as great as the variance of the day light... and can sometimes be <0.
Monday, June 20, 2011
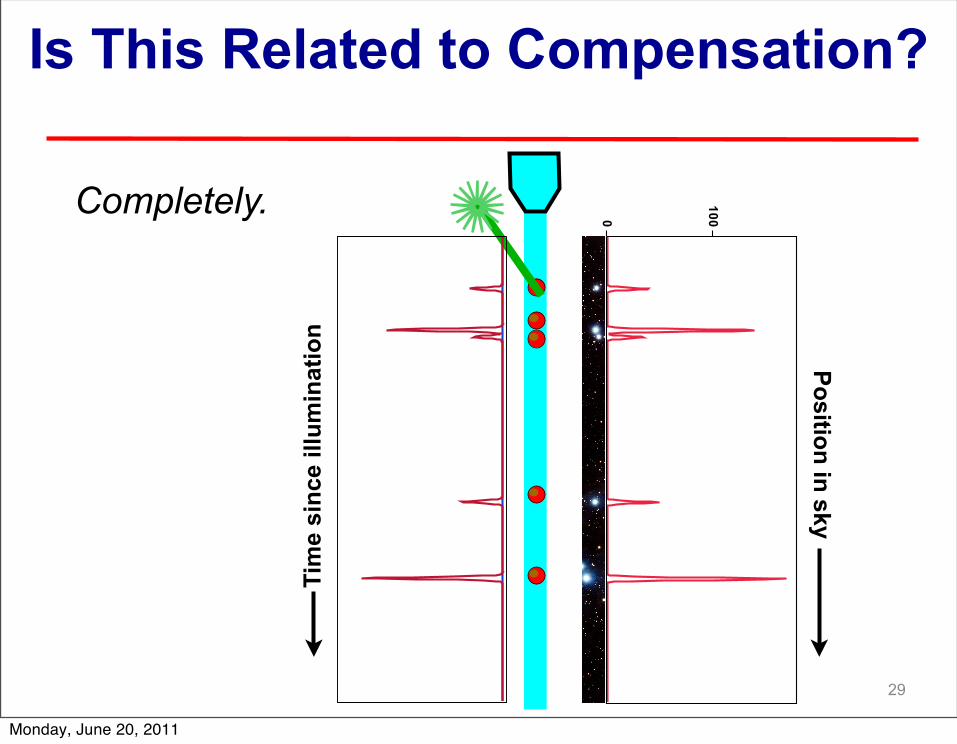
Is This Related to Compensation?
29
Position in sky
0
100
Tim
e si
nce
illum
inat
ion
Completely.
Monday, June 20, 2011
Is This Related to Compensation?
Compensation is the process by which we estimate a probe’s contribution to a signal by subtracting estimated contributions from other sources.
All the same principles apply: errors propagate; you cannot distinguish dim objects against high variance; you can get negative estimated signal intensities.
29
Completely.
Monday, June 20, 2011
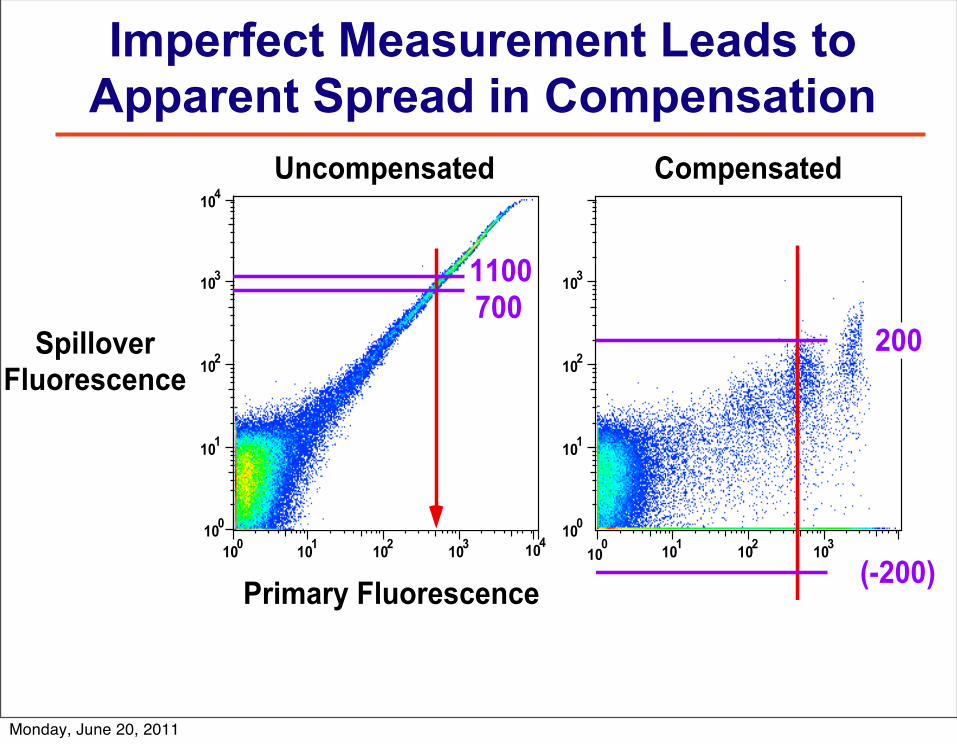
Imperfect Measurement Leads to Apparent Spread in Compensation
100
104
101
102
103
104
SpilloverFluorescence
100
101
102
103
Primary Fluorescence
Uncompensated
100
101
102
103
100
101
102
103
Compensated
700
1100
200
(-200)
Monday, June 20, 2011
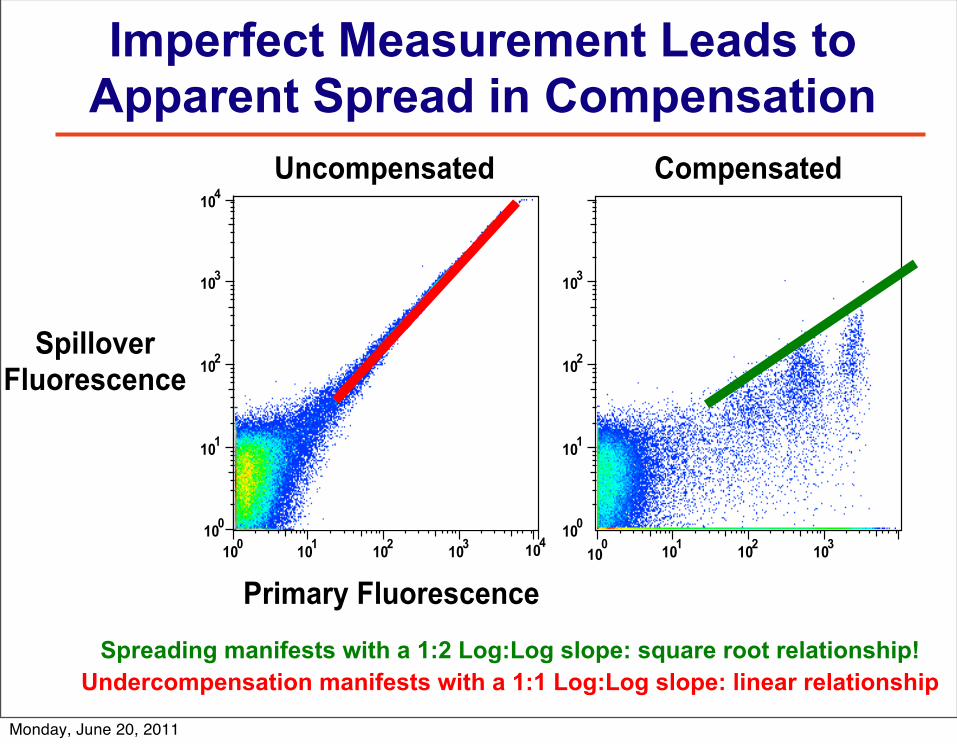
Imperfect Measurement Leads to Apparent Spread in Compensation
100
104
101
102
103
104
SpilloverFluorescence
100
101
102
103
Primary Fluorescence
Uncompensated
100
101
102
103
100
101
102
103
Compensated
Spreading manifests with a 1:2 Log:Log slope: square root relationship!Undercompensation manifests with a 1:1 Log:Log slope: linear relationship
Monday, June 20, 2011
101 102 103 104 105
101
102
103
104
105
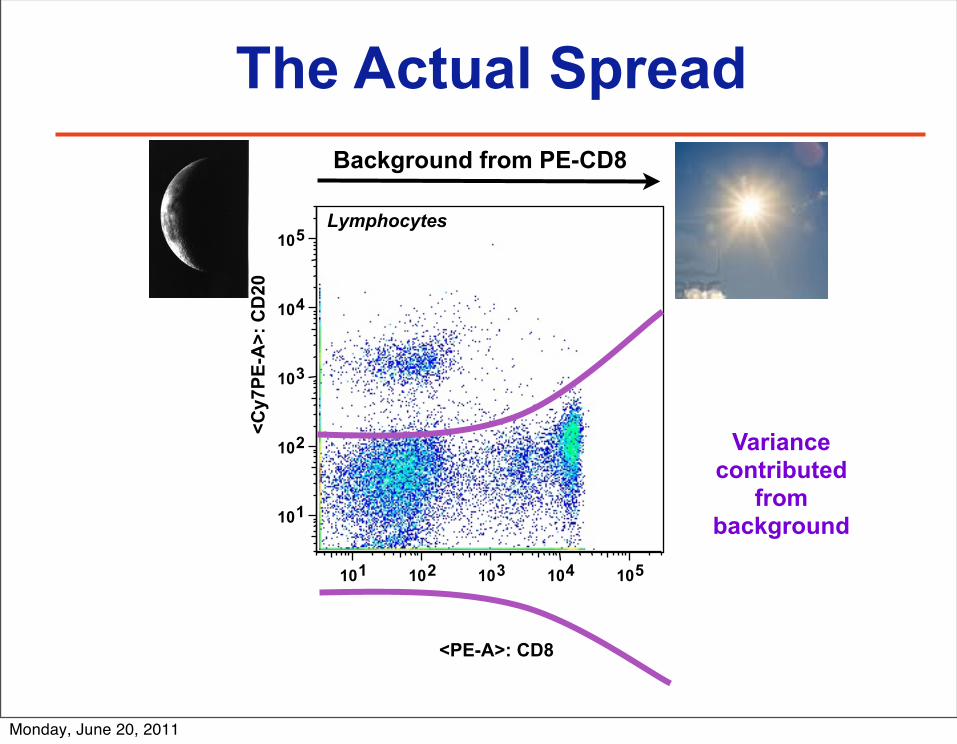
<PE-A>: CD8
<Cy7
PE-A
>: C
D20
Lymphocytes
The Actual SpreadBackground from PE-CD8
Variance contributed
from background
Monday, June 20, 2011
Compensation Does NOT Introduce nor Increase Error:
Compensation Only Reveals It!• The measurement error is already present.
Compensation does not increase this error, it does not change it, it does not introduce any more error.
• Compensation simply makes the error more apparent by shifting it to the low end of the log-scale.
• Staining controls are necessary to define gate placement!
Monday, June 20, 2011
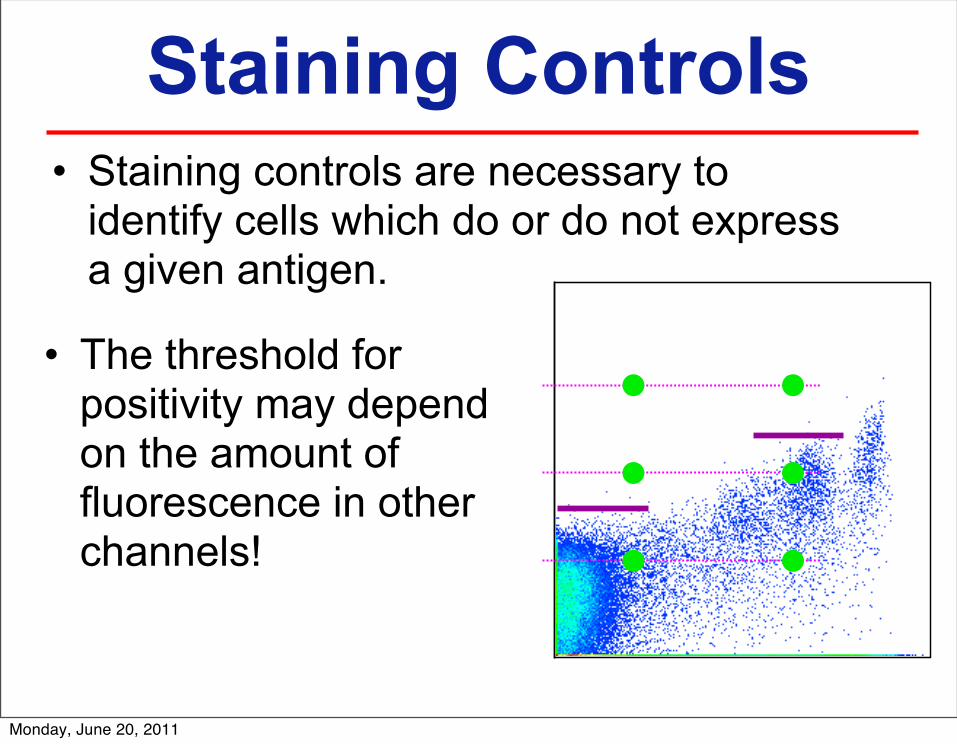
Staining Controls• Staining controls are necessary to
identify cells which do or do not express a given antigen.
• The threshold for positivity may depend on the amount of fluorescence in other channels!
Monday, June 20, 2011
FMO Controls
• FMO controls are a much better way to identify positive vs. negative cells
• FMO controls can also help identify problems in compensation that are not immediately visible
• FMO controls should be used whenever accurate discrimination is essential or when antigen expression is relatively low
Monday, June 20, 2011
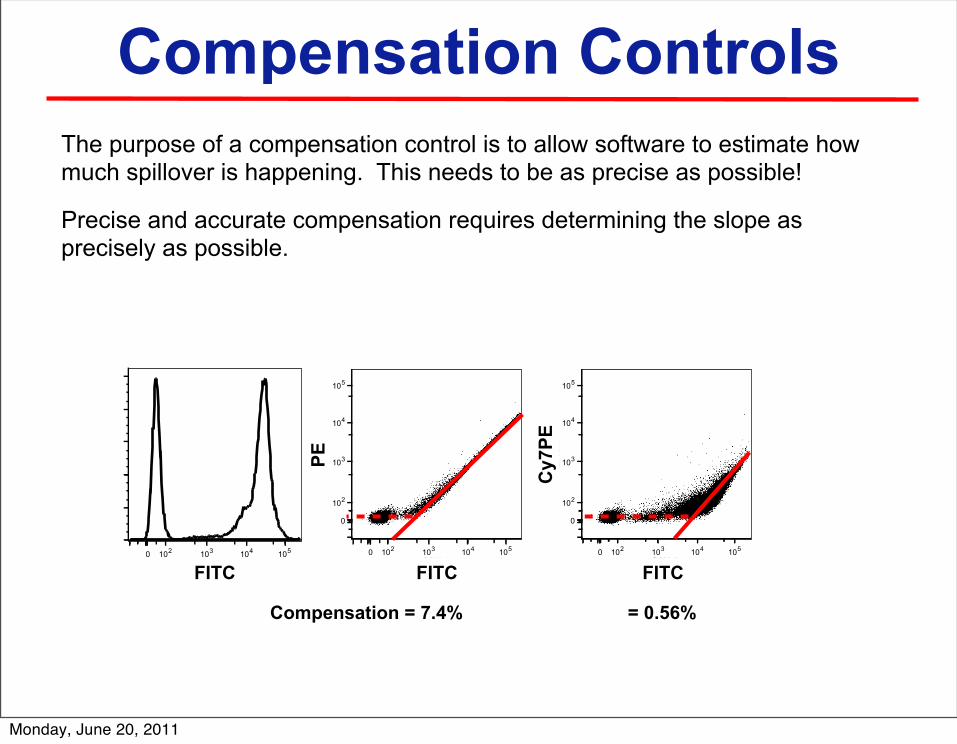
Compensation ControlsThe purpose of a compensation control is to allow software to estimate how much spillover is happening. This needs to be as precise as possible!
0 102 103 104 105B530-A
0 102 103 104 105B530-A
0
102
103
104
105
B710-A
0 102 103 104 105B530-A
0
102
103
104
105
B560-A
Compensation = 7.4% = 0.56%
FITC FITC FITC
PE
Cy7
PE
Precise and accurate compensation requires determining the slope as precisely as possible.
Monday, June 20, 2011
0 102 103 104 105 0 102 103 104 105
0
102
103
104
105
0 102 103 104 105
0
102
103
104
105
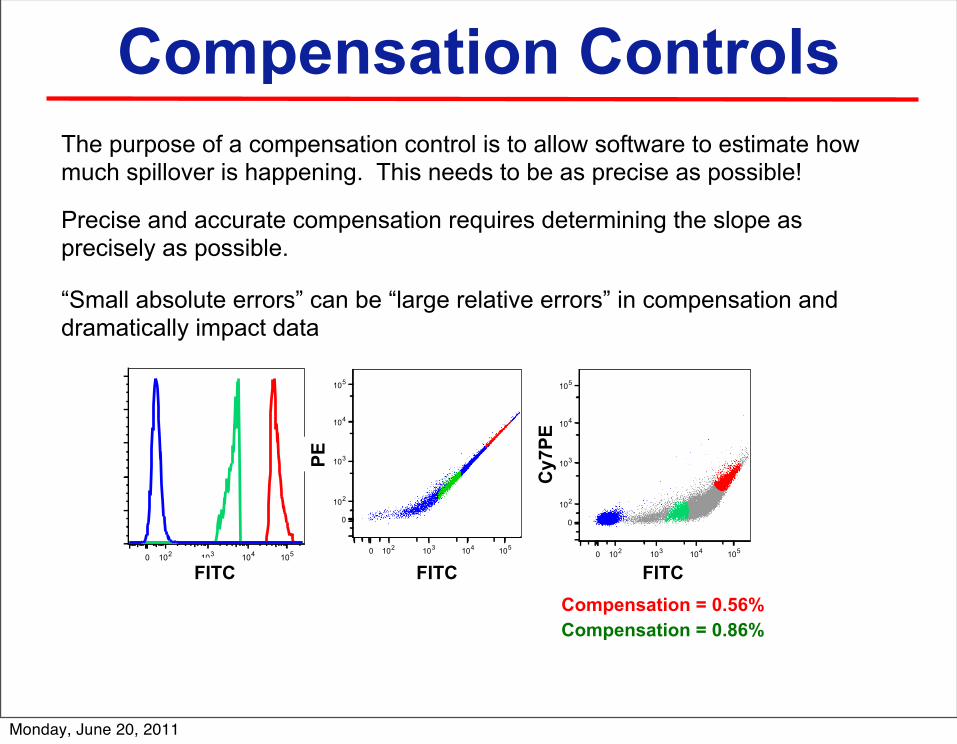
Compensation ControlsThe purpose of a compensation control is to allow software to estimate how much spillover is happening. This needs to be as precise as possible!
FITC FITC FITC
PE
Cy7
PE
Precise and accurate compensation requires determining the slope as precisely as possible.
Compensation = 0.56%Compensation = 0.86%
“Small absolute errors” can be “large relative errors” in compensation and dramatically impact data
Monday, June 20, 2011
Compensation ControlsThere are only three rules to follow to ensure accurate compensation. All errors in compensation can be traced to a problem with one of these.
1. The experimental samples and control samples must be matched.• Identical fluorochrome• Identical instrument sensitivity (not settings)
2. The background (autofluorescence) for any given control’s positive and negative events must be identical.
3. Each control’s positive must be at least as bright as any experimental sample.
To ensure precise compensation, collect enough events to precisely estimate median fluorescences in all channels: Beads: 5-10K Positive cells: 20-50K
Monday, June 20, 2011