Embed Size (px)
Citation preview

Boolean Networks and Boolean Networks and Experiment DesignExperiment Design
B-Cell Single Ligand ScreenB-Cell Single Ligand Screen
Stuart JohnsonBioinformatics and Data Analysis
LabUCSD

Outline
• Why Boolean networks? • Building/Displaying Boolean
Networks• Experiment design• Procedure• Some competing (sub)networks
from the B-Cell data• Conclusions

Why try Boolean
Networks?
Data•noisy•partial sampling
ModelBiochemical
system•lots of complexity•predictive •lots of meaning
doableforward
problem
very difficultinverse
problem
Why try Boolean
Networks?
Boolean data
Boolean networks•some complexity•predictive (exp. design)•data-like•meaning? consistency = causality; should tell us about connectivity
easy
easy

Boolean data
Exp
eri
men
tal co
nd
itio
ns
TIME
P-P,2nd Msg
red=1at 99%confidence:P(d=NC)<.01
blue=0everythingelse
2nd msg / co-sampled Ca

Boolean data
Exp
eri
men
tal co
nd
itio
ns
TIME
P-P,2nd Msg
red=1at 99%confidence:P(d=NC)<.01
blue=0everythingelse
Phosphoproteins

Boolean data
Exp
eri
men
tal co
nd
itio
ns
TIME
P-P,2nd Msg
late resp.
Ca -> PP
early resp.
Ca,cAMP -> No PP
groups ofsiml. resp.

Boolean data
Exp
eri
men
tal co
nd
itio
ns
TIME
P-P,2nd Msg
Node=Full column of data; all exp. cond.

Known ligand/ receptor interactions from AfCS ligand descriptions
Inputs, etc.E
xp
eri
men
tal C
on
dit
ion
sGq
Single ligand screen inputs

? ExtractingpatternsCa (.5 min)
ELC
LPA
AIG
Exp
eri
men
tal C
on
dit
ion
sconsistent?

Graph
Time
Exp
eri
men
tal C
on
dit
ion
sdisplaying
and encodingpatterns
LPA0
Ca0.5
ER12.5
0 0 0
1 0 ?
0 1 1
1 1 0
TruthTable
ERK1 (2.5 min)

all hypotheses:ER1(2.5 min)
H1,H2 & H3: Early calcium is associated with ER1
H1: LPA is special (causes an early Ca signal but no ER1)
H2: M3A is special (0.5 min Ca, no 1 min Ca, but ER1)
H3: no special ligands, ER1 consistent with Ca & cAMP
H1 H2
H3

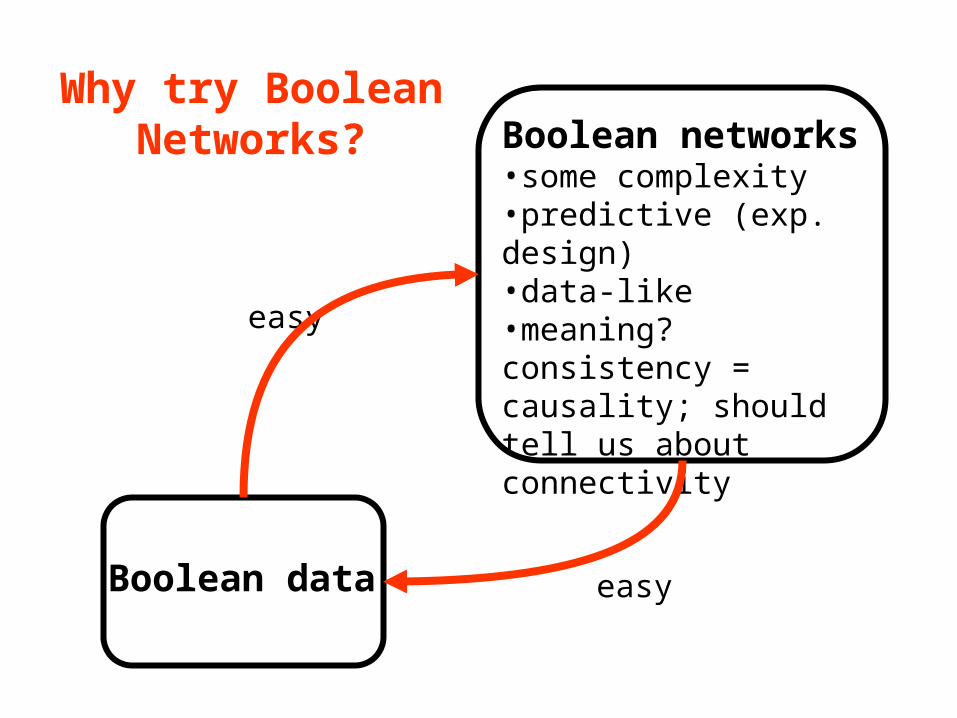
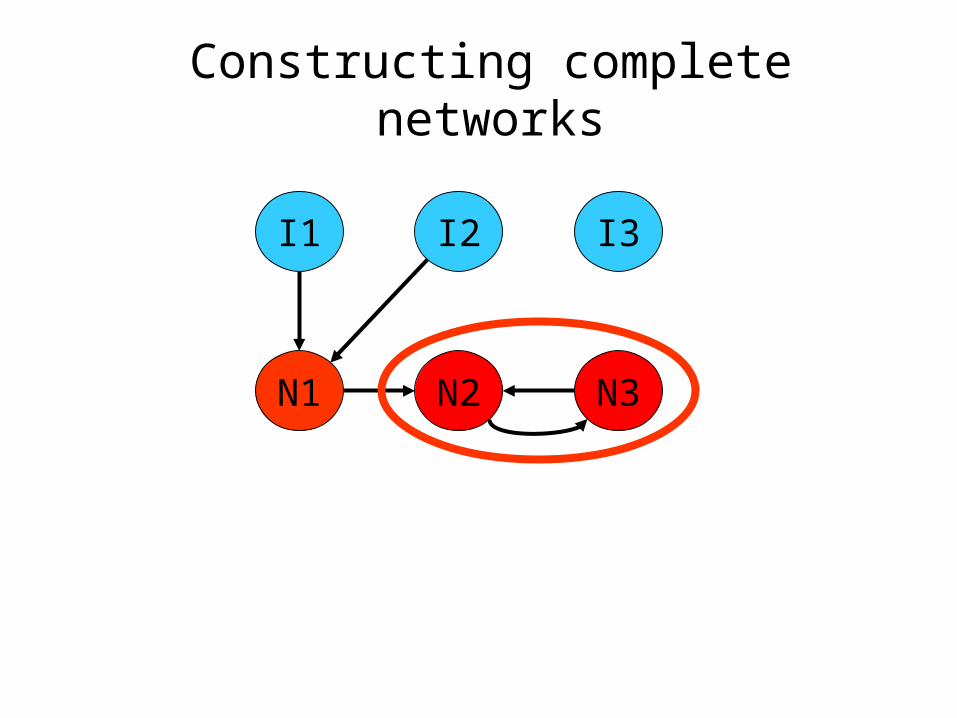
Constructing complete networks
I1 I2 I3
N1 N2 N3
5 7 3 = 105networksmaximum
x x
Input nodes
nodes with truth tables

Constructing complete networks
I1 I2 I3
N1 N2 N3
Constructing complete networks
I1 I2 I3
N1 N2 N3

Constructing complete networks
I1 I2 I3
N1 N2 N3
•“Feedback” not allowed! a completely determined network can have multiple output states; forward and inverse problems no longer “easy”

Experiment Design: networks reproduceresults of completed experiments
1 output state
All networks: 1 possible output state:
•For known inputs, every network simply reproduces results of completed experiments
•(Information) Entropy = score = 0

Experiment Design: networks are predictive
3 output states
All networks: multiple possible output states:
•these multiple states correspond to unknown entries (?) in truth tables and the
different connectivity of the networks
•Entropy = score > 0

Dual-ligand experiment design
ligand 2
ligan
d 1
en
trop
y s
core

Dual-ligand experiment design
ligand 2
ligan
d 1
en
trop
y s
core
ELC + LPA

Procedure
BuildBoolean Networks
Do Experiments
DisplayBoolean
Networks
Score classof experiments
pick highest scoring exp.

Controlling Complexity: Constraint Graphs
• Graphs specify allowable inputs and hops
RCP
LIG
2M
PP
LIG
2M
PP
LIG
2M
PP
PP
1
RCP
LIG
2M
PP
PP
1

• Graphs specify allowable inputs and hops
RCP
LIG
2M
PP
LIG
2M
PP
LIG
2M
PP
PP
1
RCP
LIG
2M
PP
PP
1
Controlling Complexity: Constraint Graphs

RCP
LIG
2M
PP
PP1
Network display
All node rules
Can filter/cluster/display these rules to see:
•ligand classification (chemokines, cytokines, etc)
•clusters of similar control patterns
•etc. - “pathways”

LIG
2M
PP
Early Calcium
vs ...
Early Calcium+ cAMP

ER1 -> ER2,P90
LIG
2M
PP
PP1
P90 -> AKT
ST6 -> ST3

RCP
LIG
2M
PP
Early Ca & Gqcontrol vs ...
Early Ca& G12

Conclusions• This is a general method/implementation and
will extend to the RAW screens and FXM in some form
• Boolean network analysis has many interesting features:– learns from experiments/proposes new exp.– formalizes inclusion of known information as either
constraint graphs or hidden nodes– caveat 1: the BN have encoded any real meaning– caveat 2: you can control complexity and digest the
networks inferred
• http://dev.afcs.org:12057/ for the latest results, navigable/clickable networks and more background