Embed Size (px)
Citation preview
Seventh Annual Update on the RetirementPreparedness of the Boomer Generation
Boomer Expectations for Retirement 2017
About the Insured Retirement Institute
The Insured Retirement Institute (IRI) is the leading association for the retirement income industry. IRI proudly leads a national consumer coalition of more than 30 organizations, and is the only association that represents the entire supply chain of insured retirement strategies. IRI members are the major insurers, asset managers, broker-dealers/distributors, and 150,000 financial professionals. As a not-for-profit organization, IRI provides an objective forum for communication and education, and advocates for the sustainable retirement solutions Americans need to help achieve a secure and dignified retirement. Learn more at www.irionline.org.
©2017 IRI
All rights reserved. No part of this report may be reprinted or reproduced in any form or used for any purpose other than educational without the express written consent of IRI.
OVERVIEW
The annual IRI report on the Baby Boomers was first published in 2011, the year the leading
edge of the Boomer generation began to turn 65. Since that time, the number of Americans
over age 65 has risen over 18 percent, from 40.3 million in 2010 to 47.8 million in 2015, or
14.9 percent of the population, due in no small part to the aging of a generation more than
76 million strong.1 Over the seven years since that first report, as Boomers have aged, the
survey population has changed to reflect their income, employment status, confidence and
life satisfaction, and retirement expectations and concerns. The risks identified in the first
report remain the same today: Boomers are under-saved, under-planned, have unrealistic
expectations, and have an inadequate understanding of the risks they will face in retirement.
Fortunately there is help for those who seek it, and both their own self-assessments and
empirical evidence show that professional assistance improves retirement readiness.
4 Boomers Expectations for Retirement 2017
KEY FINDINGS• Only 54 percent of Boomers have retirement savings, the lowest recorded in the seven years of the Boomer report.
• Almost one-third of Boomers think they will need annual income between $45,000 and $75,000 during retirement, in today’s dollars.
• Sixty percent of Boomers expect Social Security to be a major source of income, the highest recorded in the seven years of the Boomer report.
• Contributing to the low savings rate, only four in 10 Boomers have tried to calculate how much they need to save to retire, and of these, only six in 10 included estimates of health care costs in their calculations.
• Only 23 percent of Boomers believe they will have enough money to last throughout retirement, and that they have done a good job preparing for retirement.
• Eighty-two percent of Boomers underestimate the percentage of their income that may be required to pay for health care.
• While only eight percent of Boomers would use a portion of the balance in their employer-provided defined contribution plan to purchase an annuity, 85 percent say it is somewhat or very important to have a source of guaranteed lifetime income other than Social Security.
• Forty-seven percent of Boomers are satisfied with how their lives are going, up from 43 percent last year.
• Sixty percent of Boomers believe their financial situation will be the same or better five years from now.
• Six in 10 Boomers believe their retirement income will be sufficient to cover basic expenses, and afford them at least some budget for travel and leisure.
• The top concern of Boomers if they live into their 80s is Social Security, with seven in 10 worried about changes to Social Security that may negatively impact their income.
• More than seven in 10 Boomers believe they can subsist solely on Social Security if they run out of money during retirement.
• One-third of Boomers with retirement savings have saved $250,000 or more.
• At current savings levels, most Boomers with savings face a potential annual retirement income gap of between $3,864 and $12,072.
• Ninety-one percent of Boomers who work with financial professionals have savings, versus only 41 percent of those who do not.
• Seventy-five percent of Boomers who work with financial professionals have saved more than $100,000, versus only 49 percent of those who do not.
• Fifty-two percent of Boomers have not taken any action regarding their defined contribution plans.
• Four in 10 Boomers believe that selecting investment and insurance products, creating a financial plan for retirement, and planning for health care and long-term care require the help of a financial professional.
• Eighty-five percent of Boomers believe they are better prepared for retirement because of the work of their financial planner, and that their planner works in their best interest.
• More than seven in 10 Boomers believe that the compensation their financial advisor receives is fair.
5Boomers Expectations for Retirement 2017
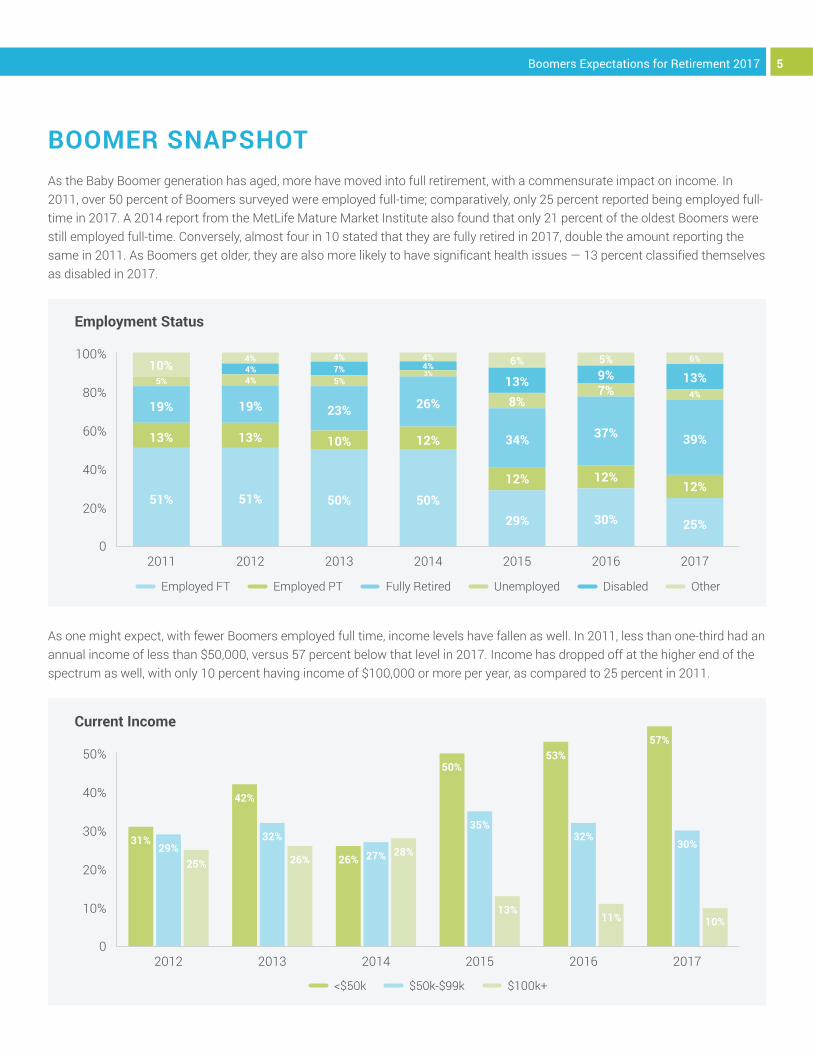
BOOMER SNAPSHOTAs the Baby Boomer generation has aged, more have moved into full retirement, with a commensurate impact on income. In 2011, over 50 percent of Boomers surveyed were employed full-time; comparatively, only 25 percent reported being employed full-time in 2017. A 2014 report from the MetLife Mature Market Institute also found that only 21 percent of the oldest Boomers were still employed full-time. Conversely, almost four in 10 stated that they are fully retired in 2017, double the amount reporting the same in 2011. As Boomers get older, they are also more likely to have significant health issues — 13 percent classified themselves as disabled in 2017.
As one might expect, with fewer Boomers employed full time, income levels have fallen as well. In 2011, less than one-third had an annual income of less than $50,000, versus 57 percent below that level in 2017. Income has dropped off at the higher end of the spectrum as well, with only 10 percent having income of $100,000 or more per year, as compared to 25 percent in 2011.
Employment Status
0
20%
40%
60%
80%
100%
2011 2012 2013 2014 2015 2016 2017
51%
13%
19%
10%5%
51%
13%
19%
4%4%4%
50%
10%
23%
5%7%4%
50%
12%
26%
3%4%4%
29%
12%
34%
8%13%
6%
30%
12%
37%
7%9%5%
25%
12%
39%
4%
6%
Employed FT Employed PT Fully Retired Unemployed Disabled Other
13%
Current Income
0
10%
20%
30%
40%
50%
2012 2013 2014 2015 2016 2017
<$50k $50k-$99k $100k+
31%29%
25%
42%
32%
26% 26% 27% 28%
50%
35%
13%
53%
32%
11%
57%
30%
10%
6 Boomers Expectations for Retirement 2017
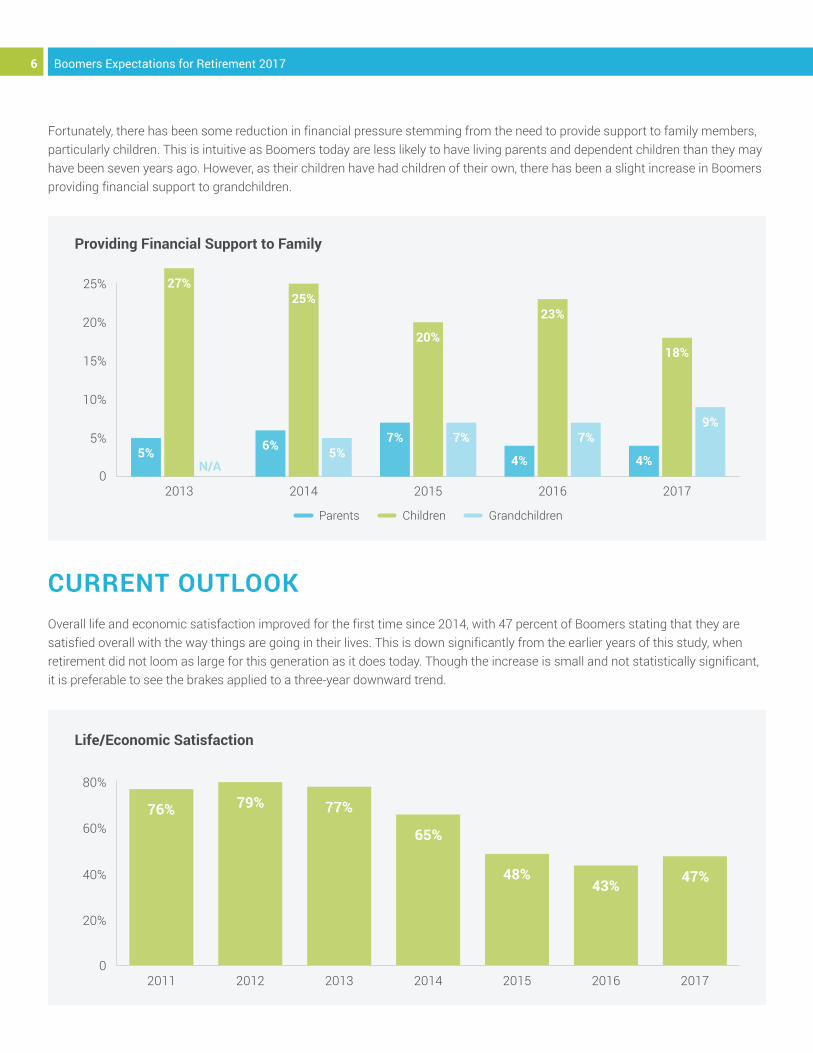
Fortunately, there has been some reduction in financial pressure stemming from the need to provide support to family members, particularly children. This is intuitive as Boomers today are less likely to have living parents and dependent children than they may have been seven years ago. However, as their children have had children of their own, there has been a slight increase in Boomers providing financial support to grandchildren.
CURRENT OUTLOOKOverall life and economic satisfaction improved for the first time since 2014, with 47 percent of Boomers stating that they are satisfied overall with the way things are going in their lives. This is down significantly from the earlier years of this study, when retirement did not loom as large for this generation as it does today. Though the increase is small and not statistically significant, it is preferable to see the brakes applied to a three-year downward trend.
Providing Financial Support to Family
0
5%
10%
15%
20%
25%
2013 2014 2015 2016 2017
Parents Children Grandchildren
5%
27%
6%
25%
5%7%
20%
7%
4%
23%
7%
4%
18%
9%
N/A
Life/Economic Satisfaction
0
20%
40%
60%
80%
2011 2012 2013 2014 2015 2016 2017
76% 79% 77%
65%
48%43% 47%
7Boomers Expectations for Retirement 2017
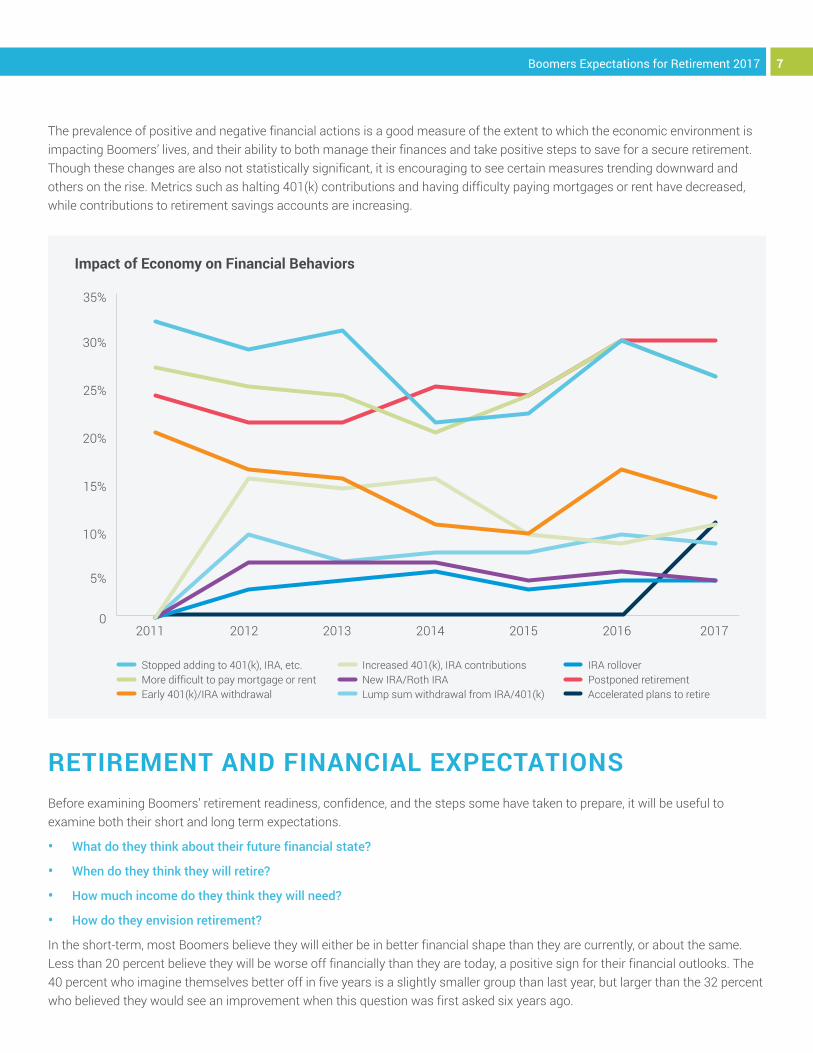
The prevalence of positive and negative financial actions is a good measure of the extent to which the economic environment is impacting Boomers’ lives, and their ability to both manage their finances and take positive steps to save for a secure retirement. Though these changes are also not statistically significant, it is encouraging to see certain measures trending downward and others on the rise. Metrics such as halting 401(k) contributions and having difficulty paying mortgages or rent have decreased, while contributions to retirement savings accounts are increasing.
RETIREMENT AND FINANCIAL EXPECTATIONSBefore examining Boomers’ retirement readiness, confidence, and the steps some have taken to prepare, it will be useful to examine both their short and long term expectations.
• What do they think about their future financial state?
• When do they think they will retire?
• How much income do they think they will need?
• How do they envision retirement?
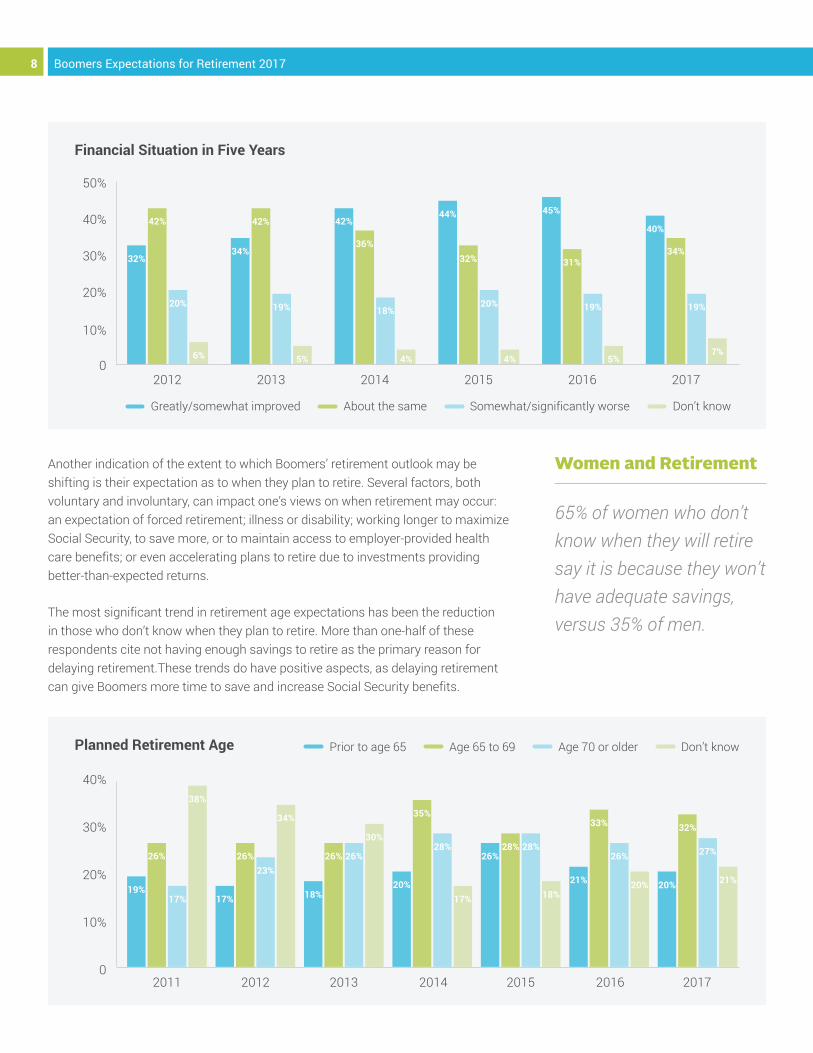
In the short-term, most Boomers believe they will either be in better financial shape than they are currently, or about the same. Less than 20 percent believe they will be worse off financially than they are today, a positive sign for their financial outlooks. The 40 percent who imagine themselves better off in five years is a slightly smaller group than last year, but larger than the 32 percent who believed they would see an improvement when this question was first asked six years ago.
Impact of Economy on Financial Behaviors
0
5%
10%
15%
20%
25%
2011 2012 2013 2014 2015
30%
IRA rollover Postponed retirement Accelerated plans to retire
2016 2017
35%
Stopped adding to 401(k), IRA, etc. More difficult to pay mortgage or rent Early 401(k)/IRA withdrawal
Increased 401(k), IRA contributions New IRA/Roth IRA Lump sum withdrawal from IRA/401(k)
8 Boomers Expectations for Retirement 2017
Another indication of the extent to which Boomers’ retirement outlook may be shifting is their expectation as to when they plan to retire. Several factors, both voluntary and involuntary, can impact one’s views on when retirement may occur: an expectation of forced retirement; illness or disability; working longer to maximize Social Security, to save more, or to maintain access to employer-provided health care benefits; or even accelerating plans to retire due to investments providing better-than-expected returns.
The most significant trend in retirement age expectations has been the reduction in those who don’t know when they plan to retire. More than one-half of these respondents cite not having enough savings to retire as the primary reason for delaying retirement.These trends do have positive aspects, as delaying retirement can give Boomers more time to save and increase Social Security benefits.
Women and Retirement
65% of women who don’t know when they will retire say it is because they won’t have adequate savings, versus 35% of men.
Financial Situation in Five Years
0
10%
20%
30%
40%
50%
2012 2013 2014 2015 2016
Greatly/somewhat improved About the same Somewhat/significantly worse Don’t know
Planned Retirement Age
0
10%
20%
2011 2012 2013 2014 2015
Prior to age 65 Age 65 to 69 Age 70 or older Don’t know
2017
30%
40%
2016 2017
32%
42%
20%
6%
34%
42%
19%
5%
42%
36%
18%
4%
44%
32%
20%
4%
45%
31%
19%
5%
40%
34%
19%
7%
19%
26%
17%
38%
17%
26%23%
34%
18%
26% 26%
30%
20%
35%
28%
17%
26%28% 28%
18%21%
33%
26%
20% 20%
32%
27%
21%
9Boomers Expectations for Retirement 2017
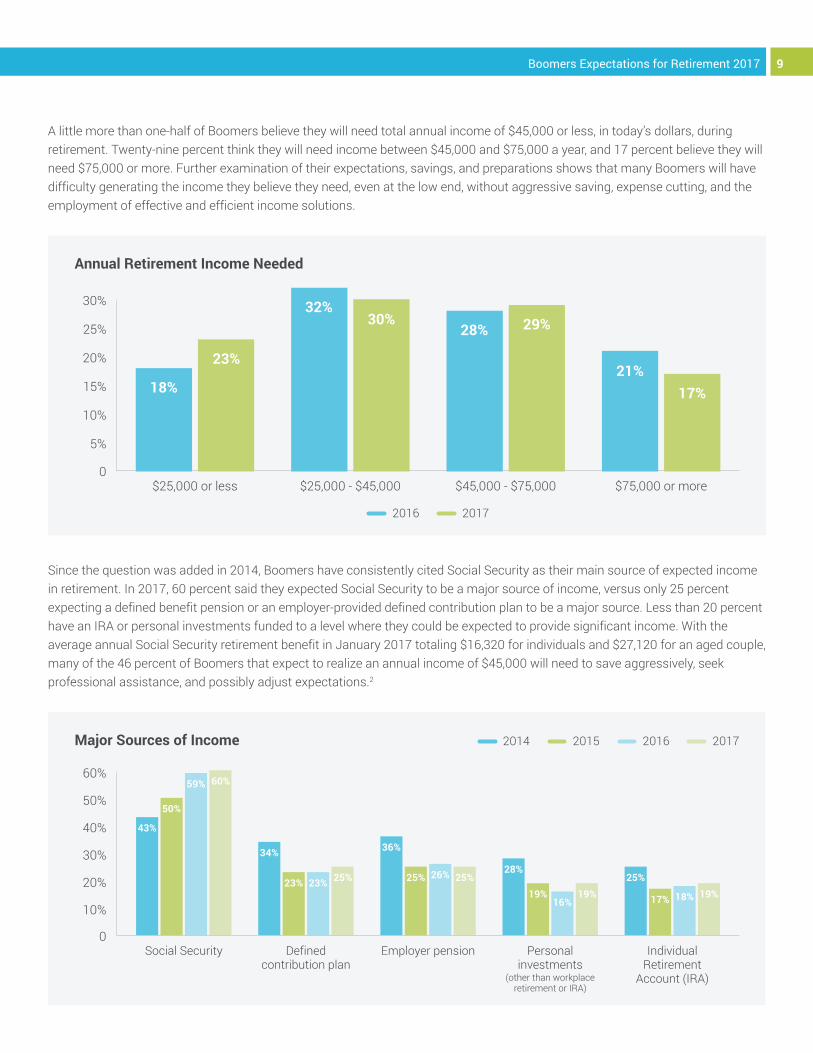
A little more than one-half of Boomers believe they will need total annual income of $45,000 or less, in today’s dollars, during retirement. Twenty-nine percent think they will need income between $45,000 and $75,000 a year, and 17 percent believe they will need $75,000 or more. Further examination of their expectations, savings, and preparations shows that many Boomers will have difficulty generating the income they believe they need, even at the low end, without aggressive saving, expense cutting, and the employment of effective and efficient income solutions.
Since the question was added in 2014, Boomers have consistently cited Social Security as their main source of expected income in retirement. In 2017, 60 percent said they expected Social Security to be a major source of income, versus only 25 percent expecting a defined benefit pension or an employer-provided defined contribution plan to be a major source. Less than 20 percent have an IRA or personal investments funded to a level where they could be expected to provide significant income. With the average annual Social Security retirement benefit in January 2017 totaling $16,320 for individuals and $27,120 for an aged couple, many of the 46 percent of Boomers that expect to realize an annual income of $45,000 will need to save aggressively, seek professional assistance, and possibly adjust expectations.2
Annual Retirement Income Needed
0
5%
10%
15%
20%
$25,000 or less $25,000 - $45,000 $45,000 - $75,000 $75,000 or more
2016 2017
25%
30%
18%
23%
32%30%
28% 29%
21%17%
Major Sources of Income
Social Security Defined contribution plan
Employer pension Personal investments
(other than workplace retirement or IRA)
Individual Retirement
Account (IRA)
2014 2015 2016 2017
0
10%
20%
30%
40%
50%
60%
43%
50%
59% 60%
34%
23% 23% 25%
36%
25% 26% 25%28%
19%16%
19%25%
17% 18% 19%
10 Boomers Expectations for Retirement 2017
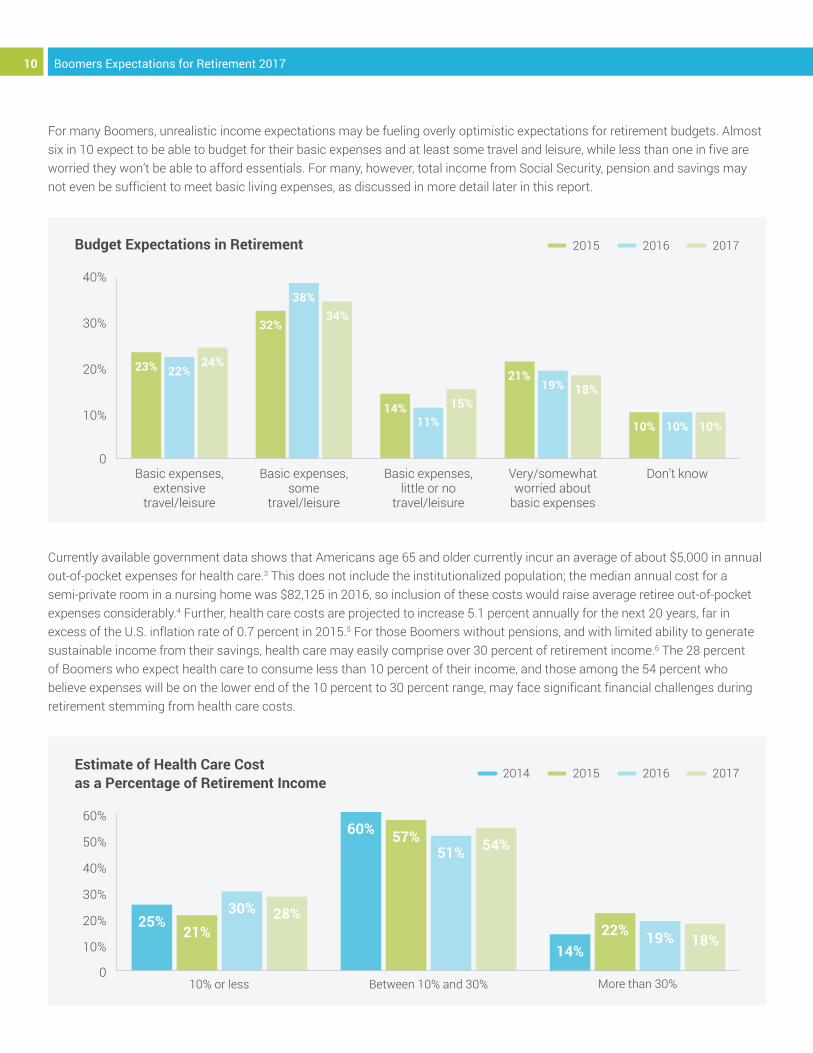
For many Boomers, unrealistic income expectations may be fueling overly optimistic expectations for retirement budgets. Almost six in 10 expect to be able to budget for their basic expenses and at least some travel and leisure, while less than one in five are worried they won’t be able to afford essentials. For many, however, total income from Social Security, pension and savings may not even be sufficient to meet basic living expenses, as discussed in more detail later in this report.
Currently available government data shows that Americans age 65 and older currently incur an average of about $5,000 in annual out-of-pocket expenses for health care.3 This does not include the institutionalized population; the median annual cost for a semi-private room in a nursing home was $82,125 in 2016, so inclusion of these costs would raise average retiree out-of-pocket expenses considerably.4 Further, health care costs are projected to increase 5.1 percent annually for the next 20 years, far in excess of the U.S. inflation rate of 0.7 percent in 2015.5 For those Boomers without pensions, and with limited ability to generate sustainable income from their savings, health care may easily comprise over 30 percent of retirement income.6 The 28 percent of Boomers who expect health care to consume less than 10 percent of their income, and those among the 54 percent who believe expenses will be on the lower end of the 10 percent to 30 percent range, may face significant financial challenges during retirement stemming from health care costs.
Budget Expectations in Retirement
0
10%
20%
30%
40%
Basic expenses, extensive
travel/leisure
Basic expenses, some
travel/leisure
Basic expenses, little or no
travel/leisure
Very/somewhat worried about
basic expenses
Don’t know
23% 22%24%
32%
38%34%
14%11%
15%
21%19% 18%
10% 10% 10%
Estimate of Health Care Cost as a Percentage of Retirement Income
10% or less More than 30%
2014 2015 2016 2017
0
10%
20%
30%
40%
50%
60%
Between 10% and 30%
25%21%
30% 28%
60% 57%51% 54%
14%22% 19% 18%
2015 2016 2017
11Boomers Expectations for Retirement 2017
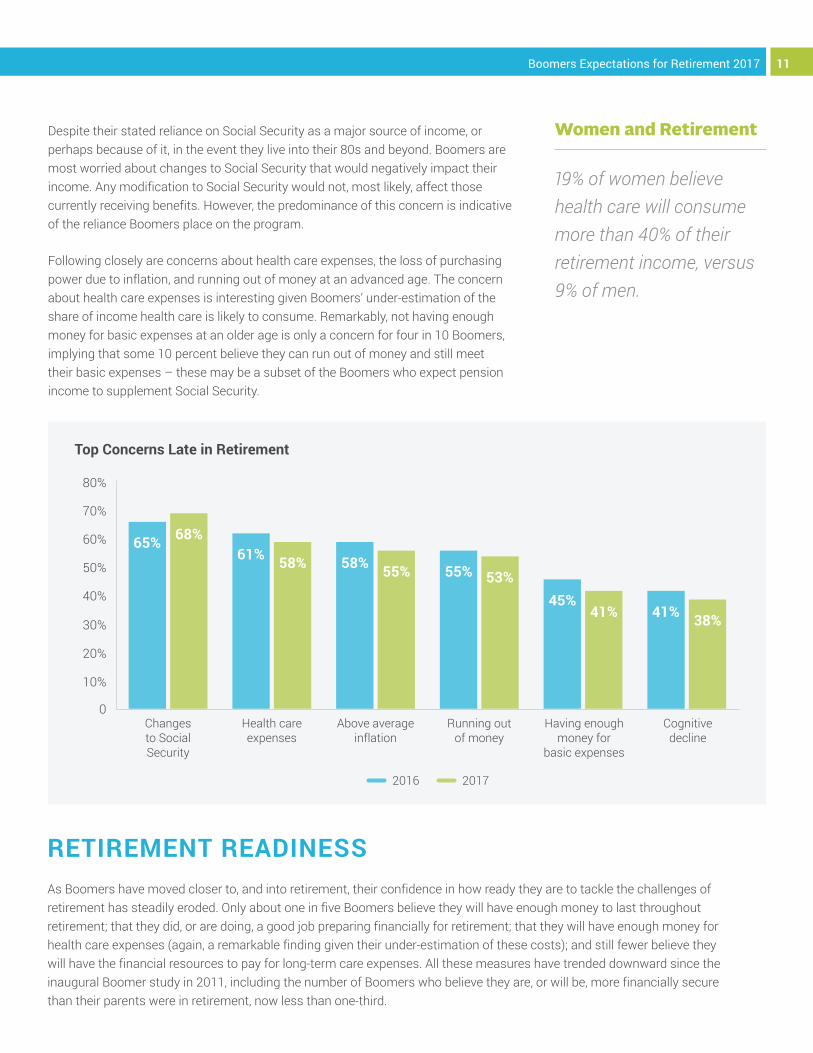
Despite their stated reliance on Social Security as a major source of income, or perhaps because of it, in the event they live into their 80s and beyond. Boomers are most worried about changes to Social Security that would negatively impact their income. Any modification to Social Security would not, most likely, affect those currently receiving benefits. However, the predominance of this concern is indicative of the reliance Boomers place on the program.
Following closely are concerns about health care expenses, the loss of purchasing power due to inflation, and running out of money at an advanced age. The concern about health care expenses is interesting given Boomers’ under-estimation of the share of income health care is likely to consume. Remarkably, not having enough money for basic expenses at an older age is only a concern for four in 10 Boomers, implying that some 10 percent believe they can run out of money and still meet their basic expenses – these may be a subset of the Boomers who expect pension income to supplement Social Security.
Women and Retirement
19% of women believe health care will consume more than 40% of their retirement income, versus 9% of men.
Top Concerns Late in Retirement
0
10%
20%
30%
40%
50%
Changes to Social Security
Health care expenses
Above average inflation
Running out of money
Having enough money for
basic expenses
2016 2017
Cognitive decline
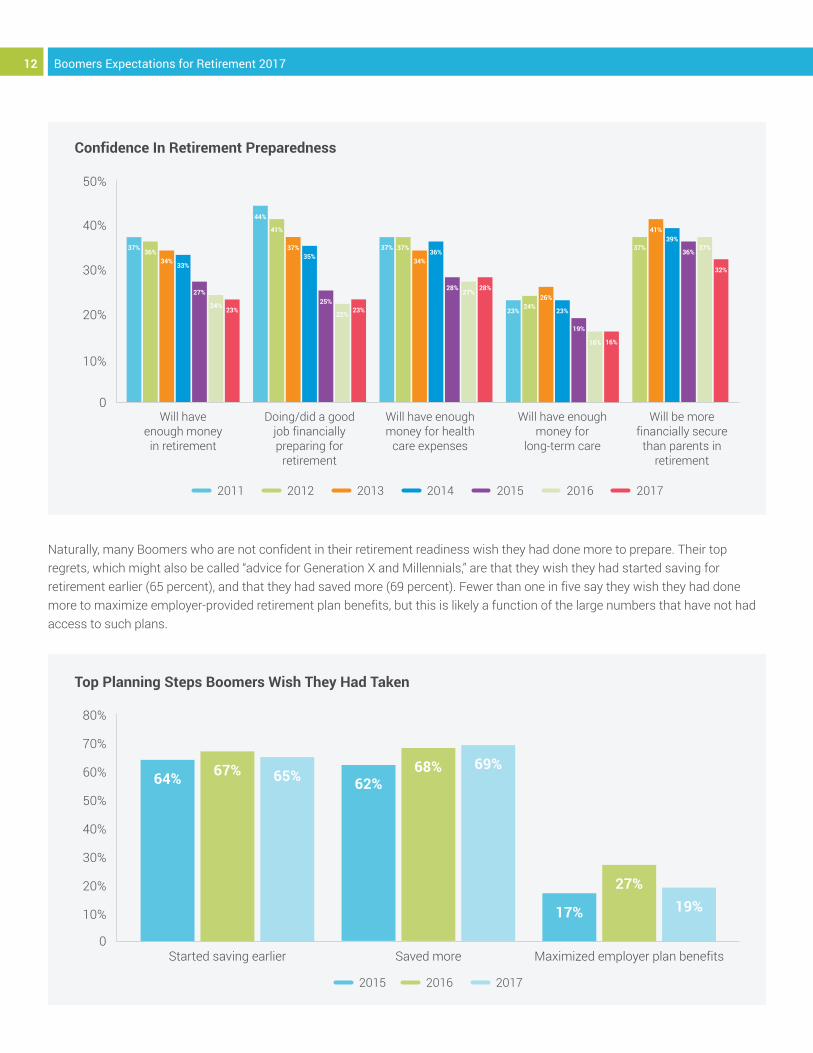
RETIREMENT READINESSAs Boomers have moved closer to, and into retirement, their confidence in how ready they are to tackle the challenges of retirement has steadily eroded. Only about one in five Boomers believe they will have enough money to last throughout retirement; that they did, or are doing, a good job preparing financially for retirement; that they will have enough money for health care expenses (again, a remarkable finding given their under-estimation of these costs); and still fewer believe they will have the financial resources to pay for long-term care expenses. All these measures have trended downward since the inaugural Boomer study in 2011, including the number of Boomers who believe they are, or will be, more financially secure than their parents were in retirement, now less than one-third.
60%
70%
80%
65% 68%61% 58% 58% 55% 55% 53%
45%41% 41% 38%
12 Boomers Expectations for Retirement 2017
Naturally, many Boomers who are not confident in their retirement readiness wish they had done more to prepare. Their top regrets, which might also be called “advice for Generation X and Millennials,” are that they wish they had started saving for retirement earlier (65 percent), and that they had saved more (69 percent). Fewer than one in five say they wish they had done more to maximize employer-provided retirement plan benefits, but this is likely a function of the large numbers that have not had access to such plans.
Confidence In Retirement Preparedness
0
10%
20%
30%
40%
Will have enough money in retirement
2011 2012 2013 2014 2015 2016 2017
Will be more financially secure
than parents in retirement
Doing/did a good job financially preparing for
retirement
Will have enough money for health
care expenses
Will have enough money for
long-term care
Started saving earlier Saved more Maximized employer plan benefits
2015 2016 2017
Top Planning Steps Boomers Wish They Had Taken
64% 67% 65% 62%68% 69%
17%
27%19%
37%
50%
36%34% 33%
27%
24% 23%
44%
41%
37%35%
25%
22%23%
37% 37%
34%36%
28%27%
28%
23%24%
26%
23%
19%
16% 16%
37%
41%39%
36%37%
32%
13Boomers Expectations for Retirement 2017
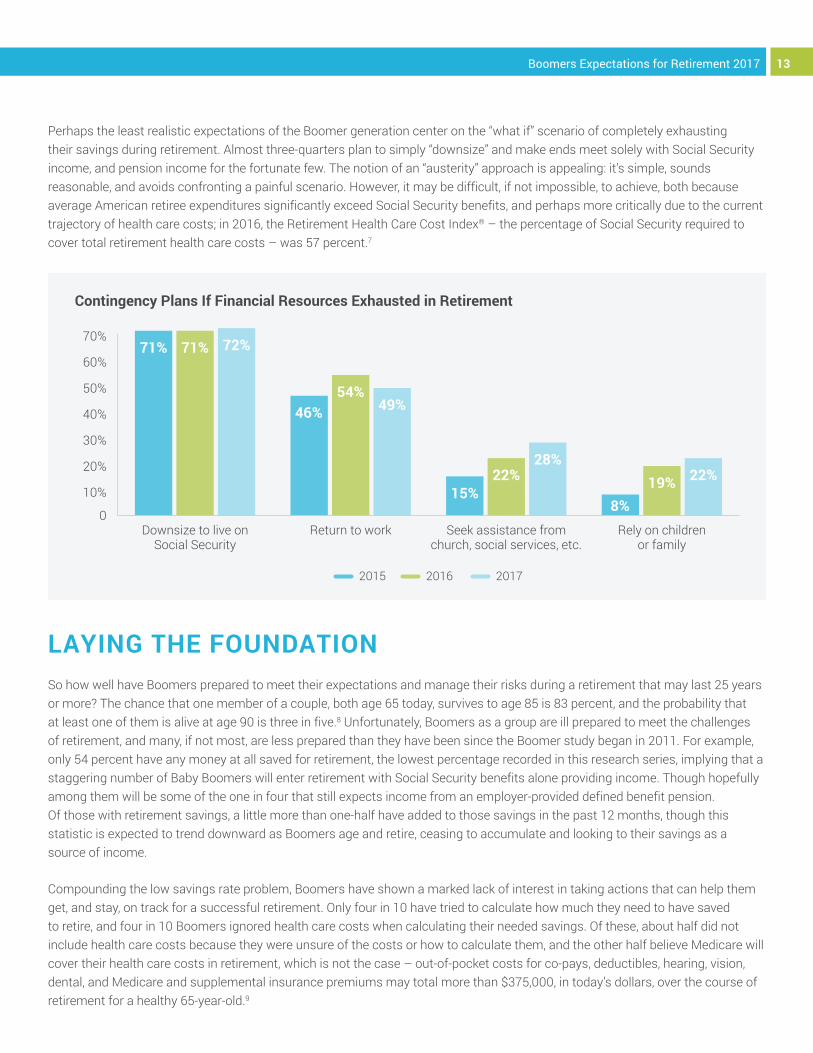
Perhaps the least realistic expectations of the Boomer generation center on the “what if” scenario of completely exhausting their savings during retirement. Almost three-quarters plan to simply “downsize” and make ends meet solely with Social Security income, and pension income for the fortunate few. The notion of an “austerity” approach is appealing: it’s simple, sounds reasonable, and avoids confronting a painful scenario. However, it may be difficult, if not impossible, to achieve, both because average American retiree expenditures significantly exceed Social Security benefits, and perhaps more critically due to the current trajectory of health care costs; in 2016, the Retirement Health Care Cost Index® – the percentage of Social Security required to cover total retirement health care costs – was 57 percent.7
LAYING THE FOUNDATIONSo how well have Boomers prepared to meet their expectations and manage their risks during a retirement that may last 25 years or more? The chance that one member of a couple, both age 65 today, survives to age 85 is 83 percent, and the probability that at least one of them is alive at age 90 is three in five.8 Unfortunately, Boomers as a group are ill prepared to meet the challenges of retirement, and many, if not most, are less prepared than they have been since the Boomer study began in 2011. For example, only 54 percent have any money at all saved for retirement, the lowest percentage recorded in this research series, implying that a staggering number of Baby Boomers will enter retirement with Social Security benefits alone providing income. Though hopefully among them will be some of the one in four that still expects income from an employer-provided defined benefit pension. Of those with retirement savings, a little more than one-half have added to those savings in the past 12 months, though this statistic is expected to trend downward as Boomers age and retire, ceasing to accumulate and looking to their savings as a source of income.
Compounding the low savings rate problem, Boomers have shown a marked lack of interest in taking actions that can help them get, and stay, on track for a successful retirement. Only four in 10 have tried to calculate how much they need to have saved to retire, and four in 10 Boomers ignored health care costs when calculating their needed savings. Of these, about half did not include health care costs because they were unsure of the costs or how to calculate them, and the other half believe Medicare will cover their health care costs in retirement, which is not the case – out-of-pocket costs for co-pays, deductibles, hearing, vision, dental, and Medicare and supplemental insurance premiums may total more than $375,000, in today’s dollars, over the course of retirement for a healthy 65-year-old.9
0
10%
20%
30%
40%
50%
Downsize to live on Social Security
2015 2016 2017
Contingency Plans If Financial Resources Exhausted in Retirement
60%
70%
Return to work Seek assistance from church, social services, etc.
Rely on children or family
71% 71% 72%
46%54%
49%
15%22%
28%
8%19% 22%
14 Boomers Expectations for Retirement 2017
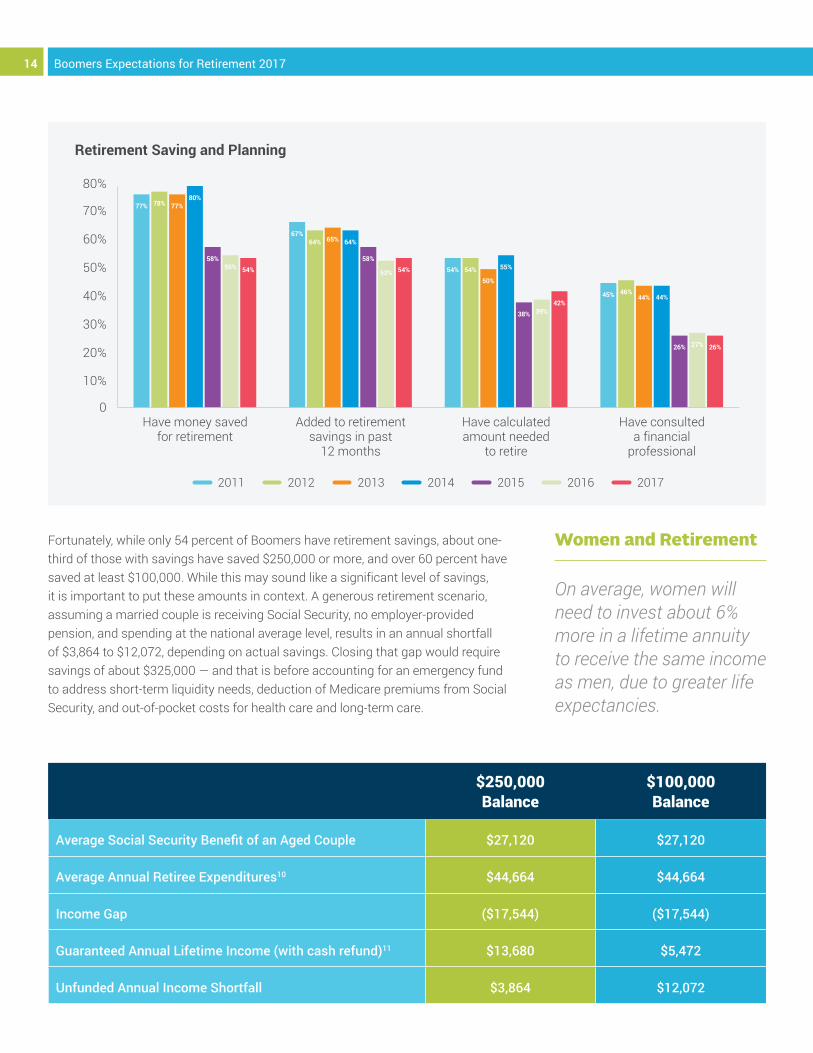
Fortunately, while only 54 percent of Boomers have retirement savings, about one-third of those with savings have saved $250,000 or more, and over 60 percent have saved at least $100,000. While this may sound like a significant level of savings, it is important to put these amounts in context. A generous retirement scenario, assuming a married couple is receiving Social Security, no employer-provided pension, and spending at the national average level, results in an annual shortfall of $3,864 to $12,072, depending on actual savings. Closing that gap would require savings of about $325,000 — and that is before accounting for an emergency fund to address short-term liquidity needs, deduction of Medicare premiums from Social Security, and out-of-pocket costs for health care and long-term care.
Women and Retirement
On average, women will need to invest about 6% more in a lifetime annuity to receive the same income as men, due to greater life expectancies.
$250,000 Balance
$100,000 Balance
Average Social Security Benefit of an Aged Couple $27,120 $27,120
Average Annual Retiree Expenditures10 $44,664 $44,664
Income Gap ($17,544) ($17,544)
Guaranteed Annual Lifetime Income (with cash refund)11 $13,680 $5,472
Unfunded Annual Income Shortfall $3,864 $12,072
Have money saved for retirement
2011 2012 2013 2014 2015 2016 2017
Retirement Saving and Planning
Added to retirement savings in past
12 months
Have calculated amount needed
to retire
Have consulted a financial
professional
77% 78% 77%80%
58%55% 54%
67%64% 65% 64%
58%
53% 54% 54% 54%
50%
55%
38% 39%42%
45% 46%44% 44%
26% 27% 26%
15Boomers Expectations for Retirement 2017
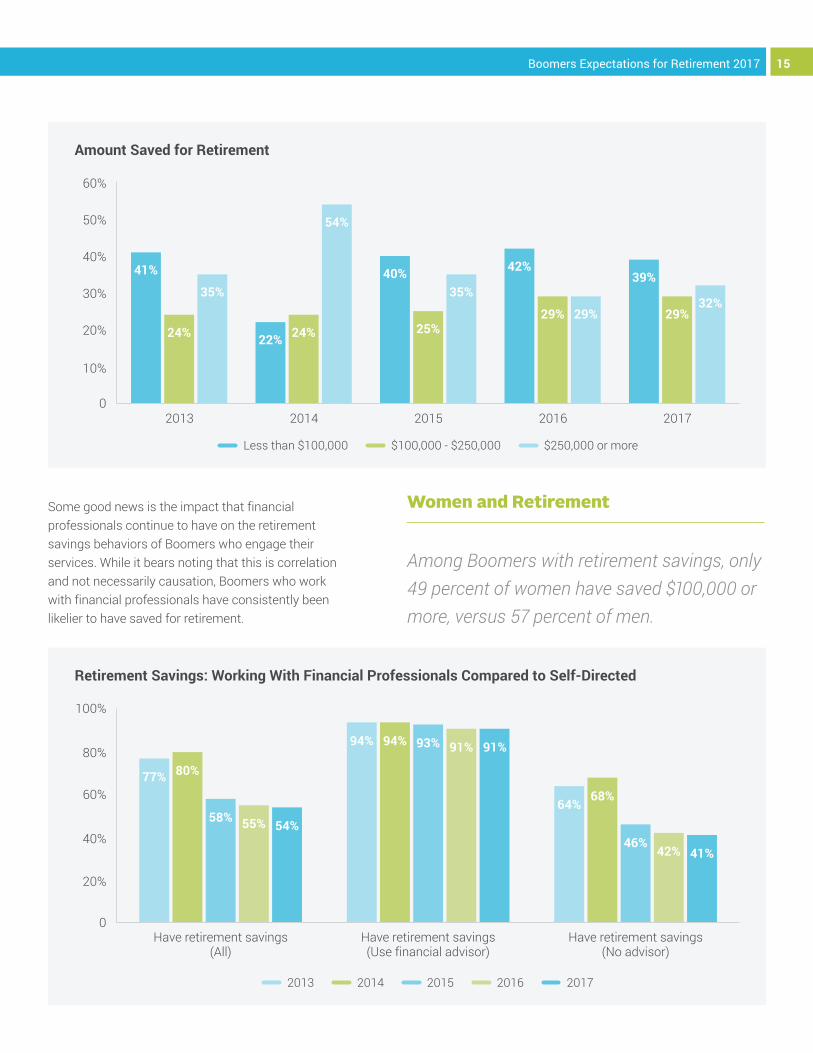
Some good news is the impact that financial professionals continue to have on the retirement savings behaviors of Boomers who engage their services. While it bears noting that this is correlation and not necessarily causation, Boomers who work with financial professionals have consistently been likelier to have saved for retirement.
Women and Retirement
Among Boomers with retirement savings, only 49 percent of women have saved $100,000 or more, versus 57 percent of men.
0
10%
20%
30%
40%
50%
2013 2014 2015 2016
Less than $100,000 $100,000 - $250,000 $250,000 or more
2017
Amount Saved for Retirement
60%
41%
24%
35%
22% 24%
54%
40%
25%
35%
42%
29% 29%
39%
29%32%
0
20%
40%
60%
80%
Have retirement savings (All)
Retirement Savings: Working With Financial Professionals Compared to Self-Directed
100%
Have retirement savings (Use financial advisor)
Have retirement savings (No advisor)
2013 2014 2015 2016 2017
77% 80%
58% 55% 54%
94% 94% 93% 91% 91%
64%68%
46%42% 41%
16 Boomers Expectations for Retirement 2017
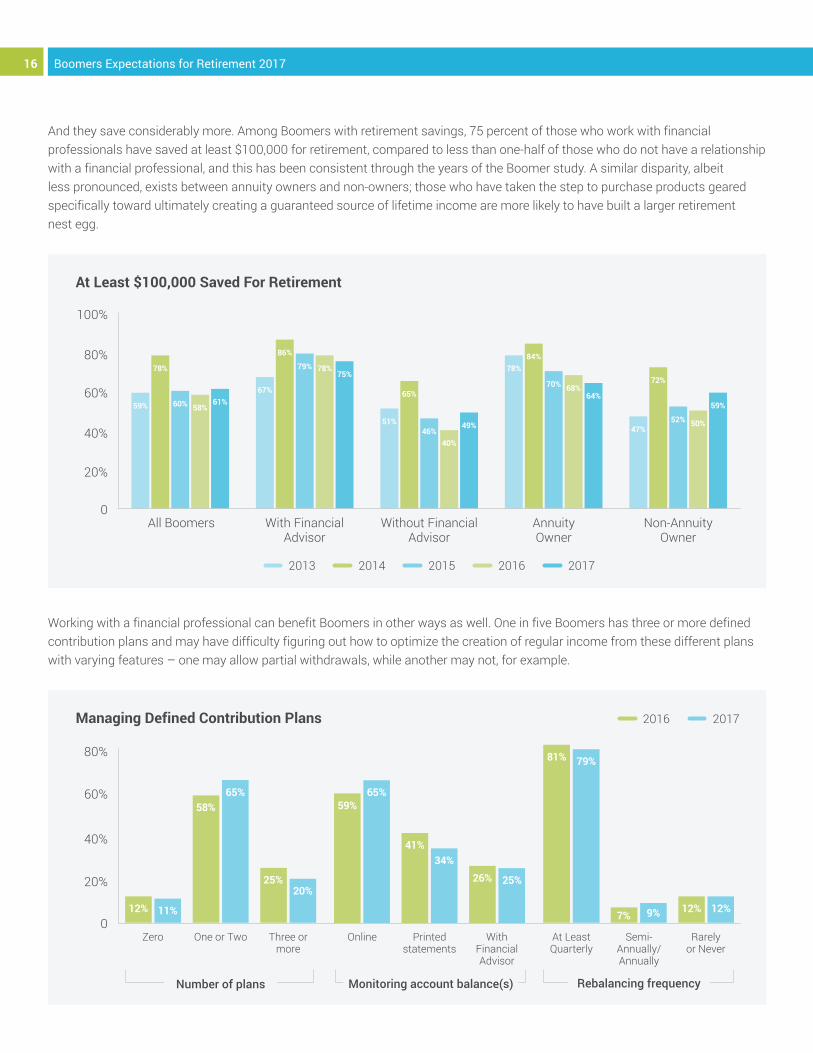
And they save considerably more. Among Boomers with retirement savings, 75 percent of those who work with financial professionals have saved at least $100,000 for retirement, compared to less than one-half of those who do not have a relationship with a financial professional, and this has been consistent through the years of the Boomer study. A similar disparity, albeit less pronounced, exists between annuity owners and non-owners; those who have taken the step to purchase products geared specifically toward ultimately creating a guaranteed source of lifetime income are more likely to have built a larger retirement nest egg.
Working with a financial professional can benefit Boomers in other ways as well. One in five Boomers has three or more defined contribution plans and may have difficulty figuring out how to optimize the creation of regular income from these different plans with varying features – one may allow partial withdrawals, while another may not, for example.
0
20%
40%
60%
80%
All Boomers
At Least $100,000 Saved For Retirement
100%
With Financial Advisor
Without Financial Advisor
2013 2014 2015 2016 2017
Annuity Owner
Non-Annuity Owner
0
20%
40%
60%
80%
Zero
Managing Defined Contribution Plans
One or Two Three or more
2016 2017
Online Printed statements
With Financial Advisor
At Least Quarterly
Semi-Annually/ Annually
Rarely or Never
Number of plans Monitoring account balance(s) Rebalancing frequency
59%
78%
60% 58%61%
67%
86%
79% 78%75%
51%
65%
46%40%
49%
78%84%
70% 68%64%
47%
72%
52% 50%
59%
12% 11%
58%65%
25%20%
59%65%
41%34%
26% 25%
81% 79%
7% 9% 12% 12%
17Boomers Expectations for Retirement 2017
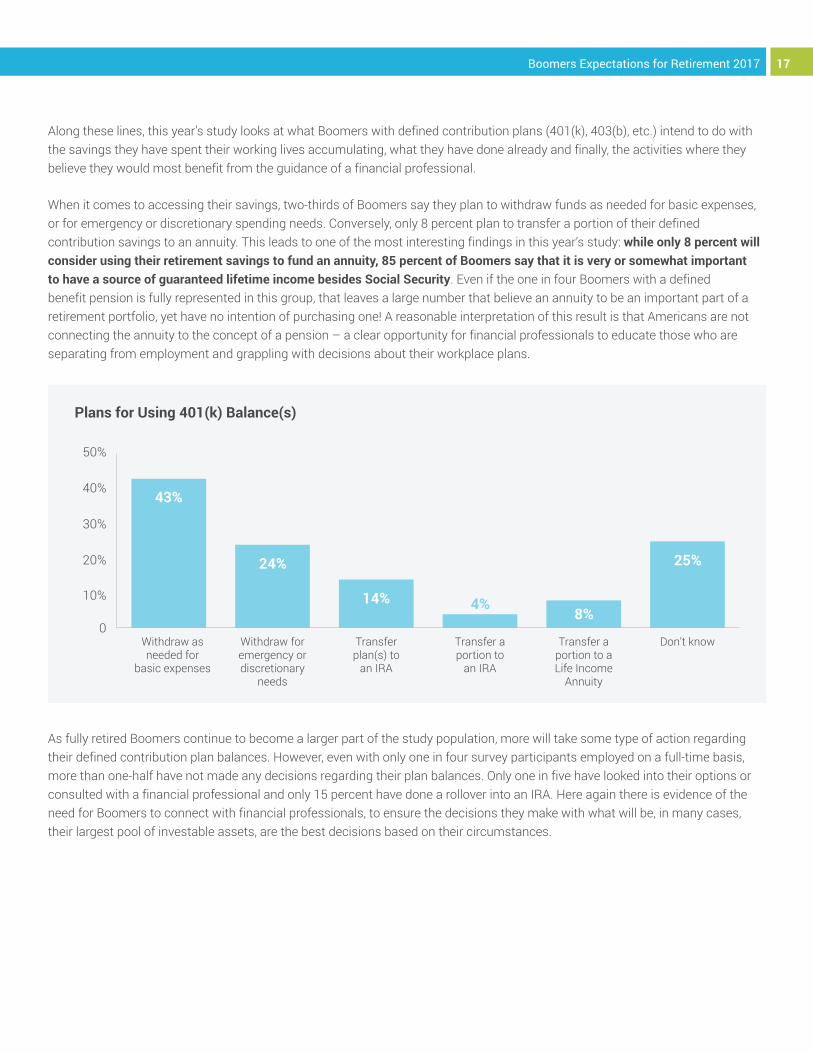
Along these lines, this year’s study looks at what Boomers with defined contribution plans (401(k), 403(b), etc.) intend to do with the savings they have spent their working lives accumulating, what they have done already and finally, the activities where they believe they would most benefit from the guidance of a financial professional.
When it comes to accessing their savings, two-thirds of Boomers say they plan to withdraw funds as needed for basic expenses, or for emergency or discretionary spending needs. Conversely, only 8 percent plan to transfer a portion of their defined contribution savings to an annuity. This leads to one of the most interesting findings in this year’s study: while only 8 percent will consider using their retirement savings to fund an annuity, 85 percent of Boomers say that it is very or somewhat important to have a source of guaranteed lifetime income besides Social Security. Even if the one in four Boomers with a defined benefit pension is fully represented in this group, that leaves a large number that believe an annuity to be an important part of a retirement portfolio, yet have no intention of purchasing one! A reasonable interpretation of this result is that Americans are not connecting the annuity to the concept of a pension – a clear opportunity for financial professionals to educate those who are separating from employment and grappling with decisions about their workplace plans.
As fully retired Boomers continue to become a larger part of the study population, more will take some type of action regarding their defined contribution plan balances. However, even with only one in four survey participants employed on a full-time basis, more than one-half have not made any decisions regarding their plan balances. Only one in five have looked into their options or consulted with a financial professional and only 15 percent have done a rollover into an IRA. Here again there is evidence of the need for Boomers to connect with financial professionals, to ensure the decisions they make with what will be, in many cases, their largest pool of investable assets, are the best decisions based on their circumstances.
Plans for Using 401(k) Balance(s)
Withdraw as needed for
basic expenses
Withdraw for emergency or discretionary
needs
Transfer plan(s) to
an IRA
Transfer a portion to
an IRA
Transfer a portion to a Life Income
Annuity
Don’t know
43%
24%
14% 4%8%
25%
18 Boomers Expectations for Retirement 2017
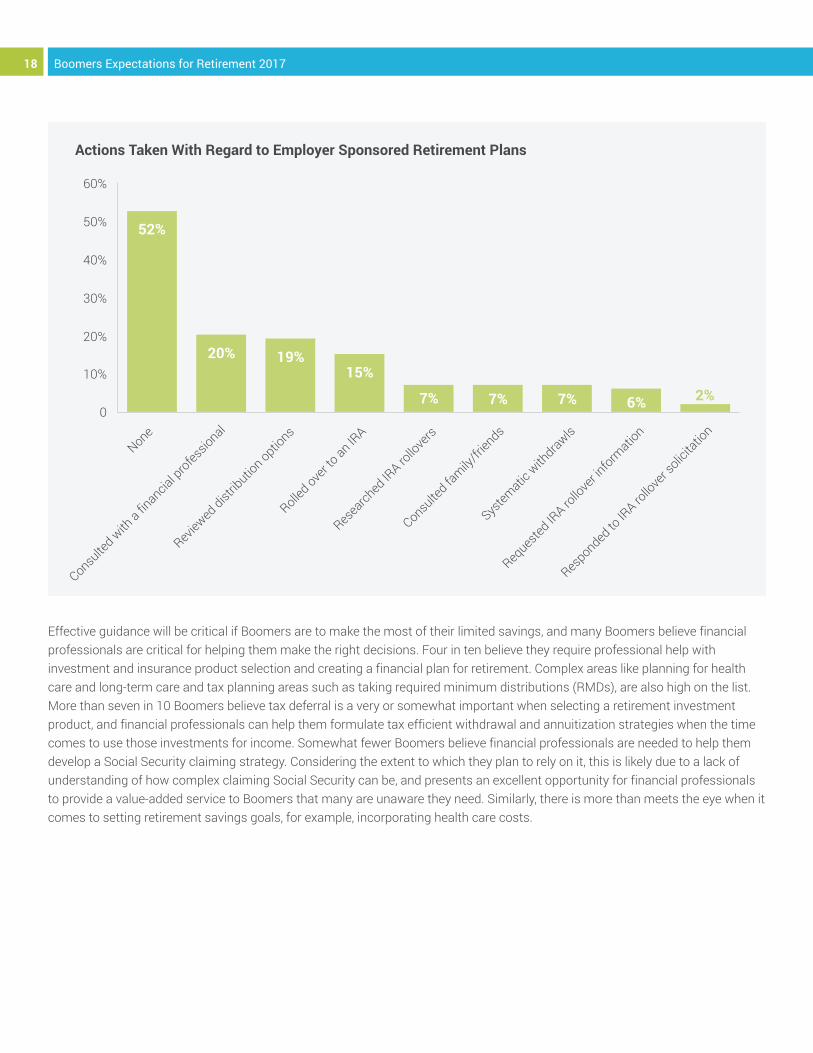
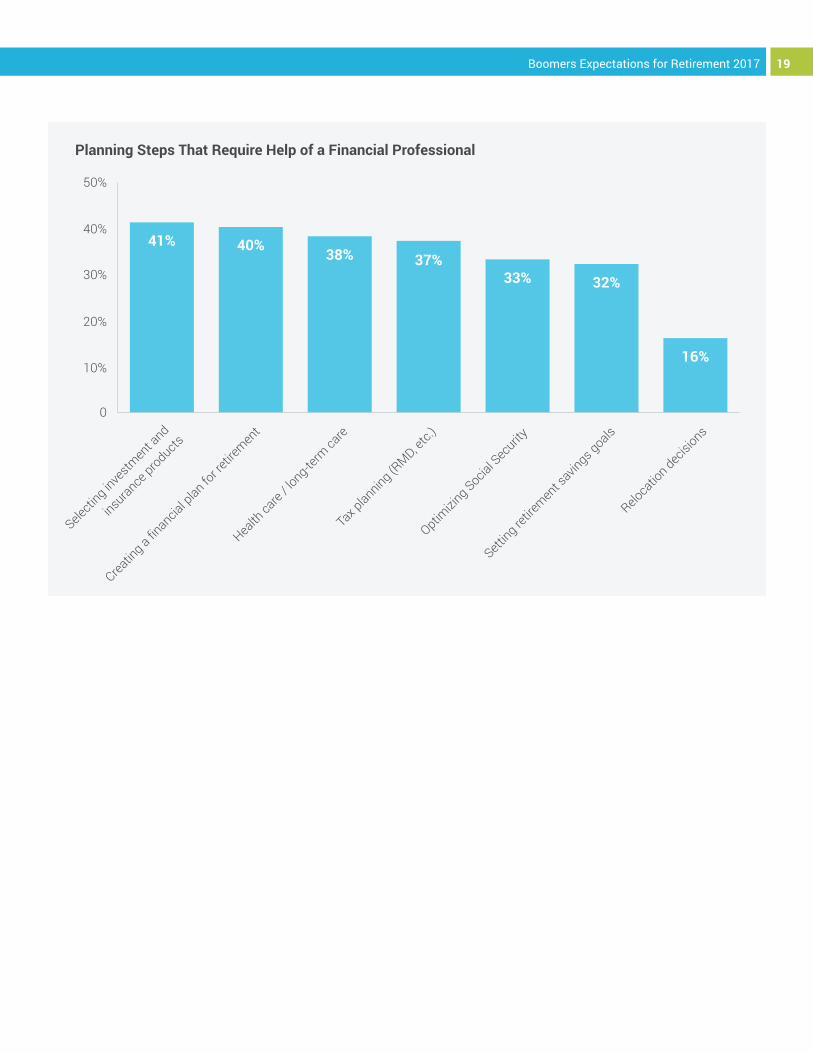
Effective guidance will be critical if Boomers are to make the most of their limited savings, and many Boomers believe financial professionals are critical for helping them make the right decisions. Four in ten believe they require professional help with investment and insurance product selection and creating a financial plan for retirement. Complex areas like planning for health care and long-term care and tax planning areas such as taking required minimum distributions (RMDs), are also high on the list. More than seven in 10 Boomers believe tax deferral is a very or somewhat important when selecting a retirement investment product, and financial professionals can help them formulate tax efficient withdrawal and annuitization strategies when the time comes to use those investments for income. Somewhat fewer Boomers believe financial professionals are needed to help them develop a Social Security claiming strategy. Considering the extent to which they plan to rely on it, this is likely due to a lack of understanding of how complex claiming Social Security can be, and presents an excellent opportunity for financial professionals to provide a value-added service to Boomers that many are unaware they need. Similarly, there is more than meets the eye when it comes to setting retirement savings goals, for example, incorporating health care costs.
Actions Taken With Regard to Employer Sponsored Retirement Plans
0
10%
20%
30%
40%
50%
60%
52%
20% 19%15%
7% 7% 7% 6% 2%
19Boomers Expectations for Retirement 2017
Planning Steps That Require Help of a Financial Professional
0
10%
20%
30%
40%
50%
41% 40% 38% 37%33% 32%
16%
20 Boomers Expectations for Retirement 2017
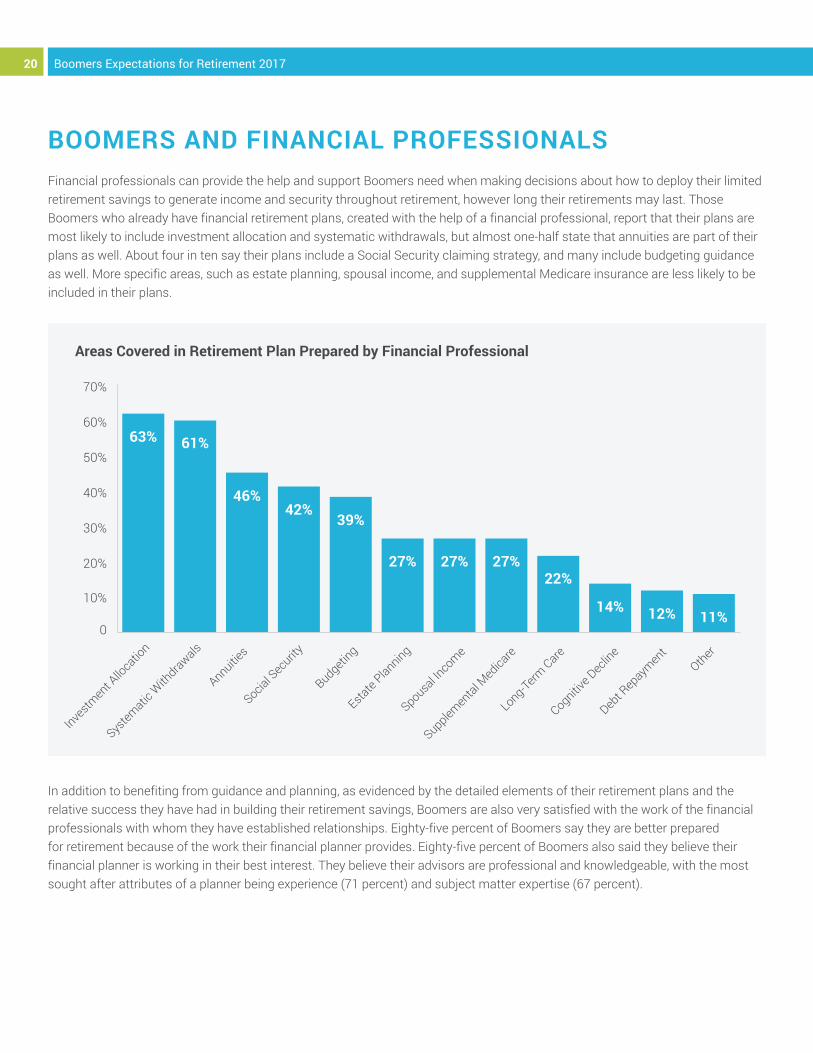
BOOMERS AND FINANCIAL PROFESSIONALSFinancial professionals can provide the help and support Boomers need when making decisions about how to deploy their limited retirement savings to generate income and security throughout retirement, however long their retirements may last. Those Boomers who already have financial retirement plans, created with the help of a financial professional, report that their plans are most likely to include investment allocation and systematic withdrawals, but almost one-half state that annuities are part of their plans as well. About four in ten say their plans include a Social Security claiming strategy, and many include budgeting guidance as well. More specific areas, such as estate planning, spousal income, and supplemental Medicare insurance are less likely to be included in their plans.
In addition to benefiting from guidance and planning, as evidenced by the detailed elements of their retirement plans and the relative success they have had in building their retirement savings, Boomers are also very satisfied with the work of the financial professionals with whom they have established relationships. Eighty-five percent of Boomers say they are better prepared for retirement because of the work their financial planner provides. Eighty-five percent of Boomers also said they believe their financial planner is working in their best interest. They believe their advisors are professional and knowledgeable, with the most sought after attributes of a planner being experience (71 percent) and subject matter expertise (67 percent).
Areas Covered in Retirement Plan Prepared by Financial Professional
0
10%
20%
30%
40%
50%
60%
70%
63% 61%
46%42%
39%
27% 27% 27%22%
14% 12% 11%
21Boomers Expectations for Retirement 2017
CONCLUSIONBaby Boomers face a tough road in the years ahead, especially those who seek traditional retirement — that is, retirement without a source of earned income. Discretionary spending can be managed and reduced, or even eliminated, but basic needs must be met and are subject to inflation. Health care costs are expected to rise faster than the general inflation rate, and as they are unpredictable as to both amount and timing, it is difficult to predict their impact. The need for long-term care is also a significant risk, with someone turning 65 today having an almost seventy percent chance of needing some type of long-term care service during their remaining years. Most Boomers lack the financial resources to take on these risks “as they come;” rather, they need planning, guidance, and financial products that can help mitigate these risks. The evidence is clear, and has been unwavering throughout the seven years the IRI Boomer Expectations report has been published: those who have sought and obtained help are better prepared for retirement, both by their own assessments and by empirical measurements.
METHODOLOGYThe Insured Retirement Institute (IRI) commissioned Woelfel Research, Inc., to conduct a survey of individuals broadly defined as members of the Baby Boomer Generation. The research was conducted by means of internet interviews with 800 Americans aged 54 to 70. Data were weighted by age and gender to the 2015 American Community Survey. Data was collected from January 25 through January 30, 2017. The margin of error for the sample of 800 was ± 3.5%.
REFERENCES1 “Annual Estimates of the Resident Population for Selected Age Groups by Sex for the United States, States, Counties, and Puerto Rico Commonwealth and Municipios: April 1, 2010 to July 1, 2015 – 2015 Population Estimates” – United States Census Bureau
2 “Fact Sheet: 2017 Social Security Changes” – Social Security Administration, January, 2017
3 “Beyond the Numbers – Prices and Spending” – Bureau of Labor Statistics, 2015
4 “2016 Cost of Care Study” – Genworth, 2016
5 “2016 Retirement Health Care Costs Data Report” – HealthView Services, 2016
6 “Beyond the Numbers – Prices and Spending” – Bureau of Labor Statistics, 2015
7 “2016 Retirement Health Care Costs Data Report” – HealthView Services, 2016
8 “Spotlight on Retirement Risks” – IRI Fact Book 2016
9 “2016 Retirement Health Care Costs Data Report” – HealthView Services, 201610 “Table 1300. Age of reference person: Annual expenditure means, shares, standard errors, and coefficients of variation, Consumer Expenditure Survey, 2015” – Bureau of Labor Statistics, 2015
11 https://www.immediateannuities.com/

Insured Retirement Institute 202-469-3000 | 202-469-3030 (fax) [email protected] | myirionline.org
@irionline facebook.com/insured.retirement.institute