Embed Size (px)
Citation preview
Growth and Quality of U.S. Private Prisons:Evidence from a National Survey*
Scott D. Camp, Ph.D.Senior Social Science Research Analyst
Gerald G. Gaes, Ph.D.Director, Office of Research and Evaluation
Federal Bureau of PrisonsOffice of Research and Evaluation
320 First Street, NW400 Building, Room 3025Washington, DC 20534
September 21, 2001
The opinions expressed in this paper are those of the authors and do not necessarily represent those of either theFederal Bureau of Prisons or the U.S. Department of Justice. The empirical data for this report was taken from areport submitted by the Department of Justice to the U.S. Congress.
Growth and Quality of U.S. Private Prisons:Evidence from a National Survey
Abstract
Private prisons incarcerate 5.3 percent of the sentenced, adult population in the United States. Despite the growing
use of private prisons, little systematic information has been collected to allow correctional administrators and
other policymakers to gauge the general performance of the private sector. To help rectify this shortcoming, the
present study presents selected results from a 1999 survey of all private prisons operating in the United States or in
U.S. territories.
Keywords: Private prisons, Staff separations, Inmate misconduct, Survey
1“The Director of the Bureau of Prisons shall conduct a study . . . of private prisons that evaluates thegrowth and development of the private prison industry during the past 15 years, training qualifications ofpersonnel at private prisons, and the security procedures of such facilities, and compares the general standards andconditions between private prisons and Federal prisons” (Public Law 105-277, Sec. 111).
2A complete description of the survey results is provided in the report prepared by the Federal Bureau ofPrisons for the U.S. Congress (Camp and Gaes 2000).
1
Growth and Quality of U.S. Private Prisons:Evidence from a National Survey
Many jurisdictions now rely on private prisons to add to their complement of adult prison beds. One of the primary
reasons for this dependence has been the unprecedented growth in the sentenced, adult population in the United
States. In order to add more capacity, quickly and without having to ask legislators to authorize bonds, state and
local jurisdictions have contracted with private companies to build and/or operate private prisons. Some
jurisdictions view privatization as a management tool that allows them additional flexibility in their operational
demands, while other jurisdictions view privatization as a way to reduce the costs of operating prisons and to
improve quality. Regardless of the different motives, very little data are available that can be used by policymakers
to assess whether privately operated prisons achieve or surpass the level of performance of their public
counterparts, or whether they are in fact less costly. This paper addresses the former issue by presenting data from
a national survey of local, state, and federal jurisdictions housing adult offenders.
With the growing use of private-sector beds, there is a real need for basic information on private-sector operations.
Partly in response to a request for information from the U.S. Congress,1 and partly to satisfy internal needs for
information, the Federal Bureau of Prisons (BOP) undertook a study of all private-sector prisons in U.S. states and
territories that held sentenced, adult inmates in 1999. This paper, which is a by-product of that study, presents
information on the growth in the private sector’s operation of adult, secure facilities in the United States.2 The
analysis also touches upon some of the important indicators of the quality of private prison operations. Where it is
appropriate to do so, the operations of the private-sector prison companies are compared to the performance of the
Federal Bureau of Prisons. In part, this comparison to the BOP results from the nature of the original request for
3The Federal Bureau of Prisons (BOP) currently houses slightly more than 20,000 of a total of 153,000inmates in beds managed by private-sector companies. Of these, 14,171 are beds in secure, adult prisons holdinglow-security inmates, and another 6,157 inmates are in pre-release, halfway houses. For 7,663 of the 14,171inmates in secure prison beds, the BOP has a direct contract with a private-sector company, and the rest of theinmates are in prisons where the BOP has an inter-governmental agreement with a local jurisdiction. In the lattercase, the local governments hold the contract to house BOP inmates, and they subcontract the operations of theprisons to private-sector companies. In addition to the 20,000 inmates currently in beds managed by private-prisonoperators, the BOP has short-term plans to place up to another 6,000 inmates in private prisons.
2
information. Also, the comparison makes sense as the BOP is one of the largest prison systems in the United States
and one of the largest consumers of private beds.3 In the final section, the public policy implications of the analysis
are presented.
Special attention is focused in this report on staff issues. The hiring and training of supervisory and line staff is
probably the single most important factor distinguishing the daily operations of private and public sector prisons.
Labor expenses represent between 60 and 80 percent of the costs of operating a prison. To the extent that private
prisons can be operated more cheaply than their public sector counterparts (a claim that has been questioned, c.f.
Austin & Coventry, 2001; General Accounting Office, 1996; McDonald, Fournier, Russell-Einhorn, & Crawford,
1998), the savings will most likely come from lower wages and/or benefits, fewer staff, or both. For example,
Nelson (1998) found lower labor costs in the private sector that were associated with lower rates of benefits (see
also Crants, 1991).
Lower costs in running prisons have implications for how correctional work is performed. The appropriate mix of
skills for and the appropriate duties for correctional officers were more openly discussed in earlier literature (Irwin,
1980; Jacobs, 1977). The earlier debate coalesced around the appropriate role of correctional officers, e.g., custody
versus treatment. The current use of privatization also has implications for the skills and duties of correctional
officers, even if the discussion is not as public. In the new model of corrections being advocated by the private
sector (Moore, 1998), the skills and judgment required of correctional workers are supplemented with new
technology and different forms of work organization. Given these changes, correctional officers are more easily
replaced, and are therefore less costly in terms of salary and benefits for the prison operators. Instead of public-

3
sector workers being viewed as more costly resources that embody the greater interpersonal skills needed to deal
with sophisticated inmates, the current model of public-sector correctional officer is viewed as being too costly and
inefficient for modern modes of private-prison operations (Crants, 1991).
Whether or not there is a new model for the role of the correctional officer implied in the practices of the private
sector, it is nonetheless true that private operators are running prisons with workers who are generally paid less
than their public-sector counterparts. This “experiment” in the organization of work in prisons produces an
extremely important research question that has practical, policy implications: “What effect does lower labor costs
have on the quality of the correctional product?” A systematic answer to this question involves assessing labor
costs, evaluating the quality of supervisory and line staff, and finally, measuring the indicators of correctional
performance. While data on labor costs were not collected for this study, information was obtained about staff
separations and a few, key indicators of correctional performance such as inmate escapes, drug usage hit rates, and
homicides.
This paper is organized into the following sections. In the first section, background information on the private-
prison sector is presented with a focus on the size of the companies operating in the private-sector as well as noting
some of the more publicized problems private-prison operators have encountered. In the second section, the survey
design and results are provided. In the “Discussion and Conclusion” section, the public policy implications of these
findings are addressed.
Background
The rapid growth in the jail and prison populations in the United States until very recently generated tremendous
opportunities for entrepreneurs to build, own and operate prisons in the 1980s and 1990s. Private prisons in the
United States, though, are not new phenomena. In the 19th century, some states entered into agreements with
private parties to lease the labor of inmates. In some of these agreements, the private party became responsible for
4Private prison operators of jails and detention centers in the U.S. hold a large number of adults, includingthe illegal aliens incapacitated for the Immigration and Naturalization Service and the pre-trial inmates held forthe U.S. Marshals Service. These facilities and inmates are not the focus of the present report which concentrateson secure adult prisons, and Abt Associates did not attempt to collect information on these types of facilities.
5The seven states with larger populations in secure prisons were California (155,276), Florida (61,270),Illinois (40,787), Michigan (42,388), New York (69,108), Ohio (47,808), and Texas (129,278). The FederalBureau of Prisons had 87,224 inmates in secure prisons. Secure prison is defined for purposes of this report as afacility with a secure perimeter fence or fences. Also, the facility must hold sentenced adult inmates in generalpopulation units. In the BOP, this excludes all facilities that are designated as minimum-security prison camps,metropolitan detention centers, prison hospitals, and metropolitan correctional centers. Secure prisonsincarcerating sentenced adults in the BOP include the security levels of low, medium, and high. While the presentstudy excludes the 21,668 inmates in minimum-security BOP prisons, minimum-security inmates are in the figuresfor many of the private-sector prisons. As noted in the next section, excluding minimum-security BOP inmatescomplicates comparisons between the BOP and the private sector.
4
the housing and care of the inmates in addition to paying a fee for the labor of the inmate. This system was fairly
widespread, and the lease system was subject to abuse. The convict lease system came to an end in 1923 during the
Progressive Era (Shichor, 1995: 34-43). Under the current incarnation of private prisons, the opportunity for
private operators to benefit directly from the labor of inmates has been largely removed (18 USC §436, 18 USC
§1761).
The two largest firms, Corrections Corporation of America (CCA) and Wackenhut Corrections Corporation
(WCC) arose in the 1980s and rapidly expanded to provide custody of more inmates in the United States than most
state systems. Abt Associates Inc., under contract with the National Institute of Corrections (NIC), conducted a
census of adult prison facilities in the United States and found that the private sector housed 69,188 inmates in 94
different prisons on July 31, 1999.4 Private prisons held 5.3 percent of the 1.3 million inmates under the
jurisdiction of state and federal governments at that time. This marked a significant increase from the end of 1997,
the last time Abt conducted a census, when Abt determined that 91 contracts covered 37,651 inmates in 84
different private prisons (McDonald et al., 1998). In 1999, CCA held 37,244 inmates in 45 prisons— 53.8 percent
of the total number of inmates in private prisons. WCC incarcerated another 19,001 inmates in 26 prisons— 27.4
percent of the total number of privately-held inmates. CCA was the ninth largest prison system; only seven states
and the Federal Bureau of Prisons were larger (Camp & Camp, 1998: 6-7).5 WCC was the nineteenth largest
6In addition to the states listed in footnote 3, the following states had larger inmate populations than WCCon January 1, 1998: Alabama (19,541), Arizona (23,484), Georgia (35,677), Missouri (23,645), New Jersey(22,252), North Carolina (28,696), Pennsylvania (30,819), South Carolina (20,629), and Virginia (24,644).
5
provider of adult beds in the United States, relative to CCA, the Federal Bureau of Prisons, and state correctional
systems.6 Together, CCA and WCC held 56,245 inmates, or 81.3 percent of the inmates in secure, adult, private
prisons (see Table 1 for greater detail).
The rapid influx of prisoners into the private sector has created challenges and opportunities. Many of the concerns
about private corporations and their staff capabilities came to a head in the aftermath of the highly publicized
escape of six maximum-security inmates, five of them convicted murderers, from the Northeast Ohio Correctional
Center (NOCC) in July of 1998. In a detailed and rare glimpse into the operations of a private prison, John L.
Clark, the Corrections Trustee for the District of Columbia, provided an examination of the problems experienced
by CCA at NOCC during its initial operations. In addition to the much-publicized escapes, there were two inmate
murders and numerous stabbings and assaults, including assaults on staff. Among his findings, Clark documented
the lack of basic security practices and the inexperience and inability of staff to handle difficult inmates (Clark,
1998).
WCC also experienced highly publicized problems in two of the prisons it operated in New Mexico: the Lea
County and Guadalupe County Correctional Facilities. At the request of the Special Advisory Group composed of
New Mexico State Senators, State Representatives, the State Corrections Secretary, and the State Deputy Attorney
General, a group of independent consultants were asked to examine the operations in New Mexico public and
private prisons. The correctional consultants presented their evaluations in a report submitted to the Special
Advisory Group (Austin, Crane, Griego, O'Brien, & Vose, 2000). Some of the documented problems were
attributed to the New Mexico Department of Corrections, such as lack of surveillance of gang activities and
inequity in housing conditions between the public prisons and the more Spartan private prisons. Other problems
7To save space, Table 1 from this report was not included in this paper. The table can be requested fromthe authors as the full report has not been released by Congress.
6
were more likely to be found in the private prisons: problems with inadequate numbers of staff, inexperienced staff,
insufficiently trained staff (partly caused by difficulty in scheduling access to the state training academy), and
physical plant deficiencies in the facilities owned by WCC. Richard Crane argued that part of the problem in
operations at the two facilities originated with the complicated contractual arrangements between the Corrections
Department, the Counties of Guadalupe and Lea, and WCC. To quote Crane (Crane, 2000: 54): “In the end, the
complex contractual arrangements, the unclear facility missions, the need for prison beds, and the involvement of
too many agencies and individuals in negotiations, resulted in contracts which fall well short of industry standards
and create significant security, programmatic and fiscal implications for the State.”
The Clark and Austin et al. reports should not be taken as evidence of systemic problems in the private-prison
sector. By the very nature of the reports, they provided intensive case studies of the prisons within which specific
incidents occurred rather than a more general assessment of the ability of the private sector to operate safe and
efficient prisons. There is other evidence, though, that private sector prison operators continued to experience
problems in 1999. Accounts reported in the press suggest that the private sector prison providers had problems in
maintaining adequately trained and experienced staff resulting in inadequate security practices.
Camp and Gaes (2000) catalogued some of the more serious incidents at the private adult prisons that were
reported in the media for calendar year 1999.7 The information provided about recorded escapes is especially
pertinent for the present discussion. Both major companies, CCA and WCC, had inmate escapes at their adult
prisons in 1999. CCA had three escape incidents from the inside of secure facilities in 1999 in which four inmates
were able to breach the perimeter. CCA, and its subsidiary TransCor, also experienced escapes when inmates were
being transported, either to medical treatment or to a prison. There were four such incidents involving the
successful escapes of five inmates. WCC had two separate incidents in 1999 where one inmate in each incident was
able to successfully escape from inside of a secure prison. One of the WCC escapes was particularly relevant for the

8CSC subsequently lost the contract to operate this facility.
9Counting minimum-security inmates, the BOP held an even larger number of inmates than all inmatesheld in private-sector beds.
7
BOP as an inmate was able to escape from the Taft Correctional Institution, which is operated by WCC for the
BOP. Correctional Services Corporation (CSC) had significant problems with the McKinley County Detention
Center it operated in New Mexico. There were two separate escape incidents in which nine inmates were able to
escape from inside of the facility.8 The Management & Training Company (MTC) also had one escape in 1999 in
which three inmates were able to escape from inside of a secure prison.
In contrast to the number of inmate escapes from secure private correctional facilities, the BOP had one escape in
1999 from inside of a secure prison. This was the first escape from a secure BOP facility since 1996. The BOP,
with 80,800 inmates in secure prisons in July of 1999, was almost 17 percent larger than the combined inmate
populations of all private adult prisons in July of 1999.9 Taken together, private prisons had 18 inmates escape
from inside of secure prisons in 1999, and 5 inmates who were housed in secure prisons were able to escape while
they were being transported elsewhere.
Survey Design and Results
The Office of Research and Evaluation (ORE) at the Federal Bureau of Prisons, in conjunction with subject matter
experts within the BOP and the National Institute of Corrections (NIC), designed a survey that was administered
by Abt Associates to contract officials within agencies that utilized private prison bed space. Information was
collected for 91 of the 103 contracts identified, reflecting a response rate of 88 percent. The most systematic
sources of missing data in this report came from the District of Columbia and Puerto Rico. Three private facilities
were identified as holding inmates for the District, and none of the D.C. contract administrators responded to the
survey in time for inclusion into this report. None of the administrators identified for the four private facilities
holding Puerto Rican inmates responded to the survey. The other missing information on contracts was less

8
systematic. Information was not obtained for one of the nine contracts for California inmates, two of the four
contracts for Montana inmates, and two of the twenty contracts for Texas inmates.
While the survey was designed around three basic sections, selected results are reported from only one of the
sections. The information from the other two sections, on training and custody standards, did not prove as useful as
the data reported here. Generally speaking, private firms adopt the training and custody standards of the
contracting agency for whom they operate the prison. The section of the survey for which results are presented
covered three major areas: general characteristics of the prison and staff, information about the types of inmates
housed at the prison, and data about the types of inmate misconduct experienced at the prison. The information
collected on staff was very interesting to us because many of the most controversial issues in the use of private
prisons pertain to staff issues. Despite the controversy surrounding these issues, little systematic information has
been collected and reported to date.
Two of the most important dimensions in any comparison between private and public prisons are the security level
of the inmates and the security level of the prison. Most prison systems house their inmates in secure facilities, and
private prisons within these jurisdictions follow this general practice. The BOP houses a substantial number of
inmates in minimum-security facilities that, unlike most other public and private prisons, do not have a secure
perimeter. Primarily, the decision to exclude these non-secure BOP facilities from these analyses was made because
an escape from a secure facility is not the same as a “walkaway” from a non-secure prison.
The private sector is further
advantaged in the comparisons because the private sector held much lower numbers of high- or maximum-security
inmates than the BOP. Even with these caveats, this comparison strategy is the least confusing approach. At the
time of this survey, the Bureau of Prisons held 21,668 inmates in minimum-security prison camps, representing

9
about 20 percent of inmates confined by the BOP, when detention centers, medical centers, and halfway houses are
excluded.
Before collecting the data, the plan was to test whether staff instability is associated with higher rates of
misconduct in prisons. While it was never expected that all types of inmate misconduct could be analyzed,
especially rare forms of misconduct, it seemed plausible that the data would support a regression analysis of
random hit rates for drug use, using custody staff separation as an independent variable as well as prison activation
status, prison size, and security level as independent variables. This analysis was not feasible, though, because of
the confounding in the data between the BOP, the private sector, and separation rates. Almost all of the institutions
with a separation rate that was less than 10 percent (and corresponding low drug hit rate as well) were BOP
institutions, and all of the prisons with a separation rate greater than 10 percent were private prisons. Given this,
separation would have served as a proxy for identifying BOP and private sector prisons and not staff instability
alone.
Given the problem with including staff instability in multivariate models, the current study reports univariate
results and interprets the implications of the empirical findings. Some of the data provide context such as
information on gender and staff-to-inmate ratios. The other variables are indicators of potential systemic effects
associated with prison performance.
As shown below, the survey data presented in this paper show that privately operated prisons used more custody
staff, had much higher separation rates for correctional officers, had much higher escape rates from secure
institutions, and much higher random drug hit rates than the Bureau of Prisons. The homicide rate appeared to be
comparable between the private prisons and the BOP, and assault rates could not be effectively compared.
10Inferential statistics are not used in this study because the data are for a census of all private prisons inthe U.S. and U.S. territories. While there were some missing data, the data collected still could not be treated as asample.
11The BOP actually uses a different terminology. Rather than maximum, the BOP uses high security torefer to its highest security prisoners. The more familiar term “maximum” is used in this report.
12The 1998 Corrections Yearbook also reports inmate to staff ratios for correctional officers and totalinstitution staff. Those ratios were converted to the number of staff per 100 inmates so the numbers werecompatible with this report. In 1997, there were 17.9 correctional officers per 100 inmates and 32.3 total staff per100 inmates averaging across all jurisdictions. Since the data were not reported by security level, and highersecurity prisons tend to have higher staffing levels, it was not possible to compare the average state staffing ratiosto those computed for the private sector in this report.
10
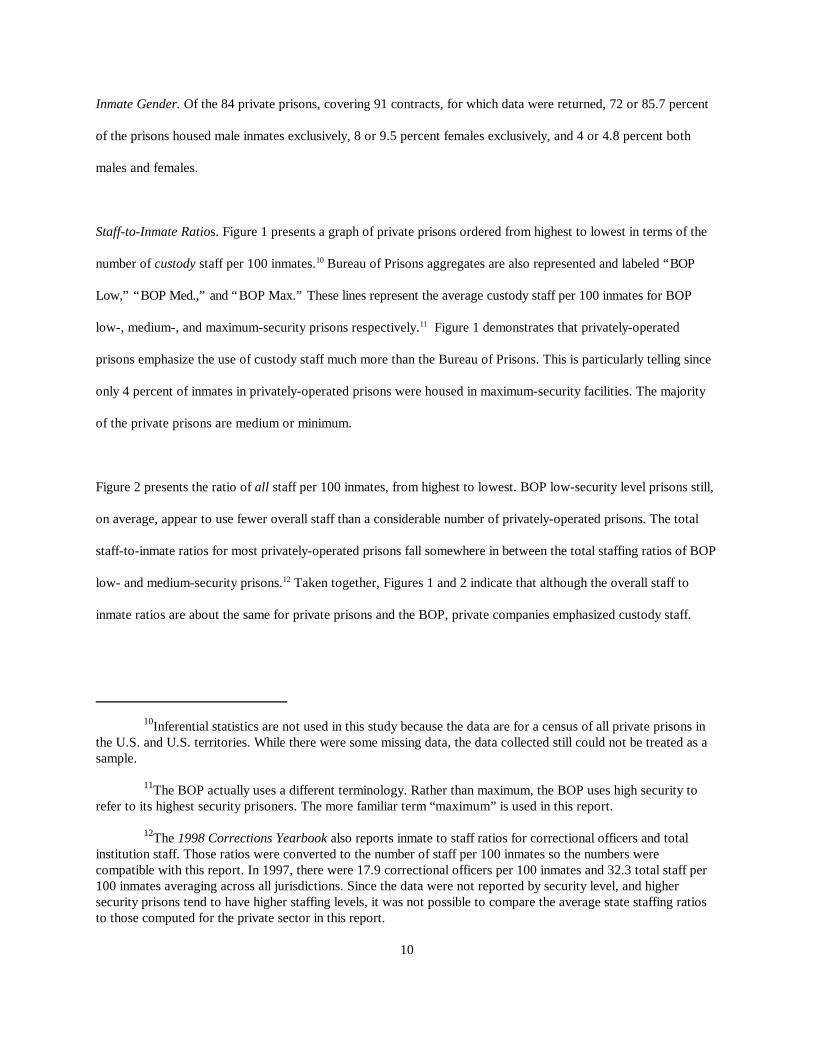
Inmate Gender. Of the 84 private prisons, covering 91 contracts, for which data were returned, 72 or 85.7 percent
of the prisons housed male inmates exclusively, 8 or 9.5 percent females exclusively, and 4 or 4.8 percent both
males and females.
Staff-to-Inmate Ratios. Figure 1 presents a graph of private prisons ordered from highest to lowest in terms of the
number of custody staff per 100 inmates.10 Bureau of Prisons aggregates are also represented and labeled “BOP
Low,” “BOP Med.,” and “BOP Max.” These lines represent the average custody staff per 100 inmates for BOP
low-, medium-, and maximum-security prisons respectively.11 Figure 1 demonstrates that privately-operated
prisons emphasize the use of custody staff much more than the Bureau of Prisons. This is particularly telling since
only 4 percent of inmates in privately-operated prisons were housed in maximum-security facilities. The majority
of the private prisons are medium or minimum.
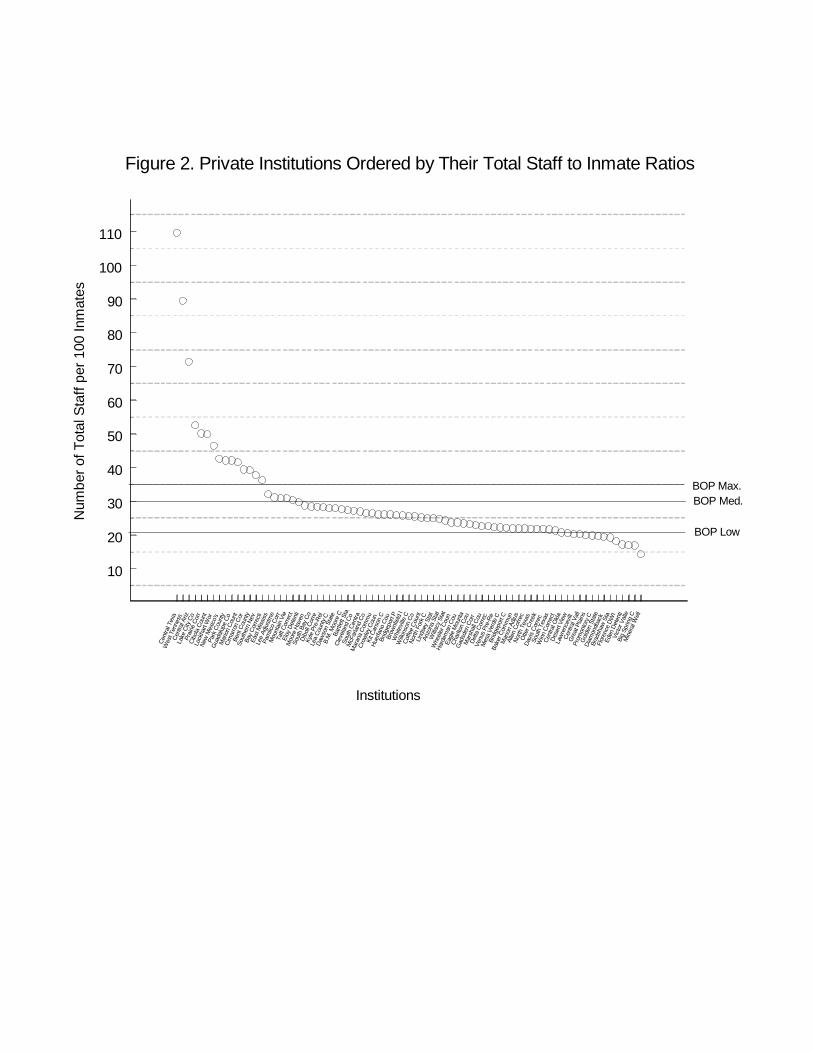
Figure 2 presents the ratio of all staff per 100 inmates, from highest to lowest. BOP low-security level prisons still,
on average, appear to use fewer overall staff than a considerable number of privately-operated prisons. The total
staff-to-inmate ratios for most privately-operated prisons fall somewhere in between the total staffing ratios of BOP
low- and medium-security prisons.12 Taken together, Figures 1 and 2 indicate that although the overall staff to
inmate ratios are about the same for private prisons and the BOP, private companies emphasized custody staff.
13Job separations in the BOP include resignations and terminations as well as retirements. Although theprivate sector separations may include retirements, it is likely that the numbers of retirements in the private sectorwere fairly low.
11
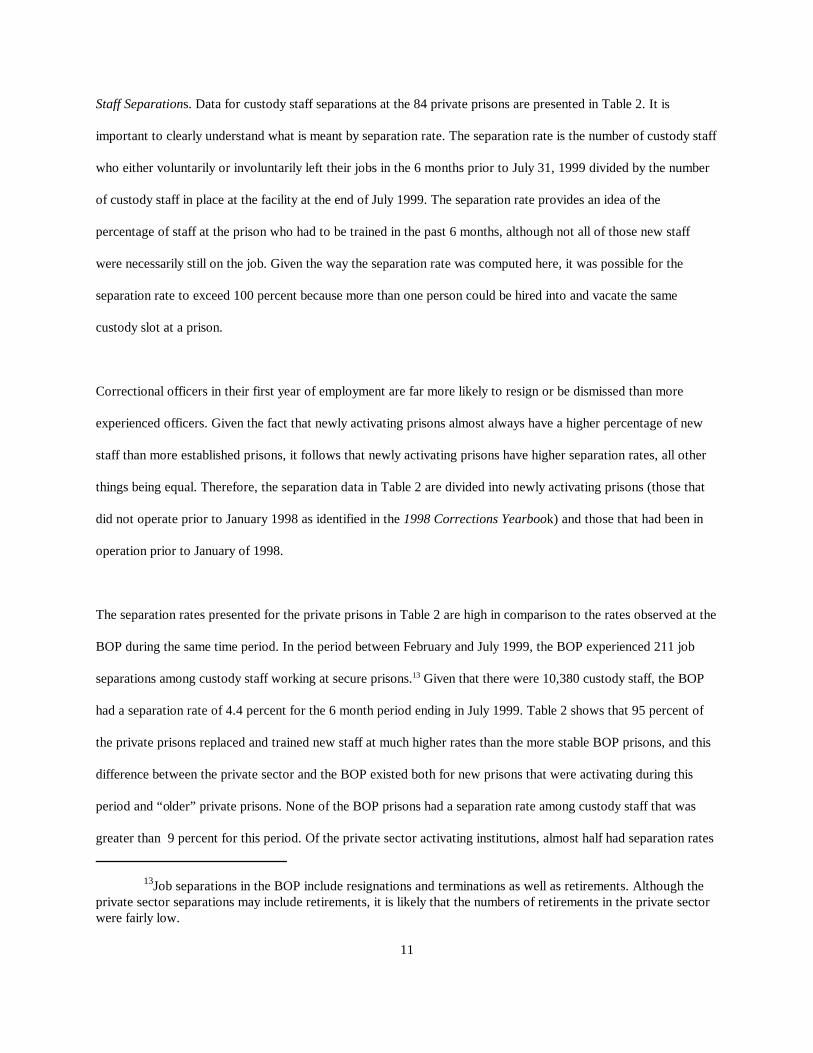
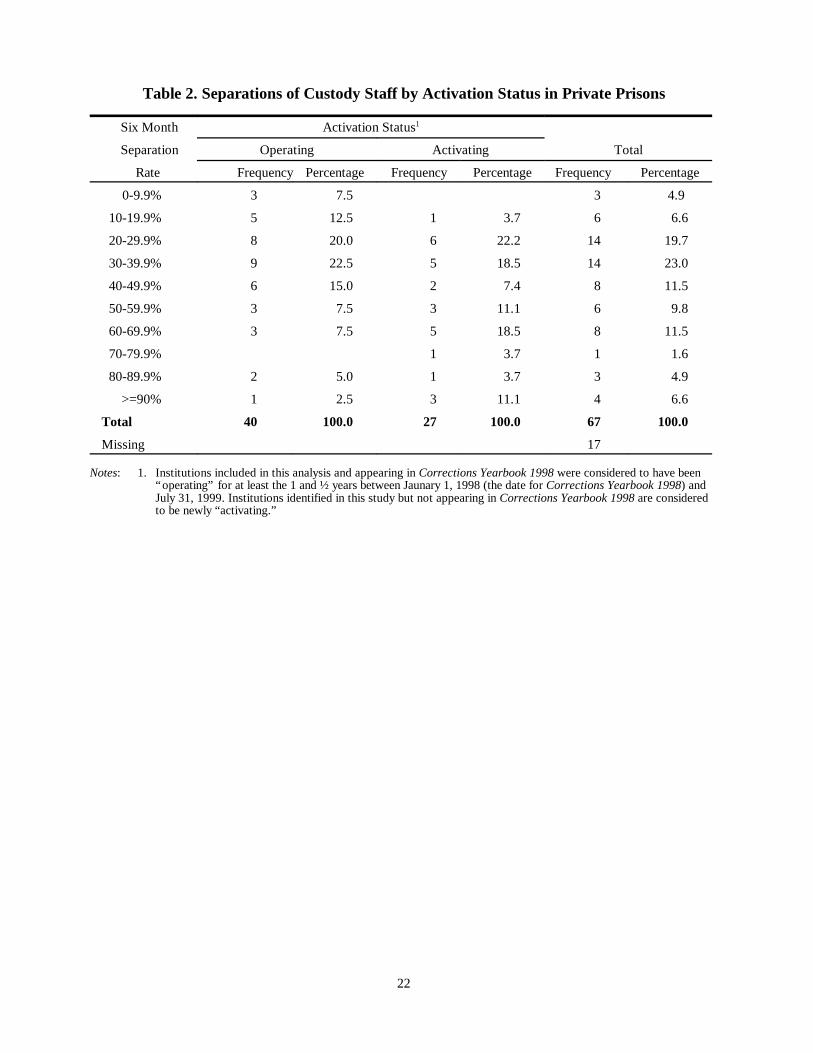
Staff Separations. Data for custody staff separations at the 84 private prisons are presented in Table 2. It is
important to clearly understand what is meant by separation rate. The separation rate is the number of custody staff
who either voluntarily or involuntarily left their jobs in the 6 months prior to July 31, 1999 divided by the number
of custody staff in place at the facility at the end of July 1999. The separation rate provides an idea of the
percentage of staff at the prison who had to be trained in the past 6 months, although not all of those new staff
were necessarily still on the job. Given the way the separation rate was computed here, it was possible for the
separation rate to exceed 100 percent because more than one person could be hired into and vacate the same
custody slot at a prison.
Correctional officers in their first year of employment are far more likely to resign or be dismissed than more
experienced officers. Given the fact that newly activating prisons almost always have a higher percentage of new
staff than more established prisons, it follows that newly activating prisons have higher separation rates, all other
things being equal. Therefore, the separation data in Table 2 are divided into newly activating prisons (those that
did not operate prior to January 1998 as identified in the 1998 Corrections Yearbook) and those that had been in
operation prior to January of 1998.
The separation rates presented for the private prisons in Table 2 are high in comparison to the rates observed at the
BOP during the same time period. In the period between February and July 1999, the BOP experienced 211 job
separations among custody staff working at secure prisons.13 Given that there were 10,380 custody staff, the BOP
had a separation rate of 4.4 percent for the 6 month period ending in July 1999. Table 2 shows that 95 percent of
the private prisons replaced and trained new staff at much higher rates than the more stable BOP prisons, and this
difference between the private sector and the BOP existed both for new prisons that were activating during this
period and “older” private prisons. None of the BOP prisons had a separation rate among custody staff that was
greater than 9 percent for this period. Of the private sector activating institutions, almost half had separation rates

12
that exceeded 50 percent of their staff. Even among private institutions that had been established, 22.5 percent had
separation rates that exceeded 50 percent in a 6 month period.
Staff separations for state jurisdictions is also reported in the 1998 Corrections Yearbook. The average percentage
separations of correctional officers for all reporting states was 14.9 percent for the entire year. To adjust this
percentage to be comparable with the six-month period used in the survey conducted for this analysis, it was
assumed that separations are constant throughout the year. Then approximately 7.5 percent of correctional officers,
on average, separate from the state corrections agencies in a six-month period. It is not clear whether the
separation rates reported for correctional officers in the 1998 Corrections Yearbook include retirements. These
separation percentages, whether for correctional officers or all staff, are lower than most of the private prison
separation percentages noted in Table 2.
Drug Misconduct. One of the most reliable indicators of prison operations is the rate at which inmates test positive
for the use of drugs and alcohol. If substance use is prevalent, it indicates a pattern of poor security practices within
an institution. Random drug testing provides a snapshot of the extent of a banned activity in the general
population. For other types of prison misconduct, the data include typically only those behaviors known or
recognized by the prison administration, and what is “known” is subject to many types of influence including the
seriousness of the offense (most prison homicides are presumably known, whereas this is not as likely for less
serious offenses) and the efficacy of prison control measures.
Of the 91 contracts for which information was provided, 74 required that the private sector vendor conduct random
urinalysis tests of the inmates. For the 17 contracts where random drug testing was not required under the contract,
7 were with vendors who performed random drug tests anyway. This meant that for 81 of the 91 contracts, random
drug testing was conducted on the inmates covered.
14Twenty-seven contract administrators failed to respond to this question.
13
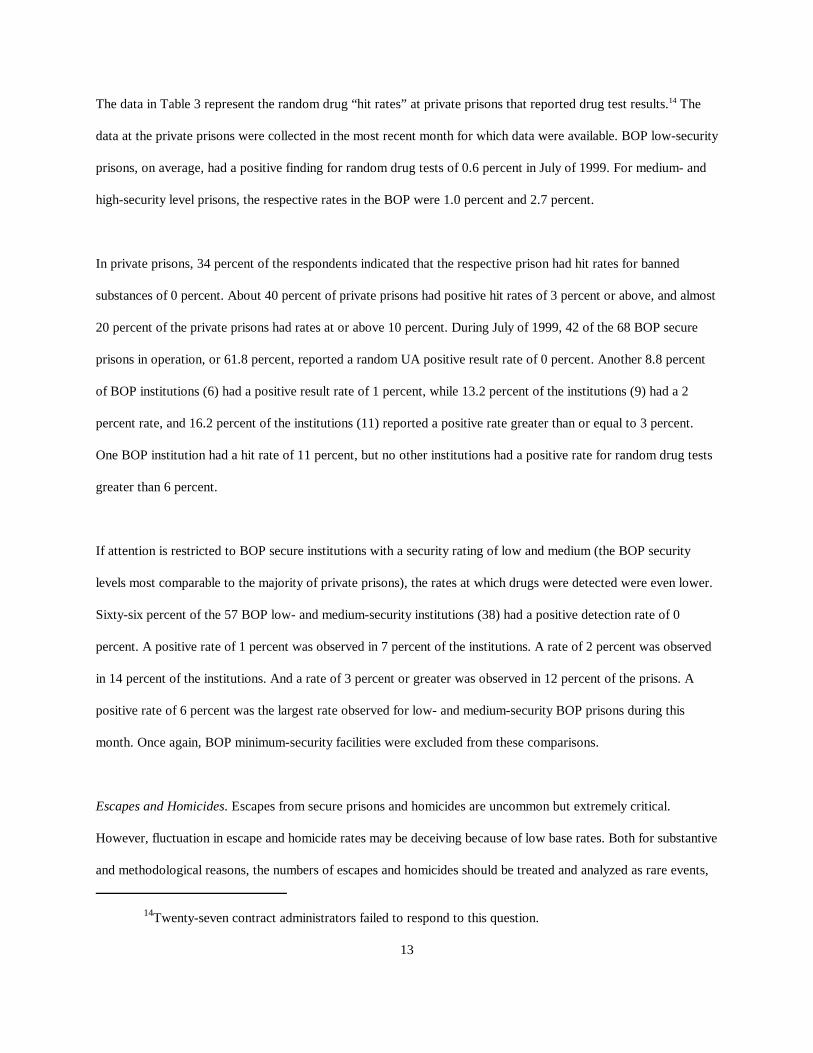
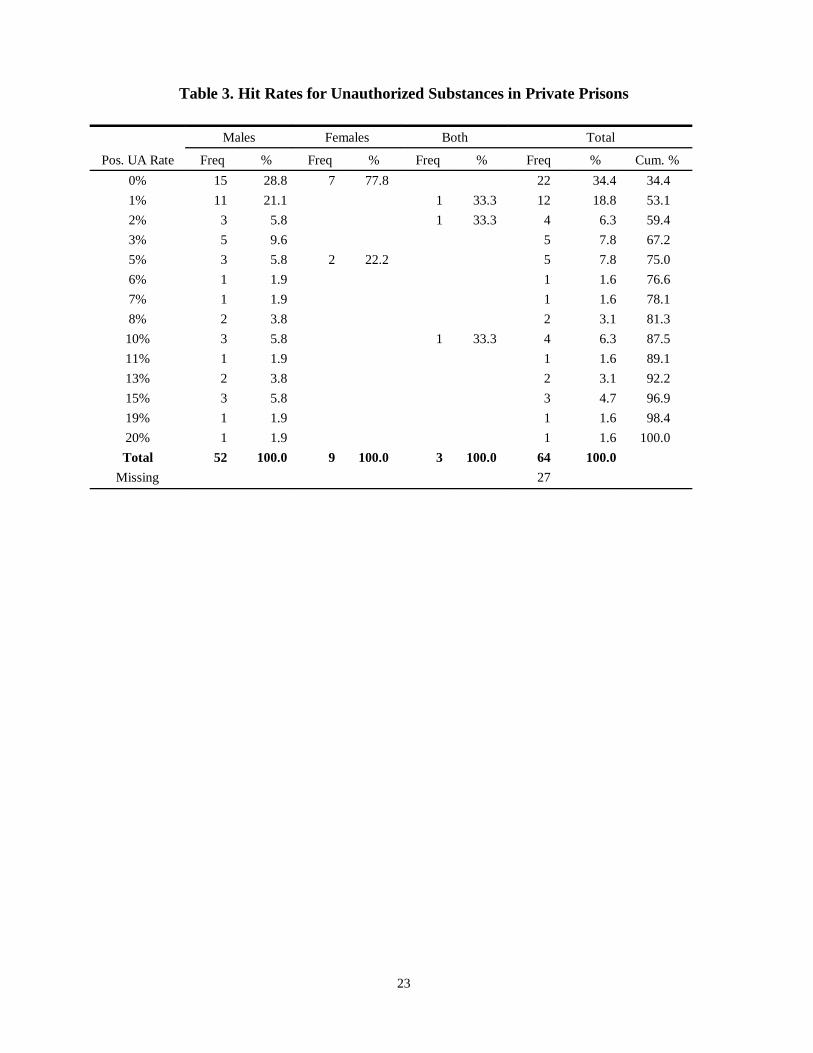
The data in Table 3 represent the random drug “hit rates” at private prisons that reported drug test results.14 The
data at the private prisons were collected in the most recent month for which data were available. BOP low-security
prisons, on average, had a positive finding for random drug tests of 0.6 percent in July of 1999. For medium- and
high-security level prisons, the respective rates in the BOP were 1.0 percent and 2.7 percent.
In private prisons, 34 percent of the respondents indicated that the respective prison had hit rates for banned
substances of 0 percent. About 40 percent of private prisons had positive hit rates of 3 percent or above, and almost
20 percent of the private prisons had rates at or above 10 percent. During July of 1999, 42 of the 68 BOP secure
prisons in operation, or 61.8 percent, reported a random UA positive result rate of 0 percent. Another 8.8 percent
of BOP institutions (6) had a positive result rate of 1 percent, while 13.2 percent of the institutions (9) had a 2
percent rate, and 16.2 percent of the institutions (11) reported a positive rate greater than or equal to 3 percent.
One BOP institution had a hit rate of 11 percent, but no other institutions had a positive rate for random drug tests
greater than 6 percent.
If attention is restricted to BOP secure institutions with a security rating of low and medium (the BOP security
levels most comparable to the majority of private prisons), the rates at which drugs were detected were even lower.
Sixty-six percent of the 57 BOP low- and medium-security institutions (38) had a positive detection rate of 0
percent. A positive rate of 1 percent was observed in 7 percent of the institutions. A rate of 2 percent was observed
in 14 percent of the institutions. And a rate of 3 percent or greater was observed in 12 percent of the prisons. A
positive rate of 6 percent was the largest rate observed for low- and medium-security BOP prisons during this
month. Once again, BOP minimum-security facilities were excluded from these comparisons.
Escapes and Homicides. Escapes from secure prisons and homicides are uncommon but extremely critical.
However, fluctuation in escape and homicide rates may be deceiving because of low base rates. Both for substantive
and methodological reasons, the numbers of escapes and homicides should be treated and analyzed as rare events,
14
but escapes and homicides are often analyzed with standard statistical techniques (see for example Archambeault
& Deis, 1996).
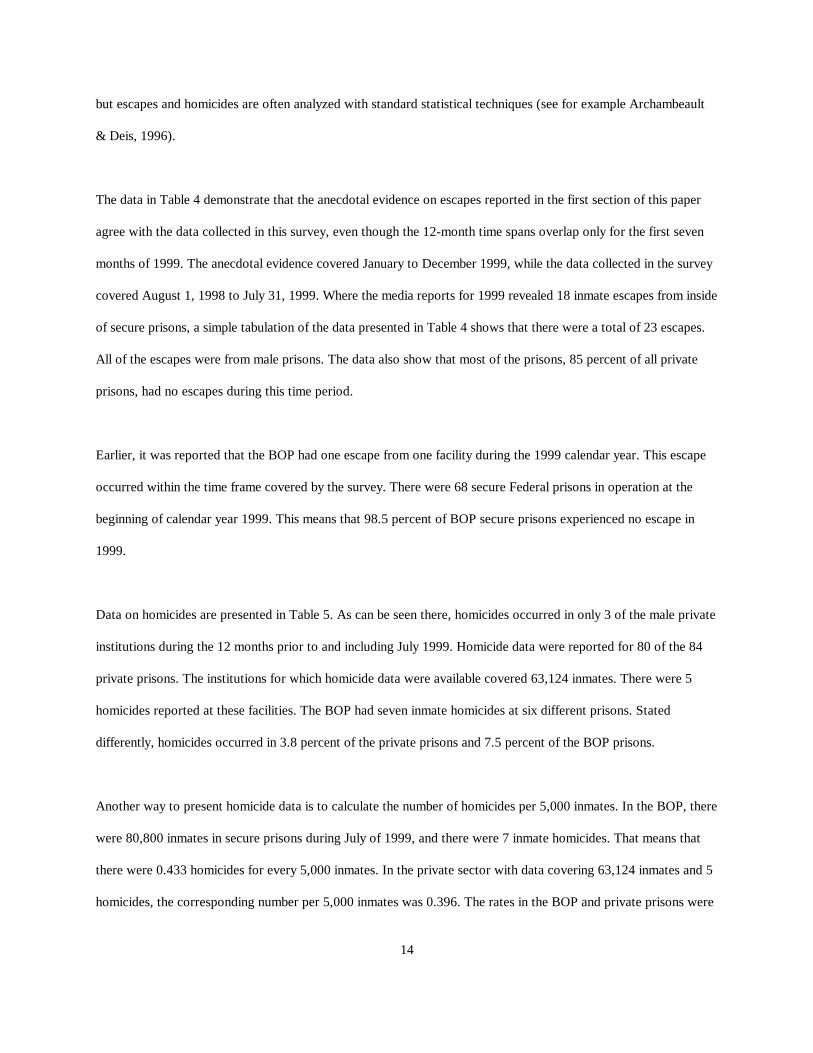
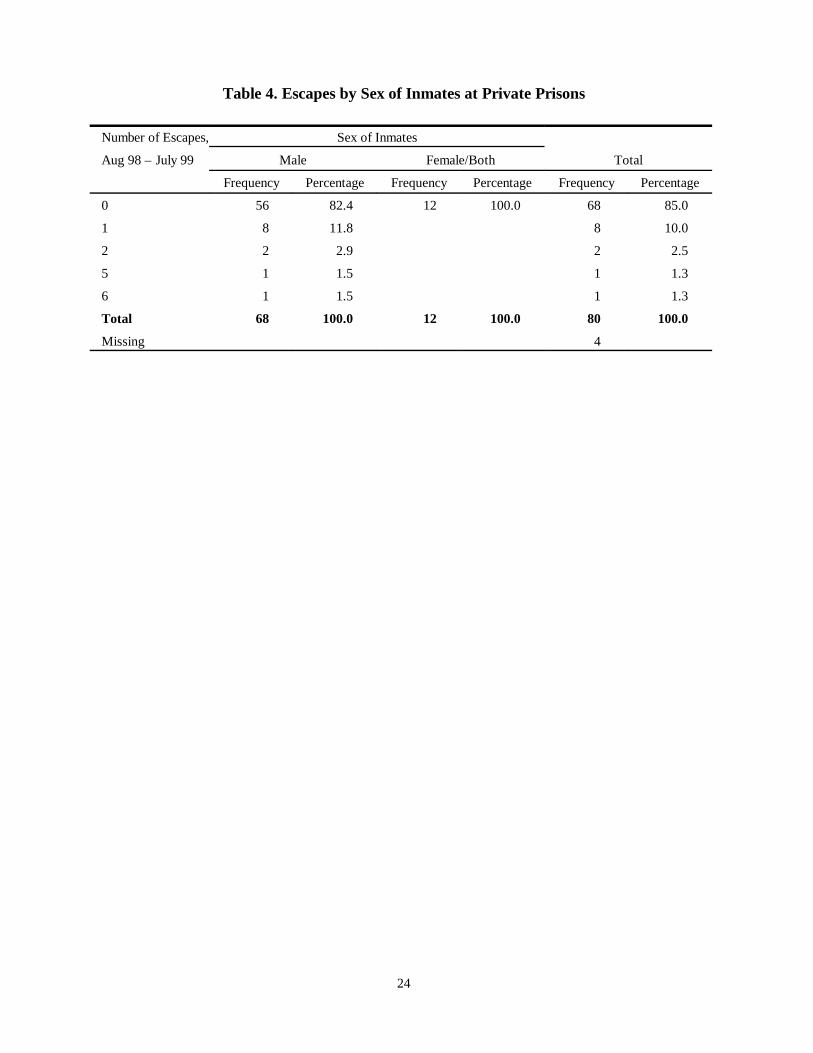
The data in Table 4 demonstrate that the anecdotal evidence on escapes reported in the first section of this paper
agree with the data collected in this survey, even though the 12-month time spans overlap only for the first seven
months of 1999. The anecdotal evidence covered January to December 1999, while the data collected in the survey
covered August 1, 1998 to July 31, 1999. Where the media reports for 1999 revealed 18 inmate escapes from inside
of secure prisons, a simple tabulation of the data presented in Table 4 shows that there were a total of 23 escapes.
All of the escapes were from male prisons. The data also show that most of the prisons, 85 percent of all private
prisons, had no escapes during this time period.
Earlier, it was reported that the BOP had one escape from one facility during the 1999 calendar year. This escape
occurred within the time frame covered by the survey. There were 68 secure Federal prisons in operation at the
beginning of calendar year 1999. This means that 98.5 percent of BOP secure prisons experienced no escape in
1999.
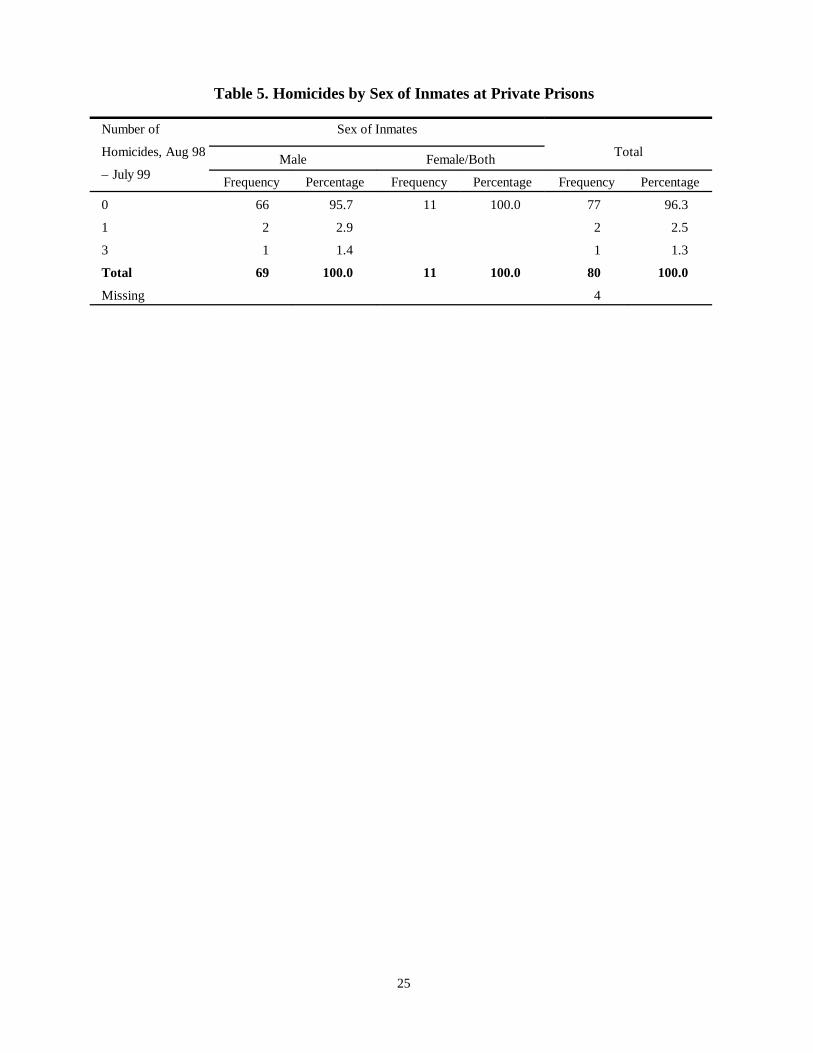
Data on homicides are presented in Table 5. As can be seen there, homicides occurred in only 3 of the male private
institutions during the 12 months prior to and including July 1999. Homicide data were reported for 80 of the 84
private prisons. The institutions for which homicide data were available covered 63,124 inmates. There were 5
homicides reported at these facilities. The BOP had seven inmate homicides at six different prisons. Stated
differently, homicides occurred in 3.8 percent of the private prisons and 7.5 percent of the BOP prisons.
Another way to present homicide data is to calculate the number of homicides per 5,000 inmates. In the BOP, there
were 80,800 inmates in secure prisons during July of 1999, and there were 7 inmate homicides. That means that
there were 0.433 homicides for every 5,000 inmates. In the private sector with data covering 63,124 inmates and 5
homicides, the corresponding number per 5,000 inmates was 0.396. The rates in the BOP and private prisons were
15
close to one another. The slightly higher BOP number may well be related to the fact that the BOP confines
significantly more high-security inmates. In fact, only 3 of the 7 homicides occurred at a low- or a medium-security
prison during this 12 month period. Since there were 68,541 inmates in these facilities, the corresponding
homicide number per 5,000 inmates was 0.219, a figure lower than that observed for the private prisons.
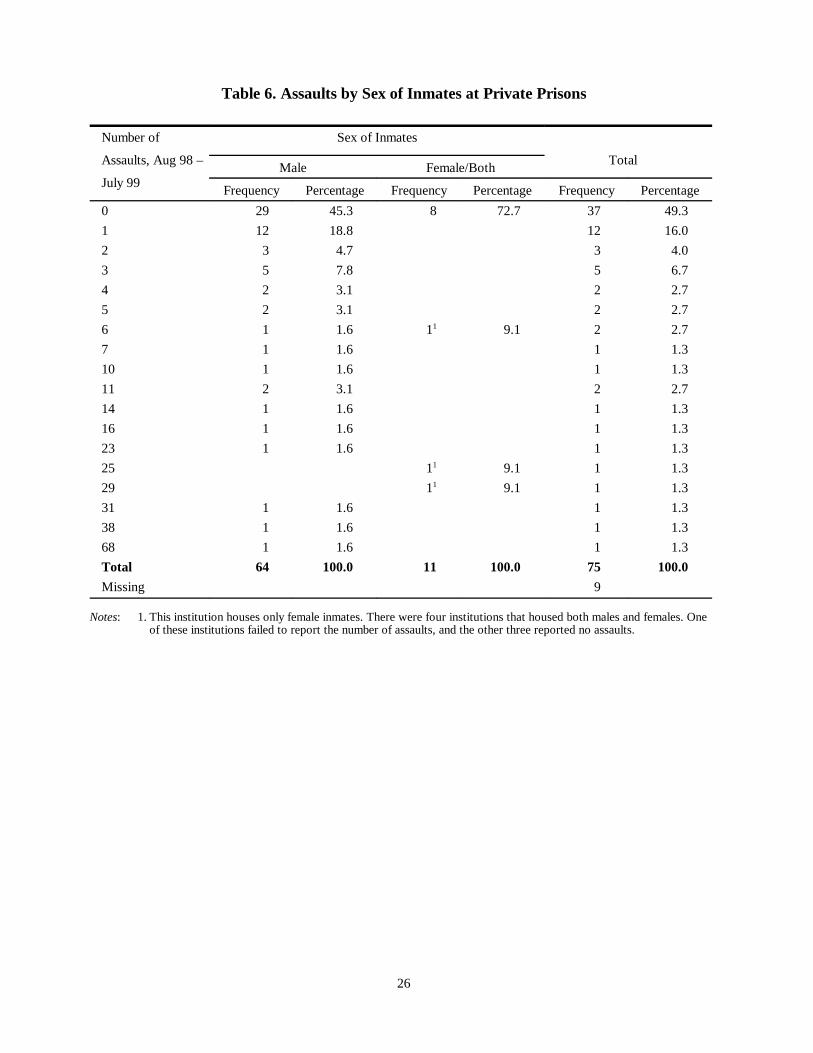
Assaults. Cross-jurisdictional comparisons of assaults are difficult to make. Jurisdictions use different reporting
conventions and different definitions to distinguish simple and aggravated assaults. The data for serious assaults in
the 12 months prior to and including July 1999 are presented in Table 6. Thirty-eight of the 75 private prisons, or
slightly over half, reported that at least one serious assault had occurred over the course of 12 months. In all, there
were 346 serious assaults reported at private prisons. Computed as a rate, since there were 63,124 inmates for
whom assaults were reported, the rate of assaults was 27.4 per 5,000 inmates in the private prisons. In the BOP for
this time period, there were 267 assaults by inmates on another inmate where a weapon was used. There were an
additional 730 assaults of an inmate by an inmate where a weapon was not used. Again, many of the assaults
occurred at high-security BOP prisons. When high-security prisons are excluded, there were 143 assaults on
another inmate with a weapon and 548 assaults where a weapon was not used.
There is no direct correspondence between the survey question on serious assaults and the data the BOP collects on
inmate assaults. The private sector serious assault rate of 27.4 per 5,000 inmates is higher than the BOP assault
rate when only assaults involving a weapon are chosen. This is true whether the comparison is based on all secure
BOP prisons (rate of 16.5 assaults per 5,000) or whether the comparison is based on low and medium security BOP
institutions (rate of 10.4 assaults per 5,000). If, on the other hand, all serious assaults are compared (with or
without a weapon), then the BOP rate is higher than the private sector, whether based on all secure BOP prisons
(rate of 45.2 assaults per 5,000) or only low and medium security prisons (rate of 40.0 assaults per 5,000). Whether
the private sector’s serious assault rate was higher or lower than the BOP’s serious assault rate is ambiguous. The
information for making this comparison is not complete.
16
Discussion and Conclusion
Privately operated prisons appear to have systemic problems in maintaining secure facilities. The data on inmate
escapes and random urinalysis are important indicators that signal a host of issues. Escapes are rare events in any
prison system. However, an escape usually signals failures in multiple levels of security procedures such as a
failure by the perimeter patrol, a failure to discover escape contraband, a failure to gather intelligence, and a failure
to monitor and secure potential escape routes. Contraband drugs may also signal the occurrence of many failures,
including an inability to monitor the visiting room, inmates on gate passes, and inmate mail. It also may signal a
lack of sophistication in the ability to gather intelligence information. These failures can reflect problems in policy
and procedures, in technology, and in staff capabilities. The “greener” the workforce, the more likely there will be
lapses in these fundamental security procedures. The “greenness” of the workforce may pertain not only to line
staff, but to mid-level supervisory staff as well. These are the managers who oversee line staff, monitor procedures,
set policy, and provide the training. The next study involving staff issues should evaluate not only the experience
level and training level of line staff, but of the mid-level managers as well.
The present discussion is fundamentally a theoretical explanation as to why privately operated prisons have
problems in maintaining basic security procedures. The evidence is that these companies did have a high
separation rate. Separation rates at private prisons were typically higher than those of the BOP and state public-
sector prisons. Given the apparent relationship between staff separations, staff experience, and inmate misconduct,
private companies must either adopt a new innovative strategy towards corrections, or they will have to increase
pay and/or benefits to attract and retain experienced employees. Advocates of prison privatization have argued that
private prisons can pay workers less, offer fewer benefits, and still deliver a product that is as good or better than
that provided by the public sector. The evidence to date contradicts such an encompassing assertion.
There are at least three essential ways private companies can innovate with respect to fundamental security
routines. They can substitute technology for human intervention. They can redesign the job so that line staff are

17
more fungible and less skill is required. They can improve training so that staff acquire professional skills more
quickly. At the heart of the problem is the role of the correctional worker. Can the private companies find a way to
pay these workers less, yet still maintain adequate skill levels or at least skill levels supplemented by technology?
To date, the overall answer to this question is no, but there may be instances of successes in the private-sector that
are deserving of closer analysis on a case-by-case basis.
This study represents one of only a few attempts to systematically collect data on an institution by institution basis
and then compare privately and publicly operated prisons. While the data indicate that there seem to be systemic
problems in the operation of private sector prisons, there are several caveats that should be considered regarding
the source of the information, the comparison to the BOP, and the aggregate analysis of private companies. Let us
explain.
First, most of the data from this survey were reported by contract monitors within the jurisdiction that contracted
for the private beds. While there is no reason to necessarily suppose that these individuals biased the data in any
way, the reader should at least be aware of the source of the information.
Secondly, most of the comparisons in this paper were to the Federal Bureau of Prisons. In part, this comparison to
the BOP arose from the original request from Congress, and some could argue that such a comparison is
unwarranted as the contrasts should be between state systems and the private prisons. Actually, there is one very
important reason why the Bureau of Prisons is an appropriate point of reference. The private adult prisons exist in
most regions of the country, and by comparing the private companies together against the federal system that also
has prisons in every region, regional differences may be muted.
Lastly, one could argue that each private company should be considered on its own merits and that it is unfair to
treat the companies by lumping then all together. Strictly speaking, the private sector was dominated by two
companies at the time of this survey, Corrections Corporation of America and Wackenhut Corrections Corporation.
18
Although inmate escape problems at specific companies were singled out, and two case studies were noted, one
involving CCA and the other WCC, the present study primarily focused on the performance of private entities as a
whole. A statistical model of random urinalysis hit rates in a general linear model would have allowed for drawing
conclusions about the functional relationship between staff separations and drug hit rates as an indicator of
security. In that model, it would have been possible to test for differences between the BOP, CCA, WCC, and other
private companies while looking at the relationship between staff separation, activation status, prison size, security
level, and hit rates. Unfortunately, the exploratory data analysis reported above suggested that most of the low hit
rates and separation rates were among BOP facilities, and most of the high hit rates and separation rates were
among the private companies. This confounding of the data limited the usefulness of such an analysis.
While the overall conclusion is that many private prisons had serious problems during the time period of the study,
it is not fair to paint all privately-operated prisons with the same brush. By the very nature of the data, the focus
upon average performance obscures that some private prisons were operating effectively. These success stories need
better documentation than was provided here so that the public sector can learn how to increase the odds of
successful contracting for private prisons. If public sector agencies are to remain committed to privately operated
prisons, public agencies need to be cognizant of staffing problems, and they need to provide incentives to help
private-sector companies develop a more stable workforce. The data presented here indicate that less costly workers
in private prisons have not produced an acceptable level of public safety or inmate care to date. By focusing on the
public sector, it is not the intention of the authors of this paper to offer an excuse for the operating problems in
private-sector prisons and the inability of private operators to attract and retain qualified workers. Rather, the
analysis draws attention to apparent differences in philosophy regarding staff in the public and private sectors and
the possible implications these differences have for quality of care and public safety. While data such as that
provided here can be used to support a position in the polemic for or against private prisons, it is far more
important that the debate center around designing policy to insure the successful operations of prisons, whether
public or private.

Institutions
Cen
tral T
exa
Wes
t Ten
ness
Eloy
Det
enti
Gua
dalu
pe C
oC
entra
l Ariz
Prai
rie C
orr
Mar
ion
Cou
ntLa
ke C
ity C
oPa
rk C
ount
yLo
ckha
rt W
orC
imar
ron
Cor
Cib
ola
Cou
ntBe
nt C
ount
yTa
ft C
orre
ctBa
y C
orre
cti
Pam
lico
Cor
rM
ount
ain
Vie
Wilk
inso
n C
oSo
uthe
rn N
evLe
e Ad
just
me
New
Mex
ico's
East
Miss
issM
cFar
land
Co
Daw
son
Stat
eC
harlt
on C
ouBa
rtlet
t Sta
Lea
Cou
nty
CC
offe
e C
ount
Sout
h C
entra
Moo
re H
aven
Cle
vela
nd C
oSo
uth
Bay
Co
Willa
cy S
tat
Har
dem
an C
ouAl
len
Cor
rec
Des
ert V
iew
Cen
tral V
all
Whi
tevi
lle C
Win
n C
orre
ctLi
ndse
y St
atB.
M. M
oore
CW
heel
er C
oun
Cro
wle
y C
oun
Gol
den
Stat
eM
esa
Verd
e C
Nor
th F
ork
CBr
ownf
ield
ID
ibol
l Cor
reEa
gle
Mou
nta
Eden
Det
enti
Hue
rfano
Cou
Kyle
Pre
-Rel
Venu
s Pr
e-R
eBa
ker C
omm
unO
tter C
reek
Mar
shal
l Cou
Law
renc
evill
Brid
gepo
rt P
Arizo
na S
tat
Sout
h Te
xas
Gre
at P
lain
sBr
idge
port
CC
entra
l Okla
Dav
is C
orre
cVi
ctor
Val
leD
elta
Cor
rec
Brad
shaw
Sta
Dia
mon
dbac
kM
ario
n Ad
jus
Kit C
arso
n C
Nor
th T
exas
Mar
ana
Com
mu
Big
Sprin
g C
Gad
sden
Cor
rPr
omon
tory
CM
iner
al W
ell
Flor
ence
DW
I
0
10
20
30
40
50
60
70
80
Num
ber o
f Cus
tody
Sta
ff pe
r 100
Inm
ates
Figure 1. Private Institutions Ordered by Their Custody Staff to Inmate Ratios
BOP Max.
BOP Med.
BOP Low
Cen
tral T
exa
Wes
t Ten
ness
Cen
tral A
rizLa
ke C
ity C
oPr
airie
Cor
rC
ibol
a C
ount
Lock
hart
Wor
New
Mex
ico's
Park
Cou
nty
Gua
dalu
pe C
oM
ario
n C
ount
Cim
arro
n C
orBe
nt C
ount
ySo
uthe
rn N
evBa
y C
orre
cti
East
Miss
issLe
e Ad
just
me
Pam
lico
Cor
rM
ount
ain
Vie
Taft
Cor
rect
Eloy
Det
enti
Moo
re H
aven
Sout
h Ba
y C
oD
ibol
l Cor
reKy
le P
re-R
elLe
a C
ount
y C
Daw
son
Stat
eB.
M. M
oore
CBa
rtlet
t Sta
Cle
vela
nd C
oSo
uth
Cen
traM
cFar
land
Co
Mar
ana
Com
mu
Cro
wle
y C
oun
Kit C
arso
n C
Hue
rfano
Cou
Brid
gepo
rt P
Brow
nfie
ld I
Whi
tevi
lle C
Wilk
inso
n C
oC
offe
e C
ount
Nor
th F
ork
CLi
ndse
y St
atAr
izona
Sta
tW
illacy
Sta
t
Whe
eler
Cou
nH
arde
man
Cou
Eagl
e M
ount
aC
harlt
on C
ouG
adsd
en C
orr
Mar
shal
l Cou
Del
ta C
orre
cVe
nus
Pre-
Re
Mes
a Ve
rde
CBr
idge
port
CBa
ker C
omm
unM
ario
n Ad
jus
Alle
n C
orre
cN
orth
Tex
asO
tter C
reek
Dav
is C
orre
cSo
uth
Texa
sW
inn
Cor
rect
Cen
tral O
klaD
eser
t Vie
wLa
wre
ncev
illC
entra
l Val
lG
reat
Pla
ins
Prom
onto
ry C
Gol
den
Stat
eD
iam
ondb
ack
Brad
shaw
Sta
Flor
ence
DW
IEd
en D
eten
tiVi
ctor
Val
leBi
g Sp
ring
CM
iner
al W
ell
10
20
30
40
50
60
70
80
90
100
110
Num
ber o
f Tot
al S
taff
per 1
00 In
mat
es
Figure 2. Private Institutions Ordered by Their Total Staff to Inmate Ratios
BOP Max.BOP Med.
BOP Low
Institutions
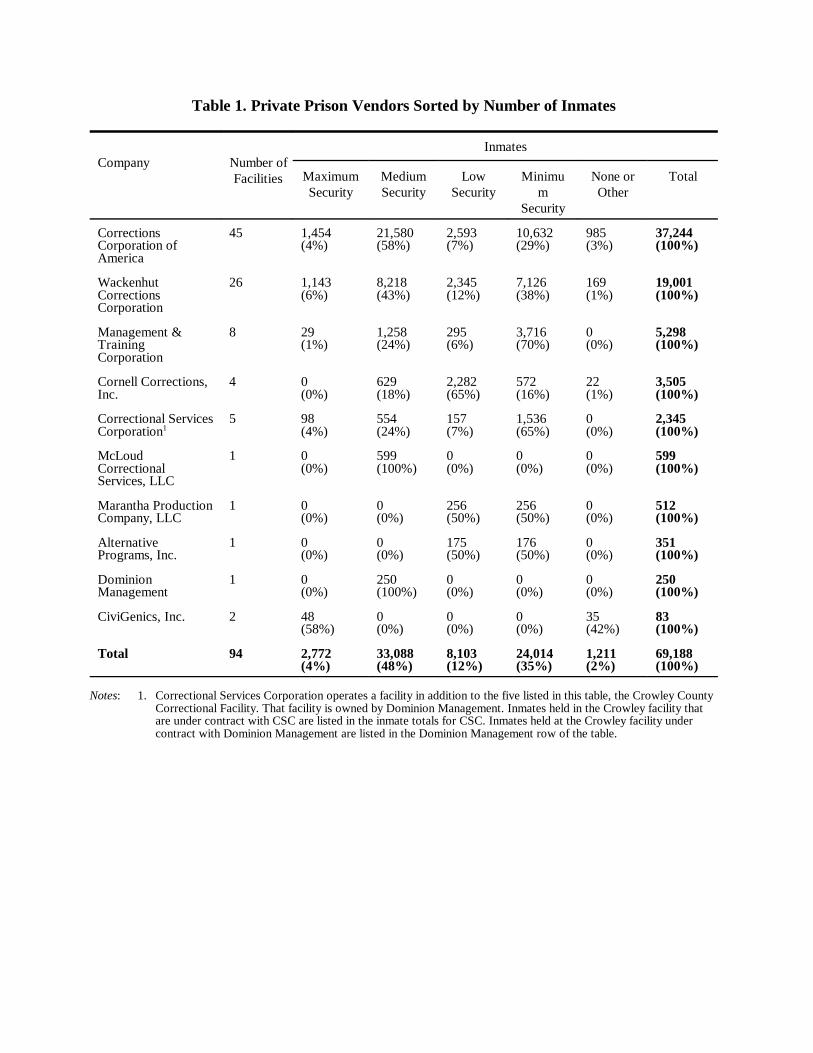
Table 1. Private Prison Vendors Sorted by Number of Inmates
Company Number ofFacilities
Inmates
MaximumSecurity
MediumSecurity
LowSecurity
Minimum
Security
None orOther
Total
CorrectionsCorporation ofAmerica
45 1,454(4%)
21,580(58%)
2,593(7%)
10,632(29%)
985(3%)
37,244(100%)
WackenhutCorrectionsCorporation
26 1,143(6%)
8,218(43%)
2,345(12%)
7,126(38%)
169(1%)
19,001(100%)
Management &TrainingCorporation
8 29(1%)
1,258(24%)
295(6%)
3,716(70%)
0(0%)
5,298(100%)
Cornell Corrections,Inc.
4 0(0%)
629(18%)
2,282(65%)
572(16%)
22(1%)
3,505(100%)
Correctional ServicesCorporation1
5 98(4%)
554(24%)
157(7%)
1,536(65%)
0(0%)
2,345(100%)
McLoudCorrectionalServices, LLC
1 0(0%)
599(100%)
0(0%)
0(0%)
0(0%)
599(100%)
Marantha ProductionCompany, LLC
1 0(0%)
0(0%)
256(50%)
256(50%)
0(0%)
512(100%)
AlternativePrograms, Inc.
1 0(0%)
0(0%)
175(50%)
176(50%)
0(0%)
351(100%)
DominionManagement
1 0(0%)
250(100%)
0(0%)
0(0%)
0(0%)
250(100%)
CiviGenics, Inc. 2 48(58%)
0(0%)
0(0%)
0(0%)
35(42%)
83(100%)
Total 94 2,772(4%)
33,088(48%)
8,103(12%)
24,014(35%)
1,211(2%)
69,188(100%)
Notes: 1. Correctional Services Corporation operates a facility in addition to the five listed in this table, the Crowley CountyCorrectional Facility. That facility is owned by Dominion Management. Inmates held in the Crowley facility thatare under contract with CSC are listed in the inmate totals for CSC. Inmates held at the Crowley facility undercontract with Dominion Management are listed in the Dominion Management row of the table.
22
Table 2. Separations of Custody Staff by Activation Status in Private Prisons
Six Month Activation Status1
Separation Operating Activating Total
Rate Frequency Percentage Frequency Percentage Frequency Percentage
0-9.9% 3 7.5 3 4.9
10-19.9% 5 12.5 1 3.7 6 6.6
20-29.9% 8 20.0 6 22.2 14 19.7
30-39.9% 9 22.5 5 18.5 14 23.0
40-49.9% 6 15.0 2 7.4 8 11.5
50-59.9% 3 7.5 3 11.1 6 9.8
60-69.9% 3 7.5 5 18.5 8 11.5
70-79.9% 1 3.7 1 1.6
80-89.9% 2 5.0 1 3.7 3 4.9
>=90% 1 2.5 3 11.1 4 6.6
Total 40 100.0 27 100.0 67 100.0
Missing 17
Notes: 1. Institutions included in this analysis and appearing in Corrections Yearbook 1998 were considered to have been“operating” for at least the 1 and ½ years between Jaunary 1, 1998 (the date for Corrections Yearbook 1998) andJuly 31, 1999. Institutions identified in this study but not appearing in Corrections Yearbook 1998 are consideredto be newly “activating.”
23
Table 3. Hit Rates for Unauthorized Substances in Private Prisons
Males Females Both Total
Pos. UA Rate Freq % Freq % Freq % Freq % Cum. %0% 15 28.8 7 77.8 22 34.4 34.41% 11 21.1 1 33.3 12 18.8 53.12% 3 5.8 1 33.3 4 6.3 59.43% 5 9.6 5 7.8 67.25% 3 5.8 2 22.2 5 7.8 75.06% 1 1.9 1 1.6 76.67% 1 1.9 1 1.6 78.18% 2 3.8 2 3.1 81.310% 3 5.8 1 33.3 4 6.3 87.511% 1 1.9 1 1.6 89.113% 2 3.8 2 3.1 92.215% 3 5.8 3 4.7 96.919% 1 1.9 1 1.6 98.420% 1 1.9 1 1.6 100.0Total 52 100.0 9 100.0 3 100.0 64 100.0
Missing 27
24
Table 4. Escapes by Sex of Inmates at Private Prisons
Number of Escapes,
Aug 98 – July 99
Sex of Inmates
Total Male Female/Both
Frequency Percentage Frequency Percentage Frequency Percentage
0 56 82.4 12 100.0 68 85.0
1 8 11.8 8 10.0
2 2 2.9 2 2.5
5 1 1.5 1 1.3
6 1 1.5 1 1.3
Total 68 100.0 12 100.0 80 100.0
Missing 4
25
Table 5. Homicides by Sex of Inmates at Private Prisons
Number of
Homicides, Aug 98
– July 99
Sex of Inmates
TotalMale Female/Both
Frequency Percentage Frequency Percentage Frequency Percentage
0 66 95.7 11 100.0 77 96.3
1 2 2.9 2 2.5
3 1 1.4 1 1.3
Total 69 100.0 11 100.0 80 100.0
Missing 4
26
Table 6. Assaults by Sex of Inmates at Private Prisons
Number of
Assaults, Aug 98 –
July 99
Sex of Inmates
Total Male Female/Both
Frequency Percentage Frequency Percentage Frequency Percentage0 29 45.3 8 72.7 37 49.31 12 18.8 12 16.02 3 4.7 3 4.03 5 7.8 5 6.74 2 3.1 2 2.75 2 3.1 2 2.76 1 1.6 11 9.1 2 2.77 1 1.6 1 1.310 1 1.6 1 1.311 2 3.1 2 2.714 1 1.6 1 1.316 1 1.6 1 1.323 1 1.6 1 1.325 11 9.1 1 1.329 11 9.1 1 1.331 1 1.6 1 1.338 1 1.6 1 1.368 1 1.6 1 1.3Total 64 100.0 11 100.0 75 100.0Missing 9
Notes: 1. This institution houses only female inmates. There were four institutions that housed both males and females. Oneof these institutions failed to report the number of assaults, and the other three reported no assaults.
27
References
Archambeault, W. G., & Deis, D. R. (1996). Cost Effectiveness Comparisons of Private Versus Public Prisons in
Louisiana: A Comprehensive Analysis of Allen, Avoyelles, and Winn Correctional Centers. Baton Rouge:
Louisiana State University.
Austin, J., & Coventry, G. (2001). Emerging Issues on Privatized Prisons. Washington, D.C.: Bureau of Justice
Assistance.
Austin, J., Crane, R., Griego, B., O'Brien, J., & Vose, G. A. (2000). The Consultants' Report on Prison Operations
in New Mexico Correctional Institutions.: Special Advisory Group.
Camp, C. G., & Camp, G. M. (1998). The Corrections Yearbook: 1998. Middletown, CT: Criminal Justice Institute.
Camp, S. D., & Gaes, G. G. (2000). Private Prisons in the United States, 1999: An Assessment of Growth,
Performance, Standards, and Training Requirements. Washington, D.C.: Federal Bureau of Prisons.
Clark, J. L. (1998). Report to the Attorney General: Inspection and Review of the Northeast Ohio Correctional
Center. Washington, D.C.: Office of the Corrections Trustee for the District of Columbia.
Crane, R. (2000). Monitoring of Guadalupe and Lea County Correctional Facilities. In J. Austin & R. Crane & B.
Griego & J. O'Brien & G. A. Vose (Eds.), The Consultants' Report on Prison Operations in New Mexico
Correctional Institutions.: Special Advisory Group.
Crants, D. R., III. (1991). Private Prison Management: A Study in Economic Efficiency. Journal of Contemporary
Criminal Justice, 7, 49-59.
General Accounting Office. (1996). Private and Public Prisons: Studies Comparing Operational Costs and/or
Quality of Service. Washington, D.C.: U.S. General Accounting Office.
Irwin, J. (1980). Prisons in Turmoil. Boston, MA: Little, Brown.
Jacobs, J. B. (1977). Statesville: The Penitentiary in Mass Society. Chicago: University of Chicago Press.
McDonald, D. C., Fournier, E., Russell-Einhorn, M., & Crawford, S. (1998). Private Prisons in the United States:
An Assessment of Current Practice. Boston, MA: Abt Associates Inc.
Moore, A. T. (1998). Private Prisons: Quality Corrections at a Lower Cost. Los Angeles, CA: Reason Public Policy
Institute.

28
Nelson, J. (1998). Comparing Public and Private Prison Costs. In D. McDonald & E. Fournier & M. Russell-
Einhorn & S. Crawford (Eds.), Private Prisons in the United States: An Assessment of Current Practice.
Boston: Abt Associates, Inc.
Shichor, D. (1995). Punishment for Profit: Private Prisons/Public Concerns. Thousand Oaks, CA: Sage.