Embed Size (px)
Citation preview
Border Effects and North American Economic Integration: Where Are We Now?
83
2
Serge Coulombe University of Ottawa
ABSTRACT
N THE FIRST PART OF THE STUDY, we review and discuss the recent evolution of the literature on border effects in light of Anderson and van Wincoop’s
(2001) proposed solution to the border puzzle. We argue that these authors have taken a critical step forward regarding the information contained in bor-der effect estimates. In the second part of the study, we estimate border effects for Canada and the ten provinces with a sample spanning the years 1981-2001. For most provinces and for Canada as a whole, the border effect on goods trade appears to have been declining steadily over the 1981-2000 period.
INTRODUCTION
ITH GLOBALIZATION and the gradual elimination of trade barriers, espe-cially among trading blocs of industrialized countries, the phlegmatic
observer might have been tempted to anticipate the emergence of a borderless world. The Canada-U.S. situation might even have been at the top of a list of case studies documenting this forecast. The two economies share many institu-tional, political, social, and cultural features. Goods and capital should flow freely across this border, a large part of which appears to be an artificial straight line drawn over the 49th parallel by an unimaginative geographer.
This is basically why McCallum’s 1995 study — stating that national bor-ders do matter a lot — drew so much attention from economists and policy makers. That result was very surprising and, for some, embarrassing. Some saw it as an economic puzzle that needed solving (Obstfeld and Rogoff, 2000;
I
W
COULOMBE
84
Grossman, 1998). Others took that conclusion very seriously and put in a lot of productive effort to illustrate its robustness and to document and analyze its policy implications (Helliwell, 1998).
The purpose of this study is twofold. First, we propose to look at the re-cent evolution of the literature on the border effect from the viewpoint of an outsider, a Canadian regional economist. We will argue that the recent trend of research in this area (Brown, 2003; Brown and Anderson, 2002; and particu-larly Anderson and van Wincoop, 2001) is likely to change the direction of the economic and policy debate on the subject. Recent studies use a newly released U.S. interstate trade database that unveils, in our view, a crucial new stylized fact: the effect of the Canada-U.S. border is a magnitude larger when measured with interprovincial trade data than with interstate trade data. The theoretical explanation for this stylized fact proposed by Anderson and van Wincoop (2001) is a decisive step toward solving the border effect puzzle. Using the theoretical model of resistance to trade developed by Anderson in 1979,1 Anderson and van Wincoop explain that most of the differences in border effect estimates calculated from the two databases can be attributed to the fact that the Canadian economy is considerably smaller than the U.S. economy [as measured by the gross domestic product (GDP)]. We will show, however, that this explanation of the border puzzle is incomplete because it does not incorporate the concepts of distance and density. As Brown (2003) phrased it, spatial structure matters. Second, we make use of well-known aggregate pro-vincial data on trade flows to indirectly estimate Canadian border effects for the 1981-2000 period. Border effects are usually estimated using (more or less compatible) detailed North American regional data, but only for the 1988-96 period. Extending the period under study gives new insight into the time-trend evolution of Canadian border effects. For most provinces and for Canada as a whole, the border effect on goods trade appears to have been declining over the entire 1981-2000 period. This finding is likely to challenge the common wis-dom (Helliwell, 1998) that the decline of the border effect in the 1990s is observed only in the period following the introduction of the Free Trade Agreement (FTA) and that border effects have been stable ever since. This is not the case, however, for the border effects on services trade for which the FTA story appears to adequately capture time-series evidence.
In the second section, we briefly synthesize the origin and meaning of the border effect, starting from the gravity model of trade. In the third section, we analyze recent contributions that use the new interstate trade data and we closely examine the critical theoretical analysis proposed by Anderson and van Wincoop (2001). In the next section, we show how and why these authors’ focus on economic size is a shortcut that does not take into account other important factors such as distance and density. Brown (2003) has recognized the possible
BORDER EFFECTS AND NORTH AMERICAN ECONOMIC INTEGRATION
85
role of distance and density (the spatial structure) in explaining the differences in border effect estimates derived from interprovincial trade data and from interstate trade data. In the fifth section, we revisit two dominant interpreta-tions of the border effect in the light of the recent analysis. The sixth section contains our time-series extension on Canadian border effects for goods and for services. We conclude with a policy discussion in the final section.
THE BORDER EFFECT STORY
THE GRAVITY EQUATION
HE STARTING POINT FOR THE BORDER EFFECT DISCUSSION is the gravity equation, which has long been known for its strong fit with cross-country
international trade data (Tinbergen, 1962; Linneman, 1966). The simple form of the gravity equation relates trade between two countries i and j to the prod-uct of the GDP (Y) of both countries, divided by the distance between the two. More specifically, in the following gravity equation,
(1) ( ) d
cb
ijdistjYiAY
ijtrade)(
)()(= ,
b and c are the income elasticities of trade and d is the distance elasticity. Other variables, including the participation in trade blocs, might enter the gravity equation in a multiplicative way through parameter A. Equation (1) is usually tested with a multiplicative error term in the following linear logarith-mic form: (2) ln trade(ij) = a + b ln Yi + c ln Yj – d ln distij + εij .
The gravity relation was originally an empirical regularity, before it be-came an economic model. Anderson (1979) proposed a theoretical foundation for the gravity relation based on goods differenced by place of origin, a CES (constant elasticity of substitution) utility function, and distance being a proxy for transportation costs. Other theoretical frameworks were developed for grav-ity in the 1980s, notably works by Bergstrand (1985) and Helpman (1984).
The empirical regularity was slowly becoming the gravity model but it was not yet famous. It was the work of a Canadian economist, using newly released, unique Canadian regional trade data, that put the gravity model in the headlines in 1995. McCallum (1995) used the gravity model to compare interprovincial trade data with province-state trade data. He asked the question: Do borders matter? His answer was: Yes.
T
COULOMBE
86
MCCALLUM’S BORDER EFFECT
THE CENTRAL FINDING OF MCCALLUM’S FAMOUS STUDY is that testing regres-sion equation (2) with interprovincial trade data and province-state trade data for the year 1988 clearly underpredicts interprovincial trade by a substantial multiplicative factor. He estimated the following gravity equation: (3) ln trade(ij) = a + b ln Yi + c ln Yj – d ln distij + e DUMMYij + εij ,
where the dummy variable takes the value 1 for interprovincial trade and the value 0 for province-state trade. The point estimate of parameter e was around 3 and McCallum interpreted this as:
Other things equal, trade between two provinces is more than 20 times larger than trade between a province and a state [exp(3.09) = 22]. (p. 616)
The original Canadian data were the only ones for which the effect of
borders on trade could be tested directly, and only data for the year 1988 (pre-FTA) were available at the time. McCallum anticipated correctly at the end of his study that the FTA and NAFTA (North American Free Trade Agreement) would lead to a radical shift in regional and international trade patterns. The uniqueness of Canadian trade data made replication of McCallum’s findings with other detailed data banks impossible at the time. Nevertheless, McCallum concluded his famous study with a statement that suggests his results could be extended to borders in general:
The fact that even the relatively innocuous Canada-U.S. border contin-ues to have a decisive effect on continental trade patterns suggests that national borders in general continue to matter. (p. 622)
The border effect was born.
FURTHER ESTIMATES OF MCCALLUM’S BORDER EFFECTS
JOHN HELLIWELL TOOK MCCALLUM’S RESULT very seriously and subsequently produced a series of studies documenting, analyzing, and extending the border effect story of Canada-U.S. trade (Helliwell and McCallum, 1995; Helliwell, 1996, 1998). Overall, Helliwell’s research illustrates the robustness of McCallum’s finding, but it highlights the fact that the border effect tended to decrease rapidly following the FTA. Nevertheless, the parameter exp(e) in regression equation (3), using Statistics Canada data banks on interprovincial trade and province-state trade, remains large. There is no trick, no cheating.
BORDER EFFECTS AND NORTH AMERICAN ECONOMIC INTEGRATION
87
A good part of Helliwell’s contribution is methodological. He showed (1998) that using better data from a more accurate reconciliation of inter-provincial and international trade data — the trade data from two different Statistics Canada data banks, data that are available only for years after 1990 — decreased the McCallum border effect by 20 percent (from 25.3 to 19.5). Furthermore, he showed that, between 1990 and 1996, the border effect dropped from 19.5 to 11.9, with most of the decrease occurring prior to 1994. He attributed this decrease to the FTA. Using gravity equations, he estimated border effects for provinces, industries, imports and exports. He produced a rough estimate of the border effect for trade in services. The border effect for services was much more significant than for goods, ranging from 42 to 29 in the 1988-96 period. He used a remoteness measure to be more consistent with Anderson’s (1979) model, but this variable does not have much effect on the point estimate of parameter e.
MEASURES OF THE BORDER EFFECT USING OTHER DATA BANKS
AS WAS POINTED OUT ABOVE, until the very recent development of interstate trade data, Canadian provincial data were the only real intranational trade data with which a McCallum-type border effect could be estimated. Furthermore, province-state trade data exist only since 1988. However, there were attempts to estimate the border effect using other data banks for developed countries with rough estimates of distances for in-tranational trade. The usual rule followed to proxy internal distance in studies was proposed by Wei (1996). Internal trade distance for a given country is assumed to be one fourth of the distance between the capital of the country and the nearest capital of another country. Wei’s estimate of the border effect for OECD countries using this rather rough ad hoc estimate of distance was considerably smaller (just over 2) than McCallum’s estimate. Helliwell (1998) reports similar findings, with an estimated border effect of 5.6 for OECD coun-tries sharing the same language compared to a 15.2 estimate for the inter-provincial/province-state trade for the year 1992. Helliwell (1998) shows that the border effect estimates for the OECD countries were very sensitive to the (ad hoc) definition of internal distance. He then concludes:
In the meantime, it is probably appropriate to place more weight on the evidence from the province-state trade flows, with the results for the OECD countries being taken to represent the lower end of the likely range. (p. 62)
COULOMBE
88
As for McCallum (1995), Helliwell assumes implicitly that a McCallum-type border effect estimated using the ratio of interprovincial trade to Canada-U.S. states trade was an observable phenomenon of a magnitude that could apply to border effects between countries. It was then assumed that the magni-tude of border effects, in general, could be approximated by the point estimate of exp(e) in the regression equation (3) using a McCallum-type data bank. This point of view, however, is likely to change with the recent studies using inter-state trade data (Brown, 2003; Brown and Anderson, 2002; Anderson and van Wincoop, 2001).
WHAT DOES THE PARAMETER EXP(E) MEASURE?
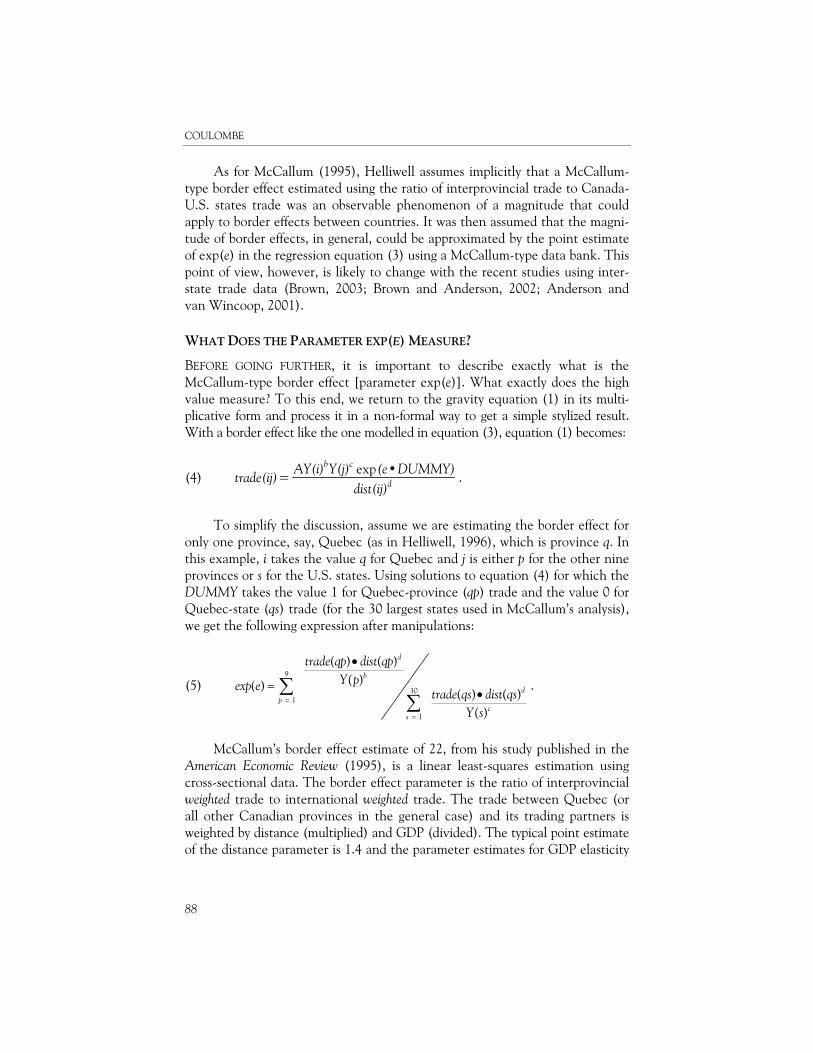
BEFORE GOING FURTHER, it is important to describe exactly what is the McCallum-type border effect [parameter exp(e)]. What exactly does the high value measure? To this end, we return to the gravity equation (1) in its multi-plicative form and process it in a non-formal way to get a simple stylized result. With a border effect like the one modelled in equation (3), equation (1) becomes:
(4)
d
cb
dist(ij))DUMMY(eY(j)AY(i)
trade(ij)•exp
= .
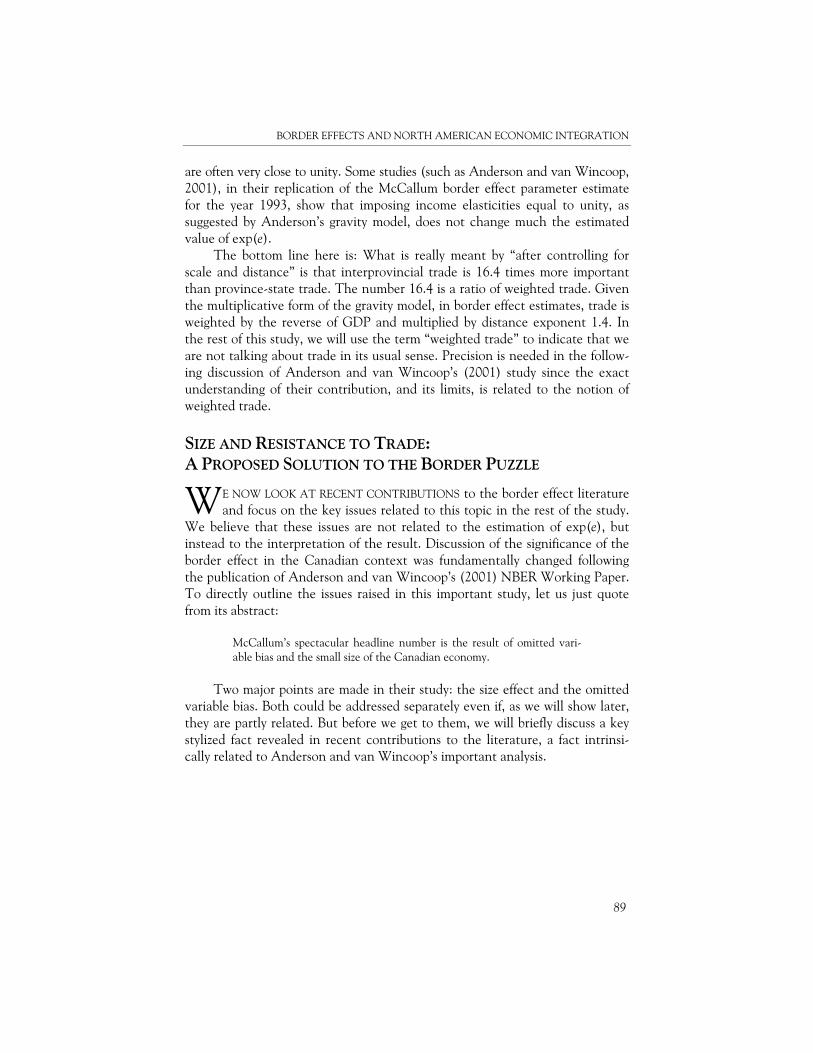
To simplify the discussion, assume we are estimating the border effect for only one province, say, Quebec (as in Helliwell, 1996), which is province q. In this example, i takes the value q for Quebec and j is either p for the other nine provinces or s for the U.S. states. Using solutions to equation (4) for which the DUMMY takes the value 1 for Quebec-province (qp) trade and the value 0 for Quebec-state (qs) trade (for the 30 largest states used in McCallum’s analysis), we get the following expression after manipulations:
(5)
d
b
dp
cs
trade qp dist qpY pexp e
trade qs dist qsY s
9
301
1
( ) ( )( )( )
( ) ( )( )
=
=
•
=•∑
∑.
McCallum’s border effect estimate of 22, from his study published in the American Economic Review (1995), is a linear least-squares estimation using cross-sectional data. The border effect parameter is the ratio of interprovincial weighted trade to international weighted trade. The trade between Quebec (or all other Canadian provinces in the general case) and its trading partners is weighted by distance (multiplied) and GDP (divided). The typical point estimate of the distance parameter is 1.4 and the parameter estimates for GDP elasticity
BORDER EFFECTS AND NORTH AMERICAN ECONOMIC INTEGRATION
89
are often very close to unity. Some studies (such as Anderson and van Wincoop, 2001), in their replication of the McCallum border effect parameter estimate for the year 1993, show that imposing income elasticities equal to unity, as suggested by Anderson’s gravity model, does not change much the estimated value of exp(e). The bottom line here is: What is really meant by “after controlling for scale and distance” is that interprovincial trade is 16.4 times more important than province-state trade. The number 16.4 is a ratio of weighted trade. Given the multiplicative form of the gravity model, in border effect estimates, trade is weighted by the reverse of GDP and multiplied by distance exponent 1.4. In the rest of this study, we will use the term “weighted trade” to indicate that we are not talking about trade in its usual sense. Precision is needed in the follow-ing discussion of Anderson and van Wincoop’s (2001) study since the exact understanding of their contribution, and its limits, is related to the notion of weighted trade.
SIZE AND RESISTANCE TO TRADE: A PROPOSED SOLUTION TO THE BORDER PUZZLE
E NOW LOOK AT RECENT CONTRIBUTIONS to the border effect literature and focus on the key issues related to this topic in the rest of the study.
We believe that these issues are not related to the estimation of exp(e), but instead to the interpretation of the result. Discussion of the significance of the border effect in the Canadian context was fundamentally changed following the publication of Anderson and van Wincoop’s (2001) NBER Working Paper. To directly outline the issues raised in this important study, let us just quote from its abstract:
McCallum’s spectacular headline number is the result of omitted vari-able bias and the small size of the Canadian economy.
Two major points are made in their study: the size effect and the omitted variable bias. Both could be addressed separately even if, as we will show later, they are partly related. But before we get to them, we will briefly discuss a key stylized fact revealed in recent contributions to the literature, a fact intrinsi-cally related to Anderson and van Wincoop’s important analysis.
W
COULOMBE
90
THE CANADA-U.S. BORDER EFFECT IS NOT SYMMETRIC
THREE RECENT STUDIES ON THE BORDER EFFECT (Anderson and van Wincoop, 2001; Brown 2003; Brown and Anderson, 2002) have prepared the ground for a new interpretation of the border effect. The border effect is a magnitude smaller (between six and twelve times) when measured as the ratio of interstate to U.S. cross-border weighted trade rather than using McCallum’s method, which is the ratio of interprovincial weighted trade to Canadian cross-border weighted trade. In itself, this point is very important since it shows that the border does not have an equal effect on all countries in terms of weighted trade. The border matters much more — an order of magnitude more — for Canadian weighted trade patterns than for U.S. weighted trade patterns. Interestingly, Brown (2003) and Brown and Anderson (2002) used a dis-aggregated database by sector, unlike Anderson and van Wincoop (2001), and arrived at very comparable results. Their econometric methodology is also mar-kedly different since they control for wages, productivity, and spatial factors in estimating the gravity equation. Overall, the result of a non-symmetrical border effect that emerges from the new interstate trade data appears very robust and should now be considered a stylized fact. Following McCallum’s conclusion in his 1995 study, many have suggested that McCallum’s border effect estimate was the only reliable estimate of a gen-eral phenomenon (the importance of a country’s borders for trade). The three recent studies demonstrate that the McCallum-type border effect estimates were extremely sensitive to whether one compared international weighted trade to interprovincial or to interstate weighted trade in a gravity equation. This finding has to be explained. Anderson and van Wincoop (2001) have taken a decisive step in this direction.
THE SIZE EFFECT
THE PARADOX REVEALED BY ESTIMATING THE BORDER EFFECT with interstate trade data is the starting point of Anderson and van Wincoop’s analysis. Using a McCallum gravity equation with 1993 data from various sources (for inter-provincial trade, state-province trade, and interstate trade), they estimate a McCallum-type border effect of 16.4 for Canadian interprovincial trade and a McCallum-type border effect of only 1.6 for U.S. states trade. Anderson and van Wincoop focus on this point and claim to have a very simple and convinc-ing explanation for the apparent paradox. The large numbers found by McCallum and in subsequent studies, and the small number found for the bor-der effect based on U.S. states data, follow mainly from the fact that the Cana-dian economy is small compared to the U.S. economy. The explanation of the size effect in Anderson and van Wincoop (2001) is set in the framework of an
BORDER EFFECTS AND NORTH AMERICAN ECONOMIC INTEGRATION
91
Anderson-type (1979) theoretical gravity model. We will return to the theoreti-cal aspect of the gravity model developed in Anderson and van Wincoop’s study when discussing the omitted variable bias problem since the relevance of the size effect is general and not specific to a given theoretical framework. The best way to explain the size effect is to use the example put forward in Anderson and van Wincoop (2001). Let us suppose the world economy con-sists of two countries, a large one with 100 regions (states), and a small one with only two regions (provinces). Distance does not matter in this example as it does not matter in the formal demonstration of the size effect in the frame-work of Anderson and van Wincoop’s theoretical model. Let us assume also an endowment economy of regions of equal economic size. Initially, there is no trade barrier between the two countries and all regions trade one (divisible) unit of goods with each other. This assumption is equivalent to weighting trade by size with an elasticity of one as in the gravity model, since the ratio of in-tranational to international trade is proportional to economic size. Now, sup-pose that a small trade barrier is imposed, which reduces trade between the two countries by 20 percent. The effect of this shock is much larger for the provinces of the small economy than for the states of the large economy. Prov-ince 1 in the small economy sees its exports to the large country decrease by twenty units. Under the pure diversion hypothesis, province 1 will now sell ten more units of goods to itself and ten more to the other province. Interre-gional trade in the small country is multiplied by a factor of 11 whereas it is multiplied by only 1.004 in the large country. If you analyze the new situation with McCallum’s border-gravity model, you find that interprovincial trade, after adjustment for size, is 13.75 times larger than international trade, whereas interstate trade is only 1.255 larger than international trade. Thus, even a modest trade barrier between a small country and a large one could generate a substantial border effect as measured by the ratio of inter-provincial to international trade in a McCallum exercise where trade is weighted with size. Anderson and van Wincoop’s solution to the border puzzle might be summarized by the following question and answer: Do national bor-ders matter? Yes, but much more for a small country than for a large one. For a small country, the border increases trading costs with most of its trading part-ners. This is not the case for a large economy like the United States, for which the border does not increase the cost of interstate trade. The size effect of the Canada-U.S. case study is even more convincing when used in conjunction with the gravity model. Let us assume that trade is propor-tional to GDP and inversely proportional to distance. Given that North America is far from other wealthy regions of the world (Europe and Japan), a substantial proportion of state and provincial potential trade opportunities (weighted by size and distance) are situated in North America. Even a modest trade barrier
COULOMBE
92
such as one associated with a currency transaction cost or an exchange rate risk premium can potentially generate a substantial McCallum border effect, measured as the ratio of interprovincial to international weighted trade. The U.S. economy represents a very substantial proportion of trading opportunities for any single Canadian province and there is a border between them. This is not the case for U.S. states for which the large majority of trading opportunities are found among neighbouring states.
THE OMITTED VARIABLE BIAS PROBLEM
ANDERSON’S 1979 STUDY published in the American Economic Review is often cited as one of the theoretical building blocks of the gravity model. Not surpris-ingly, Anderson and van Wincoop’s (2001) analysis employs a theoretical framework derived from Anderson’s previous work. The two building blocks of Anderson and van Wincoop (2001) are the same as in Anderson (1979): (1) goods are differentiated by place of origin; and (2) homothetic preferences are approximated by a CES utility function. The key theoretical aspect of the study is that it breaks down trade resistance between regions i and j into three components: (1) the bilateral trade barrier between regions i and j; (2) the multilateral resistance to trade of a given region i with all regions i; and (3) j’s multilateral resistance to trade. A region’s multilateral resistance to trade is a function of the distance from its potential trading partners and of trade barriers. The central result of Anderson and van Wincoop’s gravity model is that size-adjusted trade between two economies is a function of the ratio of the bilateral trade resistance between the two economies and the product of their multilateral trade resistance. Compared with a borderless trading world, the Canada-U.S. border in-creases the three components of trade resistance for provinces and states. The effect of the border on the ratio of interprovincial trade to international trade is computed by Anderson and van Wincoop in a multi-step exercise and is a function of the changes in multilateral resistance terms. This “theoretically consistent estimate” of the border effect is calculated at 10.7. It is possible for Anderson and van Wincoop to compute a “McCallum parameter implied by theory,” which is a function of the ratio (not the change) of the multilateral resistance terms. This parameter is estimated at 14.8. According to Anderson and van Wincoop, McCallum-type estimations of the border effect for Canada based on the ratio of interprovincial trade to the ratio of international trade overestimate the border effect by 38 percent due to the omitted variable bias. The omitted variables are the multilateral resistance terms, which are not mod-elled in a McCallum gravity regression.
BORDER EFFECTS AND NORTH AMERICAN ECONOMIC INTEGRATION
93
It is important to note that the bias translates into an overestimation of the border effect because the multilateral resistance term is higher for Cana-dian provinces than for U.S. states. This is not surprising because the Canada-U.S. border increases the multilateral resistance of Canadian provinces much more than for U.S. states because of the size effect, as discussed earlier. Con-versely, Anderson and van Wincoop show that a McCallum-type regression estimating the border effect from the ratio of interstate trade to (U.S.) interna-tional trade underestimates the true border effect. They find that the theoreti-cally consistent estimate of the border effect is 2.24, compared to a McCallum parameter value of 1.63.
REFLECTIONS ON LOCATION IN ANDERSON AND VAN WINCOOP’S ANALYSIS
INTERESTINGLY, ANDERSON AND VAN WINCOOP REPORT that a McCallum-type regression will estimate a positive border effect for the ratio of interprovin-cial weighted trade to (Canadian) international weighted trade even in a bor-derless world. According to them, it is only because of distance that the border-less estimate of multilateral resistance is, on average, higher for Canadian prov-inces than for U.S. states. This has nothing to do with the (economic) size effect but is instead related to geographic location. Canadian provinces are, on average, further from their (weighted) potential trading partners than U.S. states because of the provinces’ non-central location. Canada is not only a small country compared to the United States; it is located on the periphery of the North American economy. To illustrate the impact of location on multilateral resistance and stan-dard border effect estimates, consider the following alternative to the real world. Suppose that the Canadian economy lies between the United States and the European Union (EU) economies, at the same distance from each. Suppose again that trade flows among the three economies (and their regions) follow the law of a gravity model with national border effect. In Anderson and van Wincoop’s framework, a McCallum-type estimate of the Canada-U.S. border effect would be much smaller than the usual value of 16. Why? Because Canada’s multilateral resistance would be relatively smaller than it is in reality because Canada would be closer to Europe. In this hypothetical world, the effect of the U.S. border on Canadian potential trade opportunities is smaller than in the real world because the Canada-U.S. border does not increase trade barriers between Canadian regions and their EU neighbours. The United States’ multilateral resistance to trade would be smaller as well. However, the difference would be more important for Canada because its economy is smaller than that of the United States and because Canada is located, in this hypo-thetical world, between the United States and the European Union.
COULOMBE
94
Given that McCallum border effect estimates are proportional to the ratio of multilateral resistance in Anderson and van Wincoop’s theoretical analysis, the border effect estimates might be much smaller in the hypothetical world. This point illustrates another aspect of Anderson and van Wincoop’s omitted variable bias. In summary, Anderson and van Wincoop’s contribution is likely to change the dominant view of the interpretation and significance of the border effect. The study shows that the effect of the border on weighted trade ratios between two countries is not symmetric. The analysis highlights the role of multilateral resistance and helps to explain why the weighted ratio of inter-provincial trade to Canada-U.S. trade is so high compared to the weighted ratio of interstate trade to international trade. As we will see in the next sec-tion, however, the analysis pertaining to the relative size of the two economies does not take into consideration the role of distance and location. These two factors are at the centre of the omitted variable bias analysis but they should also be part of the size effect analysis.
WHAT ULTIMATELY MATTERS? SIZE AND DENSITY
NDERSON AND VAN WINCOOP EMPHASIZE the importance of (economic) size for the effect of trade barriers on multilateral resistance. This is the
first important contribution of their study, the second being the econometric analysis and estimation of the omitted variable bias. However, we think that their analysis is incomplete when it comes to the theoretical relationship be-tween economic size and weighted (by size and distance) trade flows. It follows that the link they make between the McCallum headline number and the small size of the Canadian economy might be somewhat misleading. This is because Anderson and van Wincoop do not include distance when deriving their re-sults on size. But we will show that distance does matter, especially in a gravity model. When coupling (economic) size with distance, we illustrate that eco-nomic density (economic size divided by distance) is another determinant of the McCallum headline number (along with the omitted variable bias).
COULD ANDERSON AND VAN WINCOOP’S THEORETICAL ANALYSIS OF SIZE BE TRANSPOSED TO A GRAVITY MODEL?
IN THEIR DEMONSTRATION OF THE EFFECT OF TRADE BARRIERS on size-adjusted trade between large and small countries, Anderson and van Wincoop (2001, pp. 11-12) do not take distance into account. Distance enters the analysis only on page 12 in equation (16). They are well aware of it since the three implica-tions of their section 3 analysis are formulated in terms of the relationship be-tween trade barriers and size-adjusted trade. Prior to the formal introduction of
A
BORDER EFFECTS AND NORTH AMERICAN ECONOMIC INTEGRATION
95
distance — in equations (12) to (15) — they isolate the effect of changing trade barriers t across all countries on intranational and international trade flows as a function of the economic size of countries. For example, the structure of their equation (15), on page 11, is:
d(interprovincial(ii)/international(ij) weighted trade ratio) = F[economic size(ij)]Cdt ,
where dt is the differential of trade barriers. This comparative exercise is based on the assumption that the borderless initial equilibrium implies t = 1 for all economies and that the effect of the increase in trade barriers is dt for all economies. This crucial assumption is done just prior to the set-up of equa-tion (16). Generally speaking, this analysis could not be directly transposed to a gravity model in which trade barrier is a function of distance. This clearly follows from Anderson and van Wincoop’s analysis, since in the following equation (16), as they put it,
We follow other authors in hypothesizing that tij is a loglinear function of observables: bilateral distance and whether there is an international border between i and j:
tij = bij Dij
ρ. Consequently, taken in a gravity model, the dt in equations (12) to (15) should be proportional to the distance factor Dij
ρ. Here, ρ is the distance pa-rameter of equation (3). In a complete analysis, both internal distance and external distance would appear in the results linking trade ratios to economic size. Therefore, their analysis is based on the special assumption that internal and external distances are the same for a small and a large economy! This is valid only in a gravity model under the assumption that economic density is proportional to economic size.
MORE DETAIL ON THE MCCALLUM HEADLINE NUMBER
EVEN IF CANADA IS A SMALL COUNTRY compared to the United States from the standpoint of population and GDP, typical distances for Canadian inter-provincial trade are rather large and of the same order of magnitude as typical distances for Canada-U.S. trade. As shown by Helliwell (1998, p. 18), the mean distance between Canadian provinces is 7 percent greater than between prov-inces and U.S. states. Wei (1996) and Helliwell (1998) also show that a standard estimate of the border effect is very sensitive to the measure of internal distance.
COULOMBE
96
Broadly speaking, with a distance elasticity d in equation (3) close to 1, the McCallum-type border effect is proportional to the measure of internal distance for a given country. Now, consider the following hypothetical experiment. Suppose that the internal distance in Canada, compared to the United States, becomes propor-tional to the Canada-U.S. GDP ratio; that internal distance does not change within the United States; and that the distance for province-state trade does not change. In other words, economic density (GDP/internal distance) is the same within Canada and the United States. Since internal distance in Canada is cut by a factor of 10, a McCallum-type border effect estimate based on weighted interprovincial trade in this hypothetical case would be highly compa-rable to an estimate based on weighted interstate trade. In the preceding example, economic density is the same in the two coun-tries. To illustrate this concept, let us compare the following alternative ver-sions of a two-country world. In the first case, the world consists of the United States and Canada; in the second, the world consists of the United States and Belgium. The typical distance between Canada and Belgium on the one side, and the United States on the other side, is the same. The economic size of the U.S. economy is ten times the size of the Canadian and Belgium economies. The geographic size of Canada equals the size of the United States and is ten times larger than Belgium. To put it another way, Belgium and the United States have identical economic densities whereas Canada’s density is ten times smaller. What would be the McCallum-type border effect estimates based on ratios of intranational weighted trade data for Canada and Belgium to interna-tional weighted trade with the United States in these two versions of the world? The answer will depend on numerous things, but one of the key deter-minants of the relative border effect estimates for Canada and Belgium would be the point estimate of the distance parameter in equation (3). If the point estimate is zero, both border effects would be of the same order of magnitude. But if the point estimate is around 1, the border effect would be a magnitude larger for Canada than for Belgium (such as 16 to 1.6). This is because internal trade and external trade are weighted by distance in a McCallum-type border effect estimate. With a point estimate of 1 for the distance parameter, trade between regions that are 1,000 miles apart (as in Canada) is worth ten times the trade between regions that are separated by only 100 miles (as in Belgium). In other words, Anderson and van Wincoop are right: economic size matters, but geographic size matters as well. What ultimately matters is the ratio be-tween the two, or economic density. What Anderson and van Wincoop demonstrate in their analysis of the multilateral resistance is that trade barriers increase size-adjusted trade within small countries more than within large countries (the second implication of their analysis).
BORDER EFFECTS AND NORTH AMERICAN ECONOMIC INTEGRATION
97
But that does not imply that trade barriers increase size-and-distance-adjusted trade within small countries more than within large countries. This, essentially, is our contribution. If a small (economic) country is also small from a geo-graphic standpoint, internal distance will be smaller than within a large coun-try. The McCallum-type border effect will not necessarily be biased. But as economic density varies a great deal across countries (as does economic size), the overall consequence of the analysis is the same as in Anderson and van Wincoop (2001): McCallum-type border effects do not capture the quantita-tive effect of borders on trade barriers that could be compared at a cross-sectional level (across countries).
GRAVITY, SPATIAL STRUCTURE, RELATIVITY AND TOPOLOGY
IF WE RESTRICT THE ANALYSIS TO SIZE and abstract from distance, Anderson and van Wincoop’s analysis appears to us perfectly correct. Their analysis could not be transposed directly to a framework where distance matters, but never-theless, the analysis remains very revealing. But gravity with gravitas is not enough to solve the border puzzle. To maintain the analogy with physics, we have to go from gravity to relativity to solve the border puzzle. This follows from the fact that a border effect estimate based on relative weights (size and distance) in our view is extremely sensitive to relative density. We think it will be extremely difficult to isolate theoretically the relationship between size- and distance-adjusted trade in an Anderson and van Wincoop theoretical frame-work in a world where density varies. Such a theoretical analysis goes well be-yond the scope of this study. Two recent studies, by Brown and Anderson (2002) and Brown (2003), also highlight and discuss in a different way the importance of the specific spa-tial structure of the North American economies for the estimation of border effects. Of course, introducing spatial structure with variables such as distance and density into a theoretical gravity model is very complicated. It has not yet been carried out and the analysis of the spatial structure remains at the discus-sion level in these two studies. However, Brown (2003) clearly points out the importance of distance and density in the following discussion:
Effectively, the Canadian economy functions over a thin, dispersed mar-ket that stretches east-west along the U.S. border, hemmed in by largely uninhabited land to the north and the U.S. border to the south. In con-trast, the U.S. economy has no comparable economic or geographic limi-tations. Its market is larger, denser and more evenly spread over space. Therefore . . . Canadian regions encounter a higher level of multilateral resistance than their U.S. counterparts. Therefore, any measure of the border effect that uses interprovincial trade as a benchmark may be sub-stantially biased upwards. (p. 4)
COULOMBE
98
There is a “crude” (the word employed by Brown) attempt in Brown (2003) to test the significance of spatial structure for North American trade flows. However, without a theoretical gravity model that takes into account the impact of distance and density on border effect estimates, it is a very difficult hypothesis to test. Not surprisingly, Brown’s (2003) exercise produces ambigu-ous results that are very hard to interpret. We agree completely with its conclu-sion that more research is needed on this topic. However, we believe that fur-ther empirical investigation should focus more specifically on the role of density of economic activity in a gravity model. To close this discussion on the importance of distance and density, we want to highlight the role played by topology. The mean distance between trading partners within a country is determined not only by the country’s geo-graphic size. It is determined equally by the topology of trade patterns, a very complicated topic. Let us just say this: The fact that Canadian interprovincial trade follows mainly just one axis (east-west) — instead of multiple axes as in the United States — implies ceteris paribus that internal distances are greater on average in Canada than in the United States, for countries of equal geo-graphic size. This point can be illustrated by a simple example. Consider two cases: (1) points A, B, and C lie on a straight line with B being equidistant from A and C; (2) points A, B, and C lie on separate points of an equilateral triangle. Let us assume that the distance between B and the other two points in the two cases is the same. In the first case, there is only one axis of trade with the distance between A and C being twice the distance AB. In the second case, there are three trade axes and the distance between A and C is equal to AB. The mean internal distance in the linear case (case 1) is 33 percent greater than in the triangular case (case 2). This result could be generalized, but what is important is that internal distances are greater, for a given country geo-graphic size, when trade flows follow just one axis, as is the situation in Canada. To sum up, the McCallum headline number is the result of an omitted variable bias and the typical long internal distance in Canada’s interprovincial trade. Even if the Canadian economy is roughly one tenth the size of the U.S. economy, the typical internal trade distance across Canadian provinces is of the same order of magnitude as the typical trade distance between a province and a U.S. state. This follows from the geographic nature of Canada and from the fact that Canadian interprovincial trade basically follows an east-west axis in comparison with the multiple axes of Canada-U.S. trade.
BORDER EFFECTS AND NORTH AMERICAN ECONOMIC INTEGRATION
99
INTERPRETATIONS OF THE BORDER EFFECT
QUICK LOOK AT EQUATION (5), which specifies what a McCallum-type border effect measures, reveals why various and sometime contradictory
interpretations of the border effect have been made in the economic literature and in the economic policy debate. The large value is a complicated ratio of trade weighted by size and distance. That number could be very misleading because it is not a simple question of interpreting it in terms of what really matters for economic policy: the size of unweighted trade flows and welfare. Let us suppose that Ontario redirects one unit of trade from Michigan to British Columbia. Suppose that the economic size of Michigan is four times that of British Columbia and the distance between the two Canadian provinces is ten times the distance between Ontario and Michigan. In a McCallum-type gravity model, the unit of trade between British Columbia and Ontario is worth 40 times the unit of trade between Ontario and Michigan. This large number has nothing to do with what really matters: welfare. We now review two interpretations made in the literature on the McCallum “headline number,” in light of recent studies on this topic (particu-larly that of Anderson and van Wincoop) and the analysis presented in the preceding section.
THE INTERNATIONAL TRADE-DIMINISHING EFFECT OF BORDERS
National borders diminish trade volumes, in many cases by a factor of ten to twenty.
THIS IS THE VERY FIRST SENTENCE in a recent study by Evans (2000) — a spec-tacular way to start any publication. However, this narrow interpretation of the border effect is seriously misleading. This is one of the clear contributions of Anderson and van Wincoop (2001); in their own words:
The lack of theoretical foundation of empirical gravity equations has two important implications. First, estimation results are biased due to omit-ted variables. Second, and perhaps even more important, one cannot conduct comparative statics exercises, even though this is generally the purpose of estimating gravity equations. In order to conduct a compara-tive statics exercise, such as asking what the effects are of removing cer-tain trade barriers, one has to be able to solve the general equilibrium model before and after the removal of trade barriers. (p. 1)
The fact that interprovincial trade, after controlling for scale and dis-tance, is sixteen times larger than Canada-U.S. trade does not imply that re-moving the border will translate into a multiplication by sixteen of our trade with the United States. For example, compared with a borderless world, the border
A
COULOMBE
100
might have multiplied (weighted) interprovincial trade by a factor of 8 and divided (weighted) international trade by a factor of 2, leading to a border effect estimate of 16. Anderson and van Wincoop (2001) estimate that the effect of removing trade barriers between Canada and the United States (for a border effect of 16 in 1993) would be to increase Canada-U.S. trade by 44 percent. The magic of weighting trade by distance and size, and the omitted bias variable, transforms a substantial effect into headline numbers. Another way to put it into perspective is to look at the border effect esti-mate from the ratio of interstate trade to international trade (Anderson and van Wincoop, 2001; Brown, 2003; Brown and Anderson, 2002). These McCallum-type border effects are roughly ten times smaller than McCallum-type border effects computed from interprovincial trade, basically because of Canada’s small economic density.
THE INTRANATIONAL TRADE-GENERATING EFFECT OF BORDERS
Thus, the trade-generating powers of the Canadian federation are more than an order of magnitude larger than those of the European Union. (Helliwell, 1996, p. 508)
THE ANALYSIS UNDERLYING THE ABOVE QUOTE is based on a value of 20 esti-mated at the time by Helliwell for a McCallum-type border effect between Canada and the United States, and an estimate of 1.6 obtained by Frankel and Wei (1993) in a comparison of trade between EU countries and non-EU coun-tries. Recent studies on the border effect highlight the fact that it is misleading to associate the relative size of a McCallum-type border effect (as for Canada and the European Union in the above quote) with the relative trade-generating powers of a country or an economic union. Interestingly, the 1.6 value for the European Union is exactly equal to the McCallum-type border effect estimated recently on the basis of the ratio of interstate to international trade. If we push Helliwell’s analysis further, the trade-generating powers of the Canadian federation would be more than one order of magnitude larger than that of the U.S. federation. The post-2000 studies on border effects illustrate well why it is dangerous and often misleading to compare border effect estimates for two countries like Canada and the United States. McCallum-type border effect estimates are very sensitive to the size and density of the respective economies. The effect of a border on weighted (for distance and size) trade is much larger for a country of small economic size and low density than for the United States or the European Union. To put it differently, Helliwell’s (1998, tables 3-4) own record of a border effect estimate for Zimbabwe was 232.5 in 1988. This should not be interpreted as a measure of the trade-generating power of that country’s institutions.
BORDER EFFECTS AND NORTH AMERICAN ECONOMIC INTEGRATION
101
ESTIMATED EVOLUTION OF THE BORDER EFFECT DURING THE 1981-2000 PERIOD
CCALLUM-TYPE BORDER EFFECT ESTIMATES for Canada are based on detailed province-to-province and province-to-state trade data that are
available only for the 1988-96 period, and on a consistent basis, only for the 1990-96 period. This interval is not long enough to allow serious conclusions to be drawn about the time-trend evolution of the border effect. But since that brief time period coincides with the introduction of the FTA, the short se-quence of border effect estimates gave rise to conclusions that encompass time-series dimensions (Helliwell, 1998; Helliwell, Lee and Messinger, 1999); the border effect declined following the introduction of the FTA up to 1993-94, and it has been stable since. In this section, we attempt to add to the dynamic dimension of the border effect by making the best use of the information contained in the aggregate Gross Domestic Product, Expenditure-Based (GDPEB) database of Statistics Canada on interprovincial and international trade in goods and services, for Canada as a whole and the ten provinces. This information is coupled with Helliwell’s (1998) estimates based on detailed data to produce an approximation of the border effect during the 1981-2000 period. This exercise is not intended to produce border effect values to compete with Helliwell’s detailed estimates. Our purpose is simply to extend the time-series dimension. The notion of using aggregate data to compute rough estimates of Canada’s border effect is not new. To our knowledge, it was first used in Helliwell (1998) to produce estimates of the border effect for the services sector. The same methodology is used below for the services sector, in the section entitled Border Effects for Services. In the next section, we use a more precise approximation for extending the time-series dimension of the border effect in the goods sector.
BORDER EFFECT FOR GOODS AND THE “L” CURVE
THE BASIC HYPOTHESIS FOR OUR ESTIMATION of the border effect from aggre-gate data is that the McCallum-type border effect [exp(e) in equation (5)] is proportional to the ratio of interprovincial trade to international trade, TR, obtained from the aggregate database. Of course, this hypothesis is based on strong assumptions that the share of Canadian trade with the United States and other Canadian trade partners is constant, that there is no trend factor in the distance and size dimensions of equation (5), and that the aggregate and detailed databases contain comparable information on trade.
M
COULOMBE
102
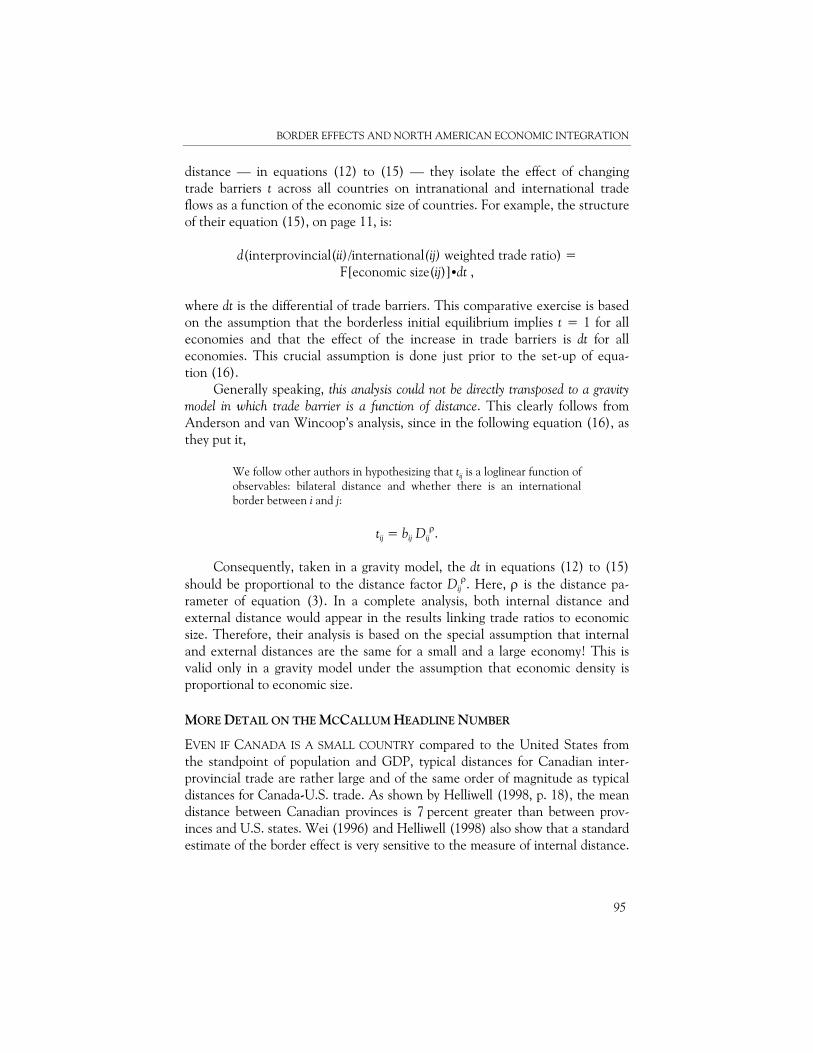
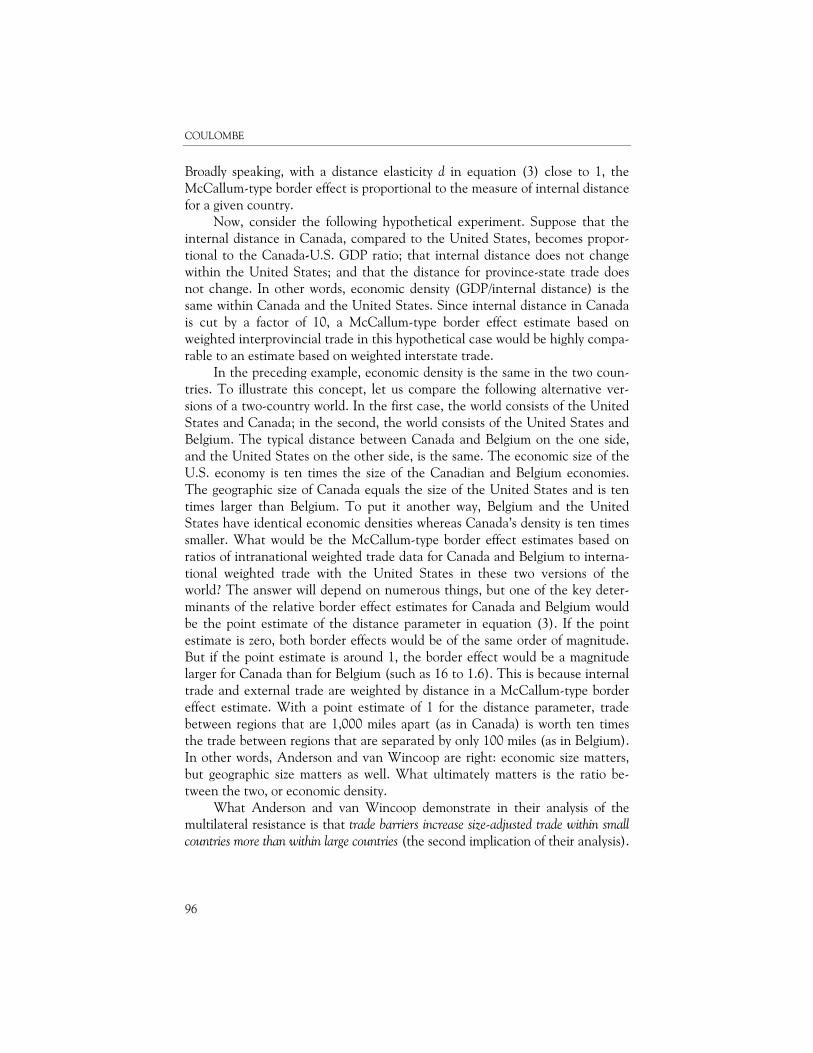
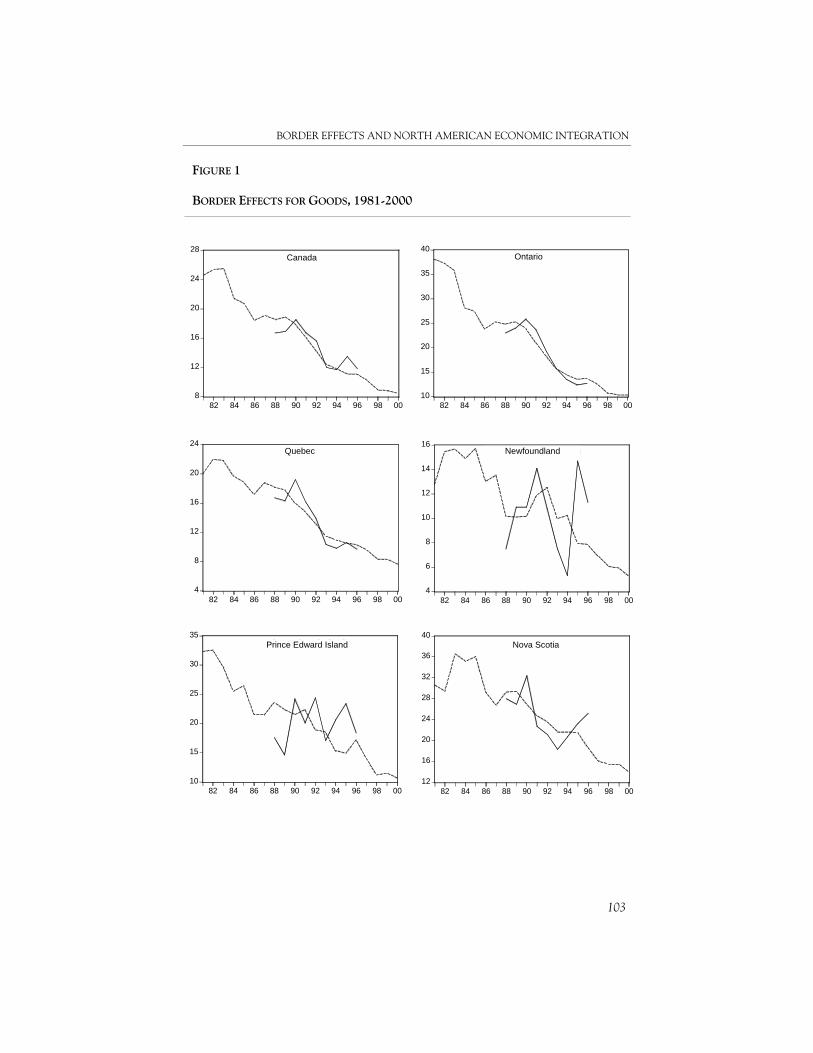
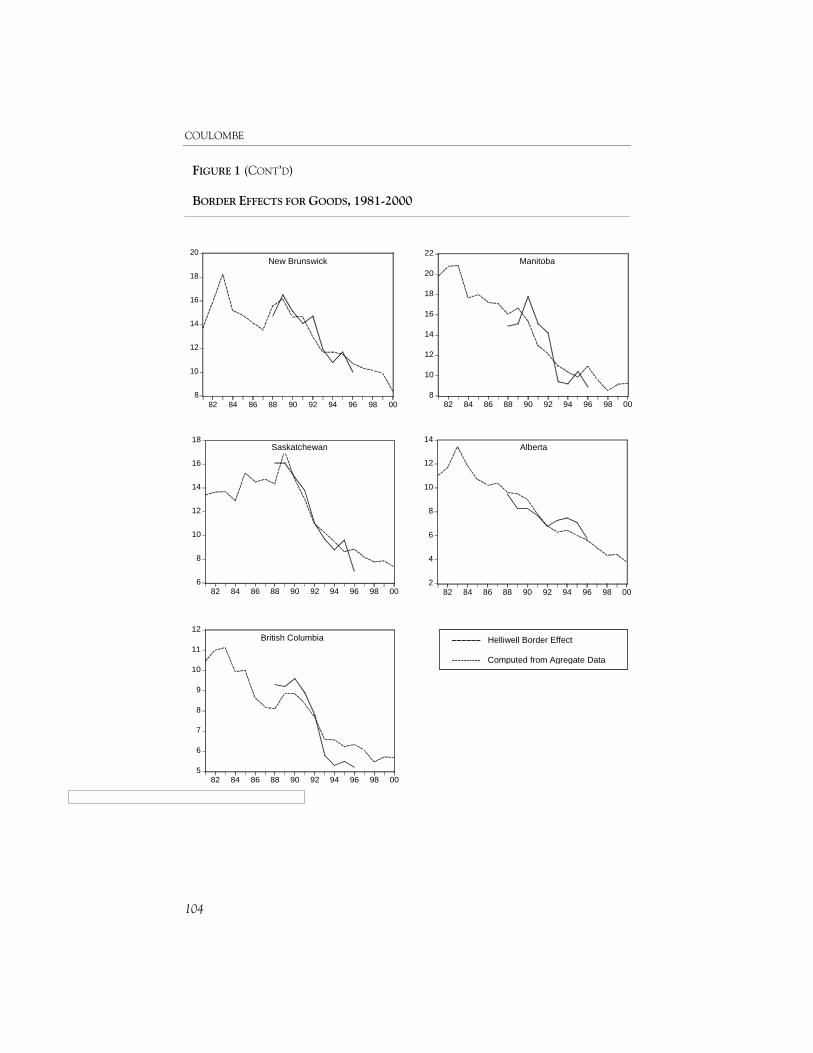
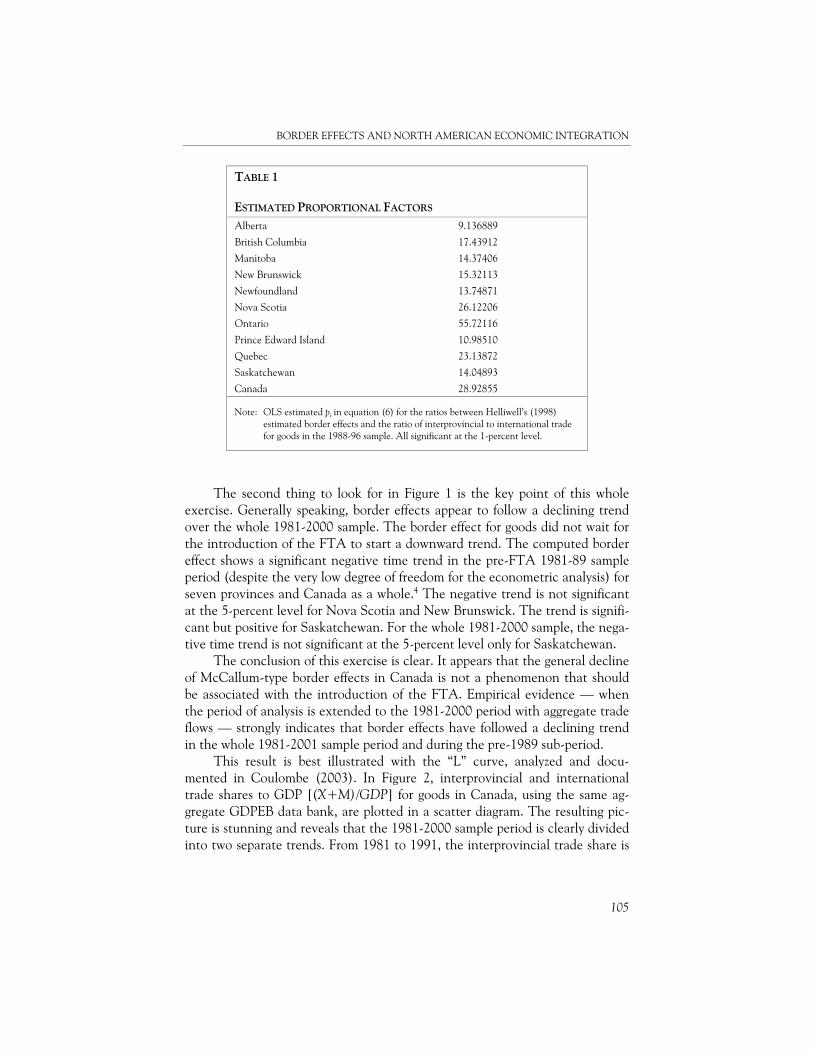
The estimation is performed in two steps. First, the proportional assump-tion [between Helliwell’s (1998) estimates and the trade ratio from aggregate data on goods] is estimated separately with OLS (ordinary least squares) with-out a constant for the eleven cross-sections i (the ten Canadian provinces and Canada), using the nine time-series observations t in the 1988-96 sample: (6) exp(e)i,t = pi ·TRi,t + εi,t . The error term εi,t (i.i.d.) is supposed to capture stochastic shocks to the size and distance dimensions of border effect estimates and to the other factors in-volved in the correspondence between data banks in this exercise. The R-square for the pooled (separate) regression (eleven cross-sections) is 0.84.2 The esti-mated pi are the proportional factors and are presented in Table 1 below. Sec-ond, the estimated proportional factors are then used to compute border effect estimates with aggregate data from the 1981-2000 sample. Helliwell’s (1998) border effect estimates for the years 1988-96 and our border effects computed from aggregate data for the years 1981-2000 are presented separately for Canada and the ten provinces in Figure 1. The proportional factors reported in Table 1 range from 9.1 for Alberta to 55.7 for Ontario. They capture the effect of weighting trade flows by distance and economic size. The fact that all have large values is an indication of the small relative economic size and low density of the Canadian economy. Inter-estingly, the proportional factor is much larger (3.5 times) for Ontario than for the other nine provinces, on average. This might appear surprising in light of the topology argument presented earlier. Ontario being a central province, the typical distance between Ontario and another Canadian province is smaller than for British Columbia or Newfoundland. But one should not forget that Ontario is very close to its most important trading partners, like Michigan, that are located in the Great Lakes area. The first thing to look for in Figure 1 is the general fit between Helliwell’s estimates and our computations for the limited 1988-96 period, for which both series are available. The fit is very bad only for Newfoundland, British Columbia, and the small province of Prince Edward Island. For Newfoundland and British Columbia, the bad fit could be explained by the fact that the evolution of ag-gregate data on international trade does not capture well enough the evolution of these two provinces’ trade with the United States. This is because they are located at the extreme east and west edges of the country, and are naturally more inclined to trade with the rest of the world than with other provinces.3 The fit between the two border effect series is exceptional for New Brunswick and Saskatchewan and it is not bad for the other five provinces and Canada.
BORDER EFFECTS AND NORTH AMERICAN ECONOMIC INTEGRATION
103
FIGURE 1 BORDER EFFECTS FOR GOODS, 1981-2000
8
12
16
20
24
28
82 84 86 88 90 92 94 96 98 00
Figure 1a. Canada
4
8
12
16
20
24
82 84 86 88 90 92 94 96 98 00
Figure 1c. Quebec
10
15
20
25
30
35
40
82 84 86 88 90 92 94 96 98 00
Figure 1b. Ontario
4
6
8
10
12
14
16
82 84 86 88 90 92 94 96 98 00
Figure 1d. Newfoundland
10
15
20
25
30
35
82 84 86 88 90 92 94 96 98 00
Figure 1e. PEIPrince Edward Island
Prince Edward Island
12
16
20
24
28
32
36
40
82 84 86 88 90 92 94 96 98 00
Figure 1f. Nova ScotiaNova Scotia
Quebec Newfoundland
Ontario Canada
COULOMBE
104
FIGURE 1 (CONT’D) BORDER EFFECTS FOR GOODS, 1981-2000
8
10
12
14
16
18
20
82 84 86 88 90 92 94 96 98 00
Figure 1g. New BrunswickNew Brunswick
New Brunswick
8
10
12
14
16
18
20
22
82 84 86 88 90 92 94 96 98 00
Figure 1h. ManitobaManitoba
6
8
10
12
14
16
18
82 84 86 88 90 92 94 96 98 0012
Figure 1i. SaskatchewanSaskatchewan
5
6
7
8
9
10
11
12
82 84 86 88 90 92 94 96 98 00
Figure 1k. British ColumbiaBritish Columbia
2
4
6
8
10
12
14
82 84 86 88 90 92 94 96 98 00
Figure 1j. AlbertaAlberta
–––––– Helliwell Border Effect ---------- Computed from Agregate Data
BORDER EFFECTS AND NORTH AMERICAN ECONOMIC INTEGRATION
105
TABLE 1 ESTIMATED PROPORTIONAL FACTORS Alberta 9.136889
British Columbia 17.43912
Manitoba 14.37406
New Brunswick 15.32113
Newfoundland 13.74871
Nova Scotia 26.12206
Ontario 55.72116
Prince Edward Island 10.98510
Quebec 23.13872
Saskatchewan 14.04893
Canada 28.92855
Note: OLS estimated pi in equation (6) for the ratios between Helliwell’s (1998) estimated border effects and the ratio of interprovincial to international trade for goods in the 1988-96 sample. All significant at the 1-percent level.
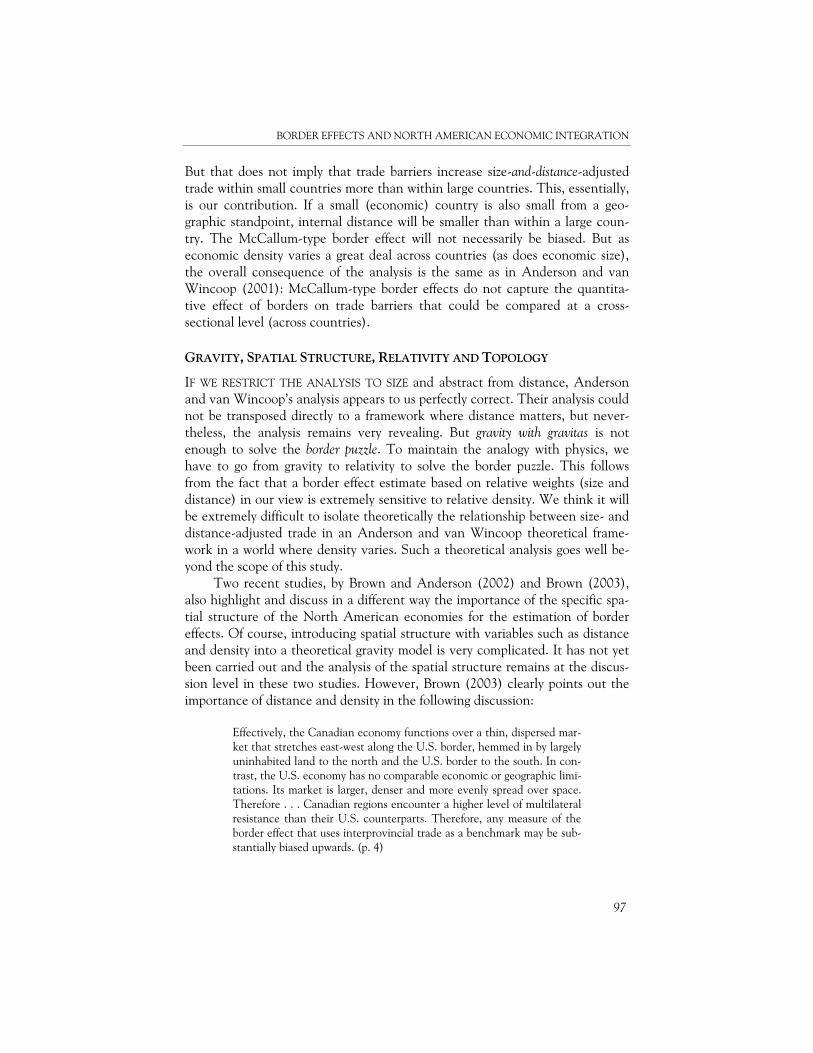
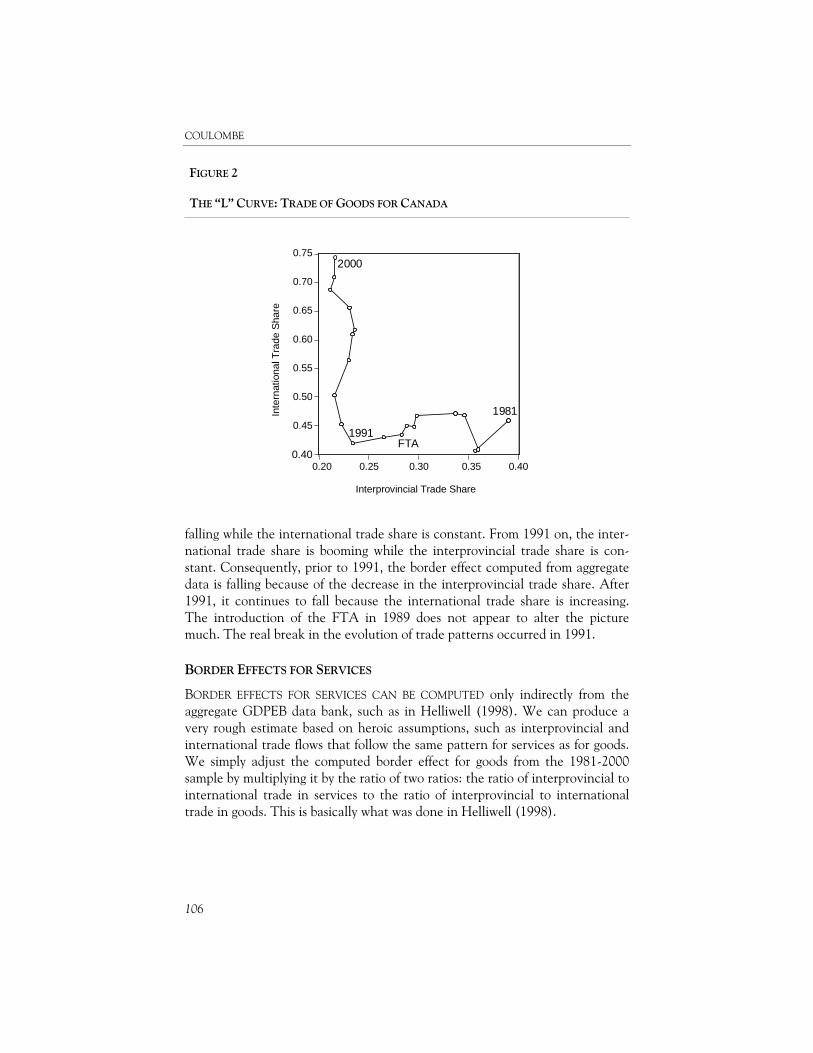
The second thing to look for in Figure 1 is the key point of this whole exercise. Generally speaking, border effects appear to follow a declining trend over the whole 1981-2000 sample. The border effect for goods did not wait for the introduction of the FTA to start a downward trend. The computed border effect shows a significant negative time trend in the pre-FTA 1981-89 sample period (despite the very low degree of freedom for the econometric analysis) for seven provinces and Canada as a whole.4 The negative trend is not significant at the 5-percent level for Nova Scotia and New Brunswick. The trend is signifi-cant but positive for Saskatchewan. For the whole 1981-2000 sample, the nega-tive time trend is not significant at the 5-percent level only for Saskatchewan. The conclusion of this exercise is clear. It appears that the general decline of McCallum-type border effects in Canada is not a phenomenon that should be associated with the introduction of the FTA. Empirical evidence — when the period of analysis is extended to the 1981-2000 period with aggregate trade flows — strongly indicates that border effects have followed a declining trend in the whole 1981-2001 sample period and during the pre-1989 sub-period. This result is best illustrated with the “L” curve, analyzed and docu-mented in Coulombe (2003). In Figure 2, interprovincial and international trade shares to GDP [(X+M)/GDP] for goods in Canada, using the same ag-gregate GDPEB data bank, are plotted in a scatter diagram. The resulting pic-ture is stunning and reveals that the 1981-2000 sample period is clearly divided into two separate trends. From 1981 to 1991, the interprovincial trade share is
COULOMBE
106
falling while the international trade share is constant. From 1991 on, the inter-national trade share is booming while the interprovincial trade share is con-stant. Consequently, prior to 1991, the border effect computed from aggregate data is falling because of the decrease in the interprovincial trade share. After 1991, it continues to fall because the international trade share is increasing. The introduction of the FTA in 1989 does not appear to alter the picture much. The real break in the evolution of trade patterns occurred in 1991.
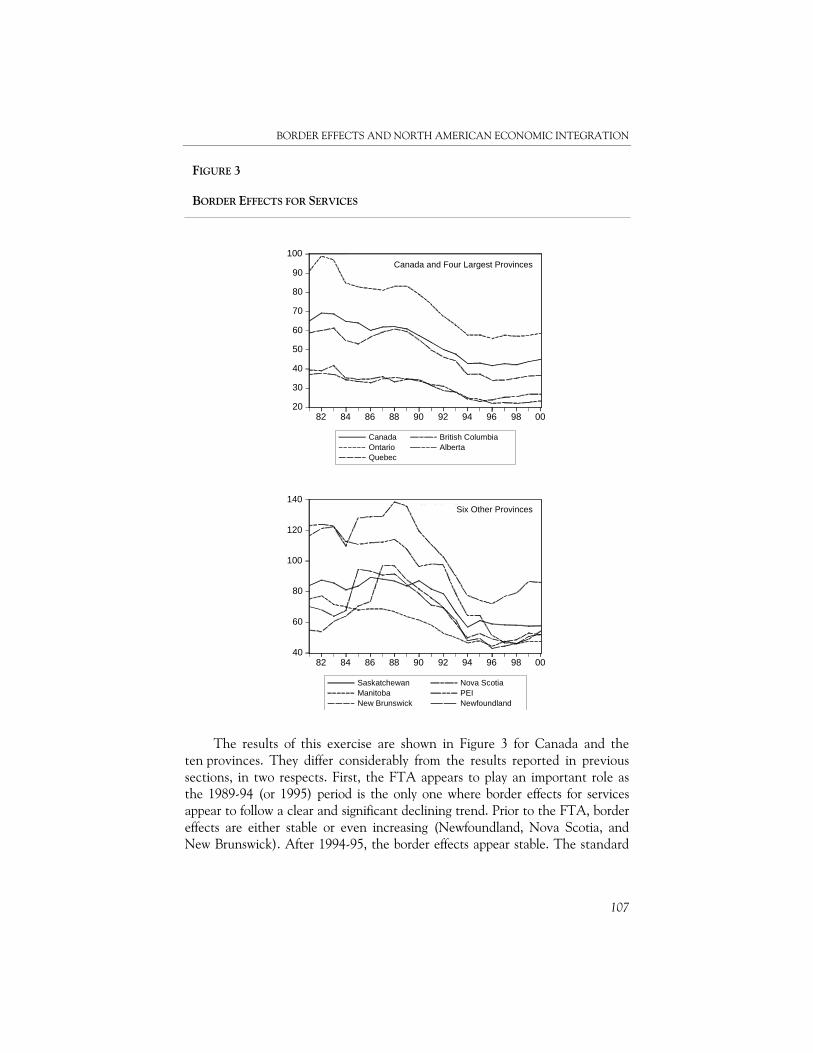
BORDER EFFECTS FOR SERVICES
BORDER EFFECTS FOR SERVICES CAN BE COMPUTED only indirectly from the aggregate GDPEB data bank, such as in Helliwell (1998). We can produce a very rough estimate based on heroic assumptions, such as interprovincial and international trade flows that follow the same pattern for services as for goods. We simply adjust the computed border effect for goods from the 1981-2000 sample by multiplying it by the ratio of two ratios: the ratio of interprovincial to international trade in services to the ratio of interprovincial to international trade in goods. This is basically what was done in Helliwell (1998).
FIGURE 2 THE “L” CURVE: TRADE OF GOODS FOR CANADA
.40
.45
.50
.55
.60
.65
.70
.75
.20 .25 .30 .35 .40
1981
2000
1991FTA
Inte
rnat
iona
l Tra
de S
hare
Interprovincial Trade Share
0.75
0.70
0.65
0.60
0.55
0.50
0.45
0.40 0.20 0.25 0.30 0.35 0.40
BORDER EFFECTS AND NORTH AMERICAN ECONOMIC INTEGRATION
107
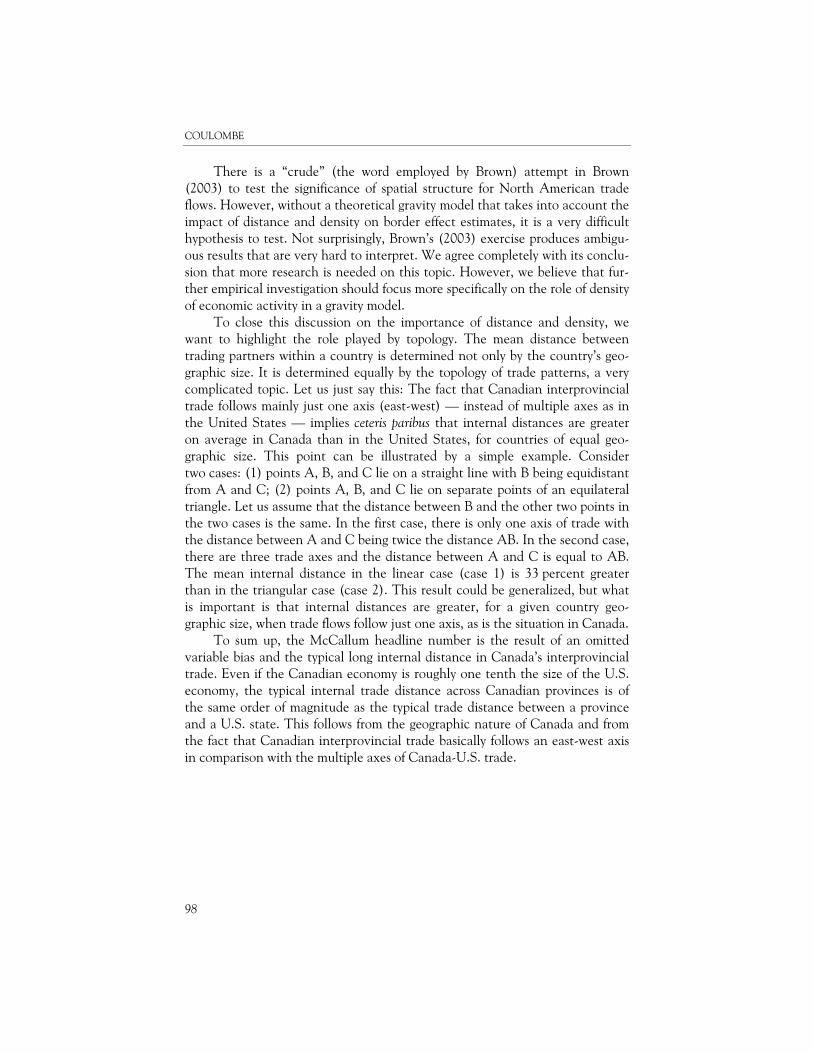
The results of this exercise are shown in Figure 3 for Canada and the ten provinces. They differ considerably from the results reported in previous sections, in two respects. First, the FTA appears to play an important role as the 1989-94 (or 1995) period is the only one where border effects for services appear to follow a clear and significant declining trend. Prior to the FTA, border effects are either stable or even increasing (Newfoundland, Nova Scotia, and New Brunswick). After 1994-95, the border effects appear stable. The standard
FIGURE 3 BORDER EFFECTS FOR SERVICES
20 30 40 50 60 70 80 90
100
82 84 86 88 90 92 94 96 98 00
Canada OntarioQuebec
British Columbia Alberta
g
a. Canada and four largest provinces
40
60
80
100
120
140
82 84 86 88 90 92 94 96 98 00
Saskatchewan Manitoba New Brunswick
Nova Scotia PEI Newfoundland
Canada and Four Largest Provinces
Six Other Provinces
Canada and Four Largest Provinces
Six Other Provinces
COULOMBE
108
dynamic adjustment story following the introduction of a shock (the FTA) in 1989 seems to fit the facts well in the case of services. Second, the border effect estimates for services are much larger than the estimates for goods, as in Helliwell (1998). This follows simply from the fact that the ratio of interprovincial to international trade is much larger for services than for goods. This point ap-pears to be related to the core/periphery nature of the Canadian economy, but the analysis of this interesting fact goes well beyond the topic of border effects and the scope of this study.
CONCLUSION AND POLICY DISCUSSION
HE DEBATE SURROUNDING BORDER EFFECTS that has raged over the past century is likely to have been fundamentally changed with the wave of
studies (Anderson and van Wincoop, 2001; Brown, 2003; Brown and Ander-son, 2002) that came out recently to analyze the newly released interstate trade data. It should be clear by now that, for a given degree of trade diversion gen-erated by the common border, a McCallum-type border effect is about ten times larger when measured from Canadian interprovincial trade data than from U.S. interstate trade data. This new finding is critical for the general in-terpretation of border effects. It clearly indicates that it is at least risky, and probably misleading, to draw conclusions about the level of trade barriers or the trade-generating power of a country or trade bloc by comparing the magnitude of border effect estimates on a cross-sectional basis. Border effect estimates do contain information that is extremely hard to interpret at the cross-sectional level. This drawback should seriously restrain future research on the topic. Anderson and van Wincoop (2001) have taken a critical step forward as regards the information contained in border effect estimates. Thanks to the separation of the concepts of multilateral and bilateral trade resistance, they are able to show that the Canada-U.S. border has roughly an order of magni-tude (about 10) greater effect on interprovincial weighted trade flows than on interstate weighted trade flows for a given degree of trade diversion between the two countries. As shown in this study, however, Anderson and van Wincoop’s analysis of the role of economic size would be more revealing if it incorporated the concepts of distance and density. Those two concepts are the determinants of Anderson and van Wincoop’s multilateral resistance but they clearly interfere with economic size. For us, McCallum’s headline number is the joint result of the small economic size and the low density of the Canadian economy. Small size matters because of a low density. The spatial structure (Brown, 2003), associ-ated with a low density, the topology (east-west) of trade, and the relative unique location of the Canadian economy should be a required complement to Anderson and van Wincoop’s analysis in a satisfactory gravity model of trade. But all those factors are very complicated to handle in a theoretical model.
T
BORDER EFFECTS AND NORTH AMERICAN ECONOMIC INTEGRATION
109
Economists are not used to working with density and topology. Gravity is not enough. We have to move to relativity. The key findings unveiled by recent research should clearly affect the ori-entation of the economic policy debate on the significance of the border effect, for two reasons. First, under a pure diversion hypothesis, an increase of one unit in weighted (by size and distance) trade with the United States is accompanied by a decrease of around ten units of interprovincial weighted trade in a McCallum-type gravity equation. This follows from the relative size, density, and topology of the two economies. This spectacular arithmetic, hidden by the magic of weighting trade flows by distance and size, implies that Canada-U.S. border effect estimates should be interpreted with great care. Changes in the direction of trade links can potentially generate sharp and substantial changes in the magnitude of border effects estimated from provincial trade data. Second, it appears that McCallum’s high number has decreased since the early 1980s. Based on aggregate provincial trade flows, the remaining value is no longer in the double-digit range, and stands at around 8 for Canada overall. Consequently, what remains of the Canada-U.S. border effect in terms of bilat-eral resistance is quite low when measured from an international trade basis. Under the pure diversion hypothesis, following Anderson and van Wincoop’s estimation of the effect of eliminating trade barriers between Canada and the United States, a 25-percent further increase (post-2001) in Canada-U.S. cross-border trade might well bring McCallum’s number down to around 1. What remains of the bilateral resistance is so low that it could be largely explained by the fact that Canada and the United States are not using the same currency. As documented in Frankel and Rose (2000), the adoption of a common cur-rency by two countries might certainly lead to a 25-percent increase in (un-weighted) trade flows! The negative impact of a separate currency on trade flows comes from the transaction costs associated with currency conversion and exchange rate variability.5 The experience of the European Community has shown that floating exchange rates have a negative impact on trade flows (De Grauwe, 1988). Two important points should be made to clarify the preceding analysis. First, one should not conclude from this that Canadians are losing as the orienta-tion of trade links changes from east-west to north-south and a small amount of international trade is substituted for a huge amount of interprovincial weighted trade. This should be clarified, because what matters for welfare and employ-ment is not weighted trade flows but unweighted trade flows. Canadians might well be better off by trading ten units of weighted interprovincial trade for one unit of international trade with the United States.
COULOMBE
110
Second, the previous analysis, following the typical approach used in the now-standard theoretical gravity model such as that of Anderson and van Wincoop (2001), is based on the pure diversion hypothesis and an en-dowment economy. The effect of borders is restricted to a re-orientation of trade flows. However, this hypothesis clearly does not reflect the dynamic evo-lution of interprovincial and international trade flows of goods for Canadian regions since 1980. As shown in Coulombe (2003) and simply illustrated by the “L” curve presented in this study, interprovincial and international trade flows appear to be more complementary than substitutionary. Consequently, a 25 percent increase in international trade might not reduce McCallum’s num-ber to 1 because it would not necessarily be accompanied by a one-for-one decrease in (unweighted) interprovincial trade. A simple explanation for the non-diversion result would be that the expansion of north-south trade links increases the degree of specialization among Canadian regional economies. This is likely to stimulate trade between them. As Ontario and Quebec are exporting more manufactured products to the United States, they might import more primary products from the other provinces and from each other. This potential change in the industrial structure of regions induced by trade goes well beyond the standard endowment economy (fixed supply of dif-ferentiated goods) assumed in theoretical gravity models, such as in Anderson and van Wincoop (2001). This characteristic is a natural limitation of gravity models to capture adequately the dynamic evolution of changing regional trade patterns in North America. To conclude, the series of studies on the Canada-U.S. border effect initi-ated by McCallum (1995) and continued with the works of Helliwell has proved to be a serious challenge to the economic profession. This field of re-search has contributed to a substantial improvement in our understanding of the mechanics of regional trade flows. It is very important for trade policy, and for economic policy in general, to understand why and how a border barrier (such as having a separate currency) has a much larger effect on an economy like that of Canada than on the U.S. economy. But this should be common sense since we are well aware in Canada that the United States has a much larger margin in which to manoeuvre (especially when it comes to raising trade barriers) than does Canada in terms of trade policy. And the debate is not over. Despite the breakthrough following the theoretical and empirical analysis of interstate trade data, more work needs to be done to capture the real disrupting effect of trade barriers when distance and economic density are fully taken into consideration.
BORDER EFFECTS AND NORTH AMERICAN ECONOMIC INTEGRATION
111
ENDNOTES
1 It might be useful to remember that the J.E. Anderson, who worked with van Wincoop, is the author of the theoretical study on the border effect published in 1979 in the American Economic Review. W.P. Anderson is another researcher on the border effect; he has worked with W.M. Brown on the 2002 study cited.
2 The Durbin-Watson for the pooled regression is 1.66 and no separate AR(1) is significant at the 10-percent critical level, indicating that serial correlation is not a problem in these simple regressions.
3 In 2000, trade with the United States represented only 56 percent and 47 percent of total international trade of goods for British Columbia and Newfoundland, re-spectively. For Ontario, the proportion was 83 percent. (Computed from Trade Data Online, www.strategis.ic.gc.ca.)
4 We refer in the text to a linear time trend with a constant term estimated with AR(1) on the log of computed border effect from Figure 1. We keep the econo-metrics very simple here, given that the secular declining trend of the border ef-fect is so evident in Figure 1, generally speaking.
5 For a recent analysis of the benefits and costs of dollarization in Canada, with a regional perspective, see Beine and Coulombe (2003).
ACKNOWLEDGMENTS
HE AUTHOR IS GRATEFUL to John Helliwell and Richard Roy for their helpful comments and to Patricia Buchanan for English editing.
BIBLIOGRAPHY
Anderson, J.E. “A Theoretical Foundation for the Gravity Equation.” American Economic Review 69 (1979), pp. 106-116.
Anderson, J.E., and E. van Wincoop. Gravity with Gravitas: A Solution to the Border Puzzle. NBER Working Paper No. 8079. Cambridge (Mass.): National Bureau of Economic Research, 2001.
Beine, M., and S. Coulombe. “Regional Perspectives on Dollarization in Canada.” Journal of Regional Science 43, 3(2003): 541-570.
Bergstrand, J.H. “The Gravity Equation in International Trade: Some Microeconomic Foundations and Empirical Evidence.” Review of Economics and Statistics 67 (1985), pp. 474-481.
Brown, W.M. Overcoming Distance, Overcoming Borders: Comparing North American Regional Trade. Ottawa: Statistics Canada (Micro-Economic Analysis Division), 2003. 11F0027, no 008.
T
COULOMBE
112
Brown, W.M., and W.P. Anderson. “Spatial Markets and the Potential for Economic Integration Between Canadian and U.S. Regions.” Papers in Regional Science 81 (2002), pp. 99-120.
Coulombe, S. International Trade, Interprovincial Trade, and Canadian Provincial Growth. Working Paper No. 40. Ottawa: Industry Canada, 2003. Forthcoming.
De Grauwe, P. “Exchange Rate Variability and the Slowdown in Growth of Interna-tional Trade.” IMF Staff Papers No. 35, 1988, pp. 63-84.
Evans, C.L. The Economic Significance of National Border Effects. Federal Reserve Bank of New York, 2000.
Frankel, J.A., and A.K. Rose. Estimating the Effect of Currency Unions on Trade and Output. NBER Working Paper No. 7857. Cambridge (Mass.): National Bureau of Economic Research, 2000.
Frankel, J.A., and S.-J. Wei. Trade Blocs and Currency Blocs. NBER Working Paper No. 4335. Cambridge (Mass.): National Bureau of Economic Research, 1993.
Grossman, G. “Comment on Alan V. Deardorff: Determinants of Bilateral Trade: Does Gravity Work in a Neoclassical World?” In The Regionalization of the World Economy. Edited by J.A. Frankel, Chicago: University of Chicago Press, 1998, pp. 29-31.
Helliwell, J.F. “Do National Boundaries Matter for Quebec’s Trade?” Canadian Journal of Economics 29 (1996), pp. 507-522.
––––. How Much Do National Borders Matter? Washington (D.C.): The Brookings Insti-tution, 1998.
Helliwell, J.F., F.C. Lee and H. Messinger. Effects of the Canada-United States Free Trade Agreement on Interprovincial Trade. Perspectives on North American Free Trade Series, No. 5. Ottawa: Industry Canada, 1999.
Helliwell, J.F., and J. McCallum. “National Borders Still Matter for Trade.” Policy Options 16 (1995), pp. 44-48.
Helpman, E. “Increasing Returns, Imperfect Markets, and Trade Theory.” In Handbook of International Economics 1. Edited by R. Jones and P. Kenen. Amsterdam: North-Holland, 1984, pp. 325-365.
Linneman, H. An Econometric Study of International Trade Flows. Amsterdam: North-Holland, 1966.
McCallum, J. “National Borders Matter: Canada-U.S. Regional Trade Patterns.” American Economic Review 85, 3 (1995), pp. 615-623.
Obstfeld, M., and K. Rogoff. The Six Major Puzzles in International Macroeconomics. Is there a Common Cause? NBER Working Paper No. 7777. Cambridge (Mass.): National Bureau of Economic Research, 2000.
Tinbergen, J. Shaping the World Economy: Suggestions for an International Economic Policy. New York: The Twentieth Century Fund, 1962.
Wei, S.-J. Intra-national versus International Trade: How Stubborn are Nations in Global Integration? NBER Working Paper No. 5531. Cambridge (Mass.): National Bureau of Economic Research, 1996.
BORDER EFFECTS AND NORTH AMERICAN ECONOMIC INTEGRATION
113
Comment Mark Brown Statistics Canada
N HIS STUDY, PROFESSOR COULOMBE PROVIDES AN INSIGHTFUL ANALYSIS of the border effect and its consequences. In this discussion, I would like to
provide some comments on the contributions of his study and add some thoughts of my own on the implications of the border and trade literature.
That literature is derived from McCallum’s (1995) surprising result that, af-ter controlling for both the size of provinces and states and the distance between them, interprovincial trade was some twenty-fold larger than cross-border trade. This finding is at once interesting and perplexing. Interesting because it suggests that borders act as a much stronger barrier to trade than anyone had realized. Perplexing because it is very difficult to envisage how trade policy-related barriers (i.e. tariff and non-tariff barriers) and/or ‘natural’ barriers to trade (such as differ-ences in tastes and institutions) could account for such a strong effect.
McCallum’s finding has inspired a growing literature that tries both to ex-plain the puzzle and to evaluate the robustness of his basic result. Coulombe points out that a series of recent studies (Anderson and van Wincoop, 2001; Brown, 2003; and Brown and Anderson, 2002) should shift the orientation of this literature. Specifically, these studies find that the border effect is much smaller in magnitude when different data and methods are used. They also explain why McCallum’s initial finding is misleading (on this point, see espe-cially Anderson and van Wincoop, 2001).
One of the contributions of Coulombe’s study is its extensive discussion of the Anderson and van Wincoop theoretical model and its potential limitations. In my mind, Anderson and van Wincoop provide the best theoretically-derived gravity model of trade to date and solve many of the issues associated with using the gravity equation to measure the border effect. Nonetheless, Coulombe’s ar-gument that their model does not fully take into account economic density and topology is intriguing and reflects concerns I have regarding my own estimates (Brown, 2003). At the very least, this suggests that future attempts to measure the border effect should test for the influence of economic density and topol-ogy. This issue aside, it is my view that recent estimates showing that the bor-der dampens Canada-U.S. trade by a half provide a relatively accurate measure of the border effect, at least as it stood in 1993.
I
COULOMBE
114
A limitation of previous studies of the border effect is that they cover a relatively short period of time, usually a brief period before and after the im-plementation of the Canada-U.S. Free Trade Agreement (FTA). The second contribution of Coulombe’s study is the estimation of the border effect over a much longer period (1981-2000). Coulombe shows that the decline in the border effect documented elsewhere (e.g. Helliwell, 1998) started well before the introduction of the FTA and continued past 1993, when other estimates indicate that there was at least a pause in its decline.
This is a surprising finding for two reasons. First, exports as a percentage of GDP grew at a fairly slow pace prior to the implementation of the FTA. Consequently, we would expect to see very little decline in the border effect over this period. Second, exports’ share of GDP rose rapidly after the imple-mentation of the FTA. With this rise, we would expect to see the decline in the border effect accelerate. To explain this finding, the author uses his ‘L’ curve to show that the border effect declined prior to 1991 because inter-provincial trade’s share of GDP fell. After 1989, the border effect declined because international trade increased as a share of GDP. This provides a partial explanation of his surprising result that, in turn, raises two questions.
First, why should the share of interprovincial trade in GDP decline so rap-idly over the 1981 to 1991 period? There are probably many reasons for this result, but two seem plausible to me. First, the non-trade portion of GDP grew more rapidly during this period. Second, prices of traded goods declined rela-tive to those of non-traded goods over the period. At any rate, I would be more comfortable with this result if there was some intuitive story to explain it.
Almost equally perplexing is the fact that, as the international trade share of GDP rose, the interprovincial trade share remained constant. The author speculates that this is possible if, with increased trade, regions are becoming more specialized, allowing the international trade share to increase while the interprovincial trade share remains constant. Surprisingly, recent evidence suggests that the opposite was occurring over roughly the same time frame. That is, within Canada’s manufacturing sector, regional economies are gener-ally becoming more industrially diversified over time (Baldwin and Brown, 2003). Therefore, specialization across regions cannot explain this result. What may explain it, however, is specialization within plants.
In a recent paper, Baldwin, Beckstead and Caves (2001) show that Cana-dian plants have reduced the diversity of their products over time and that this process accelerated after the implementation of the FTA. This means that there may be increased product specialization across provinces rather then industry specialization and this may underlie the post-1991 shape of the ‘L’ curve. Still, without further investigation, this explanation remains speculative.
BORDER EFFECTS AND NORTH AMERICAN ECONOMIC INTEGRATION
115
Finally, I would like to conclude this discussion with two additional points. First, it remains to be seen whether we are approaching a point where the border no longer matters. Certainly, the evidence provided in Coulombe’s paper suggests that the border effect has declined since 1993. Given that the border effect is positively related to tariff and non-tariff barriers (Brown and Anderson, 2002), their elimination over the past decade probably means that we are approaching a level of trade that reflects ‘natural’ barriers to trade and the extra transaction costs associated with having a separate Canadian cur-rency. Still, we need more direct estimates of the border effect using interstate trade as a frame of reference to arrive at strong conclusions on this issue.
Second, it has been shown that the spatial organization of production can have a significant impact on the intensity of trade across space, and conse-quently on estimates of the border effect. The opposite may also be true. As barriers to trade have fallen, the markets available to firms across regions in Canada have changed. Locations that might have once been relatively central to the Canadian market may look peripheral in the context of a North Ameri-can market. Similarly, locations once relatively remote from major Canadian markets may find themselves with large markets right across the border. De-clining trade barriers have potentially changed the locational decisions of busi-nesses, favouring locations in Canada where the North American market is most accessible. Increased trade may change the spatial structure of the Cana-dian economy.
BIBLIOGRAPHY
Anderson, J.E., and E. van Wincoop. Gravity with Gravitas: A Solution to the Border Puzzle. NBER Working Paper No. 8079. National Bureau of Economic Research, 2001.
Baldwin, J.R., D. Beckstead and R. Caves. Changes in the Diversity of Canadian Manufacturing Firms and Plants (1973-1997): A Move to Specialization. Research Paper Series No. 179. Ottawa: Statistics Canada, Analytical Studies Branch, 2001.
Baldwin, J.R., and W.M. Brown. Regional Manufacturing Employment Volatility in Canada: The Effects of Specialization and Trade. Economic Analysis Research Paper Series No. 5. Ottawa: Statistics Canada, Analytical Studies Branch, 2003.
Brown, W.M. Overcoming Distance, Overcoming Borders: Comparing North American Regional Trade. Economic Analysis Research Paper Series No. 8. Ottawa: Statistics Canada, Analytical Studies Branch, 2003.
Brown, W.M., and W.P. Anderson. “Spatial Markets and the Potential for Economic Inte-gration Between Canadian and U.S. Regions.” Papers in Regional Science 81, 1 (2002): 99-120.
Helliwell, J.F. How Much Do National Borders Matter? Washington (D.C.): Brookings Institu-tion Press, 1998.
McCallum, J. “National Borders Matter: Canada-U.S. Regional Trade Patterns.” American Economic Review 85,3 (1995): 615-623.