Embed Size (px)
Citation preview
1
Borders NHS Board
HEALTHCARE ASSOCIATED INFECTION – PREVENTION AND CONTROL REPORT MAY 2015 Aim The purpose of this paper is to update Board members of the current status of Healthcare Associated Infections (HAI) and infection control measures in NHS Borders. Background The NHS Scotland HAI Action Plan 2008 requires an HAI report to be presented to the Board on a two monthly basis. Summary This report provides an overview for Borders NHS Board of Infection Prevention and Control with particular reference to the incidence of Healthcare Associated Infections (HAI) against Scottish Government HEAT targets, together with results from cleanliness monitoring and hand hygiene audit results. Recommendation The Board is asked to note this report Policy/Strategy Implications
This report is in line with the NHS Scotland HAI Action Plan.
Consultation There is no requirement to consult as this is a bi-monthly update report as required by SGHD.
Consultation with Professional Committees
This is a regular bi-monthly update as required by SGHD. As with all Board papers, this update will be shared with the Area Clinical Forum for information.
Risk Assessment This is a bi-monthly update report with all risks highlighted within the paper.
Compliance with Board Policy requirements on Equality and Diversity
Equalities Scoping Template has been completed and submitted to the Equality e-mail inbox. Full impact assessment is not required.
Resource/Staffing Implications This assessment has not identified any resource/staffing implications
Approved by

2
Name Designation Name Designation Evelyn Rodger
Director of Nursing and Midwifery, Interim Director of Acute Services
Author(s) Name Designation Name Designation Sam Whiting Infection Control Manager Lynsey Milven HAI Quality
Improvement Facilitator

3
Healthcare Associated Infection Reporting Template (HAIRT) Section 1– Board Wide Issues
Key Healthcare Associated Infection Headlines for May 2015
• Early indications suggest that NHS Borders did not achieve the Staphylococcus aureus Bacteraemia (SAB) March 2015 HEAT target rate of 24.0 cases or less per 100,000 acute occupied bed days (AOBD). This will be confirmed in July 2015 following publication of data on AOBD by Health Protection Scotland (HPS).
• Early indications suggest that NHS Borders achieved the Clostridium difficile infection (CDI) 2015 HEAT target rate of 32.0 cases or less per 100,000 total occupied bed days (TOBD) for patients aged 15 and over. This will be confirmed in July 2015 following publication of data on TOBD by Health Protection Scotland (HPS).
• NHS Borders received an Unannounced Theatre Inspection of the Borders General Hospital on 13th and 14th May 2015. Initial feedback from the Inspectors indicated a number of instances of staff not following policies and procedures. A 30 day improvement plan is being progressed in Theatres and Day Procedure Unit to provide focussed support for rapid improvement.
Staphylococcus aureus (including MRSA) Staphylococcus aureus Bacteraemia (SAB) As Figure 1 shows, since April 2015, there have been 5 SAB cases of which 3 were Hospital or Healthcare associated and these represent the greatest opportunity for intervention to reduce numbers.
This section of the HAIRT covers Board wide infection prevention and control activity and actions. For reports on individual hospitals, please refer to the ‘Healthcare Associated Infection Report Cards’ in Section 2. A report card summarising Board wide statistics can be found at the end of section 1
Staphylococcus aureus is an organism which is responsible for a large number of healthcare associated infections, although it can also cause infections in people who have not had any recent contact with the healthcare system. The most common form of this is Meticillin Sensitive Staphylococcus Aureus (MSSA), but the more well known is MRSA (Meticillin Resistant Staphylococcus Aureus), which is a specific type of the organism which is resistant to certain antibiotics and is therefore more difficult to treat. More information on these organisms can be found at:
Staphylococcus aureus : http://www.nhs24.com/content/default.asp?page=s5_4&articleID=346
MRSA:http://www.nhs24.com/content/default.asp?page=s5_4&articleID=252
NHS Boards carry out surveillance of Staphylococcus aureus blood stream infections, known as bacteraemias. These are a serious form of infection and there is a national target to reduce them. The number of patients with MSSA and MRSA bacteraemias for the Board can be found at the end of section 1 and for each hospital in section 2. Information on the national surveillance programme for Staphylococcus aureus bacteraemias can be found at:
http://www.hps.scot.nhs.uk/haiic/sshaip/publicationsdetail.aspx?id=30248

4
0 1 2 3 4 5
Community Infection
Healthcare Associated Infection
Healthcare Acquired Infection
NHS BordersTotal Staphylococcus aureus bacteraemia (SAB) by location 2015-16
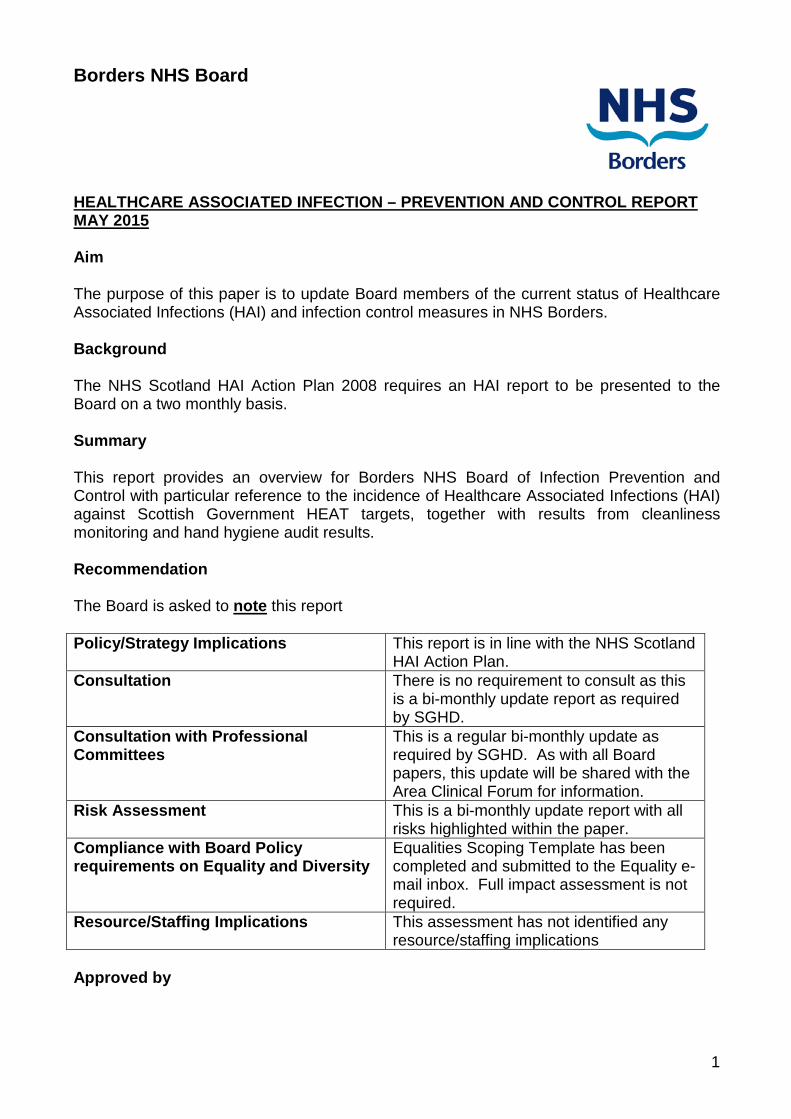
From 1st October 2014, all Scottish Boards started to participate in a national enhanced surveillance programme for Staphylococcus aureus Bacteraemia (SAB). The locations identified in Figure 1 reflect the new definitions for categories as determined by the national HPS Enhanced S. aureus Bacteraemia Surveillance Protocol Version 2. For this reason, it is not possible to directly compare this data with historic data. Figure 1: NHS Borders total staphylococcus aureus bacteraemia (SAB) location NHS Borders is unlikely to achieve the Staphylococcus aureus Bacteraemia (SAB) March 2015 HEAT target rate of 24.0 cases or less per 100,000 acute occupied bed days (AOCB). This will be confirmed in July 2015 following publication of data on AOBD by Health Protection Scotland (HPS). Figure 2, shows a Statistical Process Control (SPC) chart showing the number of days between each SAB case. The reason for displaying the data in this type of chart is due to SAB cases being rare events with low numbers each month.
Traditional charts which show the number of cases per month can make it more difficult to spot either improvement or deterioration. These charts highlight any statistically significant events which are not part of the natural variation within our health system. The graph shows that there have been no statistically significant events since the last Board update. Figure 2 includes an estimate of the HEAT target expressed as days between infections. It is important to note that the HEAT target is estimated to provide an indication of performance but this should be interpreted with caution. This is because NHS Borders case numbers are small and the occupied bed days denominator fluctuates. These factors will be significant in the final assessment of how NHS Borders has performed against this target.
5
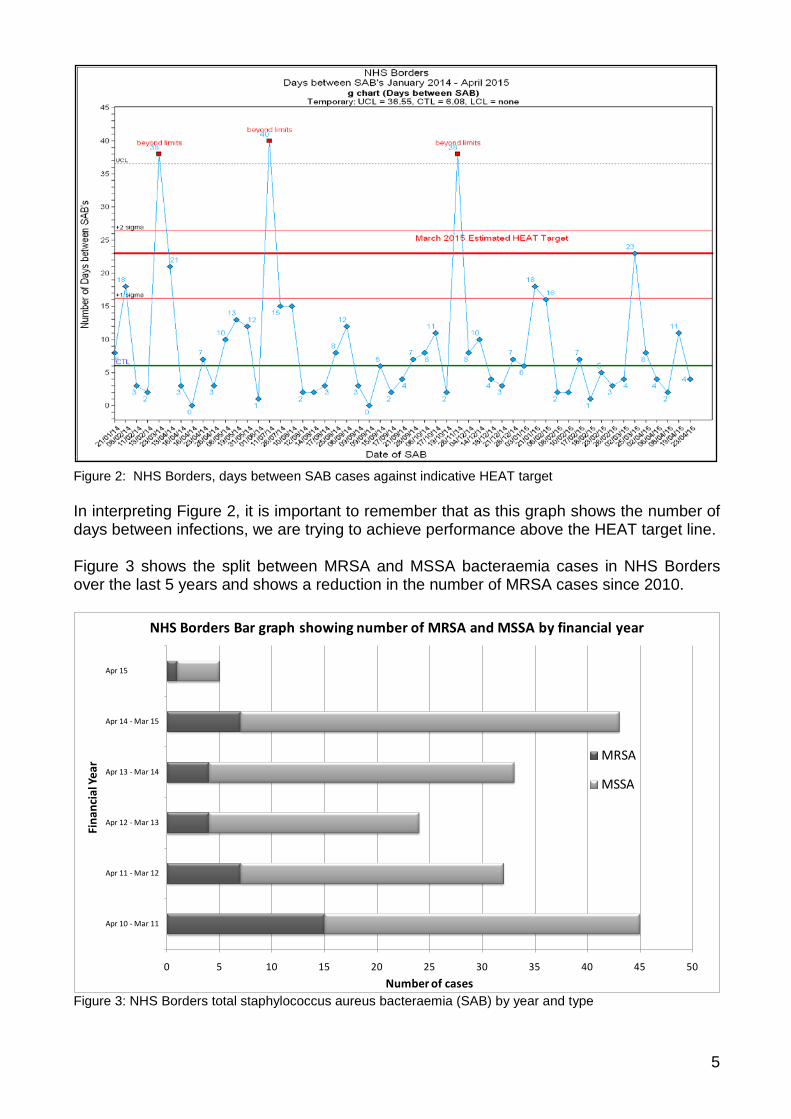
Figure 2: NHS Borders, days between SAB cases against indicative HEAT target In interpreting Figure 2, it is important to remember that as this graph shows the number of days between infections, we are trying to achieve performance above the HEAT target line. Figure 3 shows the split between MRSA and MSSA bacteraemia cases in NHS Borders over the last 5 years and shows a reduction in the number of MRSA cases since 2010.
0 5 10 15 20 25 30 35 40 45 50
Apr 10 - Mar 11
Apr 11 - Mar 12
Apr 12 - Mar 13
Apr 13 - Mar 14
Apr 14 - Mar 15
Apr 15 - Mar 16
Number of cases
Fina
ncia
l Yea
r
NHS Borders Bar graph showing number of MRSA and MSSA by financial year
MRSA
MSSA
Figure 3: NHS Borders total staphylococcus aureus bacteraemia (SAB) by year and type
6
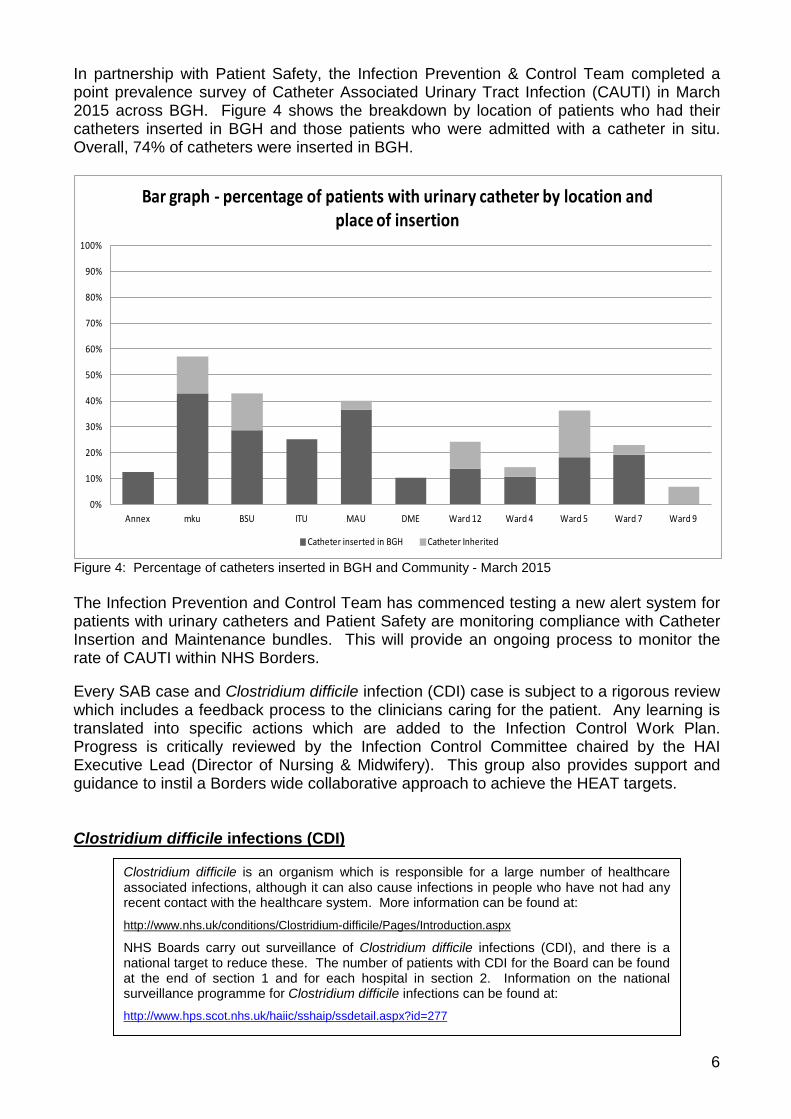
In partnership with Patient Safety, the Infection Prevention & Control Team completed a point prevalence survey of Catheter Associated Urinary Tract Infection (CAUTI) in March 2015 across BGH. Figure 4 shows the breakdown by location of patients who had their catheters inserted in BGH and those patients who were admitted with a catheter in situ. Overall, 74% of catheters were inserted in BGH. Figure 4: Percentage of catheters inserted in BGH and Community - March 2015 The Infection Prevention and Control Team has commenced testing a new alert system for patients with urinary catheters and Patient Safety are monitoring compliance with Catheter Insertion and Maintenance bundles. This will provide an ongoing process to monitor the rate of CAUTI within NHS Borders. Every SAB case and Clostridium difficile infection (CDI) case is subject to a rigorous review which includes a feedback process to the clinicians caring for the patient. Any learning is translated into specific actions which are added to the Infection Control Work Plan. Progress is critically reviewed by the Infection Control Committee chaired by the HAI Executive Lead (Director of Nursing & Midwifery). This group also provides support and guidance to instil a Borders wide collaborative approach to achieve the HEAT targets. Clostridium difficile infections (CDI)
Clostridium difficile is an organism which is responsible for a large number of healthcare associated infections, although it can also cause infections in people who have not had any recent contact with the healthcare system. More information can be found at:
http://www.nhs.uk/conditions/Clostridium-difficile/Pages/Introduction.aspx
NHS Boards carry out surveillance of Clostridium difficile infections (CDI), and there is a national target to reduce these. The number of patients with CDI for the Board can be found at the end of section 1 and for each hospital in section 2. Information on the national surveillance programme for Clostridium difficile infections can be found at: http://www.hps.scot.nhs.uk/haiic/sshaip/ssdetail.aspx?id=277
0%
10%
20%
30%
40%
50%
60%
70%
80%
90%
100%
Annex mku BSU ITU MAU DME Ward 12 Ward 4 Ward 5 Ward 7 Ward 9
Bar graph - percentage of patients with urinary catheter by location and place of insertion
Catheter inserted in BGH Catheter Inherited

7
NHS Borders is expected to achieve the Clostridium difficile infection (CDI) 2015 HEAT target rate of 32.0 cases or less per 100,000 total occupied bed days. Figure 5, shows a Statistical Process Control (SPC) chart showing the number of days between each CDI case. As with SAB cases, the reason for displaying the data in this type of chart are due to CDI cases being rare events with low numbers each month. The graph shows that there have been no statistically significant events since the last Board update.
Figure 5: NHS Borders, days between CDI cases against indicative HEAT target To date, there has been no evidence of cross transmission of Clostridium difficile infection (CDI) in NHS Borders. Hand Hygiene The hand hygiene data tables contained within the NHS Borders Report Card (Section 2 p.16) are generated from wards conducting self-audits.
Good hand hygiene by staff, patients and visitors is a key way to prevent the spread of infections. More information on the importance of good hand hygiene can be found at:
http://www.washyourhandsofthem.com/
NHS Boards monitor hand hygiene and ensure a zero tolerance approach to non compliance. The hand hygiene compliance score for the Board can be found at the end of section 1 and for each hospital in section 2. Information on national hand hygiene monitoring can be found at: http://www.hps.scot.nhs.uk/haiic/ic/nationalhandhygienecampaign.aspx

8
The Infection Prevention and Control Team follow-up with any area which either fail to submit their own audit results or which fall below 90% for two consecutive months. Hand hygiene is also incorporated into the annual infection control audit plan of compliance with the Standard Infection Control Precautions (SICPs) for 2015/16. Cleaning and the Healthcare Environment NHS Borders cleaning compliance has remained higher than the national average over recent years (Figure 6 below). The data presented within the NHS Borders Report Card (Section 2 p.16) is an average figure across the sites using the national cleaning and estates monitoring tool that was implemented in April 2012.
90
91
92
93
94
95
96
97
98
99
100
Apr -
Jun
09
Jul -
Sep
09
Oct
-De
c 09
Jan
-Mar
10
Apr -
Jun
10
Jul -
Sep
10
Oct
-De
c 10
Jan
-Mar
11
Apr -
Jun
11
Jul -
Sep
11
Oct
-De
c 11
Jan
-Mar
12
Apr -
Jun
12
Jul -
Sep
12
Oct
-De
c 12
Jan
-Mar
13
Apr -
Jun
13
Jul -
Sep
13
Oct
-De
c 13
Jan
-Mar
14
Apr -
Jun
14
Jul -
Sep
14
Oct
-De
c 14
Jan
-Mar
15
Clea
ning
Com
plia
nce
Perc
enta
ge
Quarter
NHS Borders National Cleaning Compliance with NHS Scotland Overall Total by Quarter April 2009 - March 2015
NHS Borders Compliance National Overall Total
Figure 6: NHS Borders national cleaning compliance versus NHS Scotland’s overall performance As reported to Board in February 2015, the Domestic Services Manager and Infection Control Manager are working together to improve the rigour and consistency in cleanliness monitoring. This work will have contributed to the reduced compliance reported in the
Keeping the healthcare environment clean is essential to prevent the spread of infections. NHS Boards monitor the cleanliness of hospitals and there is a national target to maintain compliance with standards above 90%.The cleaning compliance score for the Board can be found at the end of section 1 and for each hospital in section 2. Information on national cleanliness compliance monitoring can be found at:
http://www.hfs.scot.nhs.uk/online-services/publications/hai/
Healthcare environment standards are also independently inspected by the Healthcare Environment Inspectorate. More details can be found at: http://www.nhshealthquality.org/nhsqis/6710.140.1366.html
9
recent quarters as shown on Figure 6. Work is ongoing to improve cleanliness standards across NHS Borders. Other Healthcare Associated Infections (HAI) Related Activity NHS Borders Surgical Site Infection (SSI) Surveillance • NHS Borders participates in a national infection surveillance programme relating to
specific surgical procedures. This is coordinated by Health Protection Scotland and uses national definitions and methodology which enable comparison with overall NHS Scotland infection rates. The Surgical Site Infection (SSI) surveillance is conducted on the following range of procedures:- o Caesarean section o Hip Arthroplasty o Colorectal Surgery In addition, local infection surveillance is conducted on Knee Arthroplasty procedures. Table 1 (page 10) displays the results of the surgical site infection (SSI) surveillance data for each procedure since surveillance started. Please note that the data from January 2015 onwards is provisional as surveillance is maintained for 30 days post operatively and there is a subsequent data validation process coordinated by Health Protection Scotland.

10
Table 1: results of the SSI surveillance for each procedure since surveillance started
C-Section No. of Procedures No. of SSI's SSI Rate % 95% C.I. National SSI Rate % National SSI Rate 95% C.I.
2009 Jan-Dec 222 1 0.4 0.1 to 2.5 2.6 2.3 to 2.8 2010 Jan-Dec 255 3 1.1 0.4 to 3.4 2.6 2.4 to 2.9 2011Jan-Dec 222 1 0.4 0.1 to 2.5 1.4 1.1 to 1.8 2012 Jan-Dec 224 1 0.4 0.1 to 2.5 2.0 1.8 to 2.2 2013 Jan - Dec 258 0 0.0 0.0 to 5.7 1.7 0.9 to 1.8 2014 Jan - Dec 255 3 1.1 0.2 to 7.1 1.2 0.9 to 1.6 2015 Jan - Apr 9 1 1.0 0.2 to 7.1 1.2 0.9 to 1.6
Hip Arthroplasty No. of Procedures No. of SSI's SSI Rate % 95% C.I. National SSI Rate % National SSI Rate 95% C.I. 2009 Jan-Dec 230 2 0.8 0.2 to 3.1 1.2 1.0 to 1.4 2010 Jan-Dec 235 1 0.4 0 to 0.8 0.7 to 1.1 2011 Jan-Dec 222 0 0.0 0 to 1.4 1.1 to 1.8 2012 Jan-Dec 281 8 2.8 1.4 to 5.5 0.8 0.6 to 0.9 2013 Jan - Dec 295 5 1.6 0.6 to 7.7 1.0 0.6 to 1.7 2014 Jan - Dec 267 5 1.8 1.1 to 0.8 0.5 to 1.2 2015 Jan - Apr 108 0 0.0 1.1 to 0.8 0.5 to 1.2
Colorectal Surgery No. of Procedures No. of SSI's SSI Rate % 95% C.I. National SSI Rate % National SSI Rate 95% C.I. 2012 large bowel April - 80 2 2.5 0.7 to 8.7 15.0 11.4 to 19.5 2012 small bowel April - Dec 4 0 0.0 0 to 0 0 to 2013 large bowel Jan - 10 4 3.6 1.4 to 9.1 14.7 11.8 to 18.0 2013 small bowel Jan - Dec 7 0 0.0 0 to 11.5 4.0 to 29.0 2014 large bowel Jan - 11 2 1.8 0.0 to 10.7 11.2 6.8 to 17.9 2014 small bowel Jan - Dec 16 0 0.0 0.0 to 49.0 0 0.0 to 35.4 2015 large bowel Jan - Apr 29 1 3.4 0.0 to 10.7 11.2 6.8 to 17.9 2015 small bowel Jan - Apr 6 0 0.0 0.0 to 49.0 0 0.0 to 35.4
Knee Arthroplasty No. of Procedures No. of SSI Rate 95% C.I. 2011 Jan- 15 1 0.62012 Jan- 13 1 0.72013 Jan - Dec 19 4 2.06 2014 Jan - Dec 192 5 2.60 2015 Jan - Apr 53 0 0.00
SSI Surveillance Data using HPS Definitions
NHS Borders participates in the national knee arthroplasty SSI surveillance coordinated by Health Protection
(HPS). The HPS definition for a knee SSI does not include readmission data. The Infection Prevention and Control Team consider
that a more helpful definition to apply to knee SSI surveillance is the same criteria used for the national hip SSI surveillance which includes hospital
readmission data within 30 days of the operation. This local definition has therefore been used in the data table opposite and for this reason the data
is not comparable to NHS Scotland.
11
0
10
20
30
40
50
60
10/1
1/14
13/1
1/14
18/1
1/14
21/1
1/14
26/1
1/14
01/1
2/14
04/1
2/14
09/1
2/14
12/1
2/14
17/1
2/14
22/1
2/14
29/1
2/14
05/0
1/15
08/0
1/15
13/0
1/15
16/0
1/15
21/0
1/15
26/0
1/15
29/0
1/15
03/0
2/15
06/0
2/15
11/0
2/15
16/0
2/15
19/0
2/15
24/0
2/15
27/0
2/15
04/0
3/15
09/0
3/15
12/0
3/15
17/0
3/15
20/0
3/15
25/0
3/15
30/0
3/15
02/0
4/15
07/0
4/15
10/0
4/15
15/0
4/15
20/0
4/15
23/0
4/15
28/0
4/15
01/0
5/15
07/0
5/15
12/0
5/15
15/0
5/15
20/0
5/15
25/0
5/15
Date
Diarrhoea & Vomiting versus Number of Blocked BedsNovember 2014 - May 2015
Number of current symptomatic patients per day Blocked Empty bed Blocked beds
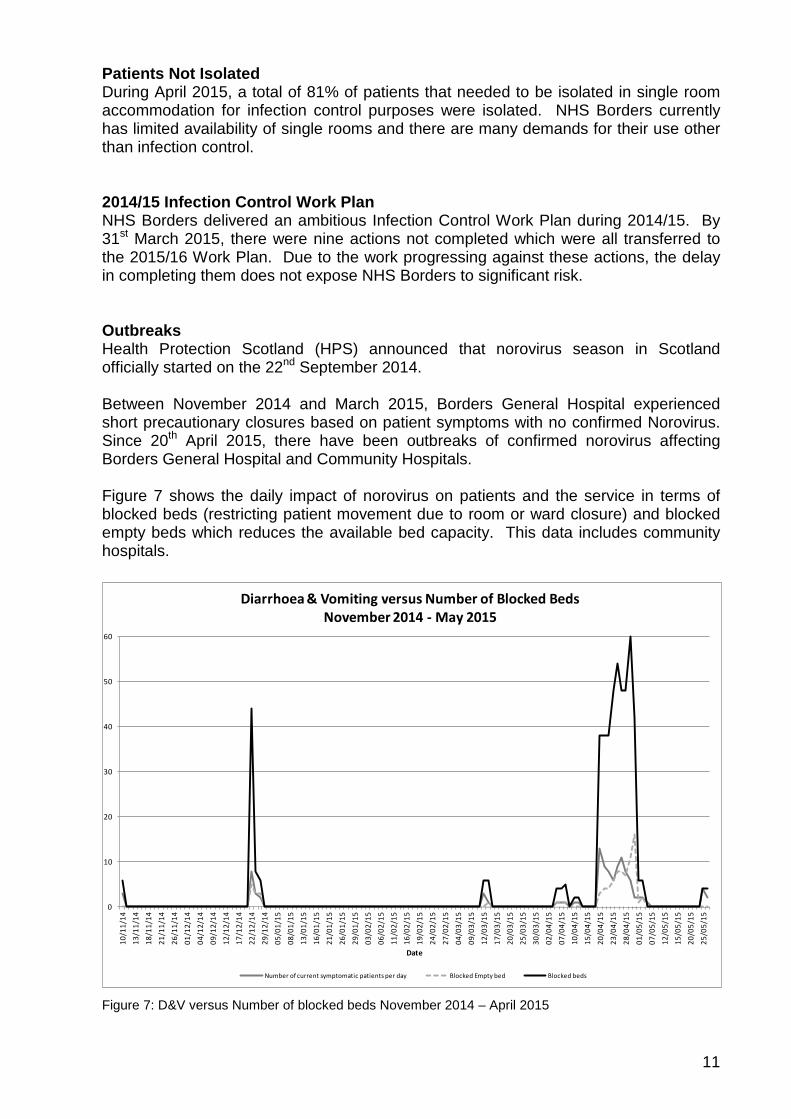
Patients Not Isolated During April 2015, a total of 81% of patients that needed to be isolated in single room accommodation for infection control purposes were isolated. NHS Borders currently has limited availability of single rooms and there are many demands for their use other than infection control. 2014/15 Infection Control Work Plan NHS Borders delivered an ambitious Infection Control Work Plan during 2014/15. By 31st March 2015, there were nine actions not completed which were all transferred to the 2015/16 Work Plan. Due to the work progressing against these actions, the delay in completing them does not expose NHS Borders to significant risk. Outbreaks Health Protection Scotland (HPS) announced that norovirus season in Scotland officially started on the 22nd September 2014.
Between November 2014 and March 2015, Borders General Hospital experienced short precautionary closures based on patient symptoms with no confirmed Norovirus. Since 20th April 2015, there have been outbreaks of confirmed norovirus affecting Borders General Hospital and Community Hospitals.
Figure 7 shows the daily impact of norovirus on patients and the service in terms of blocked beds (restricting patient movement due to room or ward closure) and blocked empty beds which reduces the available bed capacity. This data includes community hospitals. Figure 7: D&V versus Number of blocked beds November 2014 – April 2015

12
Bays Wards Bays Wards Bays Wards Bays Wards Bays Wards Bays Wards Bays Wards
Ward 4 1 1 3Total days 1 day 1 day 9 days
MAU/ Ward 6 1Total days 2 days
Ward 7 4 1Total days 1 day 1 day
DME 1Total days 9 days
Ward 16 1 1Total days 1 day 1 day
Kelso 1Total days 8 days
Haylodge 2Total days 5 days
TOTAL 0 0 1 0 6 0 0 0 0 0 1 0 8 1
The number of bay closures indicated in a month is the maximum bay closures for that periodWhen ward has been closed during a month, the bay closures indicated during this period have either preceded or followed the ward closureWard/ bay closures running over consecutive months are part of one episode
Qtr 4Nov Feb Jan
2014/2015
Infection Control Closure Summary - Viral Gastroenteritis
DecQtr 1Apr
2015/2016
Oct MarQtr 3
Proactive press releases as well as reactive responses to media queries and radio interviews have been used to keep the public up to date on the situation including precautions to take relating to norovirus. The presence of norovirus in NHS Borders reflects the wider prevalence across Scotland and in the local community. Table 2 presents a monthly closure summary of wards and bays. The sole cause of closure during the period displayed was viral gastroenteritis.
Table 2: Infection Control Closure Summary October 2014 – April 2015
Infection Control Audits Since the last Board update, an audit of compliance with Standard Infection Control Precautions (SICPs) has been completed in 12 areas across NHS Borders with all areas achieving ‘Green’ status except the locations summarised in Table 4 below. Table 3 defines the re-audit timescales based on initial audit findings.
GREEN
AMBER
3 months
76% - 84%
Re-monitoring timescale
0% - 75%
% compliance
12 months
Colour rating
RED
85% - 100%
6 months
Table 3: Infection Control Re-Audit Schedule

13
Location Audit ScoreHawick Community Hospital 82%Hay Lodge Community Hospital 83%Theatres 82% Table 4: Audited locations scoring less than 85%
As these areas scored ‘Amber’, they will be re-audited within 6 months to provide assurance that improvement has been made.
NHS Borders continue to monitor hand hygiene through monthly local reporting from each hospital ward. The Infection Prevention and Control Team conduct follow up with any area which either fail to submit their own audit results or which fall below 90% for two consecutive months. This information is reported in the Infection Control monthly report which is distributed to management, Senior Charge Nurses and the Clinical Board governance committees.
Antimicrobial Stewardship The Scottish Antimicrobial Prescribing Group (SAPG) and Scottish Government have agreed some antimicrobial prescribing indicators to underpin the CDI HEAT Target. NHS Borders maintains routine monitoring of these indicators which include compliance with antimicrobial prescribing policy in a surgical ward and a medical ward (Figure 8 and Figure 9). The Antimicrobial Management Team continues to support compliance through established feedback to clinicians, SAB and CDI case reviews, and regular antibiotic ward rounds by the Consultant Microbiologist.
Figure 8: BGH Surgical Ward – Antimicrobial policy compliance

14
Figure 9: BGH Medical Ward – Antimicrobial policy compliance
15
Healthcare Associated Infection Reporting Template (HAIRT)
Section 2 – Healthcare Associated Infection Report Cards
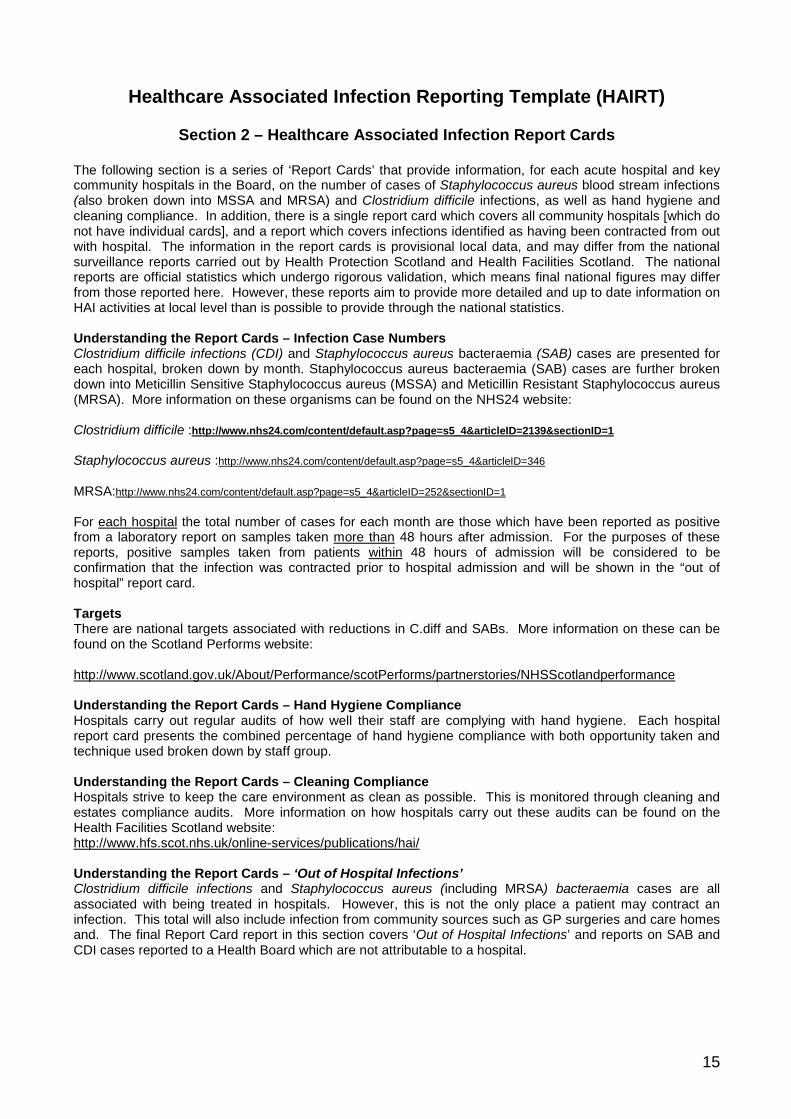
The following section is a series of ‘Report Cards’ that provide information, for each acute hospital and key community hospitals in the Board, on the number of cases of Staphylococcus aureus blood stream infections (also broken down into MSSA and MRSA) and Clostridium difficile infections, as well as hand hygiene and cleaning compliance. In addition, there is a single report card which covers all community hospitals [which do not have individual cards], and a report which covers infections identified as having been contracted from out with hospital. The information in the report cards is provisional local data, and may differ from the national surveillance reports carried out by Health Protection Scotland and Health Facilities Scotland. The national reports are official statistics which undergo rigorous validation, which means final national figures may differ from those reported here. However, these reports aim to provide more detailed and up to date information on HAI activities at local level than is possible to provide through the national statistics. Understanding the Report Cards – Infection Case Numbers Clostridium difficile infections (CDI) and Staphylococcus aureus bacteraemia (SAB) cases are presented for each hospital, broken down by month. Staphylococcus aureus bacteraemia (SAB) cases are further broken down into Meticillin Sensitive Staphylococcus aureus (MSSA) and Meticillin Resistant Staphylococcus aureus (MRSA). More information on these organisms can be found on the NHS24 website: Clostridium difficile :http://www.nhs24.com/content/default.asp?page=s5_4&articleID=2139§ionID=1 Staphylococcus aureus :http://www.nhs24.com/content/default.asp?page=s5_4&articleID=346 MRSA:http://www.nhs24.com/content/default.asp?page=s5_4&articleID=252§ionID=1 For each hospital the total number of cases for each month are those which have been reported as positive from a laboratory report on samples taken more than 48 hours after admission. For the purposes of these reports, positive samples taken from patients within 48 hours of admission will be considered to be confirmation that the infection was contracted prior to hospital admission and will be shown in the “out of hospital” report card. Targets There are national targets associated with reductions in C.diff and SABs. More information on these can be found on the Scotland Performs website: http://www.scotland.gov.uk/About/Performance/scotPerforms/partnerstories/NHSScotlandperformance Understanding the Report Cards – Hand Hygiene Compliance Hospitals carry out regular audits of how well their staff are complying with hand hygiene. Each hospital report card presents the combined percentage of hand hygiene compliance with both opportunity taken and technique used broken down by staff group. Understanding the Report Cards – Cleaning Compliance Hospitals strive to keep the care environment as clean as possible. This is monitored through cleaning and estates compliance audits. More information on how hospitals carry out these audits can be found on the Health Facilities Scotland website: http://www.hfs.scot.nhs.uk/online-services/publications/hai/ Understanding the Report Cards – ‘Out of Hospital Infections’ Clostridium difficile infections and Staphylococcus aureus (including MRSA) bacteraemia cases are all associated with being treated in hospitals. However, this is not the only place a patient may contract an infection. This total will also include infection from community sources such as GP surgeries and care homes and. The final Report Card report in this section covers ‘Out of Hospital Infections’ and reports on SAB and CDI cases reported to a Health Board which are not attributable to a hospital.

16
NHS BORDERS BOARD REPORT CARD Staphylococcus aureus bacteraemia monthly case numbers May
2014 June 2014
July 2014
Aug 2014
Sep 2014
Oct 2014
Nov 2014
Dec 2014
Jan 2015
Feb 2015
Mar 2015
Apr 2015
MRSA 0 0 0 1 1 1 0 1 1 2 0 1 MSSA 3 1 2 4 6 2 1 4 1 5 2 4 Total SABS 3 1 2 5 7 3 1 5 2 7 2 5
Clostridium difficile infection monthly case numbers May
2014 June 2014
July 2014
Aug 2014
Sep 2014
Oct 2014
Nov 2014
Dec 2014
Jan 2015
Feb 2015
Mar 2015
Apr 2015
Ages 15-64 0 0 1 2 0 0 1 1 0 0 0 0 Ages 65 plus 3 0 3 1 2 0 1 0 1 1 3 2 Ages 15 plus 3 0 4 3 2 0 2 1 1 1 3 2
Hand Hygiene Monitoring Compliance (%) May
2014 June 2014
July 2014
Aug 2014
Sep 2014
Oct 2014
Nov 2014
Dec 2014
Jan 2015
Feb 2015
Mar 2015
Apr 2015
AHP 97.1 100 100 98.4 98.6 100 100 100 100 93 100 91 Ancillary 92.9 90.2 97.2 98.0 92.9 89.3 88.1 100 97 89 88 94 Medical 95.7 98.3 96.5 97.1 94.5 94.3 95.5 96.4 96 92 95 93 Nurse 98.4 99.2 99.0 99.4 97.5 98.6 99.8 99.8 98 99 99 99 Board Total 97.2 98.5 98.4 98.8 96.7 97.1 98.3 99.3 97.8 96 97 97
Cleaning Compliance (%) May
2014 June 2014
July 2014
Aug 2014
Sep 2014
Oct 2014
Nov 2014
Dec 2014
Jan 2015
Feb 2015
Mar 2015
Apr 2015
Board Total 96.2 96.0 96.8 96.6 96.5 98.0 95.8 96.3 94.8 95.8 95.8 93.8 Estates Monitoring Compliance (%) May
2014 June 2014
July 2014
Aug 2014
Sep 2014
Oct 2014
Nov 2014
Dec 2014
Jan 2015
Feb 2015
Mar 2015
Apr 2015
Board Total 96.2 96.0 96.8 96.6 96.5 98.0 99.4 98.8 97.9 99.1 98.4 98.3
17
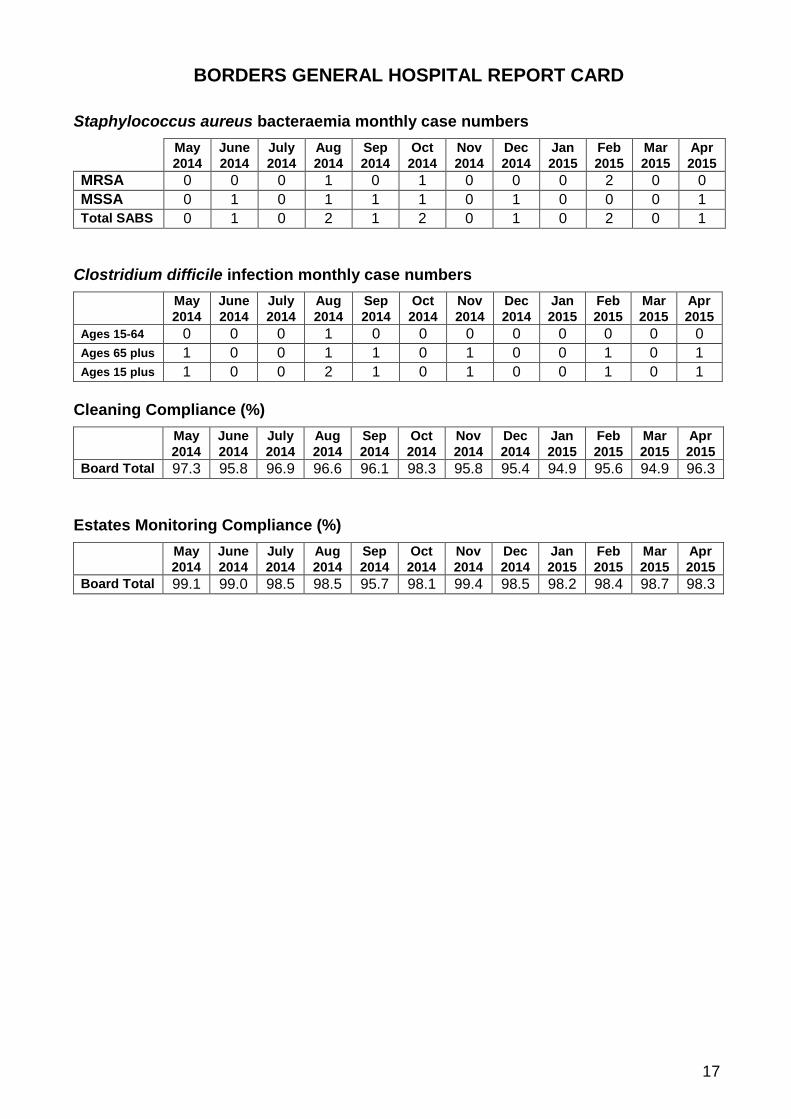
BORDERS GENERAL HOSPITAL REPORT CARD Staphylococcus aureus bacteraemia monthly case numbers May
2014 June 2014
July 2014
Aug 2014
Sep 2014
Oct 2014
Nov 2014
Dec 2014
Jan 2015
Feb 2015
Mar 2015
Apr 2015
MRSA 0 0 0 1 0 1 0 0 0 2 0 0 MSSA 0 1 0 1 1 1 0 1 0 0 0 1 Total SABS 0 1 0 2 1 2 0 1 0 2 0 1
Clostridium difficile infection monthly case numbers May
2014 June 2014
July 2014
Aug 2014
Sep 2014
Oct 2014
Nov 2014
Dec 2014
Jan 2015
Feb 2015
Mar 2015
Apr 2015
Ages 15-64 0 0 0 1 0 0 0 0 0 0 0 0 Ages 65 plus 1 0 0 1 1 0 1 0 0 1 0 1 Ages 15 plus 1 0 0 2 1 0 1 0 0 1 0 1
Cleaning Compliance (%) May
2014 June 2014
July 2014
Aug 2014
Sep 2014
Oct 2014
Nov 2014
Dec 2014
Jan 2015
Feb 2015
Mar 2015
Apr 2015
Board Total 97.3 95.8 96.9 96.6 96.1 98.3 95.8 95.4 94.9 95.6 94.9 96.3 Estates Monitoring Compliance (%) May
2014 June 2014
July 2014
Aug 2014
Sep 2014
Oct 2014
Nov 2014
Dec 2014
Jan 2015
Feb 2015
Mar 2015
Apr 2015
Board Total 99.1 99.0 98.5 98.5 95.7 98.1 99.4 98.5 98.2 98.4 98.7 98.3
18
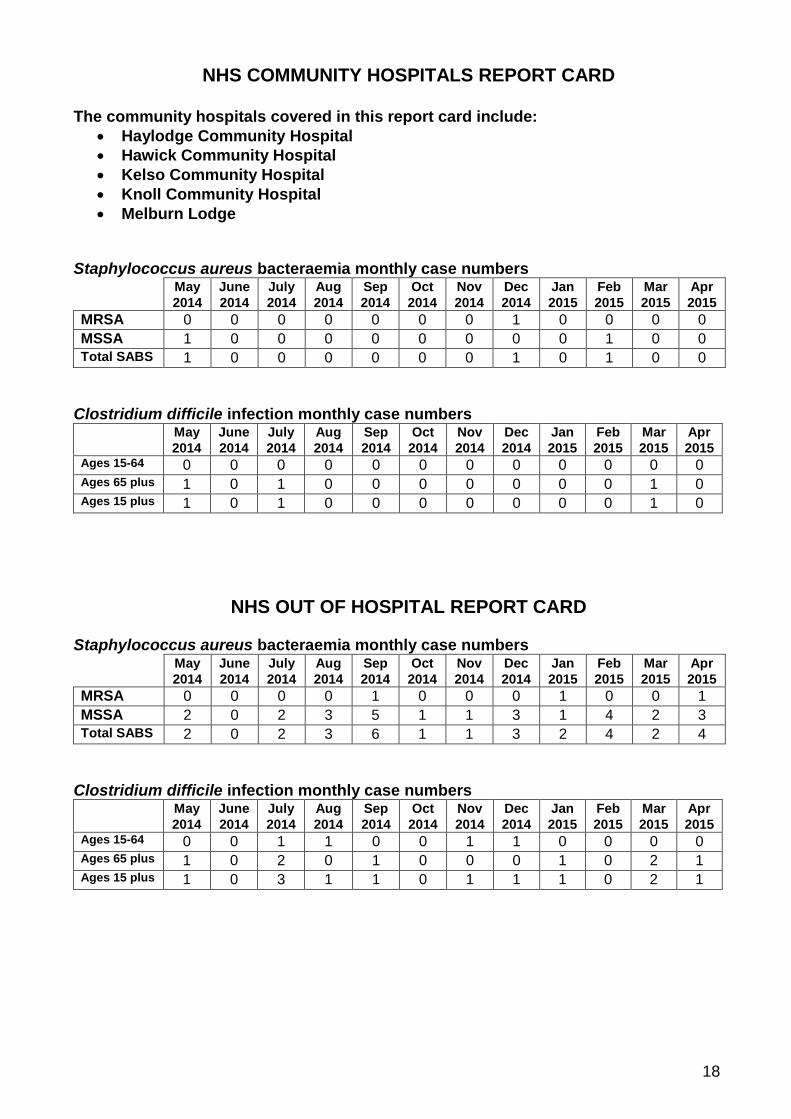
NHS COMMUNITY HOSPITALS REPORT CARD
The community hospitals covered in this report card include: • Haylodge Community Hospital • Hawick Community Hospital • Kelso Community Hospital • Knoll Community Hospital • Melburn Lodge
Staphylococcus aureus bacteraemia monthly case numbers May
2014 June 2014
July 2014
Aug 2014
Sep 2014
Oct 2014
Nov 2014
Dec 2014
Jan 2015
Feb 2015
Mar 2015
Apr 2015
MRSA 0 0 0 0 0 0 0 1 0 0 0 0 MSSA 1 0 0 0 0 0 0 0 0 1 0 0 Total SABS 1 0 0 0 0 0 0 1 0 1 0 0
Clostridium difficile infection monthly case numbers May
2014 June 2014
July 2014
Aug 2014
Sep 2014
Oct 2014
Nov 2014
Dec 2014
Jan 2015
Feb 2015
Mar 2015
Apr 2015
Ages 15-64 0 0 0 0 0 0 0 0 0 0 0 0 Ages 65 plus 1 0 1 0 0 0 0 0 0 0 1 0 Ages 15 plus 1 0 1 0 0 0 0 0 0 0 1 0
NHS OUT OF HOSPITAL REPORT CARD Staphylococcus aureus bacteraemia monthly case numbers May
2014 June 2014
July 2014
Aug 2014
Sep 2014
Oct 2014
Nov 2014
Dec 2014
Jan 2015
Feb 2015
Mar 2015
Apr 2015
MRSA 0 0 0 0 1 0 0 0 1 0 0 1 MSSA 2 0 2 3 5 1 1 3 1 4 2 3 Total SABS 2 0 2 3 6 1 1 3 2 4 2 4
Clostridium difficile infection monthly case numbers May
2014 June 2014
July 2014
Aug 2014
Sep 2014
Oct 2014
Nov 2014
Dec 2014
Jan 2015
Feb 2015
Mar 2015
Apr 2015
Ages 15-64 0 0 1 1 0 0 1 1 0 0 0 0 Ages 65 plus 1 0 2 0 1 0 0 0 1 0 2 1 Ages 15 plus 1 0 3 1 1 0 1 1 1 0 2 1