Embed Size (px)
Citation preview
www.africaneconomicoutlook.org
Botswana2012
BotswanaBotswana’s economy is projected to grow at 4.8 % and 6.7 % in 2012, and 2013, respectively.
Inflation remained high at 9.2 % in December 2011 and above the Bank of Botswana’s (BoB) objectiverange of 3-6%. However, it is expected to ease in 2012 and 2013 as below potential output in the miningsector and reduced public expenditure are expected to subdue growth in demand.
Botswana is however, faced with challenges of high unemployment rate of 17.6 %, poverty level of 20.7 %and high income inequality. Programs underway to address these challenges include among others, laborintensive public works programme (Ipelegeng), youth employment and development funds and provision ofsocial safety nets. The National Economic Diversification Drive Strategy (NEDDS) which is intended toenhance productive capacity of domestic firms is expected to have significant contribution in employmentcreation and broad-based economic growth.
Overview
Botswana’s economy remains one of Africa’s success stories, having transformed itself from a Least DevelopedCountry at the time of independence in 1966 to a Middle Income Country within three decades. Soundmacroeconomic policies, good governance, well-functioning institutions and judicious management of diamondresources are the hallmarks of Botswana’s remarkable economic performance. The per capita income whichstood at around USD 70 in 1966 is currently at about USD 6 500, bolstered by the discovery of diamonds.
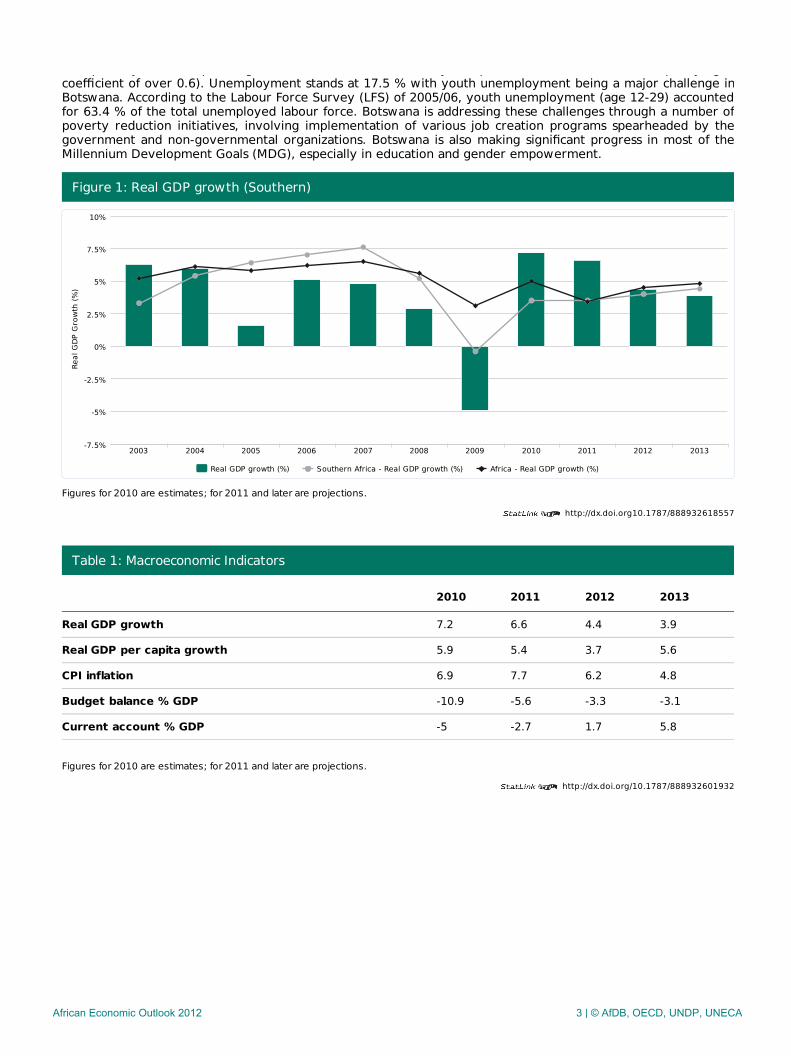
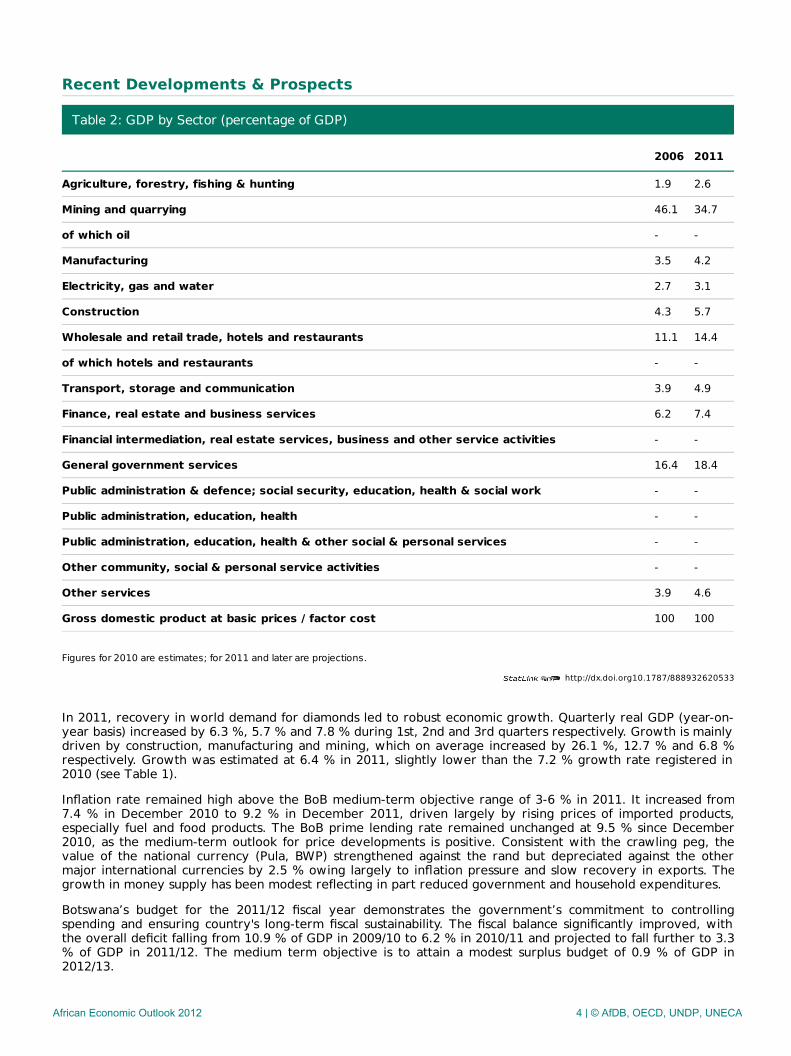
Botswana’s economy rebounded strongly from the 2009 economic downturn, aided by improved global demandfor diamonds - the country’s major export commodity. The economy grew by 7.2 % in 2010 up from a negativegrowth of 4.9 % in 2009 and is expected to grow by 6.4 % in 2011 and slow down to around 4.8 % in 2012. Themajor contributor to the recovery and growth include mining, construction, and manufacturing. Capitalformation accounts for the largest share at 56% of the real GDP growth, followed by the external sector. Worthnoting is the gradual transformation of the economy away from the mining sector. While in 2006 the miningsector accounted for 46.1 % of GDP, in 2010 the sector’s contribution has declined to 34.7 % in favor ofmanufacturing, construction and service oriented sectors (see Table 2). Botswana’s medium term economicprospects will continue to depend on global demand for its major exports, notably diamonds and improvedprivate sector investment.
Botswana is undergoing fiscal consolidation following the widened budget deficits caused by the global financialcrisis. The government is committed to reducing the budget deficit and achieving a balanced budget by2012/13, through improved revenue collection and restrained recurrent and development expenditures, whilemaintaining economic growth. Budget deficit is thus expected to narrow from 8.1 % of GDP in 2010/11 to 5.2 %in 2011/12 and further to a balanced budget in 2012/13.
Following increased prices of fuel and food imports, Botswana’s inflation rate ranged beyond the medium termobjective of 3-6 %, averaging 8.5 % over the period of January- December 2011. The BoB expects the inflationpressure to ease as a result of persistent low domestic demand pressure and restrained global inflation causedby low capacity utilization and high unemployment rates. To this end, Botswana’s inflation is expected to remainwithin the medium term objective range of 3–6% by second quarter of 2012.
Botswana has recorded significant improvement in its external balance, as the recovery in world demand fordiamonds led to substantial increase in export receipts. Total export receipts in 2011 increased by 24.8 % innominal terms to BWP 39,998.1 million from exports realized in 2010, with diamond exports accounting for 75.6% of total export receipts. Consequently, both trade and current account balances have substantially improved,with prospects of surplus balances in 2012 and beyond. In line with improved export earnings, gross officialreserves have remained high at USD 8.8 billion in October 2011; an equivalent of about 19 months of imports ofgoods and services.
Botswana’s outstanding external debt level is still low and sustainable, despite its recent rise following theglobal economic and financial crisis. Following its sharp rise from 8.4 % of GDP in 2008 to 23.3 % in 2009, it isestimated to decline to 20.4 % in 2011 and furthermore to 12.3 % of GDP by 2015, in line with the ongoingfiscal consolidation measures that focuses on completion of ongoing infrastructure projects and limit expenditureon high return projects.
Despite the impressive economic performances, Botswana is still faced with high levels of poverty, inequality,and unemployment, as well as high HIV/AIDS prevalence rates. Although there has been a decline in theproportion of the population living below the poverty line from 30.6 % in 2002/03 to about 20.7 % in 2009/10.The poverty level is quite high for a middle income country, coupled with severe income inequality (gini
African Economic Outlook 2012 2 | © AfDB, OECD, UNDP, UNECA
http://dx.doi.org10.1787/888932618557
http://dx.doi.org/10.1787/888932601932
The poverty level is quite high for a middle income country, coupled with severe income inequality (ginicoefficient of over 0.6). Unemployment stands at 17.5 % with youth unemployment being a major challenge inBotswana. According to the Labour Force Survey (LFS) of 2005/06, youth unemployment (age 12-29) accountedfor 63.4 % of the total unemployed labour force. Botswana is addressing these challenges through a number ofpoverty reduction initiatives, involving implementation of various job creation programs spearheaded by thegovernment and non-governmental organizations. Botswana is also making significant progress in most of theMillennium Development Goals (MDG), especially in education and gender empowerment.
Figure 1: Real GDP growth (Southern)
Figures for 2010 are estimates; for 2011 and later are projections.
Table 1: Macroeconomic Indicators
2010 2011 2012 2013
Real GDP growth 7.2 6.6 4.4 3.9
Real GDP per capita growth 5.9 5.4 3.7 5.6
CPI inflation 6.9 7.7 6.2 4.8
Budget balance % GDP -10.9 -5.6 -3.3 -3.1
Current account % GDP -5 -2.7 1.7 5.8
Figures for 2010 are estimates; for 2011 and later are projections.
Real GDP growth (%) Southern Africa - Real GDP growth (%) Africa - Real GDP growth (%)
2003 2004 2005 2006 2007 2008 2009 2010 2011 2012 2013-7.5%
-5%
-2.5%
0%
2.5%
5%
7.5%
10%
Real
GDP
Gro
wth
(%)
African Economic Outlook 2012 3 | © AfDB, OECD, UNDP, UNECA
http://dx.doi.org10.1787/888932620533
Recent Developments & Prospects
Table 2: GDP by Sector (percentage of GDP)
2006 2011
Agriculture, forestry, fishing & hunting 1.9 2.6
Mining and quarrying 46.1 34.7
of which oil - -
Manufacturing 3.5 4.2
Electricity, gas and water 2.7 3.1
Construction 4.3 5.7
Wholesale and retail trade, hotels and restaurants 11.1 14.4
of which hotels and restaurants - -
Transport, storage and communication 3.9 4.9
Finance, real estate and business services 6.2 7.4
Financial intermediation, real estate services, business and other service activities - -
General government services 16.4 18.4
Public administration & defence; social security, education, health & social work - -
Public administration, education, health - -
Public administration, education, health & other social & personal services - -
Other community, social & personal service activities - -
Other services 3.9 4.6
Gross domestic product at basic prices / factor cost 100 100
Figures for 2010 are estimates; for 2011 and later are projections.
In 2011, recovery in world demand for diamonds led to robust economic growth. Quarterly real GDP (year-on-year basis) increased by 6.3 %, 5.7 % and 7.8 % during 1st, 2nd and 3rd quarters respectively. Growth is mainlydriven by construction, manufacturing and mining, which on average increased by 26.1 %, 12.7 % and 6.8 %respectively. Growth was estimated at 6.4 % in 2011, slightly lower than the 7.2 % growth rate registered in2010 (see Table 1).
Inflation rate remained high above the BoB medium-term objective range of 3-6 % in 2011. It increased from7.4 % in December 2010 to 9.2 % in December 2011, driven largely by rising prices of imported products,especially fuel and food products. The BoB prime lending rate remained unchanged at 9.5 % since December2010, as the medium-term outlook for price developments is positive. Consistent with the crawling peg, thevalue of the national currency (Pula, BWP) strengthened against the rand but depreciated against the othermajor international currencies by 2.5 % owing largely to inflation pressure and slow recovery in exports. Thegrowth in money supply has been modest reflecting in part reduced government and household expenditures.
Botswana’s budget for the 2011/12 fiscal year demonstrates the government’s commitment to controllingspending and ensuring country's long-term fiscal sustainability. The fiscal balance significantly improved, withthe overall deficit falling from 10.9 % of GDP in 2009/10 to 6.2 % in 2010/11 and projected to fall further to 3.3% of GDP in 2011/12. The medium term objective is to attain a modest surplus budget of 0.9 % of GDP in2012/13.
African Economic Outlook 2012 4 | © AfDB, OECD, UNDP, UNECA
Botswana has recorded significant improvement in its external balance, as the recovery in world demand fordiamonds led to substantial increase in export receipts. Total export receipts in 2011 reached BWP 39,998.1million (about USD 5,882 million), recording an increase of 24.8 % compared with the amount of BWP 32,049.4million (about USD 4,713.1) million realized in 2010[1]. Diamond exports accounted for 75.6 % of total exportreceipt in 2011. Robust demand for diamonds in India and China and increasing status of diamonds as a safehaven commodity for investors are expected to continue keeping prices of diamonds high in 2012. In line withthe increase in export earning, gross foreign reserves have remained high at USD 8.824 billion in October 2011,an amount equivalent to 19 months of imports of goods and services. As exports recovered, the trade andcurrent account deficits have significantly improved, with the gaps expected to narrow substantially in 2011,followed by surplus balances in 2012 and beyond. Preliminary estimates of the current account of the balance ofpayments for 2011, indicate a deficit of around 3 % of GDP compared to a deficit of 5 % of GDP in 2010 (seeTable 3). As indicated in Table 4, increase in exports has positively improved composition of aggregate demand,in favour of gross capital formation. External demand balance is expected to reach the pre-crisis level by 2013,contributing to increased gross capital formation from 30.8 % of GDP in 2008 to 33 % in 2013.
African Economic Outlook 2012 5 | © AfDB, OECD, UNDP, UNECA
http://dx.doi.org10.1787/888932621521
Macroeconomic Policy
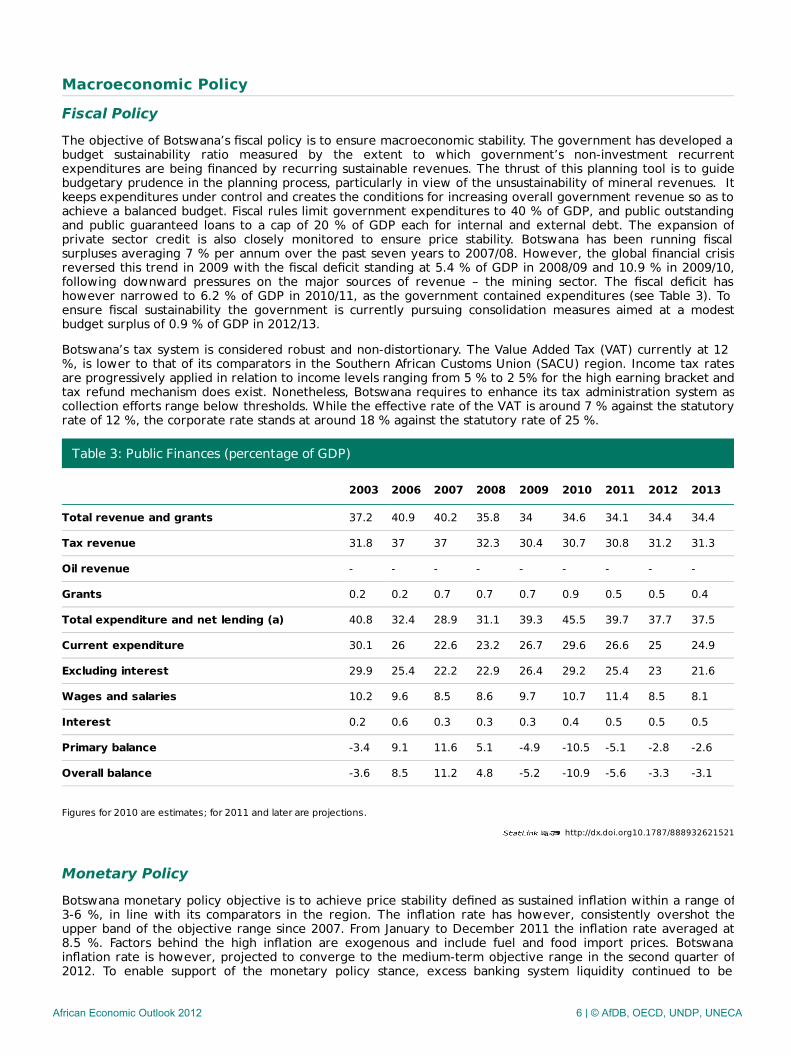
Fiscal PolicyThe objective of Botswana’s fiscal policy is to ensure macroeconomic stability. The government has developed abudget sustainability ratio measured by the extent to which government’s non-investment recurrentexpenditures are being financed by recurring sustainable revenues. The thrust of this planning tool is to guidebudgetary prudence in the planning process, particularly in view of the unsustainability of mineral revenues. Itkeeps expenditures under control and creates the conditions for increasing overall government revenue so as toachieve a balanced budget. Fiscal rules limit government expenditures to 40 % of GDP, and public outstandingand public guaranteed loans to a cap of 20 % of GDP each for internal and external debt. The expansion ofprivate sector credit is also closely monitored to ensure price stability. Botswana has been running fiscalsurpluses averaging 7 % per annum over the past seven years to 2007/08. However, the global financial crisisreversed this trend in 2009 with the fiscal deficit standing at 5.4 % of GDP in 2008/09 and 10.9 % in 2009/10,following downward pressures on the major sources of revenue – the mining sector. The fiscal deficit hashowever narrowed to 6.2 % of GDP in 2010/11, as the government contained expenditures (see Table 3). Toensure fiscal sustainability the government is currently pursuing consolidation measures aimed at a modestbudget surplus of 0.9 % of GDP in 2012/13.
Botswana’s tax system is considered robust and non-distortionary. The Value Added Tax (VAT) currently at 12%, is lower to that of its comparators in the Southern African Customs Union (SACU) region. Income tax ratesare progressively applied in relation to income levels ranging from 5 % to 2 5% for the high earning bracket andtax refund mechanism does exist. Nonetheless, Botswana requires to enhance its tax administration system ascollection efforts range below thresholds. While the effective rate of the VAT is around 7 % against the statutoryrate of 12 %, the corporate rate stands at around 18 % against the statutory rate of 25 %.
Table 3: Public Finances (percentage of GDP)
2003 2006 2007 2008 2009 2010 2011 2012 2013
Total revenue and grants 37.2 40.9 40.2 35.8 34 34.6 34.1 34.4 34.4
Tax revenue 31.8 37 37 32.3 30.4 30.7 30.8 31.2 31.3
Oil revenue - - - - - - - - -
Grants 0.2 0.2 0.7 0.7 0.7 0.9 0.5 0.5 0.4
Total expenditure and net lending (a) 40.8 32.4 28.9 31.1 39.3 45.5 39.7 37.7 37.5
Current expenditure 30.1 26 22.6 23.2 26.7 29.6 26.6 25 24.9
Excluding interest 29.9 25.4 22.2 22.9 26.4 29.2 25.4 23 21.6
Wages and salaries 10.2 9.6 8.5 8.6 9.7 10.7 11.4 8.5 8.1
Interest 0.2 0.6 0.3 0.3 0.3 0.4 0.5 0.5 0.5
Primary balance -3.4 9.1 11.6 5.1 -4.9 -10.5 -5.1 -2.8 -2.6
Overall balance -3.6 8.5 11.2 4.8 -5.2 -10.9 -5.6 -3.3 -3.1
Figures for 2010 are estimates; for 2011 and later are projections.
Monetary PolicyBotswana monetary policy objective is to achieve price stability defined as sustained inflation within a range of3-6 %, in line with its comparators in the region. The inflation rate has however, consistently overshot theupper band of the objective range since 2007. From January to December 2011 the inflation rate averaged at8.5 %. Factors behind the high inflation are exogenous and include fuel and food import prices. Botswanainflation rate is however, projected to converge to the medium-term objective range in the second quarter of2012. To enable support of the monetary policy stance, excess banking system liquidity continued to be
African Economic Outlook 2012 6 | © AfDB, OECD, UNDP, UNECA
http://dx.doi.org10.1787/888932622509
absorbed through open market operations using the BoB Certificates, as well as through increasing primaryreserve requirement for pula-denominated deposits with commercial banks. In an effort to spur domesticinvestment, the Bank rate has remained unchanged at 9.5 % since December 2010, as the medium terminflation outlook is forecast to remain low. A combination of both low external and internal demand will help tokeep inflationary pressure in check, as global inflation is restrained by low capacity utilization and highunemployment rates. Domestic inflationary pressure is also restrained by sluggish growth in personal incomesand reduced government expenditure. Upside risks to the inflation outlook are upward adjustment inadministered prices and levies for government services, and an increase in international food and fuel prices.
The real value of the Botswana currency (Pula) against major foreign currencies has remained stable andcompetitive in line with the crawling-peg regime. Botswana crawling band exchange rate regime isimplemented through continuous adjustment of the trade-weighted Nominal Effective Exchange rate (NEER) ofthe Pula at a rate of crawl based on the differential between the Bank’s inflation objective and the forecastinflation of trading partner countries. The rate of crawl is thus determined using a forward-looking approachand is revised on a regular basis. Although in 2010 the Pula weakened by 7.4 % against the rand, it appreciatedby 5.8 % in 2011. However, the Pula weakened against other major foreign currencies, reflective of thepersistent high inflation rate .The Pula depreciated against the Euro by 11.6 %, British Pound by 14.1 %, USDollar by 14.4 % and against the Yen by 18 %.
Economic Cooperation, Regional Integration & TradeBotswana is a contracting member of the SACU, hence goods exported and imported to and from South Africa,Namibia, Lesotho and Swaziland enjoy free movement without payment of customs duties and quantitativerestrictions. As a member of the SACU, Botswana signed a Trade, Investment, and Development CooperationAgreement (TIDCA) with the United States in July 2008. In the meantime, Botswana still benefits from quota-free and duty-free entry of certain goods into the United States under the African Growth and Opportunity Act(AGOA). Botswana is also a member of the 15-country Southern African Development Community (SADC) andenjoys free movement of goods under the SADC Trade Protocol on Most Favoured Nation Treatment (MFN) ongoods traded between the member states. The country also belongs to the seven-country SADC EconomicPartnership Agreement (EPA) group, and was one of the four members who signed an interim EPA with theEuropean Union (EU) in June 2009. By signing this interim agreement, Botswana and the EU will now worktowards a full EPA covering services and investment.
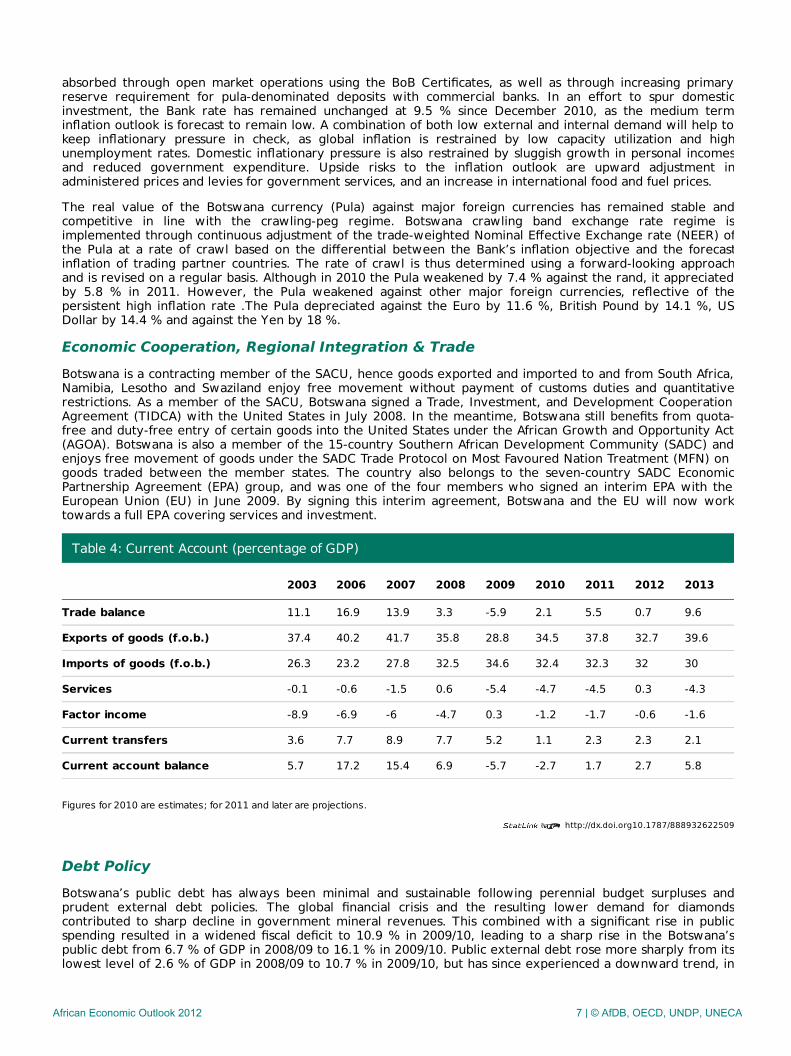
Table 4: Current Account (percentage of GDP)
2003 2006 2007 2008 2009 2010 2011 2012 2013
Trade balance 11.1 16.9 13.9 3.3 -5.9 2.1 5.5 0.7 9.6
Exports of goods (f.o.b.) 37.4 40.2 41.7 35.8 28.8 34.5 37.8 32.7 39.6
Imports of goods (f.o.b.) 26.3 23.2 27.8 32.5 34.6 32.4 32.3 32 30
Services -0.1 -0.6 -1.5 0.6 -5.4 -4.7 -4.5 0.3 -4.3
Factor income -8.9 -6.9 -6 -4.7 0.3 -1.2 -1.7 -0.6 -1.6
Current transfers 3.6 7.7 8.9 7.7 5.2 1.1 2.3 2.3 2.1
Current account balance 5.7 17.2 15.4 6.9 -5.7 -2.7 1.7 2.7 5.8
Figures for 2010 are estimates; for 2011 and later are projections.
Debt PolicyBotswana’s public debt has always been minimal and sustainable following perennial budget surpluses andprudent external debt policies. The global financial crisis and the resulting lower demand for diamondscontributed to sharp decline in government mineral revenues. This combined with a significant rise in publicspending resulted in a widened fiscal deficit to 10.9 % in 2009/10, leading to a sharp rise in the Botswana’spublic debt from 6.7 % of GDP in 2008/09 to 16.1 % in 2009/10. Public external debt rose more sharply from itslowest level of 2.6 % of GDP in 2008/09 to 10.7 % in 2009/10, but has since experienced a downward trend, in
African Economic Outlook 2012 7 | © AfDB, OECD, UNDP, UNECA
http://dx.doi.org10.1787/888932618557
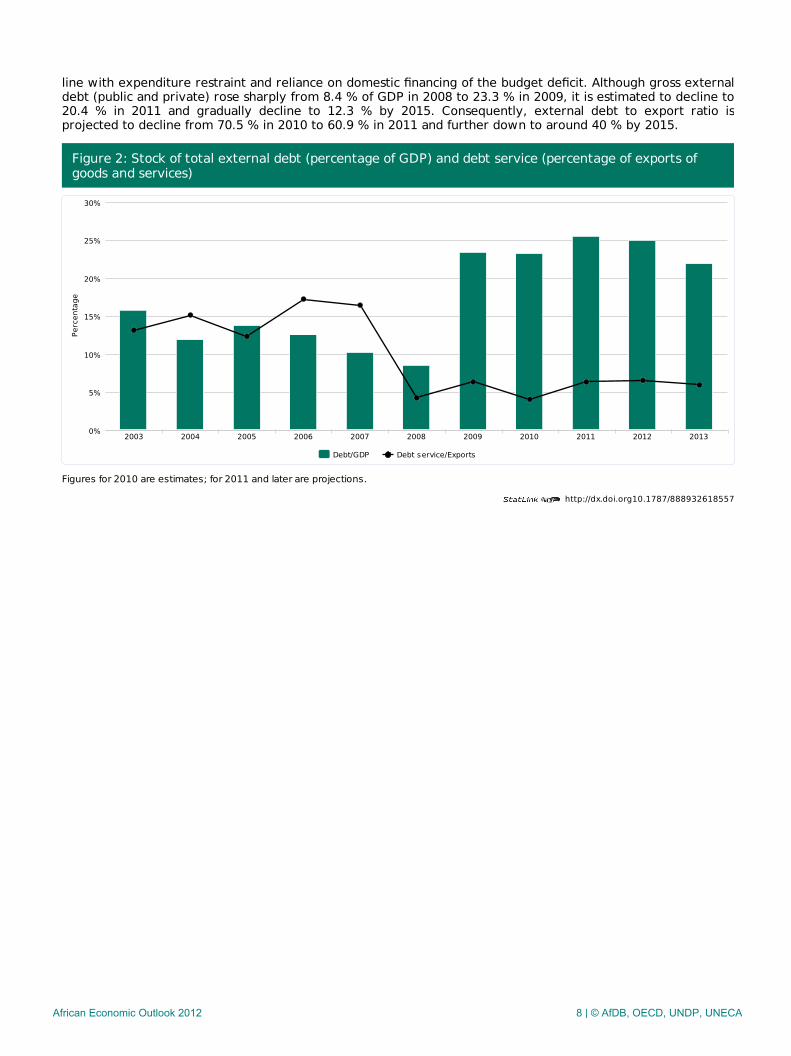
line with expenditure restraint and reliance on domestic financing of the budget deficit. Although gross externaldebt (public and private) rose sharply from 8.4 % of GDP in 2008 to 23.3 % in 2009, it is estimated to decline to20.4 % in 2011 and gradually decline to 12.3 % by 2015. Consequently, external debt to export ratio isprojected to decline from 70.5 % in 2010 to 60.9 % in 2011 and further down to around 40 % by 2015.
Figure 2: Stock of total external debt (percentage of GDP) and debt service (percentage of exports ofgoods and services)
Figures for 2010 are estimates; for 2011 and later are projections.
Debt/GDP Debt service/Exports
2003 2004 2005 2006 2007 2008 2009 2010 2011 2012 20130%
5%
10%
15%
20%
25%
30%
Perc
enta
ge
African Economic Outlook 2012 8 | © AfDB, OECD, UNDP, UNECA
Economic & Political Governance
Private SectorBotswana boasts a favorable business environment with good infrastructure development, regulatoryframeworks and taxation system. As highlighted in Table 2 above, private sector investments account for asignificant share of Botswana’s economic growth and provides 50 % of employment. The World Bank’s 2011Ease of Doing Business ranks Botswana’s business environment third in Africa after Mauritius (20th) and SouthAfrica (34th) and among the top 50 ranked countries in the world in terms of access to credit, registeringproperty, paying taxes, protecting investors and closing a business.
Botswana’s tax system has been instrumental for increased private sector investments in the country. The taxrate of 19.5 % on profit is lower than the average rate of 68 % for Sub-Saharan Africa (SSA) and 43 % for theOECD countries. Registering a property in Botswana takes much shorter time (16 days) compared to 68 and 33days for SSA average and OEDC respectively. However, Botswana performs poorly in aspects of starting abusiness, dealing with construction permits, and trading across borders. Botswana has a long processing systemfor granting construction permits (24 procedures that takes about 125 days), which does not compare favorablyto that of SSA where it takes an average of 17 procedures and 51days. Moreover, Botswana being a landlockedcountry (located about 1,000 km away from the nearest port facility) incurs about 30 % more in transport costfor its exports and imports than the SSA average.
Botswana has liberalized its capital account which allows foreign investors to repatriate their profits. This policyis spearheaded by the Botswana International Financial Services Centre (IFSC). Through the IFSC, Botswanaoffers a number of investment incentives to foreign companies including (i) A discounted corporate tax rate of15 % on profit; (ii) Exemption from Withholding Tax on interest, dividends, management fees and royalties paidto a non-resident; (iii) Exemption from Value Added Tax and Capital Gains Tax; and (iv) Access to Botswana’s200% tax training rebate. Furthermore, the IFSC companies have access to Botswana’s expanding DoubleTaxation Treaty network and to cushion investors from losses brought by exchange rate movements, thecompanies are allowed to denominate their capital in any of the international recognized currencies.
To further promote private sector to spur economic diversification, the Government has put in place a newNational Strategy on Economic Diversification Drive (EDD) spanning 2011-16. The newly adopted EDD Strategyenvisages diversification of the economy through development of globally competitive enterprises that needlittle or no government protection and support. In the short-term, the EDD strategy will exploit governmentpurchasing power to build production capacity of local firms. Among strategic measures include governmentprocurement from local firms on locally produced goods and services, and granting of preferential margins tolocal firms while bidding for public tenders. As the government imports about BWP 20 billion (aboutUSD 3 billion) annually, shifting such demand to locally produced goods and services could substantially boostproduction of local firms in the short run, while building capacity of such firms to compete globally in the longrun.
Within the context of diamond beneficiation, an agreement has been reached between the government and theDe Beers to relocate its Diamond Trading Centre (DTC) in London to Gaborone by 2013. Under the agreementsigned on 16th September 2011, all diamonds produced in Botswana will be processed and marketed fromBotswana. Furthermore, the government will be able to market 10% of the diamonds from Debswana outsidethe De Beers sales channels, with this proportion rising to 15 % in five years. This move will enable transformBotswana into a World Diamond Trading Centre, as diamonds from South Africa, Namibia and Canada will beaggregated and sold from there.
Financial SectorFollowing robust supervisory standards, the financial sector in Botswana showed remarkable resilience duringthe global economic and financial crisis of 2009, with no bank failure experienced. As of March 2011, the ratio ofnon-performing loans (NPLs) to gross loans was as low as 2.5 % compared to 3.3 % in March 2010, and the ratioof loans to assets was well below 50 % at 44.3 %. The banking sector on average is profitable although the rateis still low as the sector recovers from the impact of the global financial crisis. Return on average assets was just0.6 % by March 2011, compared with an average of 2.8 % over past three years (2007-09). Foreign exchangerisks are low as the ratio of foreign currency denominated loans to total loans was only 8.1 % by March 2011,against foreign currency deposits of 15.5 % of total deposits.
Access to credit by the private sector, including household borrowing is supported by a well-establishedborrower information system. Private bureau coverage stands at 57 % of adults and this has aided extension ofcredit to the private sector, to the extent that private sector credit now accounts for about 50% of total moneysupply and around 20 % of GDP. The level of private sector credit is however, far below Botswana’s regional
African Economic Outlook 2012 9 | © AfDB, OECD, UNDP, UNECA
peers (South Africa, Mauritius, and Namibia with 80 %, 56 % and 43 % of GDP respectively). The Botswanabanking sector is developing quite rapidly. By the end of December 2010, the sector had 10 commercial banks,dominated by foreign banks[1]. While commercial banks are regulated by the BoB, the non-banking financialinstitutions are regulated by the Non-Banking Financial Institutions Regulatory Authority (NBFIRA) created in2008. The Botswana International Financial Service Centre (IFSC) established in 2003, is instrumental in thepromotion of cross-border investments in the financial sector. The Centre had already attracted 46 companiesby 2010, with a cumulative capital of over BWP 9 billion (equivalent to USD 1.4 billion) targeting investmentsacross the Southern African region.
The Botswana Stock Exchange (BSE) is another body instrumental in creating private sector investmentopportunities. The BSE has experienced a sizable number of listed companies to around 30 firms since 2008,marked with a gradual increase in the volume of its shares to around BWP 308.6 million in 2010, and marketcapitalisation of BWP 434.9 billion (about 30 % of GDP).[2] The BSE applies automated trading system essentialfor raising the operations of the Exchange to at par with more developed markets. To further strengthen theoperations of the BSE. In 2011, the government enacted the Security Act which facilitates changing of the BSEfrom a statutory body to a commercial entity. The Act will help BSE achieve the structural and governancechanges in line with its corporate strategy.
Public Sector Management, Institutions & ReformIn line with the Botswana Vision 2016 pillar of an open, democratic and accountable nation, transparency andaccountability in all public and private institutions, rule of law and enhanced participatory democracy are amongkey goals underpinning the 10th National Development Plan (NDP 10). To ensure the realisation of these goals anumber of measures and reform frameworks are in place. At the highest level the constitution of Botswanaprovides a number of internal accountability mechanisms in the operations of the three branches ofgovernment; the Executive, the Legislative and Judiciary. Oversight institutions are also in place and haveundergone reforms aimed at enhancing their capacity in service delivery[1].
To ensure an efficient and effective public service, the government is implementing a program in Public SectorModernization. The program is designed to foster a customer-oriented ethic and transform the public sector intoa world class service sector. Survey on government effectiveness and customer satisfaction are used to measureoutcomes of the program. The aim of the program by 2016, is to ensure that government effectiveness andcustomer satisfaction will rise to 80 % and 7 5% respectively from the baseline of 25 % in 2009. The PublicFinance Management (PFM) Reform Program is also underway to further enhance accountability in publicfinancial resources. The PFM Reform Program is aimed at strengthening financial management systems tosupport fiscal discipline, strategic allocation of resources, effective and efficient service delivery, and ensureaccountability.
In view of the aforementioned, Botswana is proud of a culture of strong political, administrative and financialmanagement accountability mechanisms. Botswana ranks at the top of African countries in terms of governanceand transparency indices. The country was ranked 33rd out of 178 countries in the Transparency International2010 Corruption Perception index, ahead of all Sub-Sahara African countries and above some advancedcountries such as South Korea. Similarly, according to the Mo Ibrahim Foundation’s Index of African Governance,Botswana was ranked 3rd out of 53 African countries in 2010 (behind Mauritius and Seychelles). Botswana is alsoconsidered among the most peaceful countries in the world. It was ranked 33rd out of 149 countries in 2010 bythe Global Peace Index, placing the country just behind Singapore, France and the United Kingdom.
Natural Resource Management & EnvironmentBotswana demonstrates strong compliance with a number of international environmental agreements includingthe Convention on Wetlands of International Importance (1971), the Convention on Biological Diversity (1992),the Climate Change Convention (1992), Kyoto Protocol to UN Framework on Climate Change, the UNConvention to Combat Desertification (1994), the Permanent Okavango River Basin Agreement (1994) and theSADC Protocol on Wildlife Conservation and Law Enforcement (1999). In compliance with these agreementsBotswana has put in place a number of sector specific policy measures on sustainable resource use such as theNational Policy on Natural Resource Conservation and Development (1990), the Tourism Policy (1990), theAgriculture Policy (1991), the National Water Master Plan (1992) and the National Settlement Policy (1998).
The Vision 2016 reaffirms the importance of sustainable development and the protection of the environment. Itis against this background that conservation and sustainable management of natural resources are fullyintegrated in the development planning process. Within the context of the National Development Plan (NDP-10), specific goals have been set across sectors to ensure attainment of the Millennium Development Goal(MDG) 7 on environmental sustainability by 2015. Over a third of the country’s total land area is under someform of conservation, with 17 % as national parks and game reserves, 20 % as wildlife management areas and
African Economic Outlook 2012 10 | © AfDB, OECD, UNDP, UNECA
1 % as forest reserves. Participation of communities in natural resource conservation is practiced through acommunity-based natural resources management programme.
Political ContextBotswana’s political environment is among the most stable in Africa and has been supportive of prudentmacroeconomic and poverty reduction policies. The political framework is based on a parliamentaryrepresentative democratic republic, whereby Botswana’s President is both head of state and government. Amultiparty constitutional democracy prevails, where each of the elections since independence in 1966 havebeen freely and fairly contested and held on schedule. The Botswana Democratic Party (BDP) is the dominantparty and has consistently been re-elected as the governing political party since independence. In the October2009 general elections, the BDP won 45 of the 57 parliamentary seats, while the rest of the seats were gainedby three major opposition parties, namely; Botswana National Front (BNF) with 6 seats, Botswana CongressParty (BCP) with 4 seats and Botswana Alliance Movement (BAM) with one seat. However, in 2010, a newpolitical party named Botswana Movement for Democracy (BMD) was formed by Members of Parliament andother politicians who split from the ruling Botswana Democratic Party. This split resulted in changes in thenumber of seats held by different political parties. Currently the BDP has 39 seats while BMD, BCP and BNFhave 5 seats each. There are also 4 specially elected members of Parliament and 3 independent MPs.
African Economic Outlook 2012 11 | © AfDB, OECD, UNDP, UNECA
Social Context & Human Development
Building Human ResourcesBotswana faces high levels of poverty, inequality, and unemployment as well as high HIV/AIDS prevalence rates,despite being a middle income country characterised by a relatively stable political situation and a robustmacroeconomic management. Although there has been a decline in the percentage of the persons living belowthe national poverty line from 30.6 % in 2002/03 to 20.7 % in 2009/10;the poverty level is still high for a middleincome country[1]. The country experiences unemployment rate of around 17.5 %, coupled with high incomeinequality (with Gini coefficient of 0.6) among the highest in the world. Among initiatives to ameliorate incomedistribution include various job creation and skill development initiatives underway as narrated in the sectionbelow on poverty reduction and social protection, as well as impetus towards economic diversification drivetargeting improved local production capacity for regional and international competitiveness.
Botswana’s high unemployment rate of 17.5 % is highly linked with the mismatch of the quality of educationand market demands. To address this constraint measures are underway through secondary and tertiaryinstitutions to diversify academic programmes that will equip learners with requisite skills. Among measuresunderway are revised Junior Secondary School curriculum, which was implemented in 2010 to address criticalareas of entrepreneurshipl. Within the context of the National Human Resource Development Strategy(NHRDS) initiated in 2010, a comprehensive Human Resource Development Plan (HRDP) is underway. ThisHRDP is aimed to ensure that labour demand matches the supply of skills and educated human resource. Toensure prompt implementation of the HRDP initiatives are underway to create a Human Development Council(HDC) in 2012, with the responsibility of foreseen implementation of various initiatives across sectors on humanresource development. The Government has also established an Internship Programme to facilitate skillsdevelopment among unemployed young graduates. This is a continuous program and since its inception in 2009has provided opportunity to over 4,500 interns, the majority of whom (1,227) reported to have securedpermanent employments. To further explore job opportunities, the Government established in 2010, a LabourMarket Observatory (LMO) within the Ministry of Finance and Development Planning. Its major functions includecollection, analysis and dissemination of labour market information, as well as playing the role of anemployment exchange service. In an effort to transform Botswana’s economy from a resource- to a knowledge-based economy, the Government established a Botswana International University of Science and Technology(BIUST) in 2008. To further augment these initiatives, another institution named Oodi College of Applied Artsand Technology (OCAAT) with the capacity of 1,200 students is due for completion in early 2012.
Botswana has consistently improved its health service infrastructure and facilities, coupled with increasedrecruitment of qualified physicians and other practitioners. Over 95 % of the population has access to a healthcentre within a radius of 8 Km. The proportion of the population with access to potable water and sanitation was95.8 % and 79.8 % respectively in 2007, and there are prospects of further improvements following continuedinvestment in social services.
Botswana is making impressive progress in education and in the fight against HIV/AIDS. There are indicationsthat the country will reach universal primary education Millennium Development Goals (MDG) target by 2015,having recorded a high net enrolment rate of 85.8 % and low dropout rate of 6 % in 2009. In respect toHIV/AIDS, although the infection rate is still high, it is been contained. According to the Botswana AIDS ImpactSurvey III, the prevalence rate was 17.6 % (20.4 % for females and 14.2 % for males) in 2008, but is expectedto fall on the back of proactive measures by the government to contain the spread of the disease throughbehaviour change. HIV/AIDS Life Skills Education is mainstreamed in all levels of the education system. Thecountry has one of the best Prevention of Mother to Child Treatment (PMCT) program in Africa, where 98 % ofbabies born under the programme are HIV negative. To further combat the disease, the Government hasadopted a program of adult male circumcision in 2010 targeting 20,000 circumcisions by 2011, as circumcisedmales have 60 % less chances of being infected by HIV/AIDS.
Poverty Reduction, Social Protection & LabourThe government has always put emphasis on the need for economic growth and eradication of poverty. Thegovernment has deliberately shifted from a poverty reduction to a poverty eradication objective given the highlevel of persons (20.7%) living below the nation poverty line. To this end the focus of the government’sexpenditure has been on high return initiatives that lead to creation of new job opportunities for the poor.Several anti-poverty programmes have been instituted including among others, Destitute Housing, Ipelegeng(public works), Self Help Housing Agency (SHHA) programme, Integrated Support Programme for ArableAgriculture (ISPAAD), various youth programmes, support to Non-Governmental Organisations, communitydevelopment programmes, Livestock Management and Infrastructure Development (LIMID) programme, andrecently backyard gardening. In addition, an Alcohol Levy Fund (charged at 30 % on sales of alcohol drinks) is inplace to finance poverty eradication initiatives. Other measures include provision of micro credit schemes
African Economic Outlook 2012 12 | © AfDB, OECD, UNDP, UNECA

through the Citizen Entrepreneurial Development Agency (CEDA), Young Farmers Fund, Small Business Council(SBC) and entrepreneurial training under the Local Enterprise Authority (LEA). These initiatives have helped inreducing the rate of unemployment from 24.6 % in 2004 to 17.6 % in 2007 and the number of persons livingbelow the national poverty line by 25 % from 499,457 in 2002/03 to 373,388 in 2009/10[1].
Botswana has ratified every core ILO convention and is, therefore, a signatory to almost all the conventionsrelating to labour matters. The government continues to provide support to those who cannot afford basicnecessities of life. This is in line with Vision 2016 and the President’s notion of the ‘5Ds’ of; Dignity, Discipline,Democracy, Development and Delivery. The first ‘D’ – Dignity – relates directly to provision of support for theneedy and vulnerable members of society.
The increasing number of beneficiaries is economically unsustainable and has led government to embark on areview of the National Policy on Destitute Persons (NPDP) . Currently, an assessment is being carried out toensure that only eligible persons benefit from the Destitution Programme.
Gender EqualityThe Government of Botswana has signed and ratified international conventions relating to gender equality,including the Convention on the Elimination of all Forms of Discrimination Against Women (CEDAW) 1996;Optional Protocol to the Convention on the Elimination of all Forms of Discrimination Against Women (2000);African Charter on Human and Peoples Rights (1986), and SADC Declaration on Gender andDevelopment (1997). Botswana has a national gender programme framework, which has been implementedsince 1999. There is a standalone Department of Women's Affairs in the Ministry of Labour and Home Affairs,which is the driving force/ lead organization on women affairs.
In terms of education, adult female literacy rate as a percentage of females ages 15 and above is 82.91, slightlyhigher to 82.19 for adult males. School enrolment for females is also high, currently at 104.81 % gross primaryenrolment. There has been a significant increase in the number of women in key government positions and inparastatal organizations, including the appointment of the first woman Governor of the BoB and the first womanAttorney General in October 2005.
African Economic Outlook 2012 13 | © AfDB, OECD, UNDP, UNECA
Thematic analysis: Promoting Youth Employment
Botswana population is relatively young people, with approximately 57 % under 25 year and about 20 % of thepopulation lies in the range of 15-24 years. Botswana however, defines youth as people between the age of 12and 29 years, which accounts for around 30 % of the population. In recognition of the role of youth in nationaldevelopment and associated opportunities and challenges, the government adopted the National Youth Policy(NYP) in August 1996. The policy is anchored on six strategic areas focusing on (i) provision of appropriateeducation and training, (ii) promotion of health among young people, (iii) provision of employment to youngpeople, (iv) active participation of young people in recreation, sports and leisure, (v) development of youthtalents, and (vi) responsiveness to problem areas that confront young people- in particular the problem ofunemployment, poverty, lack of opportunities, HIV/AIDS, drug abuse and crime.
To implement the NYP, a National Action Plan for Youth (NAPY) spanning 2001-10 was developed to coincidewith the Eighth National Development Plan (NDP 8). The action plan focused on (i) strengthening theinstitutional machinery, (ii) establishment of multi-purpose youth centers, (iii) development of youthemployment programs, (iv) promoting the involvement of youth in agro-based enterprises, and (v) introductionof a National Award Scheme (NAS) and Youth Talent Development Program (YTDP). Such empowermentprograms are set up to encourage the youth to venture into sustainable and viable income generating projects,promote the development and growth of citizen owned youth enterprises, and reduce rural-urban migration bymaking it attractive to start growth-oriented enterprises in rural areas.
In line with the focus areas of the NAPY, a number of initiatives have been implemented includingestablishments of Youth Development Fund (YDF) in 2005 and a Multi-Purpose Youth Centre in Gaborone(MPYC), among others. The YDF spearheaded by the Ministry of Youth, Sport and Culture is aimed atempowering youth aged 18-29 years to own business and create sustainable employment opportunities foryoung people through the development of sustainable projects. The YDF funding is 50 % grant and 50 %interest free loan of total approved amount and the funding ceiling is currently set to BWP 100,000. The YDFaccords priority on projects aimed to promote tourism, agriculture, services and manufacturing sectors. Throughthe YDF, more than 3,000 young people are reported to have benefited from the initiative across the countryand created numerous employment opportunities. To this end, the government has progressively enhanced itscontribution to the Fund; rising from BWP 3 million in 2005 to BWP 60 million in 2010, before doubling to BWP120 million in 2011.The coverage of the Fund has been widened to cover youth aged 15-35 years, in line withrevised YDP and in support of the Economic Diversification Drive that calls for the creation of an entrepreneurialculture among the youth.
The MPYC, also spearheaded by the Ministry of Youth, Sport and Culture is intended to provide vocationaltraining, counseling, recreational and leisure facilities for youth in Botswana. The Centre which is at its finalstages of construction is situated in an area of about 18 hectares of land in Gaborone. Once completed will have5 main buildings, 7 stadiums, including tennis courts, skating rink, soccer fields, basketball courts, multi-functionhall, technical training conference center, and cultural center.
The National Internship Program (NIP) established in 2009 is another initiative aimed to offer universitygraduates practical experience in government and private sector offices for a maximum period of two years. Asof July 2011, about 4,500 interns have been placed in various institutions across the country and about 1,227interns are reported to have been absorbed into permanent employments. Among other initiatives aimed tospur youth employment and income generation include establishment of a database of youth with relevantvocational skills and youth owned companies for easy access to civil works in the construction industry. Throughsharing of the database is with ministries, parastatals, and non-government organizations (NGO), it has beenpossible to award tenders to youth operated firms. It is thus reported that since inception of this program,maintenance tenders worth BWP 30 million have been awarded countrywide to 64 youth contractors. Tofurther enhance the initiative, the government Budget for 2011/12 targets 15 % allocation of funds formaintenance reserved for youth individuals and companies[1].
Despite of the above initiatives, unemployment among the youth is still a major constraint to Botswana.According to the Labour Force Survey (LFS) of 2005/06, youth unemployment accounted for over 60 % of thetotal unemployed labour force.
[1] His Excellency the President Seretse Khama: State of the Nations Address in November 2011.
Notes
African Economic Outlook 2012 14 | © AfDB, OECD, UNDP, UNECA
[1] Conversion to US$ based on annual average exchange rate of BWP6.8/US$ for 2010 and 2011.
[1] Commercial banks in Botswana, include ABN AMRO; ABN AMRO Outside Banking Unit; BancABC; Bank ofBaroda; Bank Gaborone; Barclays Bank; Capital Bank; First National Bank; Stanbic Bank; and Standard CharteredBank
[2] Botswana Stock Exchange Annual Report 2010..
[1] Office of the Ombudsman established in 1995; Directorate on Corruption and Economic Crime (DCEC)established in 1994; and the Public Enterprises Evaluation and Privatization Agency (PEEPA) established in 2001.
[1] Botswana Core Welfare Indicators (Poverty) Survey 2009/10.
[1] Botswana Core Welfare Indicators (Poverty) Survey 2009/10.
African Economic Outlook 2012 15 | © AfDB, OECD, UNDP, UNECA