Embed Size (px)
Citation preview
1
BOTTLERS REPORT
KOF, Arca-Contal, FEMSA - Three Excellent Enterpris es
�
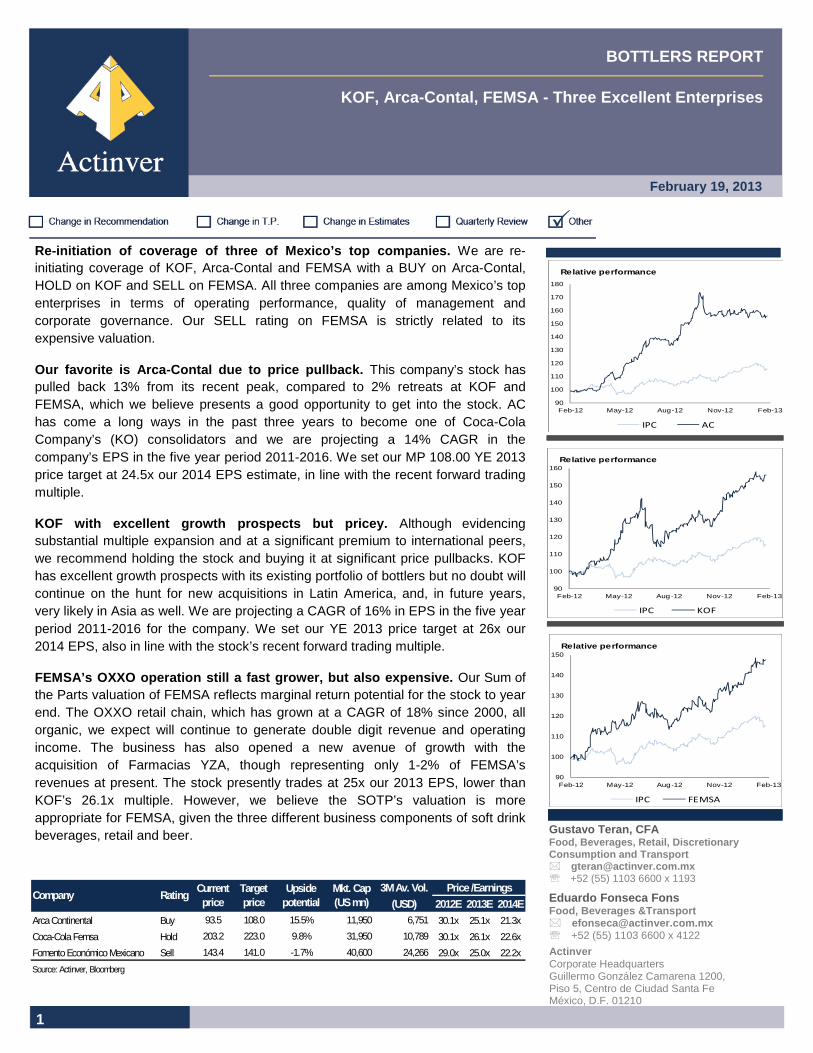
Re-initiation of coverage of three of Mexico’s top companies. We are re-initiating coverage of KOF, Arca-Contal and FEMSA with a BUY on Arca-Contal, HOLD on KOF and SELL on FEMSA. All three companies are among Mexico’s top enterprises in terms of operating performance, quality of management and corporate governance. Our SELL rating on FEMSA is strictly related to its expensive valuation.
Our favorite is Arca-Contal due to price pullback. This company’s stock has pulled back 13% from its recent peak, compared to 2% retreats at KOF and FEMSA, which we believe presents a good opportunity to get into the stock. AC has come a long ways in the past three years to become one of Coca-Cola Company’s (KO) consolidators and we are projecting a 14% CAGR in the company’s EPS in the five year period 2011-2016. We set our MP 108.00 YE 2013 price target at 24.5x our 2014 EPS estimate, in line with the recent forward trading multiple.
KOF with excellent growth prospects but pricey. Although evidencing substantial multiple expansion and at a significant premium to international peers, we recommend holding the stock and buying it at significant price pullbacks. KOF has excellent growth prospects with its existing portfolio of bottlers but no doubt will continue on the hunt for new acquisitions in Latin America, and, in future years, very likely in Asia as well. We are projecting a CAGR of 16% in EPS in the five year period 2011-2016 for the company. We set our YE 2013 price target at 26x our 2014 EPS, also in line with the stock’s recent forward trading multiple.
FEMSA’s OXXO operation still a fast grower, but als o expensive. Our Sum of the Parts valuation of FEMSA reflects marginal return potential for the stock to year end. The OXXO retail chain, which has grown at a CAGR of 18% since 2000, all organic, we expect will continue to generate double digit revenue and operating income. The business has also opened a new avenue of growth with the acquisition of Farmacias YZA, though representing only 1-2% of FEMSA’s revenues at present. The stock presently trades at 25x our 2013 EPS, lower than KOF’s 26.1x multiple. However, we believe the SOTP’s valuation is more appropriate for FEMSA, given the three different business components of soft drink beverages, retail and beer.
February 19, 2013
90
100
110
120
130
140
150
160
170
180
Feb-12 May-12 Aug-12 Nov-12 Feb-13
Relative performance
IPC AC
90
100
110
120
130
140
150
160
Feb-12 May-12 Aug-12 Nov-12 Feb-13
Relative performance
IPC KOF
90
100
110
120
130
140
150
Feb-12 May-12 Aug-12 Nov-12 Feb-13
Relative performance
IPC FEMSA
Gustavo Ter an, CFA Food, Beverages, Retail, Discretionary Consumption and Transport � [email protected] ℡ +52 (55) 1103 6600 x 1193 Eduardo Fonseca Fons Food, Beverages &Transport � [email protected] ℡ +52 (55) 1103 6600 x 4122 Actinver Corporate Headquarters Guillermo González Camarena 1200, Piso 5, Centro de Ciudad Santa Fe México, D.F. 01210
3M Av. Vol.(USD) 2012E 2013E 2014E
Arca Continental Buy 93.5 108.0 15.5% 11,950 6,751 30.1x 25.1x 21.3x
Coca-Cola Femsa Hold 203.2 223.0 9.8% 31,950 10,789 30.1x 26.1x 22.6x
Fomento Económico Mexicano Sell 143.4 141.0 -1.7% 40,600 24,266 29.0x 25.0x 22.2x
Source: Actinver, Bloomberg
Price /EarningsCompany Rating
Current price
Target price
Upside potential
Mkt. Cap (US mn)

2
INDEX
Beverage sector analysis 3
KOF longer history and higher international exposur e 3
Pace of acquisitions picked up in recent past 4
Limited organic growth, but still plenty of target s 5
Volume growth, per capita consumption varies 6
Grupo CULTIBA could raise the bar 7
Valuation 8
Coca-Cola FEMSA 9
Investment thesis 10
Philippines acquisition – New terrain Investment t hesis 12
2013—2016 projection 14
Valuation 15
Arca Continental 21
Investment thesis 22
Recent developments 23
Financial results 2011– 2012 25
Valuation 27
Fomento Económico Mexicano 33
Investment thesis 34
Oxxo - convenience store industry 36
Farmacias YZA acquisition 37
2013—2016 projection 39
Valuation 40

3
In this report we cover Mexico’s two coke bottlers, KOF and AC. We also cover FEMSA, which owns 48% of KOF, and FEMSA Comercio, which owns the OXXO convenience retail chain, the largest in Mexico by far. We cover the convenience sector analysis in the FEMSA section of this report.
BEVERAGE SECTOR ANALYSIS
KOF AND A.C. FAVORITES OF COCA COLA CO.
These two companies are the number one and three independent bottlers of Coca Cola Co (KO), as illustrated in the table below.
Each company has achieved its position largely through acquisitions and mergers with the blessing of KO. Since 2000, KOF has grown its total vol-ume from 583 million case units (MCU) to 3.66 billion (including two recent acquisitions), while Arca-Contal has expanded from 426 MCU to 1,349 MCU. These performances are equivalent to 12-year CAGR’s of 15% and 10%, respectively.
KOF — LONGER HISTORY AND HIGHER INTERNATIONAL EXPOS URE
KOF’s international expansion began in 1994 in Argentina and in May 2003 it acquired Panamco, a transformational merger that tripled KOF’s volume (to 1.8 million MCU’s). With Panamco, KOF’s operations expanded to the central and gulf regions of Mexico, four countries in Central America (Guatemala, Nicaragua, Costa Rica and Panama) and three countries in South America (Colombia, Venezuela and Brazil). Other much smaller trans-actions followed, including Refrigerantes Minas Gerais in Brazil (May 2008, 114 MCU, USD 364 million cash), Brisa bottled water in Colombia (Feb 2009, USD 92 million cash), and Grupo Industrias Lacteas in Panama, also known as Estrella Azul, (March 2011, price not disclosed, producer of dairy and juice based categories in Panama).
Arca-Contal’s first venture abroad was in Argentina in 2008 (North east and North West Argentina, USD 296 million cash, 119 MCU’s, 24% expansion of then Arca’s volume),and the second acquisition was in 2010 in Ecuador (USD 355 Million, 75% of stock for cash, 31 MCU’s, 5% expansion).
2012 Vol (Est.)Bottler Territories Billion unit casesCoca-Cola Femsa1 Mexico, Central America, Bzl, Arg, Vene 3.66Coca-Cola Hellenic Greater Europe 2.08Arca-Contal Mexico, Argentina, Ecuador 1.35Swire Coca Cola Asia, US (11 western states) 1.00Coca-Cola Icecek Turkey, Middle East 0.83Coca-Cola Enterprises Greater Europe 0.62Andina Argentina, Brazil, Chile, Paraguay 0.65Coca-Cola Amatil Australasia, SE Asia, Europe 0.60
1. Includes Coca Cola Bottlers Philippines, and Grupo Yoli
Source: Company annual and quarterly reports

4
PACE OF ACQUISITIONS PICKED UP IN RECENT PAST
Just in the past year and a half, KOF has expanded its volume by 46%, in-cluding its two most recent acquisitions, and Arca-Contal has more than doubled in volume with the merger of Arca and Contal in June 2011.
What evidently has unlocked these transactions is the added attraction to buyer and seller of share exchanges. Five of the six transactions of both companies have been share exchanges (unlike previous cash purchases) with benefits to both parties. KOF and Arca-Contal have been paying with expensive currency (well valued stock) and with high potential to make the transactions more acreetive due to cost synergies, improved marketing and better management. At the same time, sellers are able to continue to profit from share price appreciation with KOF or Arca-Contal stock and also bene-fit from diversification of risk.
KOF announced December 13th the acquisition of a 51% interest in Coca-Cola Philippines, Inc. (CCBPI) at a price of USD 688.5 million in cash and an aggregate price of USD 1,350 million, including net debt, equivalent to 13.5 times projected 2012 EBITDA of CCBPI with incremental volume equivalent to 18% of 2012’s estimated volume. Barely a month later, KOF announced the acquisition of Grupo Yoli, a bottler in the State of Guerrero (where Aca-pulco and Ixtapa are located) for a total price of MP 8.81 billion (USD 693 million, 100% stock transaction) valuing the company at 10.8x 2012 profor-ma EBITDA.
The last bottler acquisition by Arca-Contal was in effect the merger of the two companies on June 1st 2011. Since this date, the company acquired last December two small snack manufacturers, Wise Foods, based in Pennsyl-vania, and Industrias Alimenticias Ecuatorianas, based in Ecuador. The price for both purchases was not disclosed but we estimate the total was in the range of USD 30 million. The two businesses will bolster the very suc-cessful six-year old snack business of Arca-Contal, increasing revenues from USD 100 million to USD 400 million and increasing the snack seg-ment’s share of consolidated revenues to 8% from 5%. KOF does not cur-rently have a snack division.
KO PARTICIPATION IN BOTH COMPANIES HAS GROWN
Presently, KO owns 22.4% of KOF and 8.6% of Arca-Contal. These stakes are the by-product of mergers and acquisitions involving both companies in the past. KO, of course, owns the franchise rights to Coca Cola and numer-ous other cola and non-cola drinks, including fruit, water, dairy and isotonic beverages.
KO’s main compensation from bottlers is the payment for coke concentrate, a figure which represented 32% of KOF’s 2011 Cost of Goods Sold and 24.5% of Arca-Contal’s. It also receives royalty payments for non-cola bever-ages that KO owns. Neither KOF nor Arca-Contal directly own any of the brands they manufacture and market.
Date Acquisition MCUJan 2013 Grupo Yoli - Mexico 99 Dec 2012 Coca-Cola Bottlers Philiphines 530 Dec 2011 Grupo Tampico - Mexico 156 Dec 2011 Grupo CIMSA - Mexico 155 Dec 2011 Grupo Queretano - Mexico 110
Total 1,050 Source: Company reports
KOF recent bottler acquisitions
Date Acquisition MCUJune 2011 Merger Arca & Contal - Mexico 660
Total 660 Source: Company reports
Arca-Contal recent bottler mergers & acquisitions

5
LIMITED ORGANIC GROWTH BUT STILL PLENTY OF TARGETS
Both companies are primed to continue seeking expansion through acquisi-tions given that organic volume growth of beverages has slowed recently to the low to mid-single digit levels for both companies.
In Mexico there are still six independent private coke distributors left for po-tential acquisitions by both companies. Volume figures for these distributors are not available but KOF estimates the six combined produce a total of 500 MCU’s. The largest of these bottlers is Vepensa, based in the Yucatan pen-insula (next to KOF’s territory) with estimated volume of 200-250 MCU’s. Being next to KOF would favor KOF over Arca-Contal as an acquirer and it would represent a nice 6-7% volume gain for KOF. However, Vepensa ap-pears to be little interested in it being acquired. One of the remaining bottlers is very small (8 MCU’s) and the other four average around 70 MCU’s, which would represent 2-5% volume acquisitions for KOF or Arca.
The potential for acquisitions in South America is mixed. Brazil presents in-teresting possibilities (discussed below). Colombia, Venezuela, Ecuador, Paraguay and Uruguay are already 100% coke franchises owned by KOF (first three), Arca-Contal (Ecuador, Paraguay) and KO (Uruguay).
Argentina, Chile and Peru territories are divided between publicly traded KOF, Arca-Contal, Andina (Chile based), Embonor (also Chile based), and privately held Embotelladora Lindley, based in Peru, with an estimated 250-260 MCU’s.
Andina, Embonor and Lindley all represent potential acquisitions for both KOF and Arca Contal, though they appear to be little interested in such transaction.
Both Andina and Embonor trade at substantial 2013 P/E discounts to KOF (35%) and Arca-Contal (25%), a necessary condition for acreetive transac-tions. Andina, however, can be characterized as an acquirer, as it recently purchased Coca Cola Polar.
Organic volume growth 2010 2011 9m12KOF 2.9% 4.0% 1.8%Arca-Contal 5.8% 8.0% 2.9%Source: Company reports
Market Cap Volume Market cap
Bottler USD Mill MCU P/E EV/EBITDA Per Case
Embotelladora Andina (Chile) 5,466 650 16.6 10.6 8.41
Coca Cola Embonor (Chile) 1,409 213 12.4 9.7 6.62
KOF 31,240 3,660 25.4 12.9 8.54
Arca-Contal 12,270 1,350 22.1 12.4 9.09
2013 Valuations

6
BRAZIL MERGER OF THREE BOTTLERS
Three independent bottlers just announced their merger to constitute the second largest bottler in Brazil with an estimated 400 MCU’s. KOF is the largest producer in Brazil with an estimated 35% market share and volume of 490 MCU’s. KOF estimates that there are another 600 MCU’s up for grabs here distributed among 11 bottlers ranging in size from 250 down to 20 MCU’s. Some are next to KOF’s territories.
VOLUME GROWTH, PER CAPITA CONSUMPTION VARIES
The table below represents KO’s global volume evolution of the five year period to 2011.
As evidenced from the table, Latin America is the most important region for KO accounting for 29% of 2011’s global volume and evidencing the second fastest CAGR of the past five years. Compared to North America with a 1%
CAGR, Latin America’s performance stands out with a 6% CAGR.
Notwithstanding the impressive statistics for the region, the organic growth reported by KOF and Arca-Contal in the past 3 years represent a different picture. We are projecting organic volume growth for both companies in the 4%-5% range for our projection period.
In terms of per capita consumption, as illustrated by the table aside, there are major differences in country consumption levels ranging from a high of 728 eight ounce servings/year in Mexico to a low of 127 servings in Colom-bia.
KOF has high expectations about its ability to boost per capita consumption in South America. It computes that volume could actually double in South American countries simply by bringing all countries in its territory to Argen-tina’s level of 345 servings. Obviously, we will modify our 4%/year projection for each company if the numbers showed that consumption levels are clearly above our projected figures.
2007 2008 2009 2010 2011 4 yr. CAGR
North America 5.68 5.69 5.61 5.61 5.87 1%
Latin America 6.13 6.4 6.83 7.14 7.74 6%
Mexico 2.64 2.82 3.01 3.07 3.41 7%
Brazil 1.53 1.6 1.64 1.86 1.94 6%
Latin Center 0.86 0.83 0.96 1 1.01 4%
South Latin 1.1 1.15 1.23 1.21 1.39 6%
Europe 3.41 4.03 3.9 4.08 4.01 4%
Pacific 3.63 4.03 4.39 4.59 4.81 7%
Euroasia & Africa 3.86 3.56 3.66 4.06 4.27 3%
TOTAL 22.7 23.7 24.4 25.5 26.7 4%
1. Billion of 8oz cases
Source: Coca-Cola Co.
Volume sale by region (1)
Country PCC (1)
Mexico 728
Chile 460
United States 403
Argentina 345
Canada 259
Brazil 230
Peru 208
Venezuela 150
Philippines 129
Colombia 127
Worldwide 92
1. eight ounce servings
Source: Coca Cola Co. Report; KOF report
Per Capita Consumption in 2011

7
GRUPO CULTIBA COULD RAISE THE BAR
Grupo Cultiba is the re-constituted Geupec, the Pepsi bottler that now has 100% coverage of Mexico. Cultiba was formed in September, 2011 with the merger of Geupec with Pepsi Bottling Co’s Mexico operations (Pepsico), including Gatorade. Geupec had the distributorship of 12 Mexican states and Pepsico owned the rest. The merger also brought in 4 sugar mills and Vene-zuelan Pepsi bottler Empresas Polar as a strategic investor.
Cultiba, which is controlled by Juan Gallardo and his family, owns 51% of Grupo GEPP, a new entity housing the bottling operations of the group (name derived from combination of Geupec, Empresas Polar and Pepsi), with Empresas Polar holding 29% and Pepsico 20%. The sugar operations of Cultiba are housed separately under GAM (Grupo Azucarero Mexicano) which is 100% owned by Cultiba and represents about 10% of Cultiba’s rev-enues.
PEPSI IN LONG TERM DECLINE BUT IT COULD CHANGE
The Pepsi brand in Mexico has been in long term decline accounting for an estimated 20% of the beverage industry in Mexico, with Coca-Cola brands having an estimated 70% and other brands the remaining 10%. By way of comparison, in the 1980’s Pepsi was bigger than Coke.
Grupo GEEP’s top managers come from Empresas Polar, including the CEO, CFO and Director of Integration and Synergies. In the past 18 months, the new management has worked hard at turning around what had been a losing situation. Net Revenues rose 7% in the 9M12 to MP 24.3 billion on a proforma basis, with net income up from a net loss of MP 417 million in 9M11 to a MP 799 million profit in 9M12. But the EBITDA margin stood at a low 6.7%, one third the level of KOF and AC’s margin in their Mexico opera-tions.
In an investor presentation, Cultiba management indicated that in 2012 they have captured only 1/5th of expected synergies and they expect to generate the rest in the next 2-3 years. They grew beverage volume 5% in their first year, compared to the industry’s 1.9%, and this in the middle of their integra-tion. Their expectations for coming years are to grow volume 7-8%.

8
VALUATION
Both KOF and AC are trading at significant premiums to their Latam and Interna-tional bottling peers but with better profit returns and outlooks.
KOF TRADING AT 20% PREMIUM TO LATAM MEDIAN
On a 12 month forward PE, KOF trades at 26.1x, at premiums of 20% to the Latam median and 61% to the median of international bottlers outside of Latam. In terms of EV/2013 EBITDA, KOF is trading at a 13.0x ratio, at premiums of 9% and 35% over Latam and international peers outside of Latam. However, it should be mentioned that KOF has evidenced faster growth with a 5 year CAGR in net income of 16.8%, compared to the median of 11% for Latam peers, and 8% for international peers. More importantly, we are estimating CAGR in EPS of 16% for 2012-2016 with no factor added for additional acquisitions.
Our YE 2013 Price Target of MP 223 is set at 26x our 2014 EPS reflecting no multiple expansion from current levels. Total return potential, including an esti-mated 1.5% dividend yield, equates to 12%. We recommend HOLD for the shares and buying on the dips. We do see great potential for long term con-sistent growth for the stock.
ARCA-CONTAL TRADING AT 15% PREMIUM TO LATAM PEERS
AC is trading at a discount to KOF of 4% in terms of 2013 P/E and at premiums of 15%/55% to Latam and international peers. On a EV/2103 EBITDA, AC is trading at 12.7x, a 2% discount to KOF’s.ratio. Like KOF, AC grew at a faster 5 year CAGR in net income of 12.1%, compared to 11% for the Latam median and 8% for the international median.
We set our YE 2013 Price Target of MP 108 at 24.5x our 2014 EPS, the same multiple that AC is trading on a 12m forward basis. Our estimated return poten-tial, including an estimated 1.5% dividend yield, is 17%. We rate the stock a BUY.
Price Mkt. Cap Mkt. Cap(Local) (USD) (Local) L12M 2012E 2013E L12M 2012E 2013E
Latin AmericaArca Continental AC*.MM 93.69 11,947.01 150,959 16.1x 14.8x 12.7x 30.5x 30.1x 25.1x 13.42 8.12 14.9%Coca-Cola Femsa KOFL.MM 202.98 32,426.36 412,160 15.7x 14.9x 13.0x 33.7x 30.1x 26.1x 13.55 9.09 16.8%Coca-Cola Embonor EMBONOB.CI 1,534.80 1,504.80 713,224 9.6x 10.2x 9.2x 20.8x 15.9x 14.4x 13.62 7.96 6.2%Embotelladora Andina ANDINAA.CI 2,560.00 5,900.01 2,745,504 9.6x 11.2x 11.2x 23.4x 20.4x 18.2x 20.45 11.79 5.5%Median 12.7x 13.0x 11.9x 26.9x 25.2x 21.7x 13.6x 8.6x 11%Average 12.8x 12.8x 11.5x 27.1x 24.1x 20.9x 15.3x 9.2x 11%
InternationalCoca-Cola Hellenic Bottling EEEK.GA 20.10 9,745.69 7,368 8.0x 9.4x 8.5x 38.7x 21.7x 18.0x 7.65 3.01 -16.6%Coca-Cola Enterprises CCE.US 49.74 8,008.16 7,941 11.0x 7.5x 6.9x 14.1x 11.6x 9.9x 39.40 6.91 7.3%Coca Cola Company KO.US 37.67 167,834.73 168,956 14.0x 13.1x 12.3x 18.8x 17.6x 16.2x 27.87 10.86 8.6%Coca-Cola Icecek CCOLA.TI 42.50 6,186.27 10,811 14.7x 15.2x 14.7x 28.5x 23.3x 25.0x 21.36 9.61 10.1%Coca-Cola Amatil CCL.AU 13.90 10,693.74 10,594 11.4x 10.3x 9.3x 23.0x 18.1x 16.3x 22.39 7.21 8.2%Pepsico PEP.US 75.50 113,972.16 116,787 8.9x 10.7x 10.0x 18.5x 17.2x 15.8x 28.86 8.38 1.8%Dr. Pepper DPS.US 43.00 8,809.11 8,828 8.6x 8.5x 8.2x 14.5x 13.9x 13.0x 27.69 6.91 4.8%Monster Beverage MNST.US 49.68 8,816.48 8,575 15.5x 12.1x 11.8x 27.3x 22.6x 21.4x 36.94 26.53 23.9%Median 11.2x 10.5x 9.6x 20.9x 17.8x 16.2x 27.8x 7.8x 8%Average 11.5x 10.8x 10.2x 22.9x 18.3x 16.9x 26.5x 9.9x 6%
National & InternationalMedian 11.2x 10.9x 10.6x 23.2x 19.2x 17.1x 21.9x 8.2x 8%Average 11.9x 11.5x 10.6x 24.3x 20.2x 18.3x 22.8x 9.7x 8%
ROE ROANet Income
Grow th Rate (5Yrs)Beverage Peers Ticker EV/EBITDA P/E
9
COCA-COLA FEMSA SAB DE CV
RE-INITIATION OF COVERAGE
HOLD, TP MP 223.00
�
Relative Performance
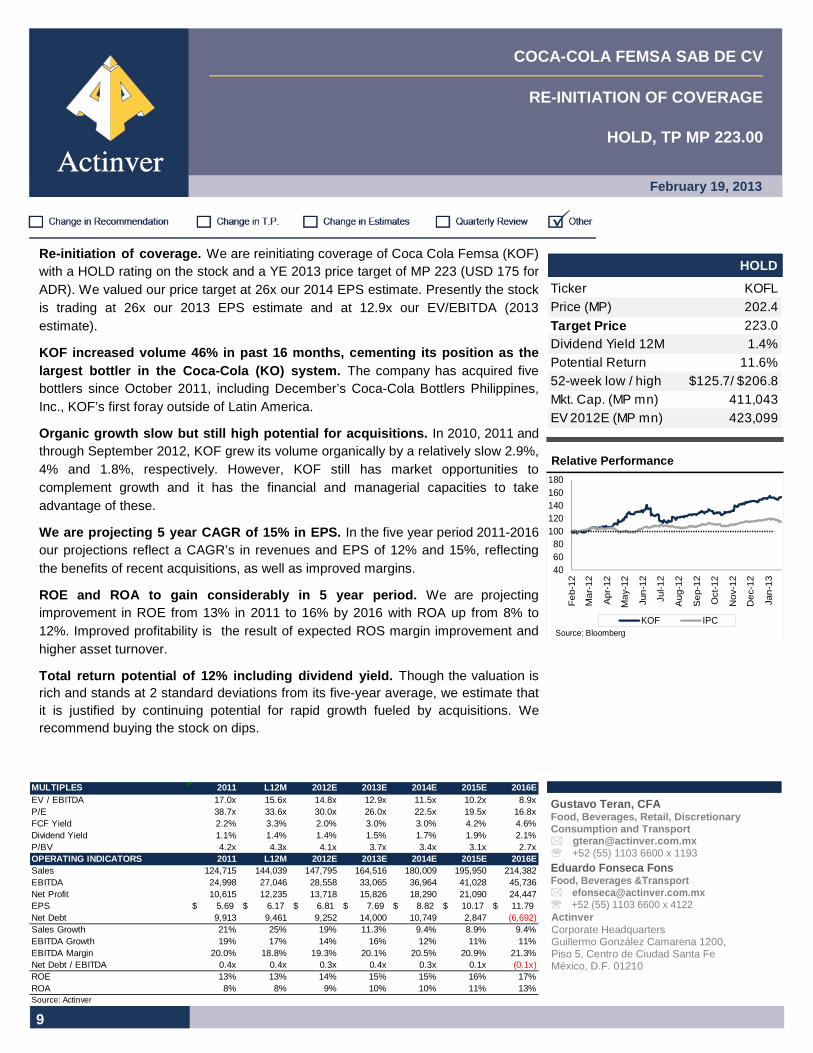
Re-initiation of coverage. We are reinitiating coverage of Coca Cola Femsa (KOF) with a HOLD rating on the stock and a YE 2013 price target of MP 223 (USD 175 for ADR). We valued our price target at 26x our 2014 EPS estimate. Presently the stock is trading at 26x our 2013 EPS estimate and at 12.9x our EV/EBITDA (2013 estimate).
KOF increased volume 46% in past 16 months, cementi ng its position as the largest bottler in the Coca-Cola (KO) system. The company has acquired five bottlers since October 2011, including December’s Coca-Cola Bottlers Philippines, Inc., KOF’s first foray outside of Latin America.
Organic growth slow but still high potential for ac quisitions. In 2010, 2011 and through September 2012, KOF grew its volume organically by a relatively slow 2.9%, 4% and 1.8%, respectively. However, KOF still has market opportunities to complement growth and it has the financial and managerial capacities to take advantage of these.
We are projecting 5 year CAGR of 15% in EPS. In the five year period 2011-2016 our projections reflect a CAGR’s in revenues and EPS of 12% and 15%, reflecting the benefits of recent acquisitions, as well as improved margins.
ROE and ROA to gain considerably in 5 year period. We are projecting improvement in ROE from 13% in 2011 to 16% by 2016 with ROA up from 8% to 12%. Improved profitability is the result of expected ROS margin improvement and higher asset turnover.
Total return potential of 12% including dividend yi eld. Though the valuation is rich and stands at 2 standard deviations from its five-year average, we estimate that it is justified by continuing potential for rapid growth fueled by acquisitions. We recommend buying the stock on dips.
HOLD
February 19, 2013
MULTIPLES 2011 L12M 2012E 2013E 2014E 2015E 2016EEV / EBITDA 17.0x 15.6x 14.8x 12.9x 11.5x 10.2x 8.9xP/E 38.7x 33.6x 30.0x 26.0x 22.5x 19.5x 16.8xFCF Yield 2.2% 3.3% 2.0% 3.0% 3.0% 4.2% 4.6%Dividend Yield 1.1% 1.4% 1.4% 1.5% 1.7% 1.9% 2.1%P/BV 4.2x 4.3x 4.1x 3.7x 3.4x 3.1x 2.7xOPERATING INDICATORS 2011 L12M 2012E 2013E 2014E 2015E 201 6ESales 124,715 144,039 147,795 164,516 180,009 195,950 214,382EBITDA 24,998 27,046 28,558 33,065 36,964 41,028 45,736Net Profit 10,615 12,235 13,718 15,826 18,290 21,090 24,447EPS 5.69$ 6.17$ 6.81$ 7.69$ 8.82$ 10.17$ 11.79$ Net Debt 9,913 9,461 9,252 14,000 10,749 2,847 (6,692)Sales Growth 21% 25% 19% 11.3% 9.4% 8.9% 9.4%EBITDA Growth 19% 17% 14% 16% 12% 11% 11%EBITDA Margin 20.0% 18.8% 19.3% 20.1% 20.5% 20.9% 21.3%Net Debt / EBITDA 0.4x 0.4x 0.3x 0.4x 0.3x 0.1x (0.1x)ROE 13% 13% 14% 15% 15% 16% 17%ROA 8% 8% 9% 10% 10% 11% 13%Source: Actinver
406080
100120140160180
Fe
b-1
2
Ma
r-1
2
Ap
r-12
Ma
y-12
Jun
-12
Jul-1
2
Au
g-1
2
Se
p-1
2
Oct
-12
No
v-1
2
De
c-1
2
Jan
-13
KOF IPCSource: Bloomberg
Ticker KOFLPrice (MP) 202.4
Target Price 223.0Dividend Yield 12M 1.4%Potential Return 11.6%52-week low / high $125.7/ $206.8Mkt. Cap. (MP mn) 411,043EV 2012E (MP mn) 423,099
Gustavo Ter an, CFA Food, Beverages, Retail, Discretionary Consumption and Transport � [email protected] ℡ +52 (55) 1103 6600 x 1193 Eduardo Fonseca Fons Food, Beverages &Transport � [email protected] ℡ +52 (55) 1103 6600 x 4122 Actinver Corporate Headquarters Guillermo González Camarena 1200, Piso 5, Centro de Ciudad Santa Fe México, D.F. 01210
10
Investment Thesis
KOF has transformed into a world-class company, a full-fledged multi-national company with a presence in 10 countries and now with a foothold in Asia as a result of its December acquisition of The Coca-Cola Philippines, Inc. (CCBPI). The company has developed the managerial talent on top of its strong balance sheet to manage its multiple operations, demonstrating continually its ability to quickly consolidate acquisitions and maintain earn-ings momentum.
The stock has responded accordingly rising by 66% in the past 15 months, when the latest spate of acquisitions began, and the question is is it still time to climb aboard the company? Or is it too late to do so?
We are recommending a HOLD rating on the stock but strongly recommend buying it on significant pullbacks. While the valuation has risen substantially, we think it is justified on account of the company’s transformation and poten-tial for further growth in the future. We are projecting a five-year CAGR of 16% in operating income (2011-2016) and 15% in EPS, though with modest contribution from CCBPI and without consideration for additional acquisitions down the line.
Investment Positives
Proven track record. KOF has come a long ways from a regional, Mexico-based bottler into the largest bottler in the Coke system. Since 2000 the company has grown its volume at a CAGR of 15% and just in the last 16 months, it has expanded volume by 46% through five acquisitions, four in Mexico (combined 20% expansion in pre-acquisitions’ volume) and the men-tioned CCBPI (17% volume expansion). It is worth mentioning here too the transformational Panamco acquisition in 2003 which tripled the company’s size at the time.
Highly qualified management. KOF has developed the talent to manage its multi-country operations. It invests significant amounts of funds in training and development to have a supply of managers ready to tackle new opportu-nities. We could not find an example of a poorly managed acquisition or management stumble.
Strong Balance sheet. In spite of the rapid pace of acquisitions, KOF has a low net debt/EBITDA ratio of 0.4x as of 3Q12 and a free cash flow yield of 3.3% in the last 12 months. KOF has the resources to take advantage of acquisition opportunities. One other major factor is the company’s ability to issue stock as it has for all four recent Mexico acquisitions.
Still plenty of acquisition opportunities. As discussed in the first part of this report, there are still acquisition candidates in Mexico and in South America, for which we believe KOF is better suited than Arca-Contal or Andi-na, the other two main potential acquirers. In addition, though still a few years away, through its Philippines purchase, KOF has now opened another, potentially much larger territory for future potential acquisitions.

11
Investment Negatives
Rich valuation
At 26x our 2013 EPS estimate, KOF is richly valued and could experience significant multiple contraction in a down market. The stock is up from a 12 month forward multiple of 18x early in 2012.
However, we believe the multiple expansion is justified by KOF’s transfor-mation in the recent past, as well as Mexico’s improved outlook.
Entry to Asia, unproven
Although KOF has a proven track record in Latin America, its first venture to Asia carries new risks. We mention here that KOF underwent nearly a year of due-diligence before agreeing to this transaction and its 49% partner, KO, has been involved with this operation since 2006. KOF has seen many simi-larities between its Latin American operations and CCBPI and its relatively low margin (less than half KOF´s) presents plenty of opportunity for operat-ing improvement.
Exposure to Venezuela, Argentina
Venezuela represents 6.7% of estimated 2012 volume. This country evi-dences higher risks than other South American countries because of political uncertainty, high inflation, budget deficits, price and exchange controls, and potential for major currency devaluation.
Similarly, Argentina (7% of volume) has evidenced price controls and eco-nomic ups and downs, though less severe than Venezuela’s.
KOF has been able to cope well with the adversities presented in these two countries. Although operating performance by country in South America is not provided, the region as a whole has produced consistently rising net op-erating profits in the past three years.

12
Recent Developments
PHILIPPINES ACQUISITION – NEW TERRAIN
This acquisition amounted to an 18% incremental volume for KOF and is its first endeavor outside of Latin America. KO owned 100% of this bottler for the past six years and sold a 51% interest to KOF for USD 681 million cash with an option to acquire the remaining 49% at any time over the following seven years. KOF also has a put option to sell its ownership to KO any time during year six. Including net debt, the total value of the transaction was USD 1.35 billion, equivalent to 13.5x EBITDA for 2012.
CCBPI’s net revenues in 2012 amounted to USD 1.1 billion with an EBITDA margin of 9%, half of KOF’s EBITDA margin of 18%. KOF management plans to substantially enhance this margin and improve revenues through a combination of volume growth, better pricing, increased single-serve pene-tration, and better control of pricing with wholesalers. On this latter point, KOF informed that wholesalers are retaining a much larger share of reve-nues than in their Latam businesses, with final sales to consumers amount-ing to USD 1.7 billion, leaving an unusually large USD 600 million with wholesalers.
This acquisition will not be consolidated and will be accounted under the equity method based on the fact that KOF will not have full operational con-trol of CCPPI during the first four years when KO and KOF will have to agree on a normal operating plan each year.
GRUPO YOLI — EASY ASIMILATION
This Mexican bottler purchase is very similar to the three Mexican transac-tions in 4Q11 and 1Q12 and should be relatively easy to absorb for KOF. Yoli represents a 3% increment in KOF’s volume. The price paid amounted to MP 8.81 billion, including MP 1.1 billion of net debt, for an EV/EBITDA ratio of 10.8x.
Grupo Yoli’s net revenues in 2012 amounted to M 4 billion (2.7% of our KOF estimate for 2012). Yoli’s EBITDA margin in 2012 computes at 20.3%, the same level as KOF’s. KOF’s EV/EBITDA at present is 14.9x.

13
Financial Results 2011-2012
Net Revenues increased by 21% in 2011 boosted by double digit revenue growth in Mexico and South America, in part by favorable currency move-ments and the two Mexico acquisitions that closed in 4Q11 (Grupo Tampico and Grupo CIMSA). Excluding currency and acquisition effects, total reve-nues still grew a robust 15% and volume 4%.
In the first nine months of 2012 net revenues grew 22%, mainly as a result of the three acquisitions in the period (Tampico, CIMSA and Queretano) with volume up 16.5%. Excluding acquisitions, total revenues grew 9.6% and volume 1.8%.
Operationally, the gross profit margin remained fairly stable throughout the periods but the operating profit margin contracted as a result of higher labor and delivery expenses in South America, higher marketing and technology expenses.
EPS grew 5% in 2011, and 14% in 9m12.
The balance sheet retained its strength after the three Mexico acquisitions which, after all, were all 100% share exchanges. Still, KOF’s cash flow was strong enough to fund a dividend of USD 427 million in 2012 (42% payout).
(Figures in Millions of Pesos)INCOME STATEMENT 2010 2011 9m 2011 9m 2012Net Revenues 103,456 124,715 86,878 106,202
% increase 21% 22%% volume gain 2.9% 6.0% 4.2% 16.5%
Gross Profit % 46.3% 45.9% 46.0% 46.1%Operating Profit % 15.3% 14.3% 14.2% 13.2%EBITDA margin 20.3% 20.0% 19.5% 17.9%Net Profit 9,800 10,615 7,302 8,923 Net Profit Margin 9.5% 8.5% 8.4% 8.4%EPS 5.31 5.69 3.95 4.44 Source: Company reports, Actinver
BALANCE SHEET YE 2010 YE 2011 9/30/2011 9/30/2012Total Assets 114,061 151,608 126,471 146,147 Total Capital 73,882 100,779 79,104 99,055 Total Liab/Capital 0.54 0.50 0.60 0.48 Net Debt 4,817 9,913 3,657 9,461 Net Debt/EBITDA 0.23 0.40 0.22 0.35 Source: Company reports, Actinver
14
2013-2016 Projection
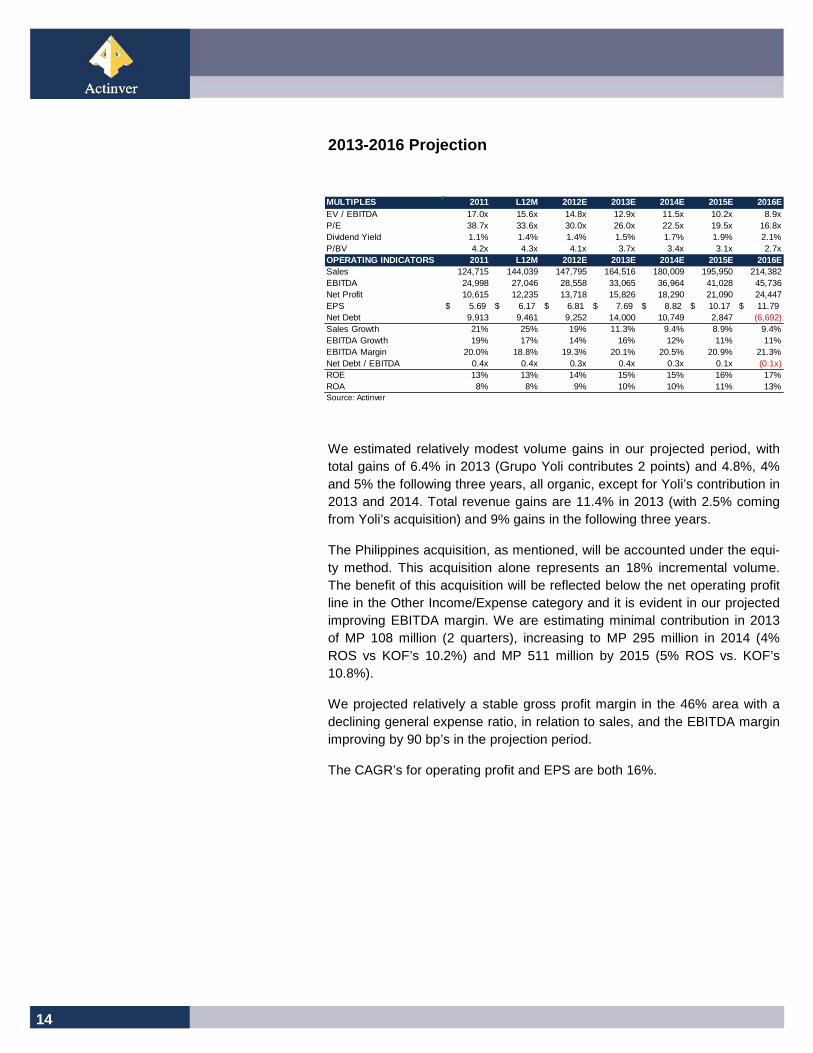
We estimated relatively modest volume gains in our projected period, with total gains of 6.4% in 2013 (Grupo Yoli contributes 2 points) and 4.8%, 4% and 5% the following three years, all organic, except for Yoli’s contribution in 2013 and 2014. Total revenue gains are 11.4% in 2013 (with 2.5% coming from Yoli’s acquisition) and 9% gains in the following three years.
The Philippines acquisition, as mentioned, will be accounted under the equi-ty method. This acquisition alone represents an 18% incremental volume. The benefit of this acquisition will be reflected below the net operating profit line in the Other Income/Expense category and it is evident in our projected improving EBITDA margin. We are estimating minimal contribution in 2013 of MP 108 million (2 quarters), increasing to MP 295 million in 2014 (4% ROS vs KOF’s 10.2%) and MP 511 million by 2015 (5% ROS vs. KOF’s 10.8%).
We projected relatively a stable gross profit margin in the 46% area with a declining general expense ratio, in relation to sales, and the EBITDA margin improving by 90 bp’s in the projection period.
The CAGR’s for operating profit and EPS are both 16%.
MULTIPLES 2011 L12M 2012E 2013E 2014E 2015E 2016EEV / EBITDA 17.0x 15.6x 14.8x 12.9x 11.5x 10.2x 8.9xP/E 38.7x 33.6x 30.0x 26.0x 22.5x 19.5x 16.8xDividend Yield 1.1% 1.4% 1.4% 1.5% 1.7% 1.9% 2.1%P/BV 4.2x 4.3x 4.1x 3.7x 3.4x 3.1x 2.7xOPERATING INDICATORS 2011 L12M 2012E 2013E 2014E 2015E 201 6ESales 124,715 144,039 147,795 164,516 180,009 195,950 214,382EBITDA 24,998 27,046 28,558 33,065 36,964 41,028 45,736Net Profit 10,615 12,235 13,718 15,826 18,290 21,090 24,447EPS 5.69$ 6.17$ 6.81$ 7.69$ 8.82$ 10.17$ 11.79$ Net Debt 9,913 9,461 9,252 14,000 10,749 2,847 (6,692)Sales Growth 21% 25% 19% 11.3% 9.4% 8.9% 9.4%EBITDA Growth 19% 17% 14% 16% 12% 11% 11%EBITDA Margin 20.0% 18.8% 19.3% 20.1% 20.5% 20.9% 21.3%Net Debt / EBITDA 0.4x 0.4x 0.3x 0.4x 0.3x 0.1x (0.1x)ROE 13% 13% 14% 15% 15% 16% 17%ROA 8% 8% 9% 10% 10% 11% 13%Source: Actinver

15
Valuation
KOF is valued at 26.1x our 2013 EPS and at 22.5x our 2014 EPS. The stock has evidenced substantial multiple expansion on a forward P/E basis with the multiple rising from 18x to 26x. But the company has experienced sub-stantial change with total volume up 46% in the past year and a half, includ-ing the last two acquisitions.
Compared to peers KOF trades at significant premiums, at a 20% premium to the median of Latam peers and at a 61% premium to the median of inter-national peers outside of Latam. But KOF has evidenced faster growth in the past five years, with net income up at a CAGR of 16.8% in the past five years, compared to the median CAGR of 8% for international peers. More importantly, we are estimating a CAGR of 17% in EPS for the five year peri-od 2011-2016.
On an EV/2013 EBITDA basis, KOF is trading at a smaller 35% premium to international peers.
YE 2013 Price Target of MP 223
We set our YE 2013 Price Target at MP 223, at a multiple of 26x our 2014 EPS, the same multiple that the company is trading at in relation to our 2013 EPS estimate. Thus, we are not projecting multiple contraction, a view sup-ported by our expectation of continued low interest rates, favorable outlook for economic reforms in Mexico, and generally positive outlook for equities in general.
We rate the stock a HOLD but strongly recommend buying it on Price cor-rections.
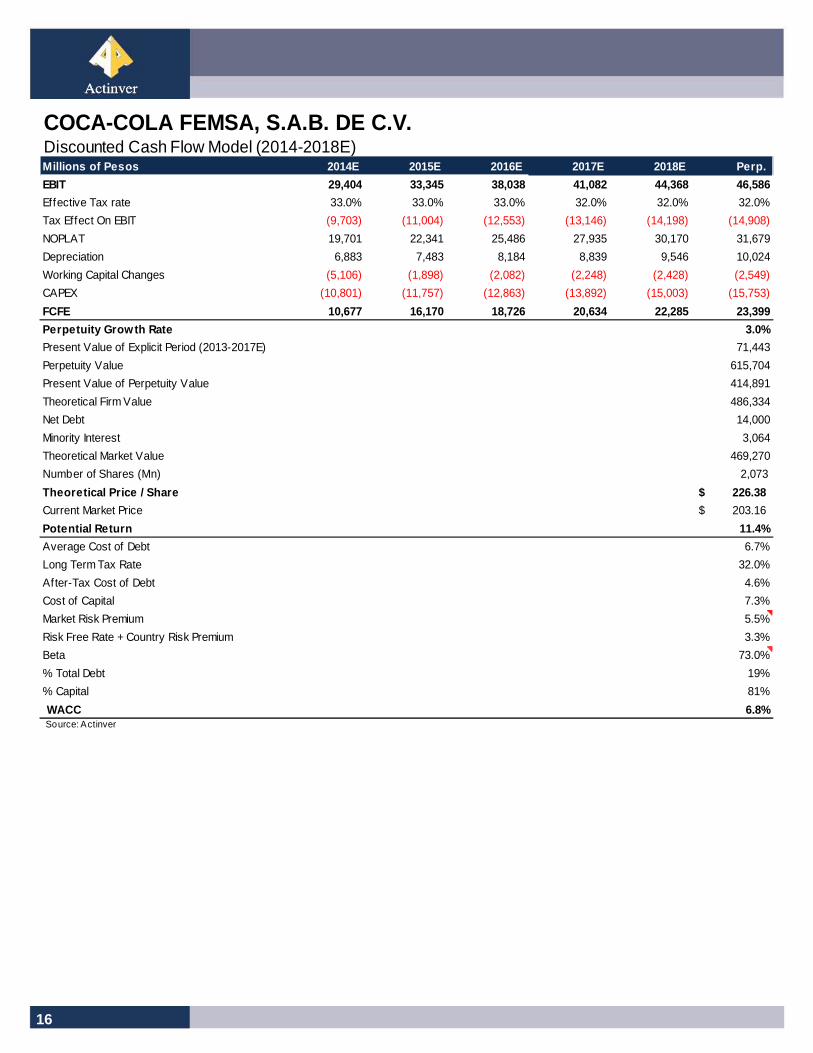
DCF valuation values stock at MP 226
Our valuation and price target are also supported by DCF valuation (see table next page) which values the stock at MP 226 with a WACC of 6.8%, adjusted Beta of 0.73, and perpetuity of 3.0%. The WACC benefits from an unusually low risk-free premium of 3.3%, composed of the 2% US long bond rate and Mexico’s premium of 130 bp’s. If we use a more realistic long term US bond rate of 3%, the theoretical price computes at MP 183 but it can be argued that the 3% perpetuity is conservative given KOF’s high po-tential for acquisitions in the future.
7.0
9.0
11.0
13.0
15.0
17.0
19.0
21.0
23.0
25.0
27.0
may
-08
oct-
08
mar
-09
ago-
09
ene-
10
jun-
10
nov-
10
abr-
11
sep-
11
feb-
12
jul-1
2
dic-
12
KOF's projected P/E
Source: Actinver
Average
+ 1 Std Dev
- 1 Std Dev
- 2 Std Dev
+ 2 Std Dev
0.0
2.0
4.0
6.0
8.0
10.0
12.0
14.0
May
-08
Oct
-08
Mar
-09
Aug
-09
Jan-
10
Jun-
10
Nov
-10
Apr
-11
Sep
-11
Feb
-12
Jul-1
2
Dec
-12
KOF's fwd EV/EBITDA
Source: Actinver
Average
+ 1 Std Dev
- 1 Std Dev
- 2 Std Dev
+ 2 Std Dev
16
COCA-COLA FEMSA, S.A.B. DE C.V.Discounted Cash Flow Model (2014-2018E)Millions of Pesos 2014E 2015E 2016E 2017E 2018E Perp.
EBIT 29,404 33,345 38,038 41,082 44,368 46,586
Effective Tax rate 33.0% 33.0% 33.0% 32.0% 32.0% 32.0%
Tax Effect On EBIT (9,703) (11,004) (12,553) (13,146) (14,198) (14,908)
NOPLAT 19,701 22,341 25,486 27,935 30,170 31,679
Depreciation 6,883 7,483 8,184 8,839 9,546 10,024
Working Capital Changes (5,106) (1,898) (2,082) (2,248) (2,428) (2,549)
CAPEX (10,801) (11,757) (12,863) (13,892) (15,003) (15,753)
FCFE 10,677 16,170 18,726 20,634 22,285 23,399
Perpetuity Growth Rate 3.0%
Present Value of Explicit Period (2013-2017E) 71,443
Perpetuity Value 615,704
Present Value of Perpetuity Value 414,891
Theoretical Firm Value 486,334
Net Debt 14,000
Minority Interest 3,064
Theoretical Market Value 469,270
Number of Shares (Mn) 2,073
Theoretical Price / Share 226.38$
Current Market Price 203.16$
Potential Return 11.4%
Average Cost of Debt 6.7%
Long Term Tax Rate 32.0%
After-Tax Cost of Debt 4.6%
Cost of Capital 7.3%
Market Risk Premium 5.5%
Risk Free Rate + Country Risk Premium 3.3%
Beta 73.0%
% Total Debt 19%
% Capital 81%
WACC 6.8%Source: Actinver

17
2011 L12M 2012E 2013E 2014E 2015E 2016EVE 424,045 423,216 423,099 428,107 425,162 417,619 408,507Net Debt 9,913 9,461 9,252 14,000 10,749 2,847 (6,692)Stockholder's Equity 97,690 96,343 101,047 110,426 121,429 134,402 149,775Minorities 3,089 2,712 2,804 3,064 3,370 3,730 4,156Dividends 4,366 5,707 5,709 6,187 6,982 7,757 8,647
ROE COMPONENTS 2011 L12M 2012E 2013E 2014E 2015E 2016EROE 12.5% 12.7% 13.6% 14.6% 15.4% 16.0% 16.7%ROS (Return on Sales) 8.5% 8.4% 9.3% 9.6% 10.2% 10.8% 11.4%Asset Turnover (Sales/Ave. Assets)0.82 0.73 0.95 0.95 1.00 1.04 1.09Leverage (Assets/Shd. equity) 1.55 1.52 1.53 1.56 1.48 1.40 1.31ROS x Turnover x Leverage 11% 9% 14% 14% 15% 16% 16%
ROS COMPONENTS 2011 L12M 2012E 2013E 2014E 2015E 2016EGross Profit Margin 47.1% 46.5% 46.3% 46.0% 45.9% 46.1% 46.3%General Expense Ratio 29.7% 32.4% 31.0% 30.8% 30.6% 30.4% 30.2%Operating Profit Margin 14.2% 14.3% 13.2% 14.7% 15.6% 16.3% 17.0%Net Financial Expense/Revenues 1.4% 0.9% 0.8% 0.7% 0.5% 0.3% 0.0%Earnings Bef. Tax Margin 13.4% 12.6% 14.1% 15.0% 15.8% 16.7% 17.7%Return on Sales 8.5% 8.4% 9.3% 9.6% 10.2% 10.8% 11.4%
ASSET TURNOVER COMPONENTS2011 L12M 2012E 2013E 2014E 2015E 2016EAsset Turnover (Sales/Ave. Assets)0.82 0.73 0.95 0.95 1.00 1.04 1.09Accounts Receivable Turnover 14.4 22.1 15.6 15.6 15.7 15.7 15.8 Inventory Turnover 16.5 13.0 17.8 14.9 14.9 14.9 15.0 Net Fixed Asset Turnover 3.0 2.7 3.7 3.7 3.7 3.6 3.6
LEVERAGE COMPONENTS 2011 L12M 2012E 2013E 2014E 2015E 2016ELeverage (Assets/Shd. equity) 1.55 1.52 1.53 1.56 1.48 1.40 1.31 Debt with cost/Shd. Equity 23% 21% 24% 27% 23% 16% 9%No-cost liab. / Shd equity 29% 27% 27% 26% 22% 20% 19%
ROIC 2011 L12M 2012E 2013E 2014E 2015E 2016EROIC1 27.2% 24.6% 33.7% 34.9% 34.1% 35.3% 36.7%Trading cycle days2 (2) (7) (3) (1) 1 1 2
1) (AR + Inv + Net FA less AP)/ EBIT less 30% tax rate )
2) Accounts Receivable Days on Hand + Inventory DOH less Accounts Payable DOH less Accrued Expenses DOH

18
BRIEF COMPANY DESCRIPTION
Based in Monterrey, Mexico, KOF is the largest bottler in the KO system by far with total volume of 3.66 billion cases, including the last two announced acquisitions in the Philippines and in Mexico. Since 2000 KOF has expand-ed its volume at a CAGR of 15% and just in the last year and a half, the company expanded volume by 46%.
KOF’s geographical presence in Mexico and South America are illustrated in the table below.
KOF´s portfolio of beverages includes cola’s, flavored sparkling beverages, water, teas, isotonics and other categories, including milk and value-added dairy products.
The company’s installations (excluding last two acquisitions) include 37 plants (sixteen in South America) and 259 distribution centers (97 in South America).
2011 2010 2009Sparkling beverages 85.9% 85.5% 87.2%Water 9.2% 10.1% 8.8%Other categories 4.9% 4.4% 4.0%Source: Company figures
Volume breakdown by type

19
In 9m12, the Mexico and Central America operation accounted for 46% of total revenues and 50% of EBITDA, with the South America division representing the remaining 54% of sales and 50% of EBITDA.
OWNERSHIP/MANAGEMENT UNCHANGED
With four of the five recent acquisitions being share exchanges, FEM-SA’s ownership of KOF has diluted from 53.7% of total capital in early 2011 to 48% at present. Similarly, KO’s stake has diluted to 31.6% from 28.1%.
However, FEMSA continues to hold 63% of voting stock and KO 37%.
The stock’s float is 24% of the total. Average trading volume for the L shares traded locally is USD 10.8 million, and for the ADR is USD 1.2 million.
KOF’s Chairman of the Board, Jose Antonio Fernandez Carbajal, 58, was elected to his position in 2001 and presently holds the title of FEM-SA’s COB and CEO.
Carlos Salazar Lomelin, 62, is CEO, since 2000 with the company since 2000
Hector Treviño Gutierrez, 56, is CFO since 1993 when he joined the company.
TOP CORPORATE GOVERNANCE
KOF excels in corporate governance matters. No FEMSA founding fami-ly member serves in management.
The Board of Directors consists of 19 members with 11 nominated by FEMSA, 6 by KO and the rest independent.
Holders Share types % of Capital % of Voting Voting privileges
FEMSA Series A shares 48.0% 63.0% Full voting rights
KO Series D shares 28.1% 37.0% Full voting rights
Others Series L shares 23.9% 0.0% Limited voting rights
Source: Company data
KOF ownership structure

20
COCA-COLA FEMSA, S.A.B. DE C.V.(Figures in Millions of Pesos)INCOME STATEMENT 2008 2009 2010 2011 9M12 2012E 2013E 2014E 2015E 2016ESales 82,976 102,767 103,456 124,715 106,202 147,795 164,516 180,009 195,950 214,382 Cost of Sales (43,895) (54,952) (55,534) (67,487) (57,219) (79,298) (87,039) (94,882) (102,908) (112,168)Gross Profit 39,081 47,815 47,922 57,227 48,983 68,497 77,477 85,126 93,042 102,214Gross Margin 47.1% 46.5% 46.3% 45.9% 46.1% 46.3% 47.1% 47.3% 47.5% 47.7% General Expenses (25,385) (31,980) (30,843) (37,075) (34,439) (45,822) (50,648) (55,045) (59,498) (64,663)% of Sales -31% -31% -30% -30% -32% -31% -31% -31% -30% -30%Profit Before Other Income and Expenses 13,695 15,835 17,079 20,152 14,545 22,675 26,829 30,081 33,544 37,551Margin 16.5% 15.4% 16.5% 16.2% 13.7% 15.3% 16.3% 16.7% 17.1% 17.5% Other Income and Expenses (1,831) (1,448) (1,292) (2,326) (576) (976) (1,119) (677) (199) 487Operating Profit 11,864 14,386 15,787 17,826 13,969 21,700 25,710 29,404 33,345 38,038Operating Margin 14.3% 14.0% 15.3% 14.3% 13.2% 14.7% 15.6% 16.3% 17.0% 17.7% Depreciation and Amortization (3,422) (3,911) (3,943) (4,846) (4,467) (5,883) (6,236) (6,883) (7,483) (8,184)EBITDA 17,117 19,746 21,022 24,998 19,012 28,558 33,065 36,964 41,028 45,736EBITDA Margin 20.6% 19.2% 20.3% 20.0% 17.9% 19.3% 20.1% 20.5% 20.9% 21.3%Financial Gain (1,437) 187 167 183 426 596 889 934 972 1,014Financial Cost (3,166) (1,895) (1,748) (1,876) (1,354) (1,798) (1,993) (1,903) (1,528) (1,044)Pre-Tax Profit 8,312 13,013 14,559 16,768 13,334 20,790 24,605 28,436 32,789 38,008 Taxes and Profit Sharing (2,485) (4,043) (4,260) (5,599) (4,035) (6,496) (8,120) (9,384) (10,820) (12,543) Tax and Profit Sharing Rate 29.9% 31.1% 29.3% 33.4% 30.3% 31.2% 33.0% 33.0% 33.0% 33.0%Profit from Continuing Operations 5,826 8,970 10,299 11,169 9,298 14,294 16,486 19,052 21,969 25,465 Discontinued Operations 0 0 0 0 0 0 0 0 0 0Net Profit Before Minorities 5,826 8,970 10,299 11,169 9,298 14,294 16,486 19,052 21,969 25,465 Minority Interest (229) (448) (498) (554) (376) (576) (659) (762) (879) (1,019)Net Profit 5,598 8,523 9,800 10,615 8,923 13,718 15,826 18,290 21,090 24,447N° of Shares 1,847 1,847 1,847 1,985 2,031 2,031 2,073 2,073 2,073 2,073EPS MP 3.03 MP 4.62 MP 5.31 MP 5.69 MP 4.44 MP 6.81 MP 7.69 MP 8.82 MP 10.17 MP 11.79BALANCE SHEET 2008 2009 2010 2011 9M12 2012E 2013E 2014E 201 5E 2016ETOTAL ASSETS 97,958 110,661 114,061 151,608 146,147 154,985 172,366 179,488 187,582 196,752 Current Assets 17,991 23,639 26,436 32,074 31,282 39,940 46,071 50,241 54,803 59,794 Cash and Temporary Investments 6,192 9,955 12,534 12,661 11,151 14,557 16,127 17,562 19,131 20,844 Long Term Assets 79,967 87,022 87,625 119,534 114,865 115,045 126,295 129,247 132,779 136,958 Property, Plant & Equipment 28,236 31,243 32,100 41,502 39,041 40,234 44,395 48,865 53,718 59,006 Investment Properties 0 0 0 0 0 0 0 0 0 0 LT Biological Assets 0 0 0 0 0 0 0 0 0 0 Intangible Assets 47,453 50,898 51,213 70,675 67,029 65,689 63,100 60,614 58,225 55,931 Other Long Term Assets 2,283 1,760 1,159 1,979 1,386 1,455 1,769 2,150 2,614 3,177TOTAL LIABILITIES 40,342 42,189 40,179 50,829 47,092 51,134 58,876 54,690 49,451 42,821 Current Liabilities 21,333 23,448 17,646 25,077 22,988 27,038 26,895 24,399 20,895 16,275 Long Term Liabilities 12,455 10,498 15,511 17,034 24,104 24,095 31,981 30,291 28,556 26,546TOTAL DEBT 18,574 15,924 17,351 22,574 20,612 23,809 30,126 28,312 21,977 14,152NET DEBT 12,382 5,970 4,817 9,913 9,461 9,252 14,000 10,749 2,847 (6,692)TOTAL CAPITAL 57,616 68,472 73,882 100,779 99,055 103,851 113,491 124,798 138,131 153,931 Shareholder's Equity 55,913 66,176 71,281 97,690 96,343 101,047 110,426 121,429 134,402 149,775 Minority Interest 1,703 2,296 2,602 3,089 2,712 2,804 3,064 3,370 3,730 4,156CASH FLOW STATEMENT 2008 2009 2010 2011 9M12 2012E 2013E 20 14E 2015E 2016EPRE-TAX PROFIT 8,312 13,013 14,559 16,768 5,356 20,790 24,605 28,436 32,789 38,008Investment Activity Related Items 4,067 4,955 4,684 4,864 1,407 5,547 6,183 6,830 7,431 8,128Financing Activities 3,860 1,282 1,122 1,401 93 921 116 116 116 116Pre-Tax Cash Flow 24,167 25,486 26,171 29,299 6,857 27,462 22,519 34,120 36,921 40,253Working Capital Changes (3,361) (2,083) (6,016) (7,647) (449) (6,676) (3,138) (5,106) (1,898) (2,082)Cash Flow from Operations (8,263) (6,898) (7,952) (13,814) 6,408 20,786 19,382 29,014 35,023 38,172Cash Flow from Investment (8,263) (6,898) (7,952) (13,814) (3,044) (10,309) (11,928) (12,858) (13,814) (14,920)Cash Flow from Financing (5,038) (6,028) (2,011) (2,281) (389) (5,627) (1,863) (10,700) (15,619) (17,516)Net Incr. (Decr.) in Cash and T.I. (423) 4,241 4,386 (709) 2,975 4,850 5,591 5,457 5,590 5,735Net Cash and T.I. Beginning of Period 7,542 6,192 9,955 12,534 12,661 12,661 14,557 16,127 17,562 19,131Net Cash and T.I. End of Period 6,192 9,955 12,534 12,661 11,151 14,557 16,127 17,562 19,131 20,844Source: Actinver

21
ARCA CONTINENTAL , S.A.B. DE C.V.
RE-INITIATION OF COVERAGE BUY, TP MP 108.00
�
Relative Performance
Re-initiation of coverage with a BUY rating. We are re-initiating coverage of Arca Continental (AC) with a BUY rating on the stock and a YE 2013 price target of MP 108. We set our price target at a multiple of 24.5x our 2014 EPS, the same valuation that the stock is currently trading with respect to our 2013 EPS estimate.
Arca Continental, one of KO’s consolidators. The company in the past five years has transformed into one of KO’s top consolidators after acquisitions in Argentina (2008) and Ecuador (2010) and the highly successful merger of Embotelladoras Arca with Grupo Continental (2011). AC is now the third largest KO bottler in the world.
AC well positioned for acquisitions. With a proven record of success in the assimilation of acquisitions and the merger of Arca with Contal behind them, we believe the company is well positioned for additional acquisitions of independent KO bottlers in Mexico and South America, though it will have to compete with KOF and Embotelladora Andina, two very strong contenders. AC has a robust balance sheet, free cash flow generation and qualified management to absorb new acquisitions.
Two snack business acquisitions to enhance division . AC’s two acquisitions in December of snack businesses in the US and Ecuador will quadruple the segment which presently accounts for 5% of revenues and has achieved a very positive record in its six years of operation. Management estimates this segment will represent 15% of total revenues in five years.
Valuation an issue with substantial multiple expans ion. AC’s 12m forward multiple has expanded from a level of 16x a year ago to 24.5x at present, and is at 2 standard deviations away from the average multiple of the past five years. However, AC is not the same company that it was five years ago, or even a year ago, due to its transformation into one of the top KO bottlers fully capable of additional acquisitions.
BUY
February 19, 2013
406080
100120140160180
Feb
-12
Mar
-12
Apr
-12
May
-12
Jun-
12
Jul-1
2
Aug
-12
Sep
-12
Oct
-12
Nov
-12
Dec
-12
Jan-
13
AC IPCSource: Bloomberg
Gustavo Ter an, CFA Food, Beverages, Retail, Discretionary Consumption and Transport � [email protected] ℡ +52 (55) 1103 6600 x 1193 Eduardo Fonseca Fons Food, Beverages &Transport � [email protected] ℡ +52 (55) 1103 6600 x 4122
MULTIPLES 2011 L12M 2012 2013E 2014E 2015E 2016EEV / EBITDA 21.5x 16.1x 14.8x 12.7x 11.5x 10.5x 9.5xP/E 38.5x 30.5x 30.1x 25.1x 21.3x 18.2x 15.5xFCF Yield 1.5% 3.5% 2.0% 3.1% 4.6% 4.7% 5.0%Dividend Yield 3.3% 1.6% 1.6% 1.3% 1.6% 1.9% 2.2%P/BV 4.2x 4.0x 3.9x 3.5x 3.2x 2.8x 2.6xOPERATING INDICATORS 2011 L12M 2012 2013E 2014E 2015E 2016 ESales 44,672 55,596 56,219 61,898 67,767 74,322 81,656EBITDA 7,506 9,874 10,942 12,644 13,808 15,109 16,564Net Profit 3,915 4,939 5,012 5,999 7,057 8,289 9,706EPS 3.19$ 3.06$ 3.11$ 3.72$ 4.38$ 5.14$ 6.02$ Net Debt 8,257 6,328 8,724 8,767 7,024 5,680 4,559Sales Growth 65% 44% 25.8% 10.1% 9.5% 9.7% 9.9%EBITDA Growth 47% 40% 46% 16% 9% 9% 10%EBITDA Margin 16.8% 17.8% 19.5% 20.4% 20.4% 20.3% 20.3%Net Debt / EBITDA 1.1x 1.1x 0.8x 0.7x 0.5x 0.4x 0.3xROE 13% 11% 13% 15% 16% 17% 18%ROA 8% 8% 8% 9% 10% 11% 12%
Ticker AC*Price (MP) 93.5
Target Price 108.0Dividend Yield 12M 1.6%Potential Return 17.1%52-week low / high $57.8/ $106.0Mkt. Cap. (MP mn) 150,626EV 2012E (MP mn) 161,920

22
Investment Thesis
In the past five years, Arca-Contal has become one of Latam’s coke “consolidators”, along with KOF and Andina. It successfully entered the Ar-gentinean market in 2008 and Ecuador in 2010 and now derives 23% of its revenues and 17% of its EBITDA from South America. With other potential acquisition opportunities in South America, as well as in Mexico, we estimate that this company can continue to generate double digit revenues and earn-ings in coming years. Strong management and a robust balance sheet are necessary elements to such outlook, which we believe Arca-Contal possess-es.
As in the case of KOF, Arca Contal’s valuation is the biggest issue with the stock. We are not anticipating multiple contraction given the company’s and Mexico’s bright outlook. Earnings growth alone, we estimate, coupled with dividend yield, will generate a total return of 17% in 2013.
Investment Positives
Proven record of success. In the past five years, this company has evolved into a major contender in the KO system, becoming its third largest bottler. As evident from its operating performance, Arca successfully entered Argentina (2008) and Ecuador (2010). Then it merged with Contal in June 2011, quickly consolidating their combined operations and generating an estimated MP 1.4 billion (USD 110 million) in synergies.
Well positioned for additional acquisitions. Although we believe KOF has more advantages than Arca-Contal in getting the upper hand with potential acquisitions, the latter is still very much capable of striking deals in Mexico and South America as a result of its successful experience, market capitali-zation and strong balance sheet.
Diversification into snacks business. In six short years, Arca-Contal has built up a strong snack business accounting for 5% of revenues in 2012, and expected to grow to 8% in 2013 with the two recent acquisitions in the US and Ecuador. In five years, management expects that this segment will grow to account for 15% of revenues. This strategy is well advised given the slow-er organic growth of the bottling business.
Strong management & robust balance sheet. Like KOF, two definite ad-vantages of Arca-Contal are its strong management and robust balance sheet, necessary components of being a consolidator, not to mention gener-ating improved performance with organic growth.

23
Investment Negatives
High valuation. Arca-Contal is valued at 25x our 2013 EPS estimate and at 12.7x EV/EBITDA 2013. These multiples represent a discount to our KOF valuations, but can still be considered as rich, especially compared to year-ago levels when the company was trading at 16x forward earnings and at 9x EV/EBITDA (forward). We are not expecting multiple contraction given Mexico’s very promising macro-economic outlook and expectations of continued low interest rates globally. South America exposure. Argentina and Ecuador have less than stellar outlooks in South America, though certainly not in the same league as Vene-zuela.
Other countries in the region promise more economic stability, including Chile, Peru, Colombia and Brazil. However, Arca-Contal has successfully navigated the economic environments of both countries generating strong volume and above-inflation price gains.
RECENT DEVELOPMENTS
Two acquisitions to bolster snack business
Last December AC acquired two companies in the snack business: Wise Foods (Wise), based in Pennsylvania, and Industrias Alimenticias Ecuatoria-nas (Inalecsa) based in Ecuador. The price paid was not disclosed but we estimate that it was in the range of USD 30 million. The combined annual revenues of the two companies were USD 300 million, boosting AC’s snack business to USD 400 million (8% of our 2013 estimate). The US operation was twice as large as the Ecuadorian business. Management informed that it paid “high single digit” multiple of EBITDA for the two companies.
Wise markets its products in the US east coast. It was owned by a private equity firm for the past five years and was substantially underinvested, ac-cording to AC. AC intends to reverse this and increase the portfolio of prod-ucts, including their successful Bokados brands, produced in Mexico. Pres-ently Bokados is sold in California, Texas and Chicago, targeting the Hispan-ic market. AC also intends to bring some of Wise’s brands to the Mexican market.
With Inalecsa, AC plans on capitalizing from their bottling network in Ecua-dor (as they have done successfully with Bokados in Mexico). They also plan on exporting Inalecsa’s products to Mexico and the US.
Growth expectations are for the 9-12% range in Mexico, low to mid digit in the US and double digit in Ecuador. Bottom line, in five years, AC expects the snack business to account for 15% of total revenues.

24
Doubling of plant capacity in Argentina
Last November, AC announced the completion of a plant expansion in Tucu-man, doubling plant capacity to 120 MCU with a total investment of USD 40 million (we estimate total 2012 Capex of USD 279 million) . Tucuman is one of four plants in the country. Argentina generated total volume sales of 132 MUC in 2011.
25
BALANCE SHEET YE 2010 YE 2011 9/30/2011 9/30/2012Total Assets 34,592 59,819 61,014 61,823 Total Capital 19,670 38,588 39,061 39,932 Total Liab/Capital 0.76 0.55 0.56 0.55 Net Debt 4,687 8,257 7,618 6,328 Net Debt/EBITDA 0.92 1.10 1.32 0.64 Source: Company reports, Actinver
Financial Results 2011-2012
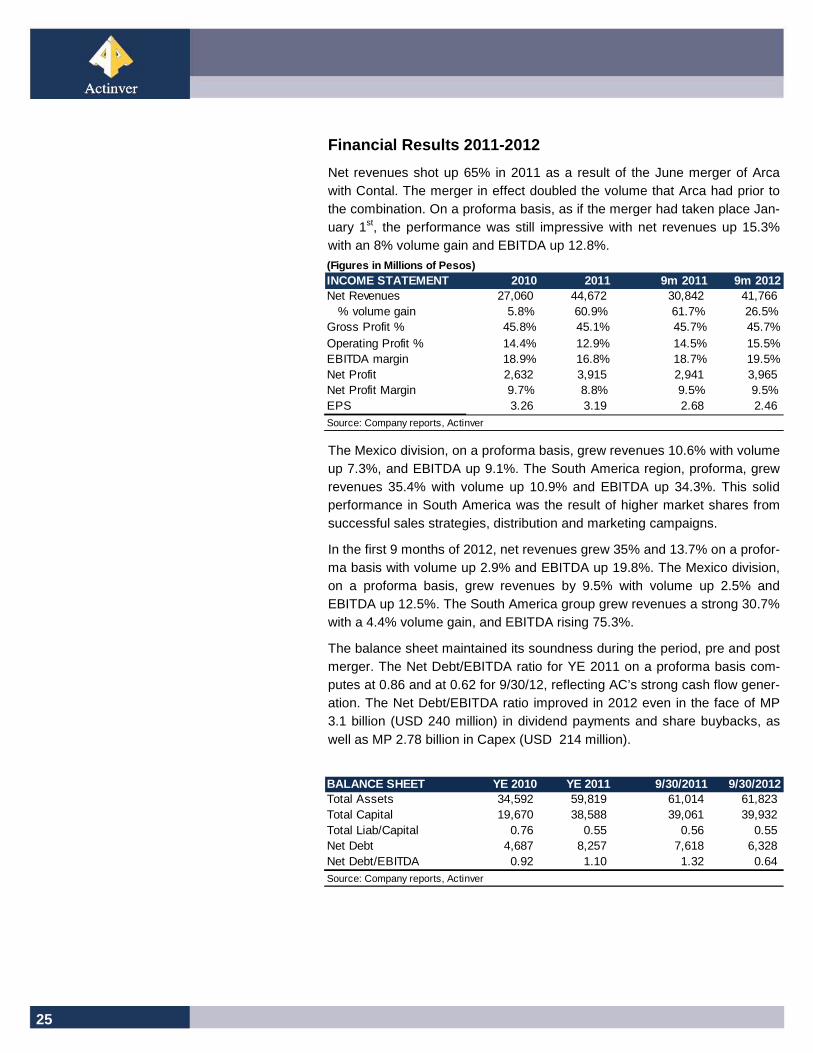
Net revenues shot up 65% in 2011 as a result of the June merger of Arca with Contal. The merger in effect doubled the volume that Arca had prior to the combination. On a proforma basis, as if the merger had taken place Jan-uary 1st, the performance was still impressive with net revenues up 15.3% with an 8% volume gain and EBITDA up 12.8%.
The Mexico division, on a proforma basis, grew revenues 10.6% with volume up 7.3%, and EBITDA up 9.1%. The South America region, proforma, grew revenues 35.4% with volume up 10.9% and EBITDA up 34.3%. This solid performance in South America was the result of higher market shares from successful sales strategies, distribution and marketing campaigns.
In the first 9 months of 2012, net revenues grew 35% and 13.7% on a profor-ma basis with volume up 2.9% and EBITDA up 19.8%. The Mexico division, on a proforma basis, grew revenues by 9.5% with volume up 2.5% and EBITDA up 12.5%. The South America group grew revenues a strong 30.7% with a 4.4% volume gain, and EBITDA rising 75.3%.
The balance sheet maintained its soundness during the period, pre and post merger. The Net Debt/EBITDA ratio for YE 2011 on a proforma basis com-putes at 0.86 and at 0.62 for 9/30/12, reflecting AC’s strong cash flow gener-ation. The Net Debt/EBITDA ratio improved in 2012 even in the face of MP 3.1 billion (USD 240 million) in dividend payments and share buybacks, as well as MP 2.78 billion in Capex (USD 214 million).
(Figures in Millions of Pesos)INCOME STATEMENT 2010 2011 9m 2011 9m 2012Net Revenues 27,060 44,672 30,842 41,766
% volume gain 5.8% 60.9% 61.7% 26.5%Gross Profit % 45.8% 45.1% 45.7% 45.7%Operating Profit % 14.4% 12.9% 14.5% 15.5%EBITDA margin 18.9% 16.8% 18.7% 19.5%Net Profit 2,632 3,915 2,941 3,965 Net Profit Margin 9.7% 8.8% 9.5% 9.5%EPS 3.26 3.19 2.68 2.46 Source: Company reports, Actinver

26
2013-2016 Projection
We are projecting relatively modest revenue growth of 10% each year for the period 2013-2016, with volume gains ranging from 3.1% to 3.6%. We, of course, are not factoring added revenue from new acquisitions. We projected faster revenue gains in South America with above inflation increases, where-as in Mexico we factored price increases in line with inflation.
In terms of margins, our projection yields an improvement of 90 bp’s in 2013’s EBITDA margin, mainly from remaining merger synergies, but we maintained margins in subsequent years.
ROE does show significant gains in the projection period, increasing from an estimated 13% in 2012, to 16% in 2014 and 18% in 2016, benefitting from volume, some margin improvement and reduced financial expenses
MULTIPLES 2011 L12M 2012 2013E 2014E 2015E 2016EEV / EBITDA 21.5x 16.1x 14.8x 12.7x 11.5x 10.5x 9.5xP/E 38.5x 30.5x 30.1x 25.1x 21.3x 18.2x 15.5xFCF Yield 1.5% 3.5% 2.0% 3.1% 4.6% 4.7% 5.0%Dividend Yield 3.3% 1.6% 1.6% 1.3% 1.6% 1.9% 2.2%P/BV 4.2x 4.0x 3.9x 3.5x 3.2x 2.8x 2.6xOPERATING INDICATORS 2011 L12M 2012 2013E 2014E 2015E 2016 ESales 44,672 55,596 56,219 61,898 67,767 74,322 81,656EBITDA 7,506 9,874 10,942 12,644 13,808 15,109 16,564Net Profit 3,915 4,939 5,012 5,999 7,057 8,289 9,706EPS 3.19$ 3.06$ 3.11$ 3.72$ 4.38$ 5.14$ 6.02$ Net Debt 8,257 6,328 8,724 8,767 7,024 5,680 4,559Sales Growth 65% 44% 25.8% 10.1% 9.5% 9.7% 9.9%EBITDA Growth 47% 40% 46% 16% 9% 9% 10%EBITDA Margin 16.8% 17.8% 19.5% 20.4% 20.4% 20.3% 20.3%Net Debt / EBITDA 1.1x 1.1x 0.8x 0.7x 0.5x 0.4x 0.3xROE 13% 11% 13% 15% 16% 17% 18%ROA 8% 8% 8% 9% 10% 11% 12%Source: Actinver
2011 L12M 2012 2013E 2014E 2015E 2016EVE 161,243 159,435 161,920 160,964 159,380 158,223 157,322Net Debt 8,257 6,328 8,724 8,767 7,024 5,680 4,559Stockholder's Equity 36,229 37,452 38,402 43,289 47,681 52,852 58,916Minorities 2,359 2,480 2,570 1,570 1,729 1,917 2,137Dividends 5,020 2,417 2,417 2,005 2,400 2,823 3,315Source: Actinver

27
Valuation
AC trading at premium but with faster growth
AC is valued at 25x our 2013 EPS estimate which compares to the median of 21.7x of Latam peers, including AC, and the median of 16.2x for interna-tional peers outside of Latam. AC is trading at a 4% discount to our KOF forward PE multiple.
On an EV/2013 EBITDA basis, AC is trading at a 12.7x multiple, slightly low-er than KOF’s 13x multiple and at a 32% premium to the median of interna-tional peers outside of Latam.
It should be mentioned that AC has grown at a faster rate than international peers, with a 5 year CAGR in net income of 12.1%, compared to the median rate of 8% for international peers. Equally important, we are estimating a five year CAGR in EPS (2011-2016) of 14%.
YE 2013 Price Target of MP 108, 17% return potentia l
We set our YE 2013 Price Target at 24.5x our 2014 EPS, the same multiple that the stock is trading at with respect to our 2013 EPS estimate.
Although the PE multiple has expanded substantially in the past year (see graph), and it is at 2 standard deviations from the average of the last five years, the company has transformed itself in the past year and a half and has excellent growth prospects.
DCF valuation at MP 117
The DCF valuation (see table next page) produces a theoretical YE 2013 value of MP 117, with a 6.7% WACC, including a 0.67 adjusted Beta, 3.3% risk free rate and 3% perpetuity. Like KOF, AC’s DCF benefits greatly from a relatively low Beta, as well as the 3.3% risk free rate (2% US long bond plus Mexico’s premium of 130 bp’s). On the other hand, the perpetuity rate is rel-atively low, as in the case of KOF, considering the company’s acquisition potential.
0.0
2.0
4.0
6.0
8.0
10.0
12.0
14.0
16.0
May
-08
Nov
-08
May
-09
Nov
-09
May
-10
Nov
-10
May
-11
Nov
-11
May
-12
Nov
-12
AC Forward EV/EBITDA
Source: Actinver
Average
+ 1 Std Dev
+ 2 Std Dev
Source: Actinver
- 1 Std Dev
- 2 Std Dev
0.0
5.0
10.0
15.0
20.0
25.0
Ma
y-0
8
No
v-0
8
Ma
y-0
9
No
v-0
9
Ma
y-1
0
No
v-1
0
Ma
y-1
1
No
v-1
1
Ma
y-1
2
No
v-1
2
AC Forward PE
+ 2 Std Dev
+ 1 Std Dev
- 1 Std Dev
- 2 Std Dev
Average
Source: Actinver

28
ARCA CONTINENTAL, S.A.B. DE C.V.Discounted Cash Flow Model (2014-2018E)Millions of Pesos 2014E 2015E 2016E 2017E 2018E Perp.
EBIT 11,068 12,743 14,699 15,875 17,145 18,002
Effective Tax rate 30.0% 30.0% 30.0% 28.0% 28.0% 28.0%
Tax Effect On EBIT (3,320) (3,823) (4,410) (4,445) (4,801) (5,041)
NOPLAT 7,748 8,920 10,289 11,430 12,344 12,962
Depreciation 2,740 2,365 1,865 2,014 2,175 2,284
Working Capital Changes (83) (382) (436) (471) (509) (534)
CAPEX (3,840) (4,207) (4,617) (4,987) (5,386) (5,655)
FCFE 6,565 6,696 7,100 7,986 8,625 9,056
Perpetuity Growth Rate 3.0%
Present Value of Explicit Period (2013-2017E) 30,321
Perpetuity Value 248,285
Present Value of Perpetuity Value 168,752
Theoretical Firm Value 199,074
Net Debt 8,767
Minority Interest 1,570
Theoretical Market Value 188,736
Number of Shares (Mn) 1,612
Theoretical Price / Share 117.11$
Current Market Price 97.00$
Potential Return 20.7%
Average Cost of Debt 7.0%
Long Term Tax Rate 28.0%
After-Tax Cost of Debt 5.0%
Cost of Capital 7.0%
Market Risk Premium 5.5%
Risk Free Rate + Country Risk Premium 3.3%
Beta 0.67
% Total Debt 18%
% Capital 82%
WACC 6.6%Source: Actinver

29
ROE COMPONENTS 2011 L12M 2012 2013E 2014E 2015E 2016EROE 13.0% 10.8% 13.4% 15.1% 16.4% 17.3% 18.3%ROS (Return on Sales) 8.8% 9.5% 8.9% 9.7% 10.4% 11.2% 11.9%Asset Turnover (Sales/Ave. Assets) 0.75 0.68 0.88 0.91 0.92 0.93 0.94Leverage (Assets/Shd. equity) 1.65 1.65 1.65 1.57 1.54 1.50 1.47ROS x Turnover x Leverage 11% 11% 13% 14% 15% 16% 16%
ROS COMPONENTS 2011 L12M 2012 2013E 2014E 2015E 2016EGross Profit Margin 48.2% 46.3% 45.8% 45.7% 45.1% 45.7% 46.2%General Expense Ratio 30.2% 29.9% 30.8% 30.0% 29.6% 29.2% 28.7%Operating Profit Margin 14.5% 12.9% 15.5% 15.0% 15.6% 16.3% 17.1%Net Financial Expense/Revenues 3.5% 1.7% 1.9% 1.5% 1.2% 1.0% 0.8%Earnings Bef. Tax Margin 12.1% 14.2% 13.6% 14.3% 15.3% 16.3% 17.3%Return on Sales 8.8% 9.5% 8.9% 9.7% 10.4% 11.2% 11.9%
ASSET TURNOVER COMPONENTS 2011 L12M 2012E 2013E 2014E 2015E 2016EAsset Turnover (Sales/Ave. Assets) 0.75 0.68 0.88 0.91 0.92 0.93 0.94Accounts Receivable Turnover 23.9 19.4 22.6 22.5 22.5 22.4 22.3 Inventory Turnover 11.9 18.4 23.2 13.8 13.8 13.8 13.7 Net Fixed Asset Turnover 2.2 1.9 2.5 2.5 2.5 2.4 2.3
LEVERAGE COMPONENTS 2011 L12M 2012E 2013E 2014E 2015E 2016ELeverage (Assets/Shd. equity) 1.65 1.65 1.65 1.57 1.54 1.50 1.47 Debt with cost/Shd. Equity 32% 28% 30% 26% 24% 22% 21%No-cost liab. / Shd equity 27% 30% 29% 27% 26% 24% 23%
ROIC 2011 L12M 2012E 2013E 2014E 2015E 2016EROIC1 17.0% 19.5% 23.9% 23.5% 24.5% 25.0% 25.2%Trading cycle days2 0 (6) (4) (1) (1) (0) (0)
1) (AR + Inv + Net FA less AP less AE)/ EBIT less 30% tax rate )
2) Accounts Receivable Days on Hand + Inventory DOH less Accounts Payable DOH less Accrued Expenses DOH
30
BRIEF DESCRIPTION OF COMPANY
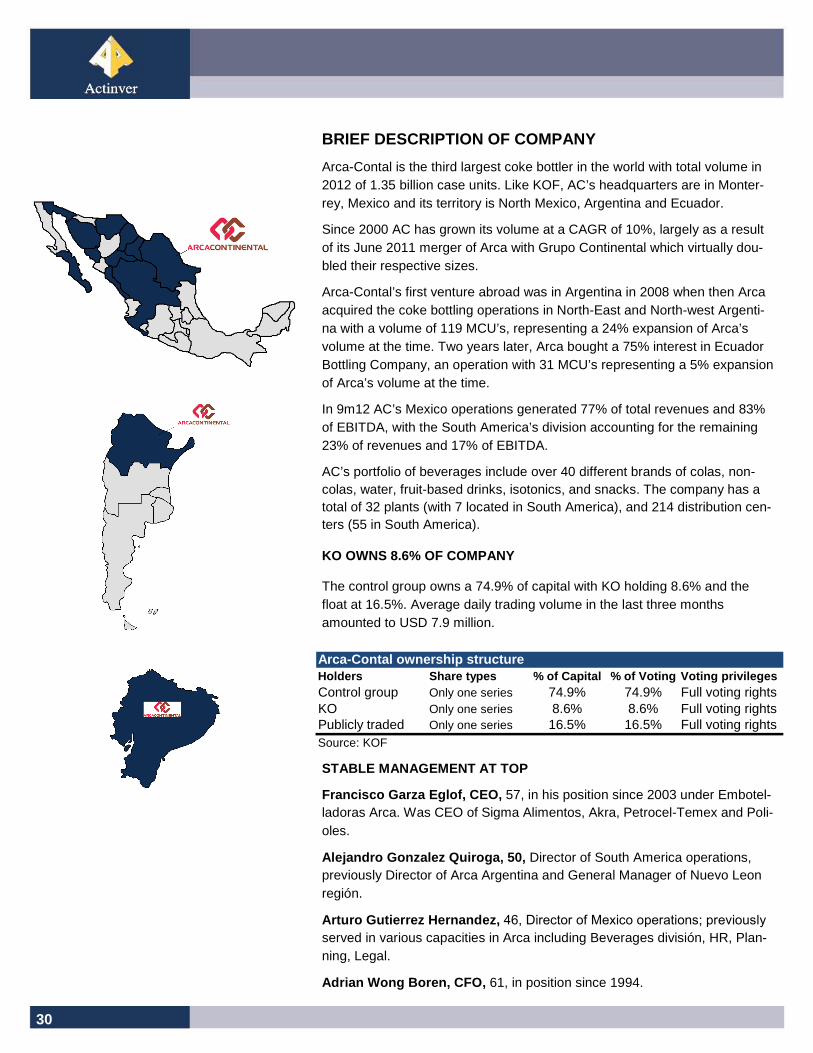
Arca-Contal is the third largest coke bottler in the world with total volume in 2012 of 1.35 billion case units. Like KOF, AC’s headquarters are in Monter-rey, Mexico and its territory is North Mexico, Argentina and Ecuador.
Since 2000 AC has grown its volume at a CAGR of 10%, largely as a result of its June 2011 merger of Arca with Grupo Continental which virtually dou-bled their respective sizes.
Arca-Contal’s first venture abroad was in Argentina in 2008 when then Arca acquired the coke bottling operations in North-East and North-west Argenti-na with a volume of 119 MCU’s, representing a 24% expansion of Arca’s volume at the time. Two years later, Arca bought a 75% interest in Ecuador Bottling Company, an operation with 31 MCU’s representing a 5% expansion of Arca’s volume at the time.
In 9m12 AC’s Mexico operations generated 77% of total revenues and 83% of EBITDA, with the South America’s division accounting for the remaining 23% of revenues and 17% of EBITDA.
AC’s portfolio of beverages include over 40 different brands of colas, non-colas, water, fruit-based drinks, isotonics, and snacks. The company has a total of 32 plants (with 7 located in South America), and 214 distribution cen-ters (55 in South America).
KO OWNS 8.6% OF COMPANY
The control group owns a 74.9% of capital with KO holding 8.6% and the float at 16.5%. Average daily trading volume in the last three months amounted to USD 7.9 million.
STABLE MANAGEMENT AT TOP
Francisco Garza Eglof, CEO, 57, in his position since 2003 under Embotel-ladoras Arca. Was CEO of Sigma Alimentos, Akra, Petrocel-Temex and Poli-oles.
Alejandro Gonzalez Quiroga, 50, Director of South America operations, previously Director of Arca Argentina and General Manager of Nuevo Leon región.
Arturo Gutierrez Hernandez, 46, Director of Mexico operations; previously
served in various capacities in Arca including Beverages división, HR, Plan-ning, Legal.
Adrian Wong Boren, CFO, 61, in position since 1994.
Arca-Contal ownership structureHolders Share types % of Capital % of Voting Voting pri vilegesControl group Only one series 74.9% 74.9% Full voting rightsKO Only one series 8.6% 8.6% Full voting rightsPublicly traded Only one series 16.5% 16.5% Full voting rightsSource: KOF

31
EXEMPLARY CORPORATE GOVERNANCE
Arca-Contal has exemplary corporate governance with no controlling group members in management and no related party transactions. Its Board of Di-rectors consists of 20 members with 5 independent. KO appoints one mem-ber of the board. Audit Committee members are all independent.

32
ARCA CONTINENTAL, S.A.B. DE C.V.(Figures in Millions of Pesos)INCOME STATEMENT 2008 2009 2010 2011 2012 2013E 2014E 2015E 2016ESales 20,255 24,234 27,060 44,672 56,219 61,898 67,767 74,322 81,656 Cost of Sales (10,494) (13,017) (14,659) (24,506) (30,222) (33,348) (36,293) (39,565) (43,208)Gross Profit 9,761 11,217 12,401 20,166 25,997 28,550 31,474 34,756 38,447Gross Margin 48.2% 46.3% 45.8% 45.1% 46.2% 46.1% 46.4% 46.8% 47.1% General Expenses (5,915) (7,444) (8,182) (13,504) (17,295) (18,598) (20,086) (21,693) (23,428)% of Sales -29% -31% -30% -30% -31% -30% -30% -29% -29%Profit Before Other Income and Expenses 3,847 3,773 4,220 6,662 8,702 9,952 11,388 13,063 15,019Margin 19.0% 15.6% 15.6% 14.9% 15.5% 16.1% 16.8% 17.6% 18.4% Other Income and Expenses (1) (101) (331) (912) (222) (320) (320) (320) (320)Operating Profit 3,845 3,672 3,889 5,750 8,433 9,632 11,068 12,743 14,699Operating Margin 19.0% 15.2% 14.4% 12.9% 15.0% 15.6% 16.3% 17.1% 18.0% Depreciation and Amortization (869) (1,118) (1,216) (1,756) (2,379) (3,012) (2,740) (2,365) (1,865)EBITDA 4,714 4,789 5,105 7,506 10,942 12,644 13,808 15,109 16,564EBITDA Margin 23.3% 19.8% 18.9% 16.8% 19.5% 20.4% 20.4% 20.3% 20.3%Financial Gain 102 (380) (402) (743) (25) 191 293 395 489Financial Cost (206) (346) (470) (816) (1,030) (1,107) (1,135) (1,152) (1,177)Pre-Tax Profit 3,887 3,383 3,696 5,407 7,668 8,856 10,366 12,126 14,151 Taxes and Profit Sharing (937) (932) (1,021) (1,342) (2,447) (2,657) (3,110) (3,638) (4,245) Tax and Profit Sharing Rate 24.1% 27.5% 27.6% 24.8% 31.9% 30.0% 30.0% 30.0% 30.0%Profit from Continuing Operations 2,950 2,451 2,675 4,065 5,221 6,199 7,257 8,489 9,906 Discontinued Operations 0 0 0 0 0 0 0 0 0Net Profit Before Minorities 2,950 2,451 2,675 4,065 5,221 6,199 7,257 8,489 9,906 Minority Interest (0) (0) (43) (150) (209) (200) (200) (200) (200)Net Profit 2,950 2,451 2,632 3,915 5,012 5,999 7,057 8,289 9,706N° of Shares 814 809 808 1,616 1,612 1,612 1,612 1,612 1,612EPS MP 3.64 MP 3.02 MP 3.26 MP 3.19 MP 3.11 MP 3.72 MP 4.38 MP 5.14 MP 6.02BALANCE SHEET 2008 2009 2010 2011 2012 2013E 2014E 2015E 201 6ETOTAL ASSETS 21,659 25,642 34,592 59,819 63,546 67,885 73,418 79,519 86,631 Current Assets 3,727 7,589 7,665 9,596 8,445 10,827 13,636 16,104 18,488 Cash and Temporary Investments 959 4,421 3,628 3,316 2,609 2,591 4,595 6,164 7,539 Long Term Assets 766 787 696 2,420 55,101 57,058 59,782 63,415 68,142 Property, Plant & Equipment 10,929 10,869 12,315 20,672 22,467 24,424 27,148 30,780 35,507 Investment Properties 0 0 0 0 0 0 0 0 0 LT Biological Assets 0 0 0 0 0 0 0 0 0 Intangible Assets 6,217 6,207 13,883 27,112 29,057 29,057 29,057 29,057 29,057 Other Long Term Assets 21 190 33 19 598 598 598 598 598TOTAL LIABILITIES 7,000 9,845 14,922 21,231 22,575 23,026 24,008 24,750 25,577 Current Liabilities 4,428 3,829 3,806 6,883 8,037 8,376 9,098 9,616 10,189 Long Term Liabilities 500 4,000 7,785 10,236 14,538 14,649 14,910 15,134 15,389TOTAL DEBT 2,988 5,961 8,315 11,573 11,333 11,359 11,620 11,843 12,098NET DEBT 2,029 1,540 4,687 8,257 8,724 8,767 7,024 5,680 4,559TOTAL CAPITAL 14,659 15,796 19,670 38,588 40,972 44,859 49,410 54,769 61,053 Shareholder's Equity 14,659 15,796 17,324 36,229 38,402 43,289 47,681 52,852 58,916 Minority Interest 0 0 2,346 2,359 2,570 1,570 1,729 1,917 2,137CASH FLOW STATEMENT 2008 2009 2010 2011 2012 2013E 2014E 2015E 2016EPRE-TAX PROFIT 3,887 3,383 3,696 5,407 7,668 8,856 10,366 12,126 14,151Investment Activity Related Items 978 1,171 1,190 1,555 2,679 3,033 2,755 2,374 1,864Financing Activities 206 346 470 816 1,004 1,072 1,072 1,072 1,072Pre-Tax Cash Flow 6,254 6,416 7,015 10,149 11,351 18,776 19,411 20,102 20,835Working Capital Changes (1,462) (1,503) (191) (2,753) (1,246) (1,975) (83) (382) (436)Cash Flow from Operations (5,887) (1,534) (6,114) (2,521) 10,105 16,802 19,329 19,720 20,398Cash Flow from Investment (5,887) (1,534) (6,114) (2,521) (7,520) (13,450) (13,795) (14,162) (14,572)Cash Flow from Financing 285 1,653 269 (2,843) (3,169) (3,167) (3,327) (3,787) (4,249)Net Incr. (Decr.) in Cash and T.I. (1,993) 3,515 (680) (340) (584) 184 2,207 1,771 1,577Net Cash and T.I. Beginning of Period 2,758 959 4,421 3,628 3,316 2,609 2,591 4,595 6,164Net Cash and T.I. End of Period 959 4,421 3,628 3,316 2,609 2,591 4,595 6,164 7,539Source: Actinver
33
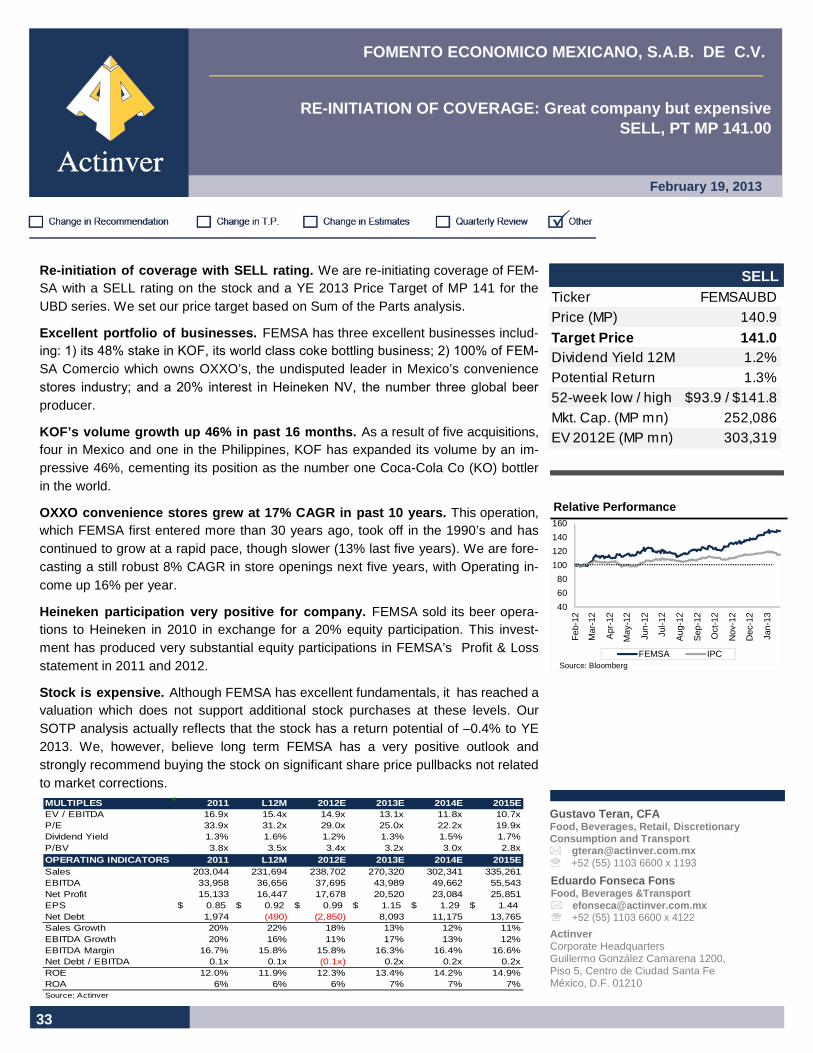
Re-initiation of coverage with SELL rating. We are re-initiating coverage of FEM-SA with a SELL rating on the stock and a YE 2013 Price Target of MP 141 for the UBD series. We set our price target based on Sum of the Parts analysis.
Excellent portfolio of businesses. FEMSA has three excellent businesses includ-ing: 1) its 48% stake in KOF, its world class coke bottling business; 2) 100% of FEM-
SA Comercio which owns OXXO’s, the undisputed leader in Mexico’s convenience stores industry; and a 20% interest in Heineken NV, the number three global beer
producer.
KOF’s volume growth up 46% in past 16 months. As a result of five acquisitions, four in Mexico and one in the Philippines, KOF has expanded its volume by an im-pressive 46%, cementing its position as the number one Coca-Cola Co (KO) bottler in the world.
OXXO convenience stores grew at 17% CAGR in past 10 years. This operation, which FEMSA first entered more than 30 years ago, took off in the 1990’s and has continued to grow at a rapid pace, though slower (13% last five years). We are fore-casting a still robust 8% CAGR in store openings next five years, with Operating in-come up 16% per year.
Heineken participation very positive for company. FEMSA sold its beer opera-tions to Heineken in 2010 in exchange for a 20% equity participation. This invest-ment has produced very substantial equity participations in FEMSA’s Profit & Loss statement in 2011 and 2012.
Stock is expensive. Although FEMSA has excellent fundamentals, it has reached a valuation which does not support additional stock purchases at these levels. Our SOTP analysis actually reflects that the stock has a return potential of –0.4% to YE 2013. We, however, believe long term FEMSA has a very positive outlook and strongly recommend buying the stock on significant share price pullbacks not related to market corrections.
�
40
60
80
100
120
140
160
Feb
-12
Mar
-12
Apr
-12
May
-12
Jun-
12
Jul-1
2
Aug
-12
Sep
-12
Oct
-12
Nov
-12
Dec
-12
Jan-
13
FEMSA IPCSource: Bloomberg
SELL
Relative Performance
FOMENTO ECONOMICO MEXICANO, S.A.B. DE C.V.
RE-INITIATION OF COVERAGE: Great company but expens ive SELL, PT MP 141.00
February 19, 2013
Gustavo Ter an, CFA Food, Beverages, Retail, Discretionary Consumption and Transport � [email protected] ℡ +52 (55) 1103 6600 x 1193 Eduardo Fonseca Fons Food, Beverages &Transport � [email protected] ℡ +52 (55) 1103 6600 x 4122
Ticker FEMSAUBDPrice (MP) 140.9
Target Price 141.0Dividend Yield 12M 1.2%Potential Return 1.3%52-week low / high $93.9 / $141.8Mkt. Cap. (MP mn) 252,086EV 2012E (MP mn) 303,319
MULTIPLES 2011 L12M 2012E 2013E 2014E 2015EEV / EBITDA 16.9x 15.4x 14.9x 13.1x 11.8x 10.7xP/E 33.9x 31.2x 29.0x 25.0x 22.2x 19.9xDividend Yield 1.3% 1.6% 1.2% 1.3% 1.5% 1.7%P/BV 3.8x 3.5x 3.4x 3.2x 3.0x 2.8xOPERATING INDICATORS 2011 L12M 2012E 2013E 2014E 2015ESales 203,044 231,694 238,702 270,320 302,341 335,261EBITDA 33,958 36,656 37,695 43,989 49,662 55,543Net Profit 15,133 16,447 17,678 20,520 23,084 25,851EPS 0.85$ 0.92$ 0.99$ 1.15$ 1.29$ 1.44$ Net Debt 1,974 (490) (2,850) 8,093 11,175 13,765Sales Growth 20% 22% 18% 13% 12% 11%EBITDA Growth 20% 16% 11% 17% 13% 12%EBITDA Margin 16.7% 15.8% 15.8% 16.3% 16.4% 16.6%Net Debt / EBITDA 0.1x 0.1x (0.1x) 0.2x 0.2x 0.2xROE 12.0% 11.9% 12.3% 13.4% 14.2% 14.9%ROA 6% 6% 6% 7% 7% 7%Source: Actinver
Actinver Corporate Headquarters Guillermo González Camarena 1200, Piso 5, Centro de Ciudad Santa Fe México, D.F. 01210

34
Investment Thesis
FEMSA is a much different company than its conglomerate past of the 1980’s and 1990’s. It is now focused on two businesses, beverages with its 48% ownership stake in KOF, and retail, through FEMSA Comercio which owns OXXO, Mexico’s largest convenience store chain. FEMSA also has a 20% investment in Heineken, which it obtained when it sold its beer opera-tions to the Dutch company in 2010. FEMSA, we estimate, will eventually sell its Heineken interest, a process that can begin starting in April as part of its agreement with Heineken, by selling shares equivalent to 1% of Hei-neken every quarter.
The bottling operations and retail businesses of FEMSA are top performers in terms of growth and profitability, especially compared to peers. However, the stock market has rewarded FEMSA investors with outsize returns, with the stock growing at a CAGR of 25% the past five years, rising 42% since January 1st 2012.
Our view is that the stock is expensive and warrants a SELL rating. But we strongly recommend adding to positions (or buying it) on significant price pullbacks given the positive long term outlook for the two main businesses of FEMSA.
Investment Positives
Beverage business is number one in Coca-Cola system
FEMSA’s KOF business is the number one bottler in the Coca-Cola system with total volume of 3.66 billion unit cases, including its latest two acquisi-tions. KOF has grown its volume at a CAGR of 15% in the past 12 years, and by 46% in the past year and a half, mainly through acquisitions. In the five year period 2011-2016, we are projecting a CAGR in revenues and EPS of 12% and 15% for KOF, without factoring new acquisitions.
OXXO retail business grown at 18% CAGR past 12 year s
OXXO has come a long way from its early beginnings in the 1970’s and has achieved an impressive 18% CAGR in store openings in the past 12 years, though its rate of growth has slowed to 13% in the past five years and we are projecting an 8% CAGR in the coming five years. Its net operating profit margin has improved from 4.5% in 2001, to 7.8% in 2011 and FEMSA esti-mates its ROIC at levels approaching 30% (no separate OXXO balance sheet numbers are published).

35
New retail business with pharmacy chain acquisition
The acquisition of Farmacias YZA this past November opens a new avenue for growth in the retail sector. The chain, with 300 outlets, is small relative FEMSA’s size (1-2% of FEMSA’s revenues), but it presents excellent growth potential in an industry that is still fragmented in Mexico.
Excellent management, can manage new acquisitions
FEMSA’s high quality of management is well recognized and valued in the investment community. KOF has its own separate management structure, with plenty of talent to spare for new acquisitions. Turnover is not evident in high positions.
Balance sheet strength added benefit.
FEMSA, as well as KOF, have very robust balance sheets with modest debt in relation to equity and cash flow. Both companies pay decent dividends after strong allowances for capital expenditures. These attributes are a ma-jor factor in their ability to make acquisitions, especially at KOF.
Investment Negatives
Stock valuation is expensive
Again, as in the case of KOF and Arca-Contal, one big negative in our in-vestment thesis is the stock’s valuation with, in the case of FEMSA, a for-ward ratios of 24.5x 2013 EPS and 12.9x EV/EBITDA. The valuation is not supported by SOTP’s analysis which reflects a slight negative return poten-tial in 2013.
Still we recommend buying the stock on double digit price corrections unre-lated to general market corrections.
Exposure in South American countries with macro ris ks
Venezuela accounts for an estimated 7% of FEMSA’s revenues (15% of KOF’s) and a similar percentage of operating profit, with Argentina repre-senting a smaller estimated 4% participation of FEMSA’s revenues and profits. Both countries present considerably higher economic challenges than the rest of the territories in which KOF and FEMSA participate. Just recently, Venezuela devalued its currency by 32%, this being the fourth such move in the past six years. Argentina could follow in 2013 given its deteriorating fiscal position and macroeconomic problems.
In high inflation and devaluation countries such as the two mentioned, KOF has been able to raise prices ahead of inflation but there is no guarantee that this situation will continue in the future.

36
OXXO - CONVENIENCE STORE INDUSTRY
OXXO is the eight hundred pound gorilla in the Mexican convenience store industry with total stores of 9,989 as of 3Q12, compared to 2,727 units com-bined for the next four largest competitors. OXXO is a subsidiary of FEMSA Comercio which in turn is 100% owned by FEMSA.
Since 2000, FEMSA has grown the number of stores from 1,468 units to an estimated 10,417 as of year-end 2012, equivalent to a CAGR of 18%. In the past five years, the CAGR in store openings has slowed to 13% and we are projecting an 8% CAGR in the coming five years. This slow-down is not re-lated to a lesser competitive position in the industry or approaching satura-tion. Rather it is simply a related to its much larger base.
PENETRATION IN MEXICO IS STILL LOW
In Mexico there are an estimated 800,000 small mom & pop corner stores, which in effect constitute, together with the retail chains, the convenience store industry in Mexico. OXXO accounts for a relatively small 1.2% share of the total and the largest four combined represent only 1.5% of the total.
No credible strong competitor has surfaced yet and all the while, OXXO keeps getting stronger with more penetration and distribution and logistics capabilities. The number of OXXO distribution centers in Mexico totals 13. Information on competitors is scarce since they are not publicly traded com-panies.
OXXO´s highest penetration, not surprisingly, is in its home state of Monter-rey where the company has a total of 844 stores, equivalent to one store per 5,500 inhabitants. This penetration is roughly twice the national rate. At the state of Monterrey’s penetration on a nationwide basis, OXXO estimates that they could double their number of stores to 20,000. Our projection for the next five years is to open on average 1,000 stores per year, as planned by the company.
SAME-STORE SALES PERFORMANCE UP
Oxxo performance(% increase) 2009 2010 2011 9m12Total Revenues 13.6% 16.3% 19.0% 17.0%Number of stores 15.1% 14.9% 13.5% 6.3%Same store sales 1.3% 5.2% 9.2% 7.8%Store trafic 3.3% 3.9% 4.6% 4.2%Ave. Ticket -1.6% 1.3% 4.3% 3.4%Source: Femsa reports

37
In the past three years, SSS’s have improved as a result of higher store traffic and average ticket. SSS’s in 2009 were relatively low at 1.3%, how-ever, this was the year when Mexico bore the brunt of the 2008 financial crisis and GDP declined by 5.9%.
Through new product introductions, better marketing and management initi-atives, SSS’s have been impressively strong since 2010, surpassing sub-stantially supermarket sales which have been in the 3-4% level. Still we are projecting a deceleration in the rate of growth of SSS’s to 7% in 2013, 6% in 2014 and 5% by 2016.
FARMACIAS YZA ACQUISITION
Last November, FEMSA announced that FEMSA Comercio reached agree-ment to acquire 75% of Farmacias YZA, a chain of pharmacies with 333 units located in Southeast Mexico. The transaction is still in the approval phase and is expected to close in 1Q13. No price was disclosed. We esti-mate that the acquisition will represent between 1-2% of FEMSA’s consoli-dated revenues and 4-6% of OXXO’s.
The pharmaceutical industry in Mexico consists of an estimated 25,000 outlets and is highly fragmented. Industry information is hard to come by given that only one large chain Is a publicly traded company.
FEMSA indicates that established chains account for an estimated 7,000-8000 pharmacies with the largest being Farmacias Similares with 4,000 locations, followed by Farmacias Guadalajara with 1,000 units, Benavides with 800 stores and Farmacias del Ahorro with less than 1,000 units.
Farmacias YZA stores range in size between 60-80 M2 located in the Southeast states of Yucatan, Tabasco and Chiapas.
We expect FEMSA Comercio will tread carefully with this acquisition and learn the business well before undertaking significant expansion.

38
Financial Results 2011-2012
Net Revenues grew 19.6% in 2011 with KOF’s sales up 21% and OXXO’s 19%. Operating margins remained at similar levels in 2010 and 2011.
Net profit in 2010 includes MP 27.3 billion in gains from the sale of FEM-SA’s beer operations to Heineken. Excluding these gains, net profit still grew 17%.
In the first 9 months of 2012 Net Revenues grew 19.8% with KOF’s reve-nues gaining 13.6% and FEMSA Comercio’s 17%. The EBITDA margin, on a comparable basis (IFRS) and with the addition of non-cash charges, aside of depreciation and amortization, computes at 14.8% both periods. Net Income grew 13.6%.
FEMSA’s balance sheet has remained solid, a testament to the company’s strong cash flow generation. KOF, of course, although 48% owned, is fully consolidated given FEMSA’s control with 63% of the vote.
Four of KOF’s last five acquisitions have been share exchanges. The Phil-ippines purchase is for cash, for a total of USD 688 million and should close in the 1Q but we project KOF’s balance sheet will easily absorb the cost with net debt/EBITDA at that company rising to a still low 0.6x from 0.3x.
BALANCE SHEET YE 2010 YE 2011 9/30/2011 9/30/2012Total Assets 223,578 274,704 247,006 272,032 Total Capital 153,013 191,114 166,011 197,894 Total Liab/Capital 0.46 0.44 0.49 0.37 Net Debt (1,618) 1,974 (6,254) (490) Net Debt/EBITDA 0.13 0.19 0.17 0.06 Source: Company reports, Actinver
(Figures in Millions of Pesos)INCOME STATEMENT 2010 2011 9m 2011 9m 2012Net Revenues 169,702 203,044 144,529 173,178 Gross Profit % 41.8% 41.9% 41.4% 41.8%EBITDA margin 16.7% 16.7% 15.8% 14.8%Net Profit 40,251 15,133 9,655 10,970 Net Profit Margin 23.7% 7.5% 6.7% 6.3%EPS 2.25 0.85 0.54 0.61 Source: Company reports, Actinver

39
2013-2016 Projection
We are projecting revenue growth of 13%, 12% and 11 % for the next three years with EPS up 16% in 2013, 12% in 2014 an d 11.6% in 2015.
Our FEMSA projection on the P&L end is the addition of our projections for KOF and FEMSA Comercio, as well as separate estimates for Heineken, based on analyst consensus earnings. We also include FEMSA’s non-core businesses, which we estimate at 3% of total revenues, excluding Heineken.
For FEMSA Comercio, we are estimating the following GAGR’s :
■ Number of stores 9%, with 9.7% in 2013 and 9% in 2014
■ Revenues 16%, 17.8% in 2013, 16% in 2014
■ Operating Income 16%, 20% in 2013, 17.7% in 2014
■ CAPEX 15%, 17.8% in 2013, 15.8% in 2014
For KOF our CAGR’s are as follows :
■ Revenues 11%
■ Operating Income 15%
■ Net Income 17%
Heineken:
■ 20% equity contribution, 2012 MP 6.3 billion, 2013 MP 6.4 billion, 2014 MP 7.2 billion, based on consensus estimates.
Other operations
■ Operating profit contributions 2012 , 2013, 2014: MP 1 billion.
MULTIPLES 2011 L12M 2012E 2013E 2014E 2015EEV / EBITDA 16.9x 15.4x 14.9x 13.1x 11.8x 10.7xP/E 33.9x 31.2x 29.0x 25.0x 22.2x 19.9xFCF Yield 2.1% 3.0% 2.2% 3.2% 3.9% 4.5%Dividend Yield 1.3% 1.6% 1.2% 1.3% 1.5% 1.7%P/BV 3.8x 3.5x 3.4x 3.2x 3.0x 2.8xOPERATING INDICATORS 2011 L12M 2012E 2013E 2014E 2015ESales 203,044 231,694 238,702 270,320 302,341 335,261EBITDA 33,958 36,656 37,695 43,989 49,662 55,543Net Profit 15,133 16,447 17,678 20,520 23,084 25,851EPS 0.85$ 0.92$ 0.99$ 1.15$ 1.29$ 1.44$ Net Debt 1,974 (490) (2,850) 8,093 11,175 13,765Sales Growth 20% 22% 18% 13% 12% 11%EBITDA Growth 20% 16% 11% 17% 13% 12%EBITDA Margin 16.7% 15.8% 15.8% 16.3% 16.4% 16.6%Net Debt / EBITDA 0.1x 0.1x (0.1x) 0.2x 0.2x 0.2xROE 12.0% 11.9% 12.3% 13.4% 14.2% 14.9%ROA 6% 6% 6% 7% 7% 7%Source: Actinver
2011 L12M 2012E 2013E 2014E 2015EVE 572,697 564,422 563,384 577,891 584,999 592,096Net Debt 1,974 (490) (2,850) 8,093 11,175 13,765Stockholder's Equity 133,581 146,171 151,557 161,739 173,243 186,119Minorities 57,534 51,723 53,045 56,609 60,635 65,142Dividends 6,625 8,362 6,061 6,775 7,554 8,468Source: Actinver

40
Valuation
Given the composition of FEMSA’s portfolio of businesses, the Sum of the Parts valuation takes added relevance. The beverage business is substan-tially different than the retail business, and the Heineken investment is not an operating business that, in our view, very likely will be disposed at the right time to reallocate capital.
Our valuation objective is to set up a price target for year end 2013. Thus, we value KOF and OXXO on the basis of 2014 estimated EBITDA’s. and appropriate forward multiples
For KOF, we use a multiple of 13.5x EBITDA, in line with the current for-ward EV/EBITDA multiple of KOF. KOF’s recent acquisition of the Philip-pines coke bottler also was at 13x EBITDA.
In terms of OXXO, we used a multiple of EBITDA of 18x, which, though higher than KOF’s, represents the business’s organic growth potential with additional space for acquisitions. OXXO’s ROIC, according to FEMSA, is well into the 20’s percent return. Walmex’s was 18% in 2011 and we esti-mate it will recover to the 20% level. Walmex presently trades at an EV/ 2013 EBITDA multiple of 16.2x but traded at 18x early in 2012, prior to the flare-up of the corruption scandal in the opening of new stores.
For Heineken, we used the current value of the two series owned by FEM-SA and added a 10% estimated appreciation to year-end 2013.
FEMSA’s other businesses include FEMSA Logistica (distribution busi-ness), Invera (refrigeration equipment), as well as corporate overhead. We estimate these will contribute MP 1 billion in EBITDA in 2014, net of corpo-rate overhead. We assigned a multiple of 10x.
Bottom line, our SOTP analysis yields a YE 2013 price estimate of MP 141, which is were FEMSA is trading at present. Thus, we recommend SELLING the shares and switching to KOF or Arca-Contal, preferably AC.
FEMSA: SUM OF THE PARTS ANALYSIS
(figures in millions of MP) 2014E EBITDA EV/ EBITDA 20 13 EVOwnership
Stake Value
KOF 36,964 13.5x 499,010 48.00% 239,525 OXXO 11,846 18.0x 213,224 100% 213,224 Heineken participation (20%) - 20% 106,563 Other businesses 1,000 10.0x 10,000 100% 10,000 Implied FEMSA EV 569,312 Net Debt 2013E (8,093) Minority Interest 2013E (56,609) Implied Market CAP 504,610 Shares 3,578 Target price 141.02 Current price 143.42Upside -1.7%Dividend yield 1.3%Total Upside -0.4%Sources: Bloomberg, company reports, Actinver

41
BRIEF DESCRIPTION OF COMPANY
FEMSA traces its roots to the establishment of the first brewery in Mexico, Cerveceria Cuahtemoc, founded in 1890 in the state of Monterrey. In the 1970’s, FEMSA’s predecessor, Valores Industriales S.A. de C.V. (VISA), turned into one of Mexico’s top conglomerates, along with Grupo Alfa, which also traces its roots to Cuahtemoc and branched out in 1974.
At this time, under VISA, the company entered the soft drinks and mineral wáter businesses through acquisitions and opened the first convenience stores under the name of OXXO. VISA’s other operations at the time in-cluded, in addition its beer division, packaging, banking, construction, hotel, food, fishing and auto parts.
VISA conglomerate begins process of divestitures
VISA’s banking business was nationalized in 1982. In subsequent years, FEMSA divested of what became non-core businesses to focus on soft drinks, convenience stores and beer. In 2010 FEMSA swapped its beer business with Heineken for a 20% economic interest in the brewery.
FEMSA at present is focused on two businesses only
KOF and FEMSA Comercio are the two core businesses of the group. Hei-neken’s investment may or may not turn into a long term investment, in our view; its outcome will depend on the attractiveness of its value in the mar-
ket place compared to investment opportunities in FEMSA’s core business-es,
FEMSA still has two smaller operating businesses, namely FEMSA Logisti-ca, which provides logistics and vehicle maintenance services to KOF, OXXO and third parties; and Invera, which produces commercial refrigera-
tors for the soft drink, beer and food industries and also sells to KOF, OXXO and third parties, These two operations, we estimate, account for less than 3% of total group sales.

42
OWNERSHIP STRUCTURE
No major changes in FEMSA’s ownership structure have taken place in the recent past. The control group, which comprises the descendants of the founding families, has 38.69% of the capital with 74.86% of the vote.
As per the company’s 2001 20-F filing, two other major shareholders in-cluded William H Gates entities, with 7.85% of capital, and Aberdeen Asset Management, with 7.6% of capital.
MANAGEMENT
Jose Antonio Carbajal, COB, CEO. Mr. Carbajal joined FEMSA in 1987 and has been in his position since 1994. He is widely recognized as one of Mexico’s top executives. As also serves as KOF’s Chairman of the Board.
Jose Gerardo Astaburuaga, CFO. Mr. Astaburuaga, 59, joined the com-pany in 1982 and has been in his position since 2006.
Other top executives named in the company’s 20-F filing typically have have been with the company for decades. No turnover at high positions is evident.
No descendants of controlling families are evident in high positions.
The Board of Directors has 17 members with six from controlling families and the rest constituted by well recognized businessmen. The only Board member from FEMSA’s management is Mr. Carbajal.
FEMSA ownership structureHolders Share types % of Capital % of Voting Voting pri vilegesControl Group Series B 38.69% 74.86% Full voting rightsWilliam H Gates III Series B and D-B 7.85% 3.04% Full voting rights on 3.04%Aberdeen Asset Mgt. Series B and D-B 7.60% 2.95% Full voting rights on 2.95%Others Series D-L 45.86% 19.15% Limited voting rightsSource: FEMSA 2011 20-F

43
ROE COMPONENTS 2011 L12M 2012E 2013E 2014E 2015E 2016EROE 12.0% 11.9% 12.3% 13.4% 14.2% 14.9% 0.0%ROS (Return on Sales) 7.5% 6.3% 7.4% 7.6% 7.6% 7.7% 7.8%Asset Turnover (Sales/Ave. Assets) 0.74 0.64 0.86 0.88 0.91 0.93 0.95Leverage (Assets/Shd. equity) 2.06 1.86 1.83 1.91 1.92 1.93 1.94ROS x Turnover x Leverage 11% 8% 12% 13% 13% 14% 14%
ROS COMPONENTS 2011 L12M 2012E 2013E 2014E 2015E 2016EGross Profit Margin 46.2% 42.4% 41.8% 41.4% 41.9% 41.8% 42.1%General Expense Ratio 28.6% 30.7% 29.8% 29.7% 29.4% 29.1% 28.9%Operating Profit Margin 11.3% 11.8% 11.0% 12.1% 12.5% 12.7% 12.9%Net Financial Expense/Revenues (0.5%) 0.8% 0.7% 0.5% 0.6% 0.7% 0.7%Earnings Bef. Tax Margin 14.0% 12.1% 14.1% 14.5% 14.5% 14.7% 14.9%Return on Sales 7.5% 6.3% 7.4% 7.6% 7.6% 7.7% 7.8%
ASSET TURNOVER COMPONENTS2011 L12M 2012E 2013E 2014E 2015E 2016EAsset Turnover (Sales/Ave. Assets) 0.74 0.64 0.86 0.88 0.91 0.93 0.95Accounts Receivable Turnover 19.3 27.3 20.3 20.3 20.4 20.4 20.5 Inventory Turnover 14.1 11.7 14.8 14.8 14.9 14.9 15.0 Net Fixed Asset Turnover 3.8 3.0 4.0 4.1 4.0 4.0 3.9
LEVERAGE COMPONENTS 2011 L12M 2012E 2013E 2014E 2015E 2016ELeverage (Assets/Shd. equity) 2.06 1.86 1.83 1.91 1.92 1.93 1.94 Debt with cost/Shd. Equity 22% 19% 15% 23% 25% 27% 28%No-cost liab. / Shd equity 40% 32% 33% 32% 32% 31% 31%
ROIC 2011 L12M 2012E 2013E 2014E 2015E 2016EROIC1 29.6% 23.3% 32.2% 33.3% 33.3% 33.3% 33.4%Trading cycle days2 (4) (9) (5) (5) (4) (3) (3)
1) (AR + Inv + Net FA less AP less AE)/ EBIT less 30% tax rate )
2) Accounts Receivable Days on Hand + Inventory DOH less Accounts Payable DOH less Accrued Expenses DOH
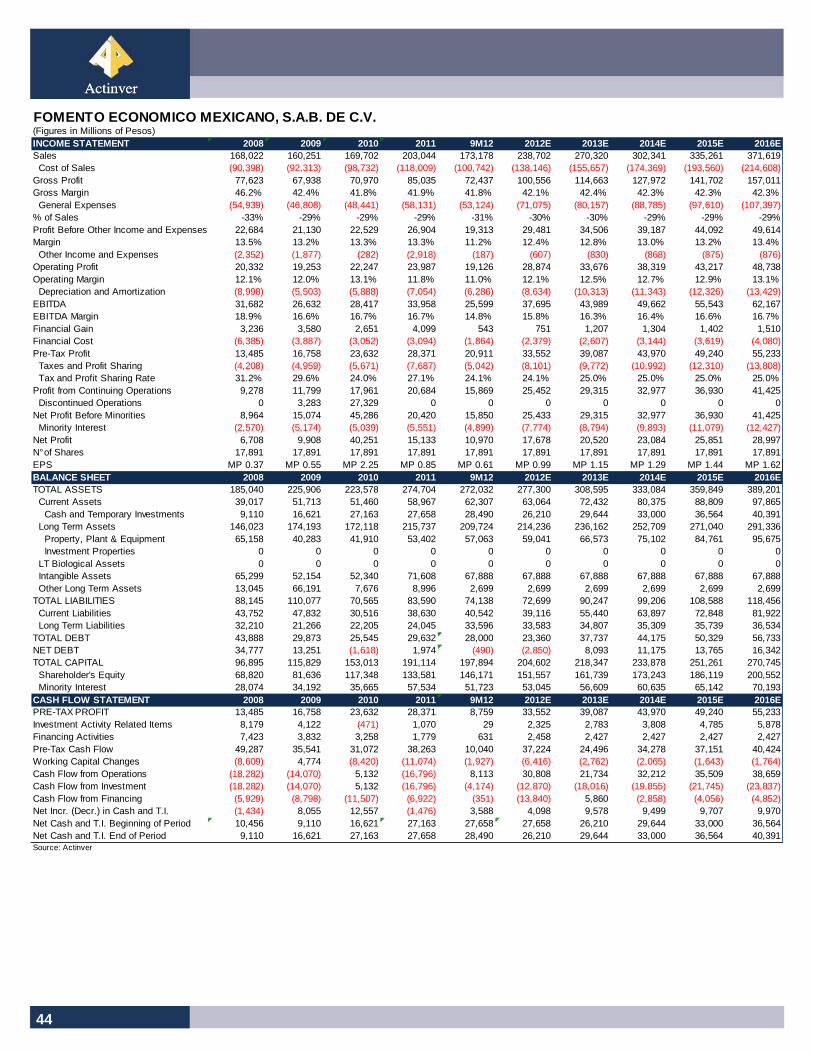
44
FOMENTO ECONOMICO MEXICANO, S.A.B. DE C.V.(Figures in Millions of Pesos)INCOME STATEMENT 2008 2009 2010 2011 9M12 2012E 2013E 2014E 2015E 2016ESales 168,022 160,251 169,702 203,044 173,178 238,702 270,320 302,341 335,261 371,619 Cost of Sales (90,398) (92,313) (98,732) (118,009) (100,742) (138,146) (155,657) (174,369) (193,560) (214,608)Gross Profit 77,623 67,938 70,970 85,035 72,437 100,556 114,663 127,972 141,702 157,011Gross Margin 46.2% 42.4% 41.8% 41.9% 41.8% 42.1% 42.4% 42.3% 42.3% 42.3% General Expenses (54,939) (46,808) (48,441) (58,131) (53,124) (71,075) (80,157) (88,785) (97,610) (107,397)% of Sales -33% -29% -29% -29% -31% -30% -30% -29% -29% -29%Profit Before Other Income and Expenses 22,684 21,130 22,529 26,904 19,313 29,481 34,506 39,187 44,092 49,614Margin 13.5% 13.2% 13.3% 13.3% 11.2% 12.4% 12.8% 13.0% 13.2% 13.4% Other Income and Expenses (2,352) (1,877) (282) (2,918) (187) (607) (830) (868) (875) (876)Operating Profit 20,332 19,253 22,247 23,987 19,126 28,874 33,676 38,319 43,217 48,738Operating Margin 12.1% 12.0% 13.1% 11.8% 11.0% 12.1% 12.5% 12.7% 12.9% 13.1% Depreciation and Amortization (8,998) (5,503) (5,888) (7,054) (6,286) (8,634) (10,313) (11,343) (12,326) (13,429)EBITDA 31,682 26,632 28,417 33,958 25,599 37,695 43,989 49,662 55,543 62,167EBITDA Margin 18.9% 16.6% 16.7% 16.7% 14.8% 15.8% 16.3% 16.4% 16.6% 16.7%Financial Gain 3,236 3,580 2,651 4,099 543 751 1,207 1,304 1,402 1,510Financial Cost (6,385) (3,887) (3,052) (3,094) (1,864) (2,379) (2,607) (3,144) (3,619) (4,080)Pre-Tax Profit 13,485 16,758 23,632 28,371 20,911 33,552 39,087 43,970 49,240 55,233 Taxes and Profit Sharing (4,208) (4,959) (5,671) (7,687) (5,042) (8,101) (9,772) (10,992) (12,310) (13,808) Tax and Profit Sharing Rate 31.2% 29.6% 24.0% 27.1% 24.1% 24.1% 25.0% 25.0% 25.0% 25.0%Profit from Continuing Operations 9,278 11,799 17,961 20,684 15,869 25,452 29,315 32,977 36,930 41,425 Discontinued Operations 0 3,283 27,329 0 0 0 0 0 0 0Net Profit Before Minorities 8,964 15,074 45,286 20,420 15,850 25,433 29,315 32,977 36,930 41,425 Minority Interest (2,570) (5,174) (5,039) (5,551) (4,899) (7,774) (8,794) (9,893) (11,079) (12,427)Net Profit 6,708 9,908 40,251 15,133 10,970 17,678 20,520 23,084 25,851 28,997N° of Shares 17,891 17,891 17,891 17,891 17,891 17,891 17,891 17,891 17,891 17,891EPS MP 0.37 MP 0.55 MP 2.25 MP 0.85 MP 0.61 MP 0.99 MP 1.15 MP 1.29 MP 1.44 MP 1.62BALANCE SHEET 2008 2009 2010 2011 9M12 2012E 2013E 2014E 201 5E 2016ETOTAL ASSETS 185,040 225,906 223,578 274,704 272,032 277,300 308,595 333,084 359,849 389,201 Current Assets 39,017 51,713 51,460 58,967 62,307 63,064 72,432 80,375 88,809 97,865 Cash and Temporary Investments 9,110 16,621 27,163 27,658 28,490 26,210 29,644 33,000 36,564 40,391 Long Term Assets 146,023 174,193 172,118 215,737 209,724 214,236 236,162 252,709 271,040 291,336 Property, Plant & Equipment 65,158 40,283 41,910 53,402 57,063 59,041 66,573 75,102 84,761 95,675 Investment Properties 0 0 0 0 0 0 0 0 0 0 LT Biological Assets 0 0 0 0 0 0 0 0 0 0 Intangible Assets 65,299 52,154 52,340 71,608 67,888 67,888 67,888 67,888 67,888 67,888 Other Long Term Assets 13,045 66,191 7,676 8,996 2,699 2,699 2,699 2,699 2,699 2,699TOTAL LIABILITIES 88,145 110,077 70,565 83,590 74,138 72,699 90,247 99,206 108,588 118,456 Current Liabilities 43,752 47,832 30,516 38,630 40,542 39,116 55,440 63,897 72,848 81,922 Long Term Liabilities 32,210 21,266 22,205 24,045 33,596 33,583 34,807 35,309 35,739 36,534TOTAL DEBT 43,888 29,873 25,545 29,632 28,000 23,360 37,737 44,175 50,329 56,733NET DEBT 34,777 13,251 (1,618) 1,974 (490) (2,850) 8,093 11,175 13,765 16,342TOTAL CAPITAL 96,895 115,829 153,013 191,114 197,894 204,602 218,347 233,878 251,261 270,745 Shareholder's Equity 68,820 81,636 117,348 133,581 146,171 151,557 161,739 173,243 186,119 200,552 Minority Interest 28,074 34,192 35,665 57,534 51,723 53,045 56,609 60,635 65,142 70,193CASH FLOW STATEMENT 2008 2009 2010 2011 9M12 2012E 2013E 20 14E 2015E 2016EPRE-TAX PROFIT 13,485 16,758 23,632 28,371 8,759 33,552 39,087 43,970 49,240 55,233Investment Activity Related Items 8,179 4,122 (471) 1,070 29 2,325 2,783 3,808 4,785 5,878Financing Activities 7,423 3,832 3,258 1,779 631 2,458 2,427 2,427 2,427 2,427Pre-Tax Cash Flow 49,287 35,541 31,072 38,263 10,040 37,224 24,496 34,278 37,151 40,424Working Capital Changes (8,609) 4,774 (8,420) (11,074) (1,927) (6,416) (2,762) (2,065) (1,643) (1,764)Cash Flow from Operations (18,282) (14,070) 5,132 (16,796) 8,113 30,808 21,734 32,212 35,509 38,659Cash Flow from Investment (18,282) (14,070) 5,132 (16,796) (4,174) (12,870) (18,016) (19,855) (21,745) (23,837)Cash Flow from Financing (5,929) (8,798) (11,507) (6,922) (351) (13,840) 5,860 (2,858) (4,056) (4,852)Net Incr. (Decr.) in Cash and T.I. (1,434) 8,055 12,557 (1,476) 3,588 4,098 9,578 9,499 9,707 9,970Net Cash and T.I. Beginning of Period 10,456 9,110 16,621 27,163 27,658 27,658 26,210 29,644 33,000 36,564Net Cash and T.I. End of Period 9,110 16,621 27,163 27,658 28,490 26,210 29,644 33,000 36,564 40,391Source: Actinver

45
Research
Martín Lara Head of Equity Research Telecoms, Media & Financials
(52) 55 1103-6600 x1840
Ramón Ortiz Cement, Concessions & Construction (52) 55 1103-6600 x1841 [email protected]
Toe Matsumura/ Real Estate & Food (52) 55 1103-6600
x1835 [email protected]
Federico Robinson Conglomerates, Industrial & Mining (52) 55 1103-6600 x4127
Gustavo Terán , CFA Beverages & Retail (52) 55 1103-6600 x1193 [email protected]
Michel Gálvez Fixed Income (52) 55 1103 -6641 [email protected]
Jaime Ascencio Economic & Markets (52) 55 1103-6600
x5032 [email protected]
Roberto Galván Technical Analysis (52) 55 1103 -6600 x5039 [email protected]
Investment Strategy
Ernesto O’Farrill Director (52) 55 1103-6645 [email protected]
Sales & Trading
Gerardo Román Head of Trading (52) 55 1103-6690 [email protected]
Julie Roberts US Institutional Sales (210) 298 - 5371 [email protected]
María Antonia Gutiérrez US Institutional Sales (52) 55 1103-6796 [email protected]
Romina Amador US Institutional Sales (52) 55 1103-6710 [email protected]
Tulio Chávez Institutional Sales (52) 55 1103-6762 [email protected]
José María Celorio Institutional Sales (52) 55 1103-6606 [email protected]
Luis Javier Basurto Institutional Sales (52) 55 1103-6742 [email protected]
46
Disclaimer
Analyst Certification for the following Analysts: Martín Lara Toe Matsumura Ramón Ortiz Federico Robinson Gustavo Terán, CFA Michel Gálvez Jaime Ascencio Roberto Galván
The analyst(s) responsible for this report, certifies(y) that the opinion(s) on any of the securities or issuers mentioned in this document, as well as any views or forecasts expressed herein accurately reflect their personal view(s). No part of their compensation was, is or will be directly or indirectly related to the specific recommendation(s) or views contained in this document.
Any of the business units of Grupo Actinver or its affiliates may seek to do business with any company discussed in this research document. Any past or potential future compensation received by Grupo Actinver or any of its affiliates from any issuer mentioned in this report has not had and will not have any effect our analysts’ compensation. However, as for any other employee of Grupo Actinver and its affiliates, our analysts’ compensation is affected by the overall profitability of Grupo Actinver and its affiliates.
Guide to our Rating Methodology Total Expected Return on any security under coverage includes dividends and/or other forms of wealth distribution expected to be implemented by the issuers, in addition to the expected stock price appreciation or depreciation over the next twelve months based on our analysts’ price targets. Analysts uses a wide variety of methods to calculate price targets that, among others, include Discounted Cash Flow models, models based on expected risk-adjusted multiples, Sum-of-Parts valuation techniques, break-up scenarios and relative valuation models.
Changes in our price targets and/or our recommendat ions. Companies under coverage are under constant surveillance and as a result of such surveillance our analysts update their models resulting in potential changes to their price targets. Changes in general business conditions potentially affecting either the cost of capital and/or growth prospects of all companies under coverage, or a given industry, or a group of industries are typical triggers for revisions to our price targets and/or recommendations. Other micro- and macroeconomic events could materially affect the overall prospects of an individual company under coverage and, as a result, such event-driven factors could lead to changes in our price targets and/or recommendation of the company affected. Even if our overall expectations for a given company under coverage have not materially changed, our recommendations are subject to revision if the stock price has changed significantly, as it will affect total expected return.
Terms such as "price targets, our price targets, total expected return, analyst's price targets” or any other similar phrase are used in this document as complementary to our recommendation or as a condition that could change in our point of view and, according to article 188 of Securities Market Act, do not imply in any way that Actinver, its agents, or its related companies are in any form providing assurance or guarantee, nor assuming any responsibility for the risks associated with any investment in the discussed securities.
Recommendations for companies, both in the Índice d e Precios y Cotizaciones (IPyC) Index and also not belonging to the index. We have three possible recommendations: a) BUY, b) HOLD or c) SELL. A stock classified as BUY is expected to yield at least 15% within the next 12 months. A stock rated as HOLD are expected to yield between 5% and 14% within the next 12 months. A stock rated as SELL is expected to yield less than 5% within the next 12 months.
Rating Distribution as of January 11, 2013
BUY: 58%
HOLD: 26%
SELL: 16%