Embed Size (px)
Citation preview

Element Energy Ltd
Bottom-up analysis of fuel poverty in Ireland
DCENR
For your comments and questions:
20th November 2015
Final report

2
Contents
• Fuel poverty definition
• Description of approach
• Results
• Caveats and potential refinements
• Appendices

3
Fuel poverty definitions
*Reported difficulty in warming the home adequately and/or going without heating for some part of the year.
**i.e. that which would need to be spent to maintain certain standard internal conditions
We use the ‘objective’ measure in this presentation
• In this project we use the ‘objective’ measure of fuel poverty.
• The objective definition allows measurement of:
• the ‘extent’ of fuel poverty, i.e. how many households are in fuel poverty;
• the ‘severity’ of fuel poverty, i.e. how much of a household’s income is required to be spent on fuel.
• In the objective definition, a threshold of percentage income required to spend on fuel is typically set; households above this threshold are said to be in fuel poverty.
• We will use three thresholds: 10%, 15% and 20%, and calculate the number of households in fuel poverty (the ‘extent’).
• We will also report on the ‘severity’ of fuel poverty.
Fuel poverty measure Method Previous study in Ireland? Reference
1. Actual expenditure Compare fuel expenditure to household income Yes Scott et al (ESRI, 2008)
2. Subjective Occupant self-reported methodology* Yes Scott et al (ESRI, 2008) DCENR (2009) Watson & Maitre (2015)
3. Objective Compare normative fuel expenditure** to household income
Not to our knowledge This study

4
Definitions
Required energy spend fraction: 100 x 𝑚𝑜𝑑𝑒𝑙𝑙𝑒𝑑 𝑓𝑢𝑒𝑙 𝑒𝑥𝑝𝑒𝑛𝑑𝑖𝑡𝑢𝑟𝑒
𝑖𝑛𝑐𝑜𝑚𝑒
At-risk group: Households whose Required energy spend fraction exceeds a defined threshold
Prevalence of fuel poverty: The percentage of households in a particular category (e.g. living in detached houses) whose Required energy spend fraction exceeds the defined threshold
5
Contents
• Fuel poverty definition
• Description of approach
• Results
• Caveats and potential refinements
• Appendices

6
Irish households were disaggregated into groups by six core variables
Each group represents a combination of six ‘core variables’
• Location
• Dwelling type
• Main heating fuel
• BER rating
• Tenure
• Employment type
Kildare
Terraced house
Oil
D1-D2
Private rented sector
Self-employed
Core variables Example group Output of analysis
Required energy spend fraction
The aim was to be able to identify likely segments of the population in which fuel poverty is prevalent.
The results in this presentation are given in terms of the fuel poverty metric (% or number of households in fuel poverty) by one core variable at a time.
The model used to derive these results could also be used to estimate prevalence of fuel poverty by two variables, for example tenure and employment.
7
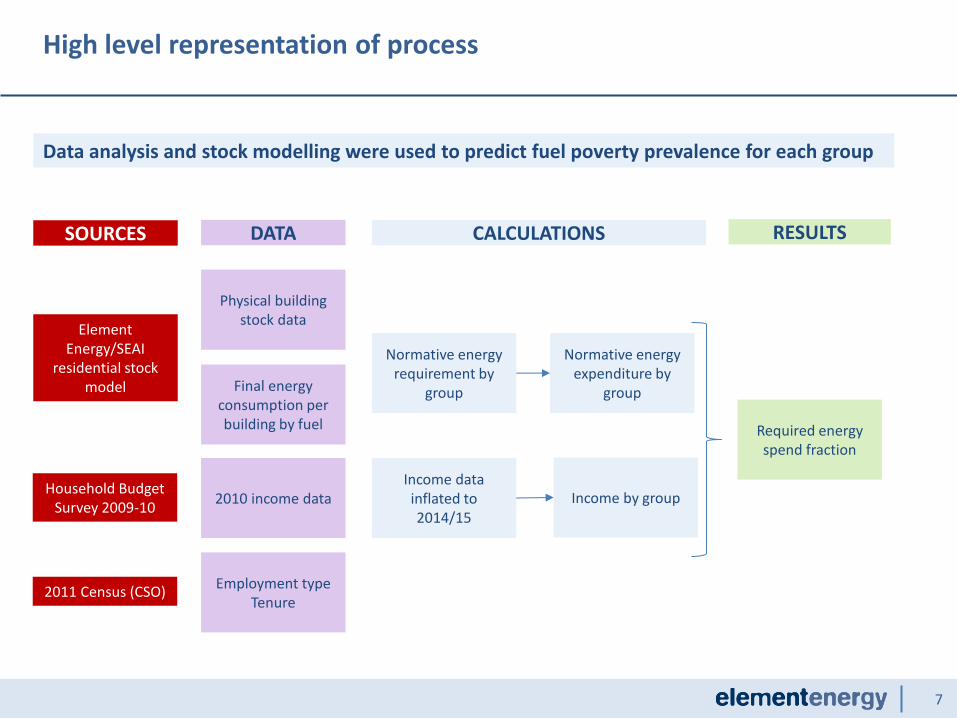
High level representation of process
Data analysis and stock modelling were used to predict fuel poverty prevalence for each group
Normative energy expenditure by
group
Normative energy requirement by
group
Income by group
Required energy spend fraction
Final energy consumption per building by fuel
Physical building stock data
2010 income data
Employment type Tenure
SOURCES CALCULATIONS RESULTS
Element Energy/SEAI
residential stock model
DATA
Household Budget Survey 2009-10
2011 Census (CSO)
Income data inflated to 2014/15

8
Contents
• Fuel poverty definition
• Description of approach
• Results
• Caveats and potential refinements
• Appendices

9
Overall results for Ireland
Distribution of Required energy spend fraction
0
50,000
100,000
150,000
200,000
250,000
20
%
25
%
15
%
10
%
35
%
30
%
Required energy spend fraction
45
%
Number of households in Ireland
50
%
5%
0%
40
%

10
Overall results for Ireland: prevalence of fuel poverty using different thresholds
Metric Threshold
10% 15% 20%
Number of households in fuel poverty
461,000 133,000 42,000
% households in fuel poverty
28% 8% 3%
42,000
133,000
461,000
20% threshold 10% threshold 15% threshold 10% threshold
28%
8%
20% threshold 15% threshold
3%
• Using the 10% threshold, more than one-fourth of Irish households are in fuel poverty.
• The next slides show how this number varies with the six core variables introduced earlier.
Number of households in fuel poverty Percentage of households in fuel poverty

11
Fuel poverty by location
Percentage of households in each location in fuel poverty
0
10
20
30
40
50
Percentage of households in fuel poverty
Ulster Rest of Connacht
Other Munster
Other Leinster
Galway (City and County)
Cork County
Limerick (City and County)
Cork City Kildare Dublin County
Dublin City
20% threshold
10% threshold
15% threshold • Ulster has the highest rate of fuel poverty, at 50% under the 10% threshold.

12
Fuel poverty by location
Number of households in fuel poverty
0
20,000
40,000
60,000
80,000
100,000
120,000
140,000
Other Leinster
Other Munster
Ulster Galway (City and County)
Dublin City
Cork City Limerick (City and County)
Rest of Connacht
Kildare Dublin County
Cork County
Number of households in fuel poverty
20% threshold
10% threshold
15% threshold • This graph reflects the greater number of households overall in Leinster, as
opposed to necessarily showing a high occurrence of fuel poverty.

13
Fuel poverty by tenure
Percentage of households of each tenure in fuel poverty
0
10
20
30
40
50
60
70
Private rented Social rented Owner (including with mortgage or loan)
Percentage of households in fuel poverty
15% threshold
10% threshold
20% threshold
• Social housing has a very high prevalence of fuel poverty according to the objective measure (almost 70%).
• Within the at-risk group in the social housing category, the average Required energy spend fraction is 17%.

14
Fuel poverty by tenure
Number of households in fuel poverty
0
50,000
100,000
150,000
200,000
250,000
300,000
Owner (including with mortgage or loan)
Private rented Social rented
Number of households in fuel poverty
10% threshold
20% threshold
15% threshold
• Although the highest prevalence is found in the social rented category, the highest number of households in fuel poverty is found in the Owner category.
• This indicates that if only the social rented category is targeted, the majority of households in fuel poverty would be missed.

15
Fuel poverty by main heating fuel
Percentage of households using each fuel type in fuel poverty
0
10
20
30
40
50
Solid Oil including LPG Natural Gas
Percentage of group in fuel poverty
Electricity
20% threshold
10% threshold
15% threshold
• Oil heated dwellings have the highest prevalence of fuel poverty.
• The highest average Required energy spend fraction within the at-risk group is found in oil heated dwellings, at 15%.

16
Fuel poverty by main heating fuel
Number of households in fuel poverty
0
50,000
100,000
150,000
200,000
250,000
300,000
350,000
Natural Gas Solid Oil including LPG Electricity
Number of households in fuel poverty
15% threshold
10% threshold
20% threshold
• Oil heated dwellings also dominate under the ‘number of households in fuel poverty’ metric

17
Fuel poverty by dwelling type
Percentage of households from each dwelling type in fuel poverty
0
10
20
30
40
50
Percentage of households in fuel poverty
Flat/apartment Terraced house Semi-detached house
Detached house
10% threshold
15% threshold
20% threshold
• Using the 10% threshold, households in detached houses have about twice the prevalence of fuel poverty than other households.

18
Fuel poverty by dwelling type
Number of households in fuel poverty
0
50,000
100,000
150,000
200,000
250,000
300,000
Semi-detached house
Flat/apartment Detached house Terraced house
Number of households in fuel poverty
15% threshold
10% threshold
20% threshold
• Detached houses are also the dwelling type with the highest number of households in fuel poverty

19
Fuel poverty by BER rating
Percentage of households from dwellings of each BER category in fuel poverty
0
5
10
15
20
25
30
35
40
45
50
C2-C3 B3-C1 A1-B2 D1-D2
Percentage of households in fuel poverty
E1-E2 G F
20% threshold
15% threshold
10% threshold
• BER rating has a strong effect on prevalence of fuel poverty.

20
Fuel poverty by BER rating
Number of households in fuel poverty
0
20,000
40,000
60,000
80,000
100,000
120,000
F A1-B2 E1-E2 C2-C3 B3-C1 D1-D2 G
Number of households in fuel poverty
20% threshold
10% threshold
15% threshold
• D1-D2 and G are the largest categories within the dwelling stock

21
Fuel poverty by employment type
Percentage of households of each employment type in fuel poverty
0
10
20
30
40
50
60
70
Unemployed Employee Self Employed Retired
Percentage of households in fuel poverty
Other not in labour force
20% threshold
15% threshold
10% threshold
• Unemployed and retired households have a high prevalence of fuel poverty.
• However, the largest category in percentage terms is ‘Other not in labour force’ employment type.
• This refers to the sum of households where the reference person is:
Looking after someone at home
A student/pupil
Unable to work due to permanent sickness/disability
Looking for first regular job
Aged 15 or under, or absent on census night
• The Household Budget Survey reports that this ‘Other’ category has the lowest average income of all the categories, which is why its extent of fuel poverty is high.

22
Fuel poverty by employment type
Number of households of each employment type in fuel poverty
0
20,000
40,000
60,000
80,000
100,000
120,000
140,000
160,000
180,000
Self Employed Other not in labour force
Unemployed Employee Retired
Number of households in fuel poverty
20% threshold
10% threshold
15% threshold
• Note that the ‘Other not in labour force’ category also has a large number of households in fuel poverty.
23
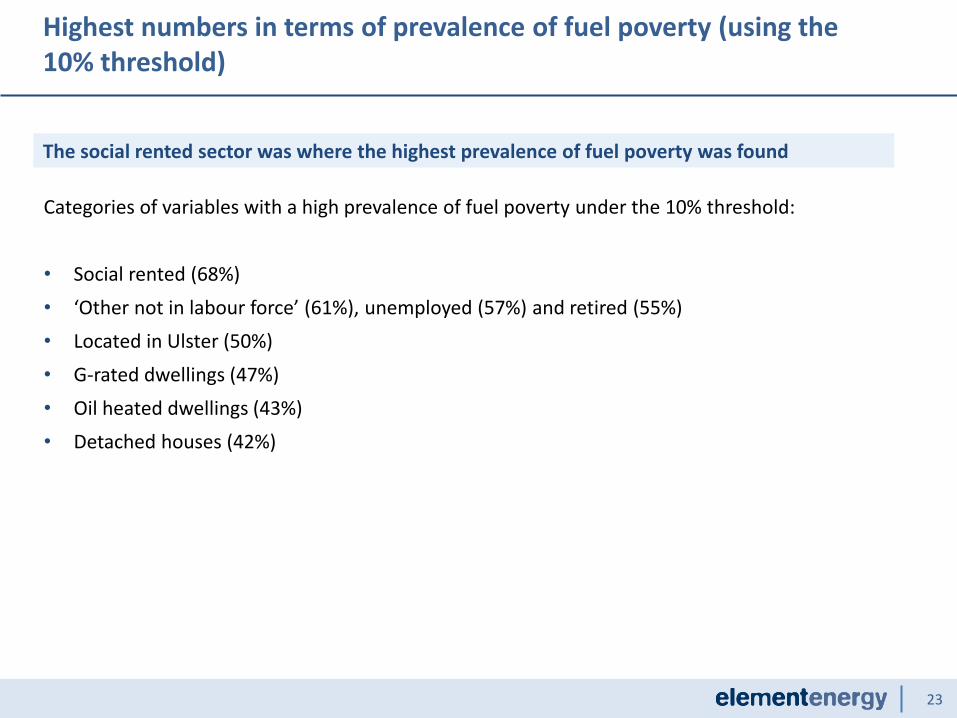
Highest numbers in terms of prevalence of fuel poverty (using the 10% threshold)
Categories of variables with a high prevalence of fuel poverty under the 10% threshold:
• Social rented (68%)
• ‘Other not in labour force’ (61%), unemployed (57%) and retired (55%)
• Located in Ulster (50%)
• G-rated dwellings (47%)
• Oil heated dwellings (43%)
• Detached houses (42%)
The social rented sector was where the highest prevalence of fuel poverty was found

24
Contents
• Fuel poverty definition
• Description of approach
• Results
• Caveats and potential refinements
• Appendices

25
Refinements possible to improve analysis
• Currently, the income data is as follows:
Income by tenure
Income by location
Income by employment type
• We do not currently have data for the individual combinations of income by tenure and location and employment type. The income of these individual combinations was estimated by applying distributions for tenure, location and employment subsequently.
• Obtaining access to the microdata from the 2009-10 Household Budget Survey would enable data to directly be used for these individual combinations.
• Secondly, it would be beneficial to obtain data on income by dwelling type, BER rating and main heating fuel (the three of the six core variables for which we do not currently have income data).
• This would allow us to observe, for example, the extent to which detached houses are occupied by either more wealthy households or poorer ones. Currently, indirect correlations are captured by variables such as employment status, which are not 100% correlated to income.
• Finally, a distribution of incomes could be used instead of the average per group. Currently, all of the households within one group are either in fuel poverty or not; in reality, their differing incomes would spread them out over both sides of the boundary.
Higher resolution income data would improve the accuracy of the analysis
26
Contents
• Fuel poverty definition
• Description of approach
• Results
• Caveats and potential refinements
• Appendices

27
Appendix 1: Variables used from each data source
Data source Variable
BER register
BER rating by dwelling type
BER rating by main heating fuel
BER rating by location
Household budget survey 2009-2010 (inflated to 2014/15)
Income by tenure
Income by employment type
Income by region
2011 Census (CSO)
Number of households by location
Number of households by dwelling type
Number of households by main heating fuel
Number of households by employment type
Number of households by tenure
Income by county
Element Energy/SEAI residential building stock model Final energy demand of dwelling archetypes, by fuel type

28
Appendix 2: Fuel price data used
€/kWh 2015 2016 2017 2018 2019 2020 2021 2022 2023 2024 2025 2026 2027 2028 2029 2030
Electricity (heating) 0.11 0.11 0.11 0.11 0.11 0.11 0.12 0.12 0.12 0.12 0.12 0.13 0.13 0.13 0.13 0.14
Electricity (non-heating)
0.28 0.29 0.29 0.30 0.30 0.30 0.31 0.31 0.32 0.32 0.33 0.33 0.34 0.35 0.35 0.36
Oil (including LPG) 0.12 0.12 0.12 0.12 0.12 0.12 0.12 0.12 0.12 0.12 0.12 0.13 0.13 0.13 0.13 0.13
Natural gas 0.09 0.09 0.09 0.09 0.09 0.09 0.09 0.09 0.09 0.09 0.09 0.09 0.09 0.09 0.09 0.09
Solid fuel 0.06 0.06 0.06 0.06 0.06 0.06 0.06 0.06 0.06 0.06 0.06 0.06 0.06 0.06 0.06 0.06
Note: The year 2015 was used for all of the analysis in this report; subsequent years given for info.

29
Appendix 3: Comparison of results to other fuel poverty definitions
Fuel poverty measure Method Result Reference
1. Actual expenditure Compare fuel expenditure to household income
19.4% of households in fuel poverty in 2008 Scott et al (ESRI, 2008)
2. Subjective Occupant self-reported difficulty to a) keep the home adequately warm and/or b) self-reported going without heating for some part of the year
8.1% of households reporting a) or b) 2006 7.3% of households reporting b) in 2009 21.2% of households reporting a) or b) or arrears in 2011
Scott et al (ESRI, 2008) DCENR (2009) Watson & Maitre (2015)
3. Objective
Compare normative fuel expenditure (i.e. that which would need to be spent to maintain certain standard internal conditions) to household income
30% of households in fuel poverty