Embed Size (px)
Citation preview

Ilmenauer Beiträge zur Wirtschaftsinformatik
Herausgegeben von U. Bankhofer, V. Nissen D. Stelzer und S. Straßburger
Volker Nissen, Danilo Saft
Bottom-Up Simulation of a Stock Market Using a Thousand Fuzzy Agents
Working Paper 2009-01, February 2009
Technische Universität Ilmenau Fakultät für Wirtschaftswissenschaften Institut für Wirtschaftsinformatik

- i -
Autor: Volker Nissen, Danilo Saft
Titel: Bottom-Up Simulation of a Stock Market Using a Thousand Fuzzy Agents
Ilmenauer Beiträge zur Wirtschaftsinformatik (Working Paper) 2009-01, Technische Universität Ilmenau, February 2009
ISSN 1861-9223
ISBN 978-3-938940-22-8
URN urn:nbn:de:gbv:ilm1-2009200057
© 2009 Institut für Wirtschaftsinformatik, TU Ilmenau
Anschrift: Technische Universität Ilmenau, Fakultät für Wirtschaftswissenschaften, Institut für Wirtschaftsinformatik, PF 100565, D-98684 Ilmenau.
http://www.tu-ilmenau.de/fakww/Ilmenauer_Beitraege.1546.0.html

Bottom-up simulation of a stock market using a thousand fuzzy agents Volker Nissen, Danilo Saft
— ii —
Table of Contents
List of Figures.......................................................................................................................iii
1 Introduction ................................................................................................................... 2
2 Swarms and Stock Markets ........................................................................................... 3
3 A Bottom-Up Simulation of a Stock Market................................................................. 4
3.1 Structure of a Fuzzy Trader Agent ........................................................................ 4
3.2 Further Model Details at the Microscopic Level................................................... 7
3.3 Simulation at the Macroscopic Level .................................................................... 9
4 Experiments with the Bottom-Up Simulation ............................................................. 11
4.1 Experiment 1 ....................................................................................................... 11
4.2 Experiment 2 ....................................................................................................... 13
4.3 Experiment 3 ....................................................................................................... 15
5 Conclusion and Future Work....................................................................................... 16
References ........................................................................................................................... 18

Bottom-up simulation of a stock market using a thousand fuzzy agents Volker Nissen, Danilo Saft
— iii —
List of Figures
Fig. 1 Structure of a fuzzy trader agent. Crisp information on price level and the trend in
prices is the input while a decision to buy, hold or sell a certain amount of stock is the
output after some fuzzy inference process that uses fuzzy rules from the agent’s
knowledge base. ............................................................................................................ 5
Fig. 2 Fuzzy Inference Mechanism (Fuzzy Control Logic). ................................................. 6
Fig. 3 Fuzzy sets (linguistic terms) for input and output variables of fuzzy trader agents.... 7
Table 1. Rule base of fuzzy trader agent (rules identical for all agents). ............................. 8
Fig. 4 Results with behavioural agent diversification d = 0.1 (low), trading in each period
and s-value expectations of 10% (a), 20% (b), 30% (c) and 50% (d) of simulation
periods. The curves display stock price kt over time during a complete simulation run.
..................................................................................................................................... 12
Fig. 5 Results for s-value expectation of 50% and behavioural agent diversification d = 0.1
(a) and d = 0.5 (b). Rest of parameters as in figure 4. ................................................. 12
Fig. 6 Results for s-value expectation of 50% with a standard deviation of 10% (a) and
30% (b). Rest of parameters as in figure 4. ................................................................. 13
Fig. 7 Results with behavioural agent diversification d = 0.1 , trading in each period and s-
value expectation of 10% (a) and 50% (b), standard deviation of s is zero. The curves
again display the stock price kt over time during a complete simulation run.............. 14
Fig. 8 Results for behavioural agent diversification d = 0.1, trading in each period and s-
value expectation of 10% with a standard deviation of 20% (a) and 30% (b). ........... 14
Fig. 9 Results for behavioural agent diversification d = 0.3 , trading frequency of 20% with
a standard deviation of zero, an s-value expectation of 30% with a standard deviation
of zero. The price level calculation is as in section 4.2. .............................................. 15
Fig. 10 Results for behavioural agent diversification d = 0.5 (high), a trading frequency of
0% with a standard deviation of 10%, an s-value expectation of 10% with a standard
deviation of 30% (a) and 40% (b). The price level calculation is as in section 4.2. ... 16

Bottom-up simulation of a stock market using a thousand fuzzy agents Volker Nissen, Danilo Saft
— 1 —
Abstract: In this research the focus is on emergent behaviour in large groups of stock market participants. In contrast to established views of the capital market, we do not assume that market participants make rational investment decisions based on full information about important macroeconomic figures such as interest or exchange rates. Nor is the market modelled top-down with mathematical equations. Instead, trading decisions and market behaviour are the result of individual participants reacting to stock price and price changes. Each participant is modelled as a fuzzy agent that behaves according to simple trading rules. This is sufficient to create regular and complex macroscopic stock price patterns.
Key words: simulation, stock market, fuzzy agent, swarms, emergence

Bottom-up simulation of a stock market using a thousand fuzzy agents Volker Nissen, Danilo Saft
— 2 —
1 Introduction
Traditional models of financial markets take a macroscopic perspective, modelling market
behaviour with mathematical equations. The underlying assumption in the classical case is
the efficient market hypothesis (EMH), which suggests that all relevant information is
instantly available to all market participants, who then make well-informed, rational
decisions about their investments. From this, market price is a result of the distribution of
expectations in the market regarding future yield [1]. Frequently, a normal distribution of
these expectations is assumed and only random influence can lead to a short-term above-
average performance of individual market participants. As a result stock prices display a
random path, and it becomes impossible to forecast future prices (Random Walk Theory)
[2].
Reality is apparently different. Empirical studies have confirmed correlations between
historic and current price levels for stocks [3]. Moreover, results in fractal mathematics
have underlined that the random walk theory does not apply and structures can be found in
stock price graphs [1] [4]. The question arises of how financial markets can be modelled
more adequately.
More recent models, such as the synergetic capital market model from Landes/Loistl [15],
support our way of thinking that a micro-level examination of the entities and processes in
share trading is required. However, the synergetic capital market model is quite complex in
order to create the most realistic depiction possible of the macroscopic “capital market”
system [cf. 15, especially pp. 319 – 345]. Moreover, fundamental influences on markets
play an important role, which is not the assumption underlying our work.
In this paper we argue for a bottom-up model that focuses on individual market
participants and draws a remote parallel to biological swarms. The general assumption here
is that at least the (very large number of) non-commercial private traders act more like
members of a herd rather than analyzing fundamental influences on the market (such as
changes in interest rates or economic climate) to arrive at their trading decisions. Market
behaviour then arises as an emergent phenomenon at the macroscopic level. The research
goal we pursue is to increase our understanding of the relationship between simple, swarm-
like individual trading behaviour and its macroscopic effects at the market level.
Bottom-up simulation of a stock market using a thousand fuzzy agents Volker Nissen, Danilo Saft
— 3 —
Section 2 gives a short introduction to concepts central to our research such as swarms and
emergent behaviour. In section 3 the experimental setting is highlighted. Section 4 includes
experimental results and their interpretation. We conclude with lessons learned and
implications for future research in section 5.
2 Swarms and Stock Markets
Many animals in nature, such as birds, fish and ants, operate in swarms, i.e. they form large
groups of individuals that display coordinated movements. While the animals themselves
are quite limited in their abilities and the rules of coordination are simple, complex swarm
behaviour can be generated at the macroscopic level since each individual generates an
indirect force on all other individuals and is itself under multiple influences from other
swarm members.
This effect may be associated with what has been called “relative emergence” [9], meaning
that with current knowledge and techniques, it is impossible to deduce the macroscopic
behaviour of a system from an analysis of its components and microstructure.1
Swarms have recently received much attention in the context of artificial life and artificial
intelligence [5] [6] [7] [8] due to the emergent behaviour they display. Robustness and the
ability for self-organisation are important characteristics of swarms. These features make
artificial swarm-like systems interesting for practical applications, where autonomy and
fault tolerance are important themes, such as in multi-agent systems research. Moreover,
swarms may be seen as an example for bottom-up simulations that model real systems not
at the macroscopic level using mathematical equations but focus on the microscopic parts
of the system, their characteristics and microstructure. This is the view on stock markets
adopted in this paper. It is, in fact, typical for agent-based computational economics [14]
[16] [17]. For an overview of agent-based models of financial markets see [18].
We take up the position of Schleis [10], who describes the population of stock market
participants as a social being in its own right, whose members influence and control each
other particularly through the pricing mechanism. Combining this viewpoint with the idea
of a bottom-up market model as discussed in [15], one arrives naturally at the research goal

Bottom-up simulation of a stock market using a thousand fuzzy agents Volker Nissen, Danilo Saft
— 4 —
to construct a micro-level model of a capital market containing a large number of trader
entities with simple behaviour, influencing each other indirectly through their trading
decisions and the resulting stock price level. Our focus is on the relationship between
individual trading behaviour and macroscopic stock price movements. It is important to
underline that we do not aim to forecast stock prices nor do we attempt to generate the
exact historical curve of a particular stock. The goal pursued here is more moderate. By
concentrating on market participants (trader agents) and their simple swarm-like
behaviour, thus modelling a stock market from the bottom up, the aim is to generate
complex system behaviour in the sense that stock price patterns are created that resemble
those of real stock markets. We believe it is unnecessary to assume the typical BDI-agents
and complex reasoning and cooperation processes of multi-agent simulations to achieve
this goal. This, however, would give a hint that trading decisions in real markets are often
taken in a much simpler fashion than is commonly thought. We further believe it is not
required to assume external market forces or changes of fundamental data to create major
changes of stock prices. If this was so, then forecasting stock market developments would
be proven a hopeless task.
So, while design decisions and parameterisations are only concerned with the micro-level
of trader agents, the focus of interest is the results at the macroscopic level of stock prices
and their connection with the micro-level.
3 A Bottom-Up Simulation of a Stock Market
3.1 Structure of a Fuzzy Trader Agent
Our stock market is populated by a large number of simple trader agents that buy and sell a
single stock. 1000 agents are employed in the simulation. This quantity was determined
empirically during initial test runs. It is sufficiently large to achieve a well-distributed
diversity in the agent population, but also avoids very excessive computational runtime
requirements.
A basic assumption is that market participants do not perform complex analyses of
macroeconomic figures before they act. Rather, they evaluate stock price and the trend in
1 This, however, does not exclude its being possible in the future. Practically speaking, it may suffice that the analysis would be extremely complex and time-consuming at present.

Bottom-up simulation of a stock market using a thousand fuzzy agents Volker Nissen, Danilo Saft
— 5 —
prices over some period of time and then decide whether to trade based on simple rules.2
Market participants are modelled as stimulus-response agents. They receive information
and react immediately, based on behaviour that is coded in a fuzzy rule base and inference
mechanism. Figure 1 gives the structure of a trader agent, which is essentially the structure
of a Mamdani-style technical fuzzy controller.
Crisp (not fuzzy) input information (price level, trend in prices) is fuzzyficated, i.e.
mapped on fuzzy sets. This allows the compatibility of the inputs (facts) with the
conditions of rules in the knowledge base. The result is in each case a real number in the
interval [0,1]. For each rule, the compatibility results of individual conditions are
aggregated to an overall compatibility for the condition part of the rule. A rule is activated
when its condition part is fulfilled to an extent greater than zero. Several rules may be
activated in parallel.
Wissensbasis(Expertenregeln)
Fuzzyfizierung Entscheidungs-logik Defuzzyfizierung
fuzzy fuzzy
Systemnot
fuzz
y
knowledge base(fuzzy rules)
fuzzyfication fuzzy inferencemechanism defuzzyfication
fuzzy fuzzy
tradingdecision
price level,price trend
not
fuzz
y
stock market(environment)
Fuzzy Trader Agent
Fig. 1 Structure of a fuzzy trader agent. Crisp information on price level and the trend in prices is the input while a decision to buy, hold or sell a certain amount of stock is the output after some fuzzy inference process that uses fuzzy rules from the agent’s knowledge base.
2 Agents could also make use of trading volume information, but for the experiments here we abstract from volume figures, as the fundamental principles of trading remain the same.

Bottom-up simulation of a stock market using a thousand fuzzy agents Volker Nissen, Danilo Saft
— 6 —
A fuzzy inference mechanism then maps the input to the output variables of the fuzzy
trader agent by simple feedforward reasoning. We have chosen the well-established max-
min inference to arrive at the fuzzy output results.3 In a last step, the fuzzy output set
concerning the trading decision (buy, hold, sell) is converted to a crisp decision by
applying standard centre-of-gravity defuzzyfication. The direction and the amount of the
trading are fully determined through the defuzzyficated output. Figure 2 demonstrates the
principle mechanism of fuzzy inference using two input values and one output value.
Fig. 2 Fuzzy Inference Mechanism (Fuzzy Control Logic).
Using fuzzy set theory to model the trader agents has several advantages. First, fuzzy rules
offer a simple yet elegant way to explicitly code human knowledge. Second, only a few
rules suffice to generate sensible agent response in all relevant contexts of our model.
3 For more details on fuzzy set theory and fuzzy control, see for instance [12] [13].
Bottom-up simulation of a stock market using a thousand fuzzy agents Volker Nissen, Danilo Saft
— 7 —
Third, fuzzy systems are generally robust and display smooth behaviour patterns in
dynamic environments [11]. Fourth, the behaviour of agents can be changed individually
by adapting fuzzy sets or rules in the knowledge base.
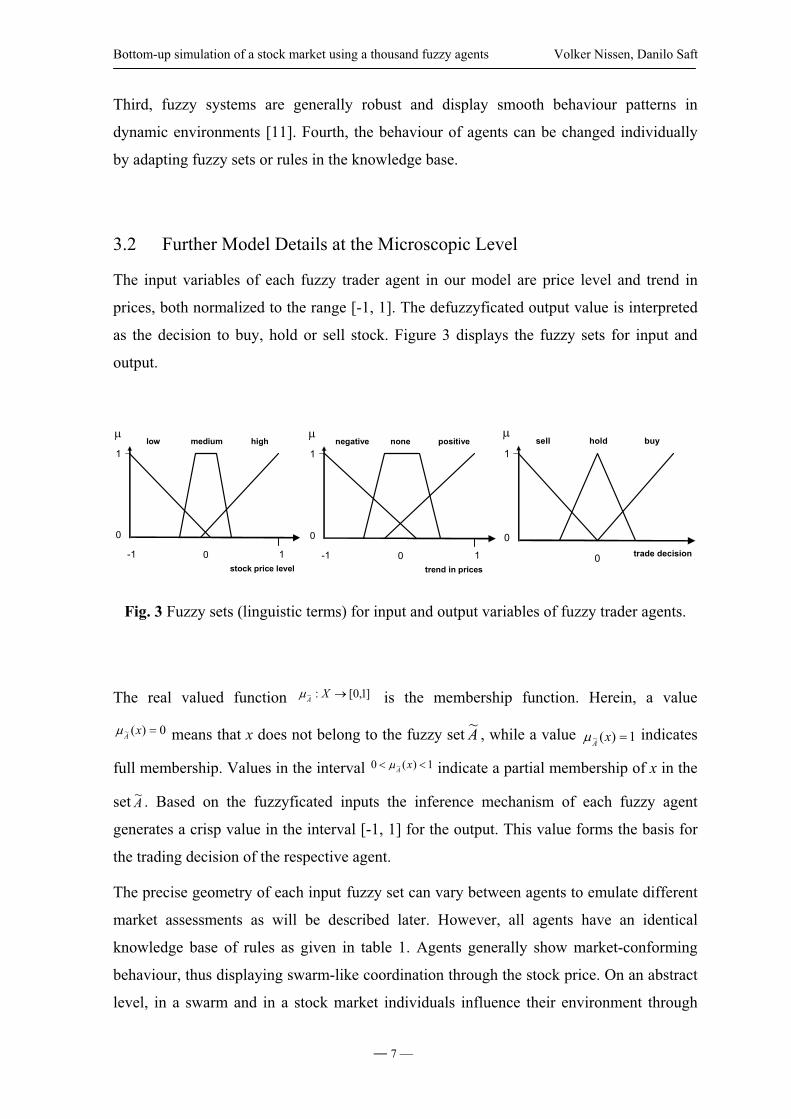
3.2 Further Model Details at the Microscopic Level
The input variables of each fuzzy trader agent in our model are price level and trend in
prices, both normalized to the range [-1, 1]. The defuzzyficated output value is interpreted
as the decision to buy, hold or sell stock. Figure 3 displays the fuzzy sets for input and
output.
1
0
sell hold buy
trade decision0
1
0
negative none positive
-1 1trend in prices
0
1
0
low medium high
-1 1stock price level
0
Fig. 3 Fuzzy sets (linguistic terms) for input and output variables of fuzzy trader agents.
The real valued function ]1,0[:~ XA is the membership function. Herein, a value
0)(~ xA means that x does not belong to the fuzzy set A~ , while a value 1)(~ xAindicates
full membership. Values in the interval 1)(0 ~ xA indicate a partial membership of x in the
set A~ . Based on the fuzzyficated inputs the inference mechanism of each fuzzy agent
generates a crisp value in the interval [-1, 1] for the output. This value forms the basis for
the trading decision of the respective agent.
The precise geometry of each input fuzzy set can vary between agents to emulate different
market assessments as will be described later. However, all agents have an identical
knowledge base of rules as given in table 1. Agents generally show market-conforming
behaviour, thus displaying swarm-like coordination through the stock price. On an abstract
level, in a swarm and in a stock market individuals influence their environment through

Bottom-up simulation of a stock market using a thousand fuzzy agents Volker Nissen, Danilo Saft
— 8 —
individual actions while in the next step the environment feeds information back to them
and influences their next actions.
IF Price AND Trend in Prices THEN Trade Decision
low Negative buy
medium Negative sell
high Negative sell
low None hold
medium None hold
high None hold
low Positive buy
medium Positive buy
high Positive sell
Table 1. Rule base of fuzzy trader agent (rules identical for all agents).
This is in accordance with empirical studies about human behaviour in complex, non-linear
systems where test subjects frequently followed an ad-hoc hypothesis of linear trend [1,
pp.126]. Moreover, Schleis argues from a psychological position that crowds of people
tend to display self-enforcing feedback processes of euphoria or panic [10, pp.29]. In
general, the stock boom and subsequent crash at the turn of the century supports his
argument.
A trader will only change his trading decision against the current market trend when new
information with sufficient intensity is available that indicates a probable change in the
stock price pattern. So, when the trend in prices is still positive but the price level is
considered “high” by the agent, it will start selling. Contrary, it will start buying when the
trend in prices is still negative but the price level is already considered “low”.
It is assumed that trading is always possible. This is, of course, a simplification over the
real stock market where limits, such as stop-loss, play an important role and one might not
be able to sell stock at a given time because of a lack of demand. However, such additional
constraints would only complicate the model without adding value to pursuing our current
research goals.

Bottom-up simulation of a stock market using a thousand fuzzy agents Volker Nissen, Danilo Saft
— 9 —
No central market maker is employed in our model who decides about the stock price.
However, the basic market mechanism is present, i.e. the stock price will change in
proportion to direction and volume of the overall trading decisions of all agents in the
market.
3.3 Simulation at the Macroscopic Level
The stock market simulation is processed in discrete time steps. These steps are
conceptually comparable to the regular time interval for the price determination in real
stock markets. For example, this price determination happens every second for the
Deutsche Aktienindex DAX. At the macroscopic level, the inputs (price level, trend in
prices) for all agents are calculated, using the current status of the stock market system and
the outputs (trading decisions) of the agents. The trend in prices k of trading cycle t is
calculated at
sellt
buyt
sellt
buyt
t MMMMk
(1)
where buytM is the total trade volume of stock bought in period t while sell
tM is the total
trade volume sold in period t. At this stage, we relax the requirement that both volumes
must be identical, thus avoiding the necessity for bookkeeping of individual stock volumes
for one thousand trade agents. Instead, we assume some trading institution as part of the
market that is always prepared to buy and sell stock at the current price in the required
amount. This simplifying assumption will be removed in future research, while it currently
helps to focus on the aspects of interest. It should be noted that in real markets such
asynchronous trade situations can indeed occur, for instance in the case of short sales by
hedge funds. The initial k0 is set to the value of zero (neutral). The stock price kt at the
end of trading period t is then given as
11 ttt kkk (2)
The calculation of the relevant stock price level pt as one of the input variables for the
trading agents varies between the different simulation experiments. However, it is not
identical to the stock price kt-1 at the end of the previous trading period. Instead, agents

Bottom-up simulation of a stock market using a thousand fuzzy agents Volker Nissen, Danilo Saft
— 10 —
individually calculate an average price over some historic period and use this in their
trading decision. The length of this historic period s is a random variable that is determined
independently once for each agent at the start of the simulation, just as individual traders in
real markets take individual perspectives on past prices. In our experiments it is assumed
that this random variable is normally distributed. If s is small, then an agent ignores most
of the price history in its calculation of the input “stock price level”.
The 1,000 fuzzy trader agents communicate only indirectly through the stock price kt that is
the result of aggregated trading decisions of the individual agents. Trading does not
necessarily occur in each period. Instead, trading frequency f is a normally distributed
random variable, determined once for each agent. Thus, different trading attitudes, such as
day traders and long-term investors can be emulated.
In addition to the historic period s and the trading frequency f, a third parameter is of major
importance for the simulation: the diversity d of market assessments in the population of
agents. In real markets, some traders are more risk-averse than others, thus their individual
assessment of a given market situation can differ significantly. This is emulated by varying
the geometry (position and width) of the fuzzy sets for each of the two input variables of a
trader agent within predefined ranges. Thus, the assessment of stock price level and trend
in prices varies between different agents, influencing their individual decision to buy, hold
or sell stock. This variation of fuzzy sets is done at the start of the simulation individually
and once for each agent using a (0, )-normally distributed random variable. The standard
deviation of the random variable can be used to create different amounts of behavioural
diversity in the population of trader agents.
With s, f and d some useful parameters are available to influence the individual behaviour
of the fuzzy trader agents and analyse the relation of microscopic behaviour patterns and
macroscopic effects. When looking at the effects in section 4 it is worth mentioning that
random numbers are only created and applied during initialisation, but the simulation itself
is deterministic. Please note that the utilisation of the afore-mentioned parameters and
fuzzy sets does not mean that the trader agents adjust themselves to the system output
through learning. All parameters are set to initialise a simulation run and thereafter remain
static during the course of the run.

Bottom-up simulation of a stock market using a thousand fuzzy agents Volker Nissen, Danilo Saft
— 11 —
4 Experiments with the Bottom-Up Simulation
For each experimental setting 20 runs with different random number seeds were
performed. A single run consists of 300 trading periods. As averaging over different runs is
not meaningful in this context, we present graphs and discuss results of individual runs that
display ‘typical’ behaviour for the respective parameterisation. It is acknowledged that this
choice is somewhat subjective. The initial price level and trend in prices in all experiments
are set to zero (neutral), serving as a baseline reference for the following price movements.
It should be kept in mind that the regular patterns described below are all created without
exogenous shocks to the stock exchange system. Moreover, agents do not coordinate
themselves directly through communication or a central coordination agent. They only
observe other agents behaviour indirectly through the price level and trend in prices and
apply simple trading rules, representing their market assessments.
4.1 Experiment 1
In the first experiment, agents calculate the price level input pt as the average stock price
within their relevant historic period s (s [1…t 1]). ki denotes the stock price in period i.
0
1
1 ks
kp
t
stii
t
(3)
Furthermore, trading occurs deterministically in every period and the diversification of
market assessments in the population is initially low. This allows us to better isolate and
analyse the influence of s on the macroscopic level. Figures 4 (a)-(d) demonstrate the
effect of raising the expectation of s with its standard deviation remaining at zero, meaning
that agents include more historic price values in their price level calculation, but do so in
an identical way. The resulting macroscopic effects are an increase in amplitude of the
stock price movement with time and a proportional prolongation of each price cycle. As s
is raised, more and more values enter the calculation of the agents’ stock price level. Thus,
the influence of short-term price movements diminishes and the inertia of the price level
rises, leading to later reactions of agents to current stock price movements and, thus, the
visible macroscopic effects.

Bottom-up simulation of a stock market using a thousand fuzzy agents Volker Nissen, Danilo Saft
— 12 —
(a)
(c)
(b)
(d)
00
0 0
Fig. 4 Results with behavioural agent diversification d = 0.1 (low), trading in each period and s-value expectations of 10% (a), 20% (b), 30% (c) and 50% (d) of simulation periods. The curves display stock price kt over time during a complete simulation run.
When the diversity of market assessments in the agent population is raised ceteris paribus
(c.p.) (meaning more behavioural diversification), then this smoothens the stock price
curve at its turning points and simultaneously softens the price cycles (figure 5). Now, as
the market assessments at each point in time are more diverse, more agents may act in
opposition to the general trend in the population, thus indirectly convincing other agents to
leave their current trading positions. This leads to less abrupt changes of stock price at the
turning points of the price pattern and also shortens corresponding price cycles by lowering
the amplitudes.
(a) (b)
0 0
Fig. 5 Results for s-value expectation of 50% and behavioural agent diversification d = 0.1 (a) and d = 0.5 (b). Rest of parameters as in figure 4.

Bottom-up simulation of a stock market using a thousand fuzzy agents Volker Nissen, Danilo Saft
— 13 —
(a) (b)
0 0
Fig. 6 Results for s-value expectation of 50% with a standard deviation of 10% (a) and 30% (b). Rest of parameters as in figure 4.
A similar effect can be achieved c.p. by introducing a standard deviation for s, as can be
seen in figure 6. Now, the behavioural diversification in the population is low again, but
agents apply their trading rules to different price levels, resulting again in different market
assessments, thus smoothing the stock price curve at the turning points, but also shortening
the price cycles.
4.2 Experiment 2
In the second experiment, agents calculate the price level input pt as the average stock price
within their historic period s (s [1…t 1]), but with reference to the stock price at the
beginning of this period. ki again denotes the stock price in period i.
1
1
1st
t
stii
t ks
kp
(4)
Here, an interpretation of results is much more difficult, as each agent deduces an
individual stock price from the average price over its historic period, leading to very
different inputs, and consequently trading decisions, for agents.
The first series of simulation runs has identical parameterisation as in the previous
experiment with focus on the length s of the historical price period. Comparing the results
of figure 4(a) and figure 7(a), it becomes evident that with a short relevant price history the
modified price level calculation of agents forces the system to search an initial high stock

Bottom-up simulation of a stock market using a thousand fuzzy agents Volker Nissen, Danilo Saft
— 14 —
price level before it starts oscillating. The initial rise in figure 7(a) is due to the deduction
made from the average price (kt s 1 > k0) that pushes agents to continue buying stock, thus
raising the stock price. However, as the parameter s is raised and the relevant historic
period becomes longer in price level calculations, this initial search phase diminishes and
the curve now resembles the result in our first experiment – but with a lower mean stock
price due to the deduction of negative stock prices in the agents’ price level calculations.
(a) (b)
0
0
Fig. 7 Results with behavioural agent diversification d = 0.1 , trading in each period and s-value expectation of 10% (a) and 50% (b), standard deviation of s is zero. The curves again display the stock price kt over time during a complete simulation run.
A very significant influence, not seen in experiment 1, comes through the introduction of a
standard deviation of s (figure 8).
(a) (b)
0 0
13
Fig. 8 Results for behavioural agent diversification d = 0.1, trading in each period and s-value expectation of 10% with a standard deviation of 20% (a) and 30% (b).

Bottom-up simulation of a stock market using a thousand fuzzy agents Volker Nissen, Danilo Saft
— 15 —
With greater diversification of s-values in the agent population, the agents’ calculated price
level input now varies widely, leading to different price interpretations. The results are a
significantly reduced amplitude of the stock price movement, shorter oscillation cycles and
a lower predictability of the price at the macroscopic level.
4.3 Experiment 3
In this last set of empirical investigations, the influence of a more varied trading frequency
is analysed. So far, it was assumed that agents make trading decisions in all periods during
the simulation. This is of course not in accordance with real markets, where traders may
act more or less frequently, with the extremes of day traders and long-term investors. To
emulate such situations we start by introducing an expectation for the random trading
frequency f that is identical for all agents. This means, all agents continue to trade
simultaneously, but not in every period of the simulation. Figure 9 displays the results for
this experiment. The curve is less smooth, because of longer intervals without trading,
followed by trading periods where the stock price is abruptly corrected. This is particularly
pronounced at the turning points. However, the oscillation of the stock price is less
distinctive. The averaging price level calculation of the agents combined with the periods
without trading now leads to a stretching of the price oscillation pattern.
trade cycle
stoc
k pr
ice
trade cycle
stoc
k pr
ice
Fig. 9 Results for behavioural agent diversification d = 0.3 , trading frequency of 20% with a standard deviation of zero, an s-value expectation of 30% with a standard deviation of zero. The price level calculation is as in section 4.2.

Bottom-up simulation of a stock market using a thousand fuzzy agents Volker Nissen, Danilo Saft
— 16 —
(a) (b)
0
0
Fig. 10 Results for behavioural agent diversification d = 0.5 (high), a trading frequency of 0% with a standard deviation of 10%, an s-value expectation of 10% with a standard deviation of 30% (a) and 40% (b). The price level calculation is as in section 4.2.
The experiments so far have shown that with the assumption of regular trading it is
possible to isolate and interpret the influence of individual model parameters on the
macroscopic level. The final simulation now serves to demonstrate the effects of more
irregular trading, combined with a large behavioural diversity (different market
assessments) within the population of agents, when the length s of historic periods used in
the price level calculation by the agents is different (figure 10). Stock price now displays a
high volatility and resembles real-world stock price patterns. However, the resulting graphs
of similar experiments are so different that it seems impossible to draw definite
conclusions about the influence of s on the macroscopic level here. The interactions of
system parameters now become very complex and hard to understand. One arrives at a
system which displays regularities and complex behaviour at the same time.
5 Conclusion and Future Work
The main objective of this paper was a better understanding of the relationship between
certain behavioural parameters of the participants of an artificial stock market and the
emergent macro-level stock price patterns created through the trading decisions of
individual agents. The experiments are certainly preliminary and to be extended, but it is
nevertheless believed that some useful lessons can be learned from the simulations.

Bottom-up simulation of a stock market using a thousand fuzzy agents Volker Nissen, Danilo Saft
— 17 —
First, regular oscillations and complex stock price patterns can be created bottom-up
without the necessity of a mathematical top-down model of the simulated market.
Moreover, exogenous (economic) shocks to the system are not required to change the
direction of the stock price. Nor is it required that agents can communicate directly or use a
central coordination instance to achieve aligned behaviour. Focusing on modelling
individual traders, now gives the opportunity to directly implement and test assumptions
about the influence of decision parameters and agent behaviour as part of a bottom-up
simulation model.
Second, the trading rules of market participants may be captured with only a few rules
using the analogy of technical fuzzy control applications where crisp input combined with
a simple model of human knowledge is sufficient to create robust system behaviour. By
changing the geometry of fuzzy sets, behavioural variation can be introduced in otherwise
identical agents. Thus, we have a straightforward way of modelling some elementary
aspects of the psychology of trading behaviour.
Third, seasonal price patterns occur in our simulation just because of price speculations by
the individual agents. This would suggest that in real markets oscillations can occur, even
if traders ignore all fundamental data. Thus, it does not seem mandatory to refer to interest
rates, overall economic situation or exchange ratios – all commonly used to explain trading
patterns, but agents just watching historical price data and the trend in prices can create
such macroscopic patterns. This does not mean that fundamental economic data has no
influence on individual trading. However, this influence may be overestimated, particularly
when it comes to non-professional traders who might behave more swarm-like with
indirect coordination through the market price and simple plausibility-based trading rules
instead of making rational choices based on full economic information and deep analysis.
Fourth, averaging historic prices in making a trading decision is a fundamental reason for
dynamic stock prices, as is behavioural variety amongst traders. A low diversity among
traders and similar appreciation of price history suggests regular and very pronounced
oscillations of the stock price while greater behavioural variation of agents in combination
with a varied appreciation of price history should create very volatile and complex price
patterns through reinforcement effects. It follows that stock price forecasting at the
macroscopic level remains a very difficult (if not hopeless) task, even if one could assume
that no change in fundamental economic data or exogenous shock occurs.

Bottom-up simulation of a stock market using a thousand fuzzy agents Volker Nissen, Danilo Saft
— 18 —
The research outlined here may be extended in various directions. For instance, in our
model the stock price is determined in a simplified way that could be improved to more
strongly resemble the pricing mechanism of an actual stock exchange. This would include
the introduction of a central market maker. The rule base of a fuzzy trader agent is
currently very small and focuses on stock price data. It could be extended to integrate
further inputs or decision parameters. Moreover, the rule bases of agents could be different.
Also, agents currently display only stimulus-response behaviour but are unable to learn.
Changing this, though, would require a paradigm shift away from swarm-like agents to
complex, intelligent agents, while the swarm metaphor currently does not seem to be fully
explored. Finally, it would be interesting to simulate exogenous shocks to the stock market
system and analyse their effects.
References
1. Uhlig, H.: Finanzmarktanalyse – Neue Ansätze aus der Chaosforschung. Vahlen,
München (1999)
2. Binswanger, M.: Stock Markets, Speculative Bubbles and Economic Growth. Elgar,
Cheltenham (1999)
3. Dette, G.: Kursbildung am deutschen Aktienmarkt. DUV, Wiesbaden (1998).
4. Kaplan, I.: Estimating the Hurst Exponent. http://www.bearcave.com/misl/misl_tech/
wavelets/hurst/index.html (24/09/2006)
5. Epstein, J.M; Axtell, R.: Growing Artificial Societies. Social Science from the Bottom
Up. Random House, London (1996)
6. Kennedy, J.; Eberhart, R.C.: Swarm Intelligence. Morgan Kaufman, San Francisco
(2001)
7. Bonabeau, E.; Dorigo, M.; Theraulaz, G.: Swarm Intelligence. From Natural to Artificial
Systems. Oxford University Press (1999)
8. Holland, J.H.: Emergence. From Chaos to Order. Oxford University Press, (2000)
9. Stephan, A.: Emergenz. Von der Unvorhersagbarkeit zur Selbstorganisation. 2nd ed.
Mentis, Paderborn (2005)

Bottom-up simulation of a stock market using a thousand fuzzy agents Volker Nissen, Danilo Saft
— 19 —
10. Schleis, K.: Börsenpsychologie und Aktienkursprognose. Fortuna, Zürich (1993)
11.Nauck, D.; Kruse, R.: Fuzzy-Systeme und Soft Computing. In: Biethahn, J.; Hönerloh,
A.; Kuhl, J.; Nissen, V. (Hrsg.): Fuzzy Set Theorie in betriebswirtschaftlichen
Anwendungen, Vahlen, München (1997) 3–21
12. Zimmermann, H.-J.: Fuzzy Set Theory – and Its Applications. 4th ed., Kluwer, Boston
(2001)
13. Sivanandam, S.N.; Sumathi, S.; Deepa, N.: Introduction to Fuzzy Logic using
MATLAB. Springer, Berlin (2006)
14. Tesfatsion, L. (ed.): Special Issue on Agent-based Computational Economics.
Computational Economics 18 (2001) 1
15. Loistl, O.: Kapitalmarkttheorie, 3. ed., R. Oldenbourg Verlag München Wien,
München (1994)
16. Hommes, C.: Heterogeneous Agent Models in Economics and Finance. In: Tesfatsion,
L. and Judd, K.L. (eds.): Vol.2 of Handbook of Computational Economics, North-
Holland, Chapter 23 (2006)
17. LeBaron, B.: Agent-based Computational Finance. In: Tesfatsion, L. and Judd, K.L.
(eds.): Vol.2 of Handbook of Computational Economics, North-Holland, Chapter 24
(2006).
18. Samanidou, D.; Zschischang, E.; Stauffer, D.; Lux, T.: Agent-based Models of
Financial Markets. Reports on Progress in Physics 70 (2007) 409-450