Embed Size (px)
Citation preview

Bourgault Agronomy Trials 2018 Results Bourgault Industries Ltd Curtis de Gooijer PAg, CCA

1 | P a g e
Contents 2018 Bourgault Weather Report .................................................................................................................. 2
Canola Large Scale Trials ............................................................................................................................... 3
Trial Design ................................................................................................................................................ 3
Fertilizer Blend Trial .................................................................................................................................. 5
Starter Phosphorus Trial ........................................................................................................................... 7
Phosphorus – Seed Rate Trial ................................................................................................................... 9
Wheat Large Scale Trials ............................................................................................................................. 10
Trial Design .............................................................................................................................................. 10
Increase Protein ...................................................................................................................................... 10
Fertilizer Blend Trial ................................................................................................................................ 12
Appendix: Statistical Analysis ...................................................................................................................... 13
Canola ..................................................................................................................................................... 13
Wheat ...................................................................................................................................................... 15

2 | P a g e
Bourgault Trials – Summary
2018 Bourgault Weather Report Rainfall:
Soil Moisture:
- A soil probe was used to determine soil moisture where is measured at depths of 4”, 8”, 16”, 24”, 32”, and 40” and monitored from June 16 to August 23.
- Shows a steady decline in ground soil moisture starting near the beginning of July. - The beginning of August shows that the roots reached depths of 32-40” in the soil profile.

3 | P a g e
Canola Large Scale Trials Three major canola large scale trials were conduction in the 2018 season:
- Fertilizer Blend Trial - Starter Phosphorus Trial - Phosphorus – Seed Rate Trial
Trial Design Each of the major canola large scale trials were conducted with the following specifications, conditions and parameters:
- 500’ by 30’ strip trials, with the center 25’ and complete 500’ length taken for yield. - Treatments replicated 3 times in a Randomized Complete Block Design. - Yield calculated via weigh wagon. Samples taken so yields could be normalized for 0% dockage
and 10% moisture. - Plant counts taken in 3 places per treatment and averaged. - Seeded May 22, 2018. - Statistical analysis:
• Based on a 90% Confidence Level (P<0.1) • Fisher’s Least Significant Difference (LSD) indicates the smallest amount between
treatments that would indicated a significant difference based on the Confidence Level. • Letters describe if one treatment is statistically the same as another treatment.
Ex. Treatments depicted as ‘A’ are the same other treatments with ‘A’ in them. Ie ‘A’ IS statistically the same as ‘AB’ Ie ‘A’ IS NOT statistically the same as ‘B’
- Terminology • DK – Dual Knife • SB – Side Band • MRB – Mid Row Bander • SR – Seed Row • P – lbs P2O5 • MAP – Monoammonium Phosphate
Field Information
- Field Soil Analysis – 24” depth for nutrients; 6” depth for O.M and pH N P K S O.M. pH
21lbs 22lbs 195lbs 29lbs 5.0% 6.9
- Previous Crop was Barley - Soil type
Waitville-Whitewood Dark Gray wooded soil formed on loamy glacial till; loam surface texture Nearly level topography but contains moderate amount of stones

4 | P a g e
Seeding Equipment
• All plots were seeded with the same air tank and tractor. • Bourgault L7550 Air Seeder.
5 Tanks all capable of metering Capable of 3 airways to accommodate triple shoot for dry products
• Two separate seeding tools were used. Bourgault 3320 Dual Knife (DK)
10” Spacing 12” Spacing ¾” opener ½” dual knives
MRB Equipped MRB Equipped
Harvest
• Swathing took place in the week of August 27th. Swathing was done in three times: Saturday, Monday, and Wednesday.
• All trials harvested on Oct. 3rd and 4th with results corrected for 10% moisture and 0% dockage.
MRBs Disengaged
MRBs Engaged

5 | P a g e
Fertilizer Blend Trial Objective – To determine if high yields and greater seeding efficiency could be achieved by applying different placement strategies of single or multiple fertilizer blends in a single pass operation.
Treatments
Results
To achieve a statistically significant difference for this trial, a 3.4 bu/acre yield difference and 1 plant/ft2 difference in plant count was required.
- There was a 20% greater plant stand with 3320 versus the DK. This difference is due to the spacing being at 10” versus 12” spacing. The triple shoot treatment had a 10% greater plant stand than the split blend fertilizer trials, indicating there may also been a reduction in plant stand due to the nitrogen being too close in the side band.
- We recorded slight differences in yield between treatments and drills: • Adding phosphorus and sulfur in the seedrow had the overall highest yield, though
marginally (trt #4 & 5), but did hurt the plant count compared to straight phosphorus in the seed row (trt #1);
Seed 5lbs L233PFert Total: 130-50-0-25 (413lbs total)
Trt # Treatments Rational 1 15P SR; 107-35-0-25 Band 3320; DK SR: 3-15-0-0 MRB: 107-25-0-252 15% NPS Blend SR (62lbs:351lb) 3320; DK SR: 16-6-0-4 MRB: 93-33-0-213 25% NPS Blend SR (103lbs:310lb) 3320; DK SR: 28-10-0-6 MRB: 82-29-0-194 40% PS Blend SR 3320; DK SR: 12-16-0-10 MRB: 98-24-0-155 60% PS Blend SR 3320; DK SR: 18-24-0-15 MRB: 92-16-0-106 Triple Shoot (15P SR; 25S SB;) DK SR: 3-15-0 SB:21-0-0-25 MRB:86-25-0
Drill

6 | P a g e
• When a portion of the total fertilizer blend (trt #2 & 3) was placed in the seed row, it decreased yield and plant count significantly compared to when only phosphorus was placed in the seed row. Plant counts decreased as the percentage placed in the seed row increased, most likely due to the higher amount of nitrogen seed placed.
- There were large differences between the treatments in maturity, with low plant counts taking longer to mature.

7 | P a g e
Starter Phosphorus Trial Objective – Investigate the claim that phosphate fertilizer with a greater content in the orthophosphate form (the plant available form of phosphorus) will be taken up more readily and improve crop performance in the year of application. This trial was designed to measure the difference of emergence and yield between different types of starter phosphorus fertilizer.
Treatments
All types of phosphorus were applied to equal 15lbs P2O5
- Ortho – Liquid Orthophosphate – 6-24-6. Companies that produce these products include Alpine and Kugler.
- Poly – Liquid Polyphosphate - 10-34-0 which contains roughly 60% of phosphorus in the poly form and 40% in the ortho form.
- MAP – Dry phosphorus granular – 11-52-0 which contains roughly 60% of phosphorus in the poly form and 40% in the ortho form.
Results
Trt # Treatments1 SR: 15P MAP MRB: 35P MAP 33202 SR: 15P Poly MRB: 35P MAP 33203 SR: 15P Ortho MRB: 35P MAP 33204 SR: 15P MAP 33205 SR: 15P Poly 33206 SR: 15P Ortho 3320
Drill

8 | P a g e
- For the past three years, we have not observed any significant difference in either yield or plant count from using different types of starter phosphorus.
- In 2018, we did not measure a very large increase in yield by adding P in the MRB. This may be contributed to lack of moisture as these trials were placed on some drier parts of the field.
These results are in line with many studies that show polyphosphate fertilizers do break down into orthophosphate in the soil in time to meet the crops needs. Note that although MAP (11-52-0) is considered a polyphosphate, it contains up to 40% of the phosphorus in the orthophosphate form.
9 | P a g e
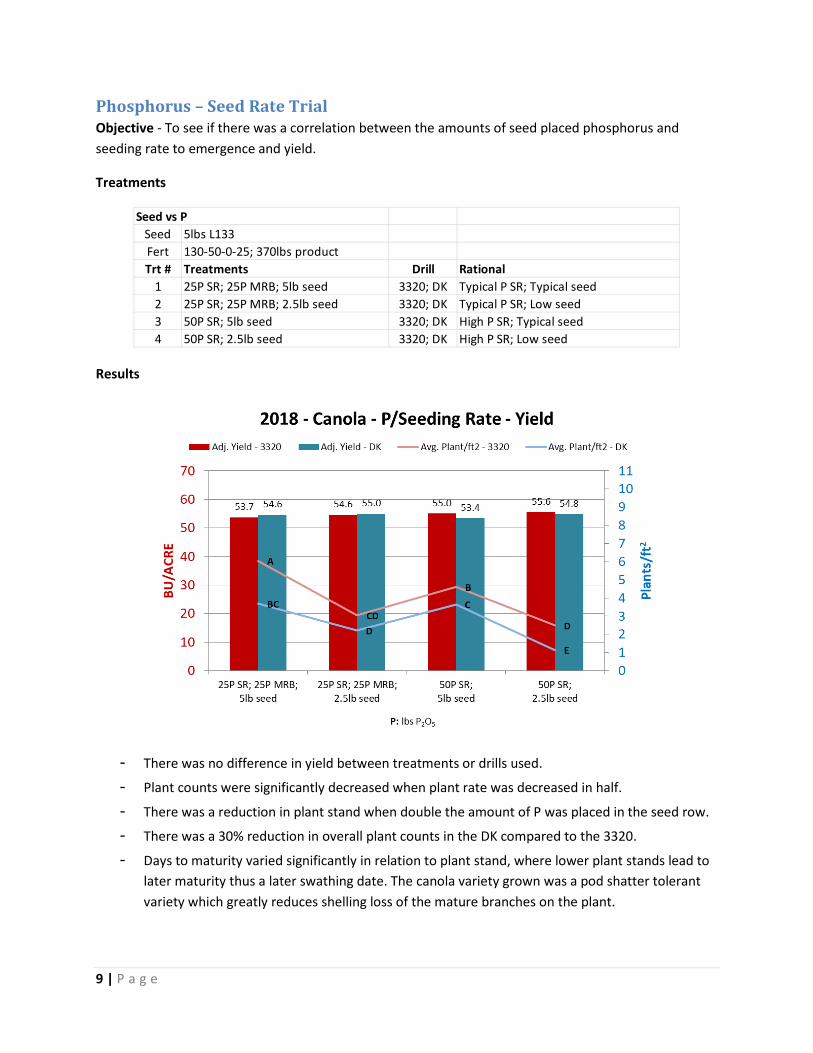
Phosphorus – Seed Rate Trial Objective - To see if there was a correlation between the amounts of seed placed phosphorus and seeding rate to emergence and yield.
Treatments
Results
- There was no difference in yield between treatments or drills used. - Plant counts were significantly decreased when plant rate was decreased in half. - There was a reduction in plant stand when double the amount of P was placed in the seed row. - There was a 30% reduction in overall plant counts in the DK compared to the 3320. - Days to maturity varied significantly in relation to plant stand, where lower plant stands lead to
later maturity thus a later swathing date. The canola variety grown was a pod shatter tolerant variety which greatly reduces shelling loss of the mature branches on the plant.
Seed vs PSeed 5lbs L133Fert 130-50-0-25; 370lbs productTrt # Treatments Rational
1 25P SR; 25P MRB; 5lb seed 3320; DK Typical P SR; Typical seed2 25P SR; 25P MRB; 2.5lb seed 3320; DK Typical P SR; Low seed3 50P SR; 5lb seed 3320; DK High P SR; Typical seed4 50P SR; 2.5lb seed 3320; DK High P SR; Low seed
Drill

10 | P a g e
Wheat Large Scale Trials
Trial Design Each of the major wheat large scale trials were conducted with the following specifications, conditions and parameters:
- 400’ by 30’ strip trials, with the middle 25’ being used the full 400’ in length. - Treatments replicated 3 times in a Randomized Complete Block Design. - Yield measured via weigh wagon. - Plant counts were not taken due to a heavy wild/volunteer oat infestation. - Trials were seeded May 15, 2016. - Moisture was equalized to 13.5% and dockage to 0%
Increase Protein Objective - To achieve increased protein in wheat by increasing nitrogen rates using either urea or ESN placed in the seed row or in the band, either MRB or SB.
Treatment
Results
Seed 150lbs BrandonFert 110-35-15-0. 315lbs product
Add. N 130-35-15-0. 360lbs productTrt # Treatments Rational
1 Control (SR: 35P+15K MRB: 95N) 3320; DK 2 Establish normal seeding 2 SR: 20lbs N: Urea 3320; DK 2 Addition of N SR to early season3 SR: 20lbs N: ESN 3320; DK 2 Addition of N SR (safe) for early season4 Band: 20lbs N: Urea 3320; DK 2 Addition of N to later season5 Band: 20lbs N: ESN 3320; DK 2 Addition of N to later season or longer8 Triple Shoot (SR:35P+15K; SB: 20N; MRB: 95N) DK 1 Multiple site feeding
Drill

11 | P a g e
- A 6.5 bu/acre difference was needed to have a significant difference between treatments. - The only significant difference was with the lower nitrogen with the DK (trt 1#), otherwise all
treatments had the same yield. - There was a pattern of higher yield when additional nitrogen was added, regardless of the
placement or whether it was with ESN or Urea. - There were no significant differences in protein.
- If we narrow in on one specific comparison, seen above, we see that the addition nitrogen was still going towards yield, not protein. This indicates there may be potential for more yield as protein typically doesn’t start to increase with increased nitrogen rates until yield has reached its peak.
- If we continue this trial, we will need to increase nitrogen rates higher than 130lbs to attempt to achieve yields of over 70bu/acre, and then determine if there is an increase protein.

12 | P a g e
Fertilizer Blend Trial Objective – To measure the effects of applying a single blend of fertilizer that is split between the seed row and band, either MRB, or SB. The goal is to determine if single-blend application is a viable practice to improve efficiency without affecting emergence and yield.
Treatments
Results
- Application of the blend as listed resulted in a lowered protein level in both drills, but also showed an increase yield in the DK. This suggests some of the nitrogen contributed to yield rather than protein in the DK.
Seed 150lbs BrandonFert 110-35-15-0. 315lbs productTrt # Treatments Rational
1 Control 3320; DK 2 Establish normal seeding 6 SR: 15% Blend (48lbs) 3320; DK 2 Create one blend to use7 SR: 25% Blend (79lbs) 3320; DK 2 Create one blend to use with higher SR
Drill

13 | P a g e
Appendix: Statistical Analysis
Canola
Canola - Yield - Blend and Triple ShootDrill Description Groups Count Sum Average Variance3320 SR: 15P 1 3 155.8 51.9 7.2 AB
DK SR: 15P 2 3 152.7 50.9 2.2 ABC3320 SR: 15% NPS Blend 3 3 154.5 51.5 3.2 AB
DK SR: 15% NPS Blend 4 3 146.6 48.9 1.7 BC3320 SR: 25% NPS Blend 5 3 145.9 48.6 15.0 BC
DK SR: 25% NPS Blend 6 3 143.3 47.8 11.2 C3320 SR: 40% PS Blend 7 3 157.1 52.4 5.4 A
DK SR: 40% PS Blend 8 3 154.5 51.5 3.2 AB3320 SR: 60% PS Blend 9 3 158.2 52.7 0.9 A
DK SR: 60% PS Blend 10 3 155.6 51.9 14.1 ABDK Triple Shoot: SR:15P SB: 25S 11 3 155.9 52.0 3.0 AB
ANOVASource of Variation SS df MS F P-value F crit
Between Groups 85.05 10 8.51 1.40 0.25 1.90Within Groups 134.01 22 6.09
Total 219.06 32
T - Critical 1.70LSD number 2.02
LSD at (P<0.1) 3.43
Canola - Yield - Phos vs. Seed RateDrill Description Groups Count Sum Average Variance3320 25P SR; 25P MRB; 5lb seed 24 3 161.2 53.7 1.5
DK 25P SR; 25P MRB; 5lb seed 25 3 163.7 54.6 7.33320 25P SR; 25P MRB; 2.5lb seed 26 3 163.7 54.6 7.7
DK 25P SR; 25P MRB; 2.5lb seed 27 3 164.9 55.0 7.83320 50P SR; 5lb seed 28 3 165.0 55.0 5.7
DK 50P SR; 5lb seed 29 3 160.3 53.4 7.83320 50P SR; 2.5lb seed 30 3 166.7 55.6 1.5
DK 50P SR; 2.5lb seed 31 3 164.5 54.8 5.3
ANOVASource of Variation SS df MS F P-value F crit
Between Groups 10.09 7 1.44 0.26 0.96 2.13Within Groups 89.21 16 5.58
Total 99.30 23
T - Critical 1.34LSD number 2.60
LSD at (P<0.1) 3.47

14 | P a g e
Canola - Plant Count - Blend and Triple ShootDrill Description Groups Count Sum Average Variance Significance3320 SR: 15P 1 3 17.8 5.9 0.28 ADK SR: 15P 2 3 12.7 4.2 0.82 BC
3320 SR: 15% NPS Blend 3 3 11.8 3.9 1.02 CDK SR: 15% NPS Blend 4 3 8.1 2.7 0.38 E
3320 SR: 25% NPS Blend 5 3 8.3 2.8 0.34 DEDK SR: 25% NPS Blend 6 3 4.7 1.6 0.41 F
3320 SR: 40% PS Blend 7 3 11.5 3.8 0.90 CDDK SR: 40% PS Blend 8 3 7.4 2.5 0.02 EF
3320 SR: 60% PS Blend 9 3 14.1 4.7 0.49 BCDK SR: 60% PS Blend 10 3 6.0 2.0 0.70 EFDK Triple Shoot: SR:15P SB: 25S 11 3 15.2 5.1 0.06 AB
ANOVASource of Variation SS df MS F P-value F crit
Between Groups 56.61 10 5.66 11.49 0.00 1.90Within Groups 10.84 22 0.49
Total 67.45 32
T - Critical 1.68LSD number 0.57
LSD at (P<0.1) 0.96
Canola - Plant Count - Phos vs. Seed RateDrill Description Groups Count Sum Average Variance Significance3320 25P SR; 25P MRB; 5lb seed 24 3 18.1 6.0 0.11 A
DK 25P SR; 25P MRB; 5lb seed 25 3 11.1 3.7 2.83 BC3320 25P SR; 25P MRB; 2.5lb seed 26 3 9.1 3.0 0.01 CD
DK 25P SR; 25P MRB; 2.5lb seed 27 3 6.6 2.2 0.35 D3320 50P SR; 5lb seed 28 3 13.8 4.6 0.92 B
DK 50P SR; 5lb seed 29 3 10.9 3.6 0.79 C3320 50P SR; 2.5lb seed 30 3 7.5 2.5 0.45 D
DK 50P SR; 2.5lb seed 31 3 3.4 1.1 0.38 E
ANOVASource of Variation SS df MS F P-value F crit
Between Groups 48.3073251 7 6.90 9.43 0.000116181 2.128002609Within Groups 11.71366255 16 0.73
Total 60.02098765 23
T - Critical 1.3LSD number 0.7
LSD at (P<0.1) 0.9

15 | P a g e
Wheat
Wheat - YieldDrill Description Groups Count Sum Average Variance Significance3320 Control 1 3 216.37 72.12 15.06 ABC
DK Control 2 3 212.42 70.81 17.48 BC3320 SR: 20lbs N: Urea 3 3 221.39 73.80 46.20 ABC
DK SR: 20lbs N: Urea 4 3 225.35 75.12 7.24 ABC3320 SR: 20lbs N: ESN 5 3 234.06 78.02 0.55 A
DK SR: 20lbs N: ESN 6 3 232.30 77.43 23.39 A3320 Band: 20lbs N: Urea 7 3 230.26 76.75 24.71 AB
DK Band: 20lbs N: Urea 8 3 232.86 77.62 33.32 A3320 Band: 20lbs N: ESN 9 3 223.55 74.52 35.45 ABC
DK Band: 20lbs N: ESN 10 3 228.70 76.23 30.43 ABC3320 SR: 15% Blend 11 3 224.49 74.83 17.59 ABC
DK SR: 15% Blend 12 3 228.21 76.07 14.41 ABC3320 SR: 25% Blend 13 3 209.31 69.77 18.85 C
DK SR: 25% Blend 14 3 222.78 74.26 8.60 ABCDK Triple Shoot 15 3 228.36 76.12 42.74 ABC
ANOVASource of Variation SS df MS F P-value F crit
Between Groups 252.6778374 14 18.048 0.806 0.657 1.737Within Groups 672.0302157 30 22.401
Total 924.7080531 44
T - Critical 1.70LSD number 3.86
LSD at (P<0.1) 6.56
Wheat - ProteinDrill Description Groups Count Sum Average Variance Significance3320 Control 1 3 36.6 12.2 0.01 AB
DK Control 2 3 35.8 11.9 0.14 ABCD3320 SR: 20lbs N: Urea 3 3 37.5 12.5 0.39 A
DK SR: 20lbs N: Urea 4 3 37.4 12.5 0.56 A3320 SR: 20lbs N: ESN 5 3 37.2 12.4 0.49 A
DK SR: 20lbs N: ESN 6 3 36.9 12.3 0.79 AB3320 Band: 20lbs N: Urea 7 3 36.8 12.3 0.69 AB
DK Band: 20lbs N: Urea 8 3 36.4 12.1 0.30 ABC3320 Band: 20lbs N: ESN 9 3 36.8 12.3 0.57 AB
DK Band: 20lbs N: ESN 10 3 37.6 12.5 0.74 ADK SR: 15% Blend 11 3 33.4 11.1 0.26 DE
3320 SR: 15% Blend 12 3 33 11.0 0.13 E3320 SR: 25% Blend 13 3 34.5 11.5 0.27 BCDE
DK SR: 25% Blend 14 3 33.9 11.3 0.13 CDEDK Triple Shoot 15 3 37.2 12.4 0.43 A
ANOVASource of Variation SS df MS F P-value F crit
Between Groups 11.551 14 0.825 2.089 0.044 1.737Within Groups 11.847 30 0.395
Total 23.398 44
T - Critical 1.70LSD number 0.51
LSD at (P<0.1) 0.87