Embed Size (px)
Citation preview
1
Investor PresentationQ2 2017
2
This presentation contains forward-looking statements, other than historical
facts, which reflect the view of the Fund's management with respect to future
events. Such forward-looking statements reflect the current views of the Fund's
management and are made on the basis of information currently available.
Although management believes that its expectations are reasonable, it can give
no assurance that such expectations will prove to be correct. The forward-looking
statements contained herein are subject to these factors and other risks,
uncertainties and assumptions relating to the operations, results of operations
and financial position of the Fund. For more information concerning forward-
looking statements and related risk factors and uncertainties, please refer to the
Boyd Group’s interim and annual regulatory filings.
Forward-Looking Statements
3
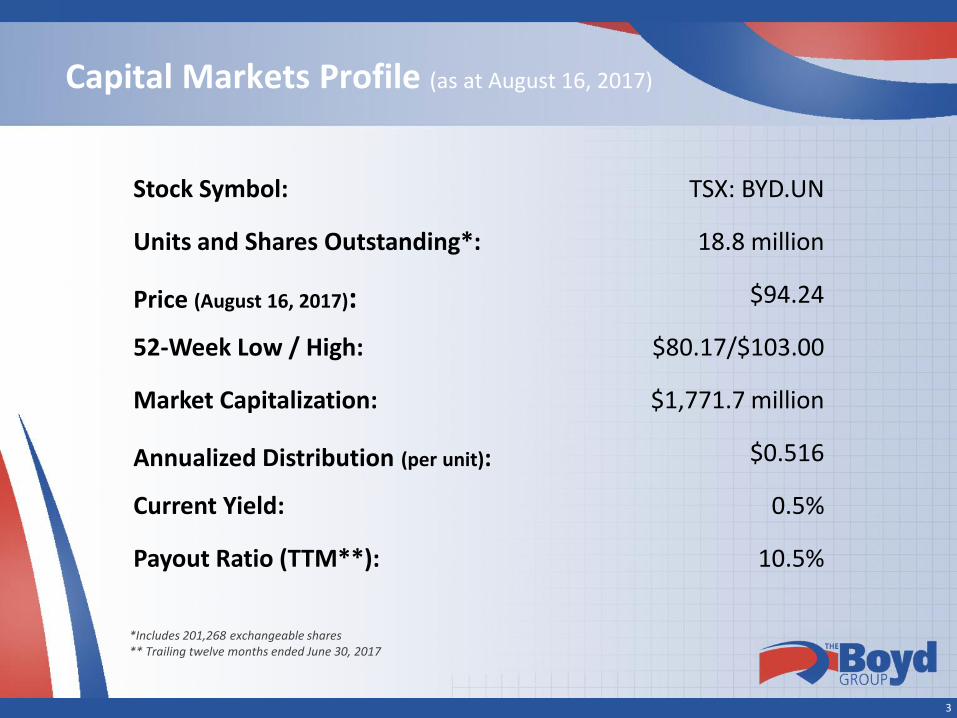
Capital Markets Profile (as at August 16, 2017)
Stock Symbol: TSX: BYD.UN
Units and Shares Outstanding*: 18.8 million
Price (August 16, 2017): $94.24
52-Week Low / High: $80.17/$103.00
Market Capitalization: $1,771.7 million
Annualized Distribution (per unit): $0.516
Current Yield: 0.5%
Payout Ratio (TTM**): 10.5%
*Includes 201,268 exchangeable shares** Trailing twelve months ended June 30, 2017

4
Company Overview
• Leader and one of the largest operators of collision repair shops in North America by number of locations (non-franchised)
• Consolidator in a highly fragmented US$36.4 billion market
• Second-largest retail auto glass operator in the U.S.
• Only public company in the auto collision repair industry in North America
• Recession resilient industry
By Country By Payor< 10% Customer Pay/Other
> 90% Insurance
< 15%*
Canada
U.S.
Revenue Contribution:
*pro forma for the acquisition of Assured Automotive
5
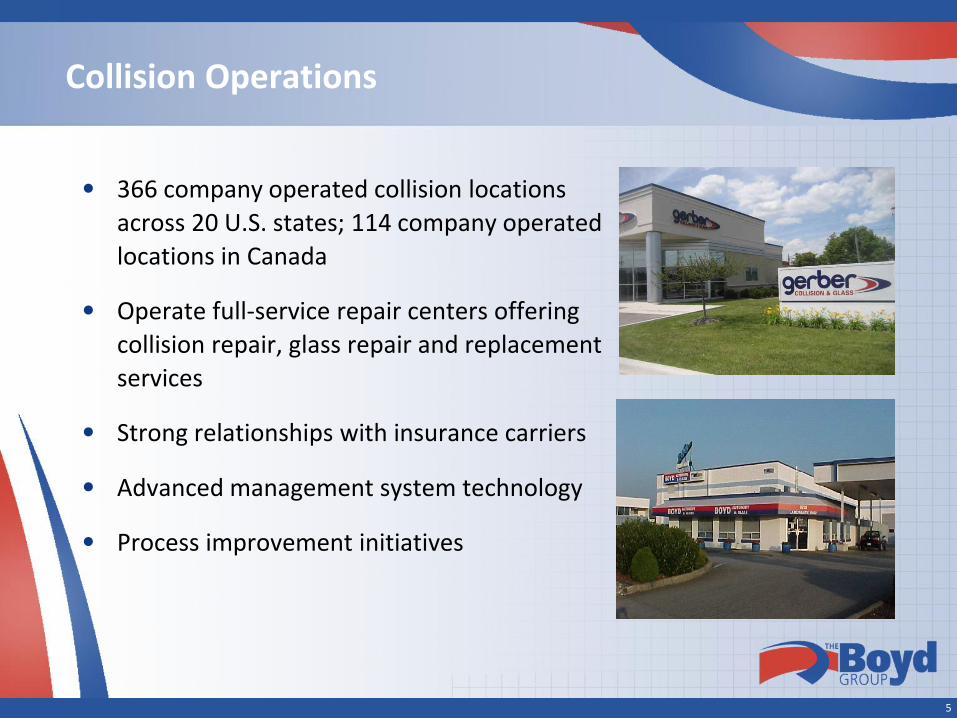
Collision Operations
• 366 company operated collision locations
across 20 U.S. states; 114 company operated
locations in Canada
• Operate full-service repair centers offering
collision repair, glass repair and replacement
services
• Strong relationships with insurance carriers
• Advanced management system technology
• Process improvement initiatives
6
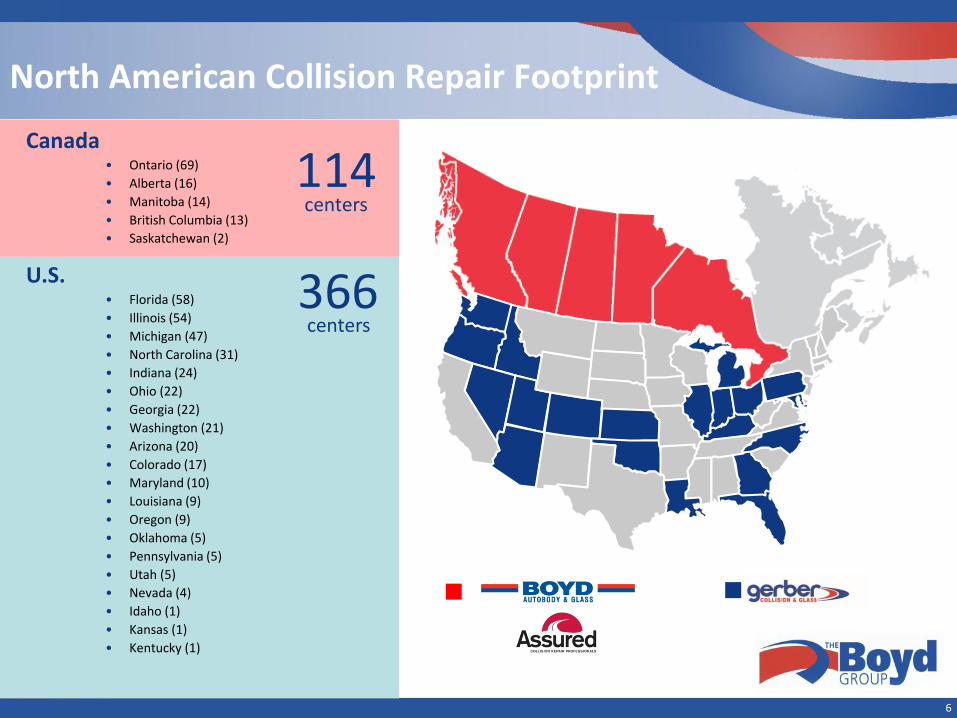
North American Collision Repair Footprint
U.S. • Florida (58)
• Illinois (54)
• Michigan (47)
• North Carolina (31)
• Indiana (24)
• Ohio (22)
• Georgia (22)
• Washington (21)
• Arizona (20)
• Colorado (17)
• Maryland (10)
• Louisiana (9)
• Oregon (9)
• Oklahoma (5)
• Pennsylvania (5)
• Utah (5)
• Nevada (4)
• Idaho (1)
• Kansas (1)
• Kentucky (1)
Canada• Ontario (69)
• Alberta (16)
• Manitoba (14)
• British Columbia (13)
• Saskatchewan (2)
114centers
366centers
6
7
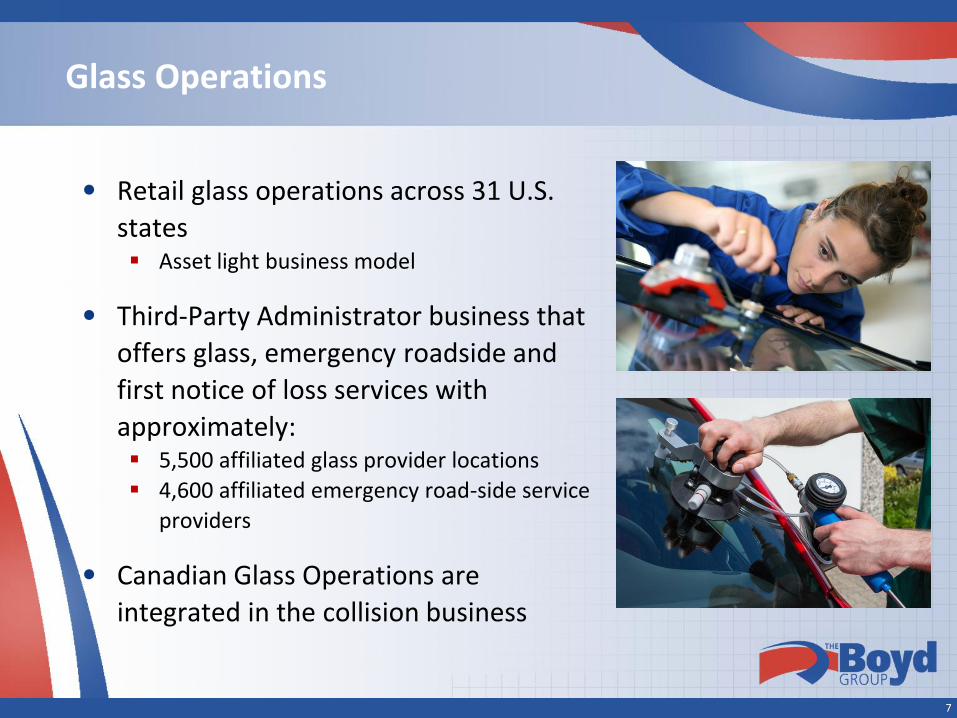
Glass Operations
• Retail glass operations across 31 U.S.
states Asset light business model
• Third-Party Administrator business that
offers glass, emergency roadside and
first notice of loss services with
approximately: 5,500 affiliated glass provider locations
4,600 affiliated emergency road-side service
providers
• Canadian Glass Operations are
integrated in the collision business
8
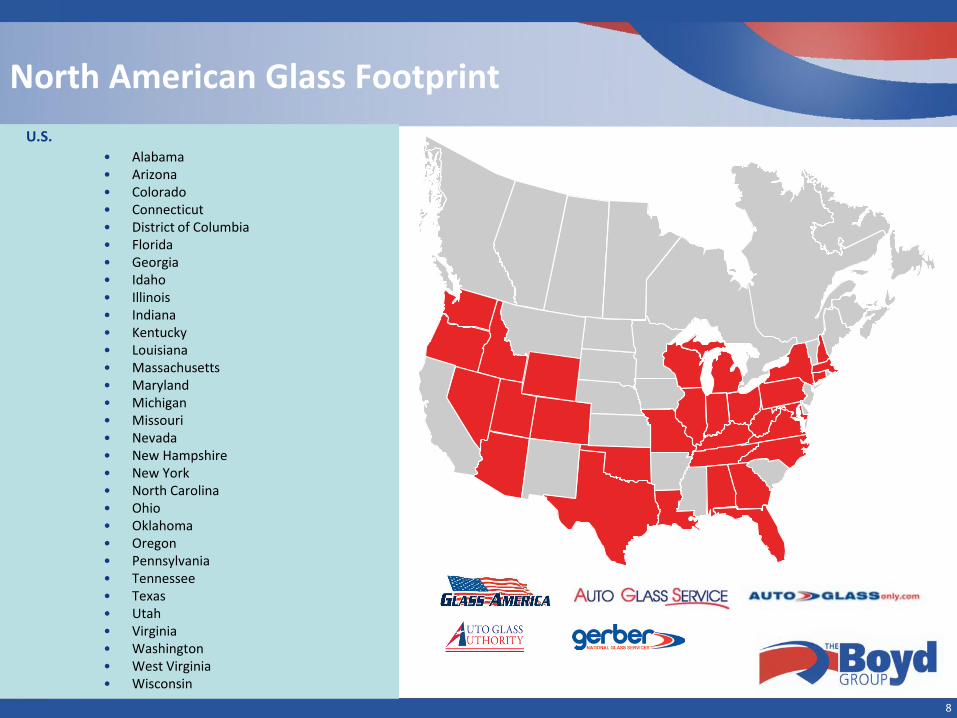
North American Glass Footprint
U.S.
• Alabama• Arizona• Colorado• Connecticut• District of Columbia• Florida• Georgia• Idaho• Illinois• Indiana• Kentucky• Louisiana• Massachusetts• Maryland• Michigan• Missouri• Nevada• New Hampshire• New York• North Carolina• Ohio• Oklahoma• Oregon • Pennsylvania• Tennessee• Texas• Utah• Virginia• Washington• West Virginia• Wisconsin
8
9
Market Overview & Business Strategy
9
10
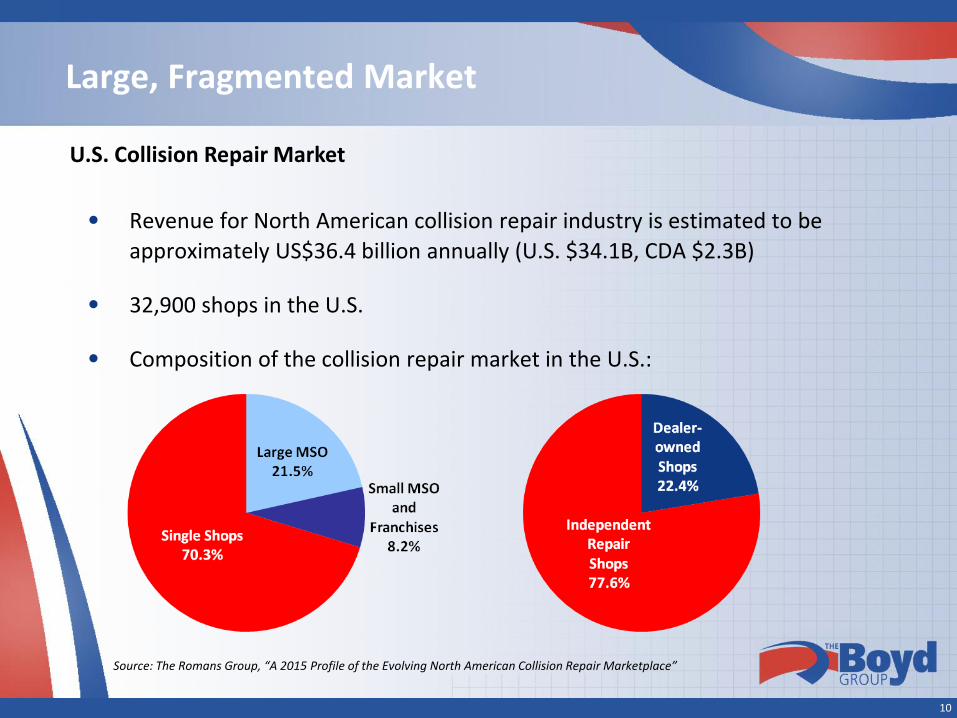
Large, Fragmented Market
• Revenue for North American collision repair industry is estimated to be
approximately US$36.4 billion annually (U.S. $34.1B, CDA $2.3B)
• 32,900 shops in the U.S.
• Composition of the collision repair market in the U.S.:
U.S. Collision Repair Market
Source: The Romans Group, “A 2015 Profile of the Evolving North American Collision Repair Marketplace”
11
Evolving Collision Repair Market
• Long-term decline of independent and dealership repair facilities
Total number of independent and dealership collision repair locations has declined by 23.5% from late 2007 to 2015, and 59% over the past 35 years
• Large multi-shop collision repair operator (“MSO”) market share opportunity
Large MSOs represented 6.4% of total locations in 2015 and 21.5% of estimated 2015 revenue (up from 9.1% in 2006) in the U.S.
79 MSOs had revenues of $20 million or greater in 2015
The top 10 MSOs together represent 66.8% of revenue of large MSOs
MSOs benefit from standardized processes, integration of technology platforms and expense reduction through large-scale supply chain management
Source: The Romans Group, “A 2015 Profile of the Evolving North American Collision Repair Marketplace”

12
Strong Relationships with Insurance Companies through DRPs
• Direct Repair Programs (“DRPs”) are established between
insurance companies and collision repair shops to better
manage auto repair claims and the level of customer satisfaction
• Auto insurers utilize DRPs for a growing percentage of collision
repair claims volume
• Growing preference among insurers for DRP arrangements with
multi-location collision repair operators
• Boyd is well positioned to take advantage of these DRP trends
with all major insurers and most regional insurers
• Boyd’s relationship with insurance customers Top 5 largest customers contribute 47% of revenue
Largest customer contributes 15% of revenue
12
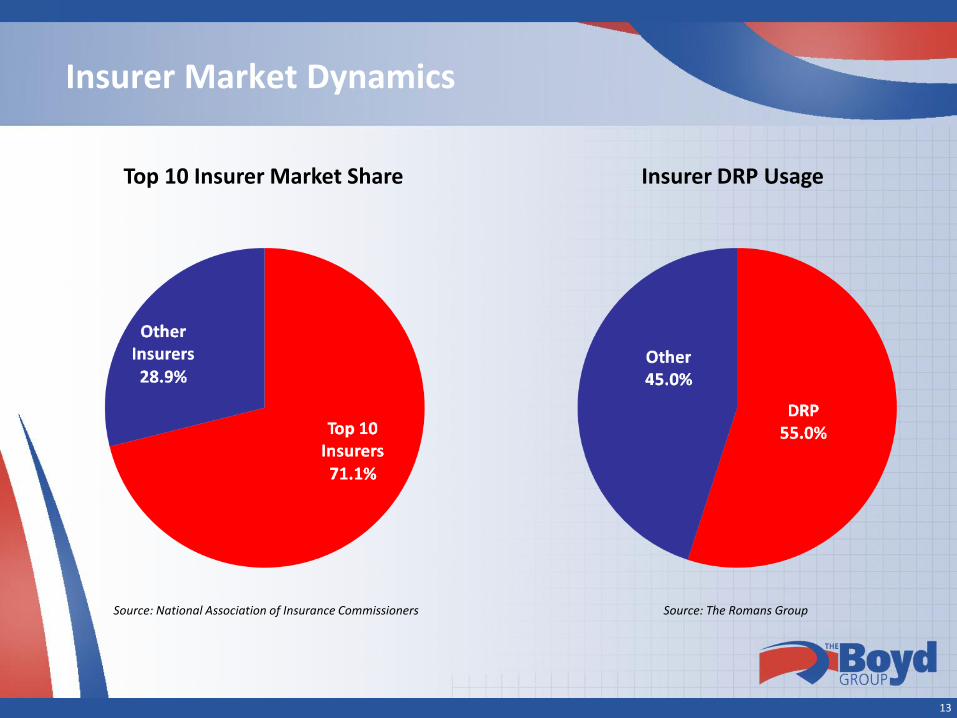
13
Insurer Market Dynamics
Top 10 Insurer Market Share Insurer DRP Usage
Source: National Association of Insurance Commissioners Source: The Romans Group
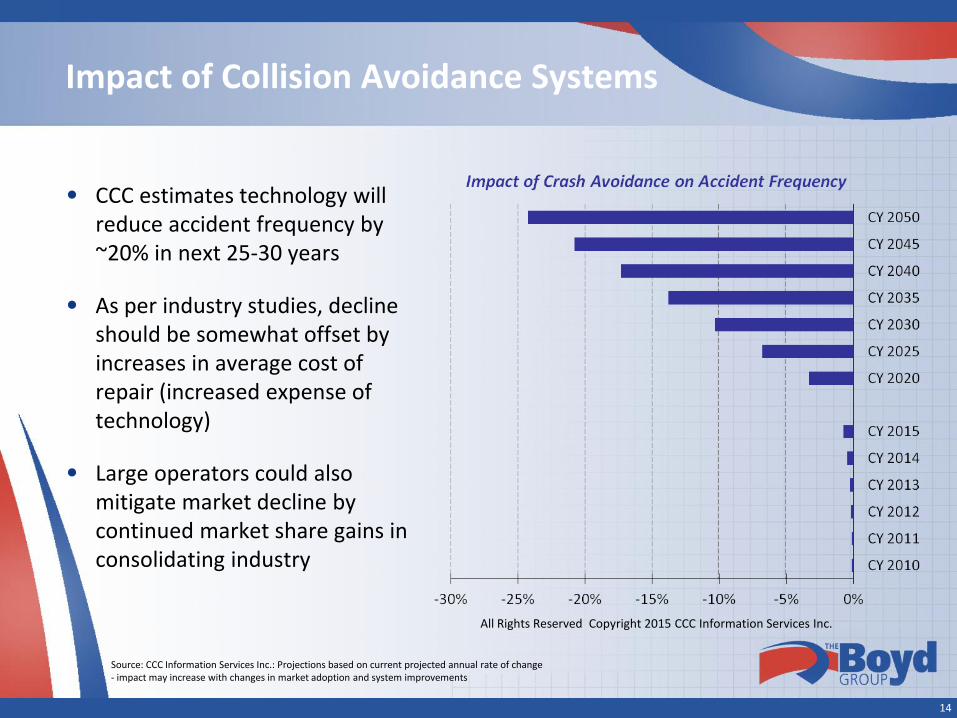
14
Impact of Collision Avoidance Systems
• CCC estimates technology will reduce accident frequency by ~20% in next 25-30 years
• As per industry studies, decline should be somewhat offset by increases in average cost of repair (increased expense of technology)
• Large operators could also mitigate market decline by continued market share gains in consolidating industry
Source: CCC Information Services Inc.: Projections based on current projected annual rate of change - impact may increase with changes in market adoption and system improvements
All Rights Reserved Copyright 2015 CCC Information Services Inc.
15
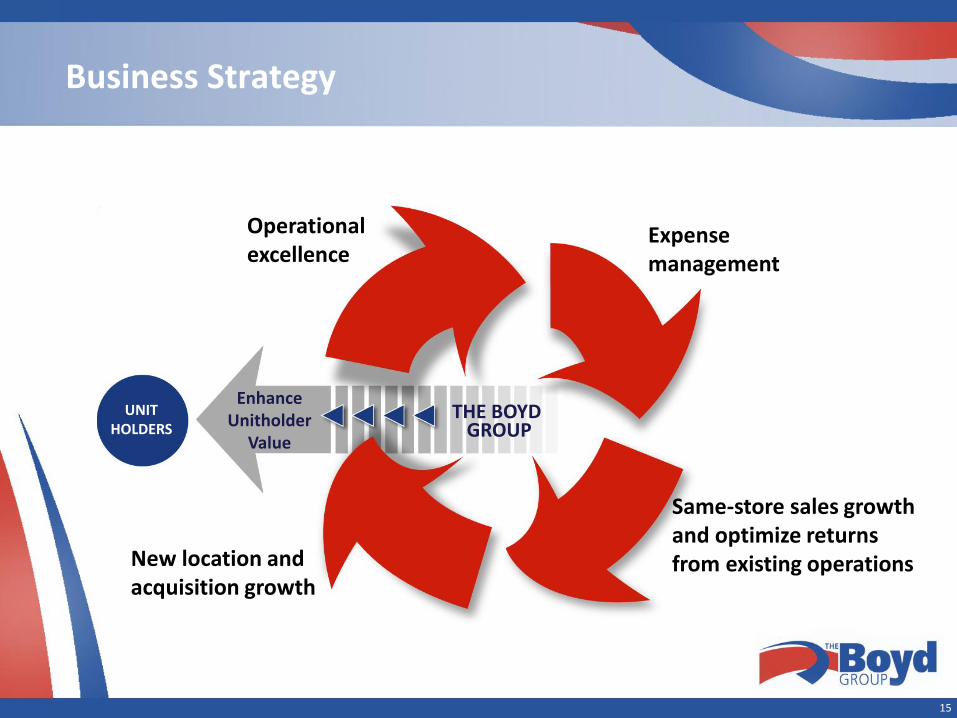
Business Strategy
Operational excellence
New location and acquisition growth
Expense management
Same-store sales growth and optimize returns from existing operations
EnhanceUnitholder
Value
THE BOYD GROUP
UNITHOLDERS
15
16
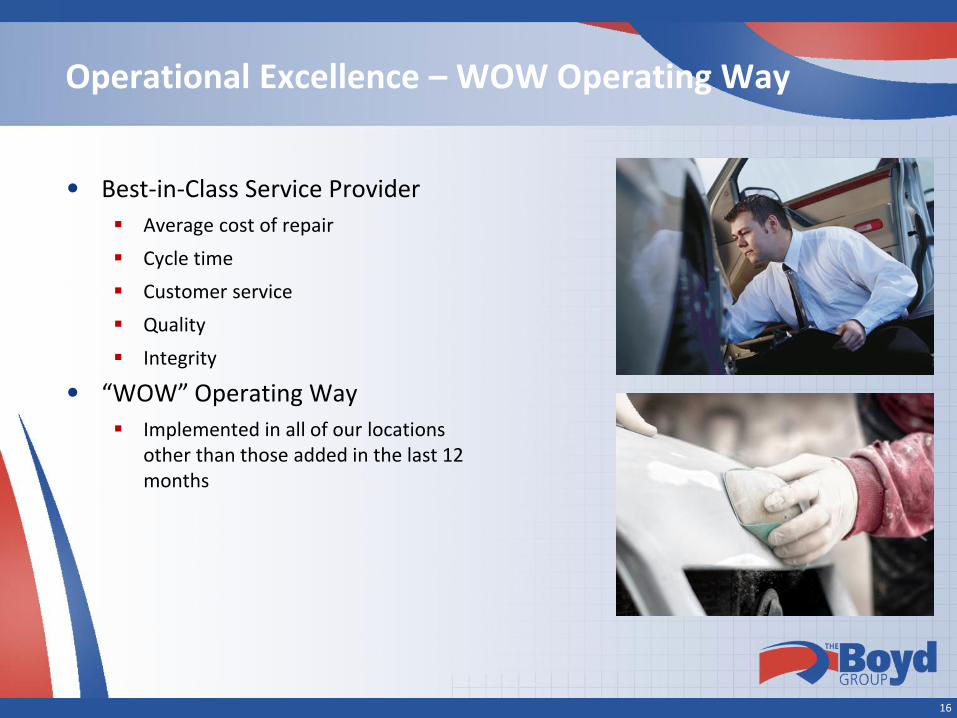
Operational Excellence – WOW Operating Way
• Best-in-Class Service Provider
Average cost of repair
Cycle time
Customer service
Quality
Integrity
• “WOW” Operating Way
Implemented in all of our locations other than those added in the last 12 months
17
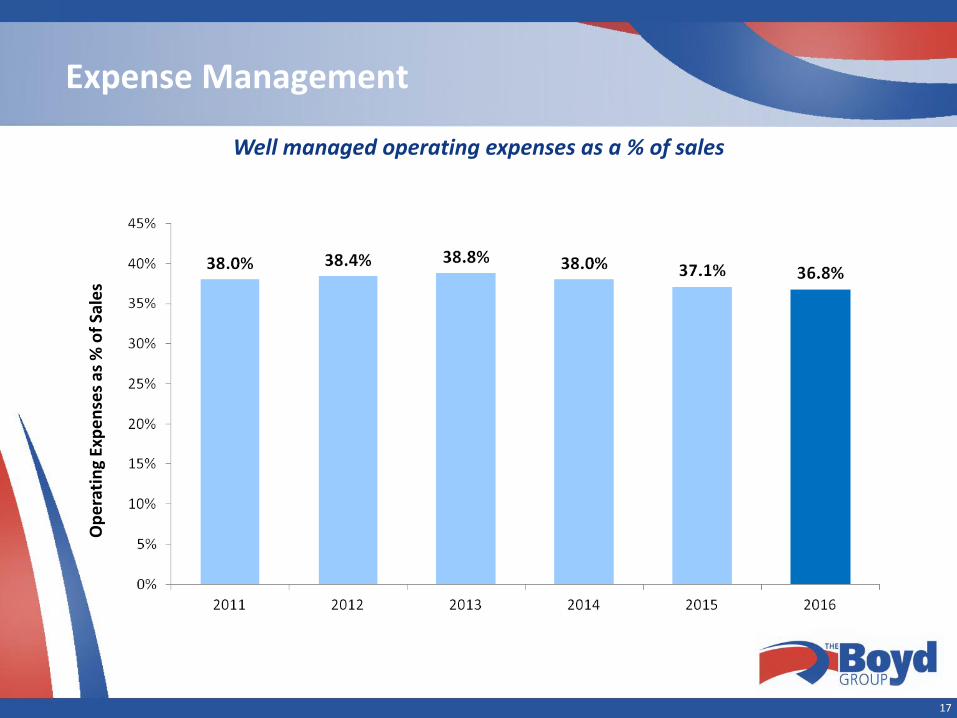
Expense ManagementO
pe
rati
ng
Exp
en
ses
as %
of
Sale
s
Well managed operating expenses as a % of sales
17
18
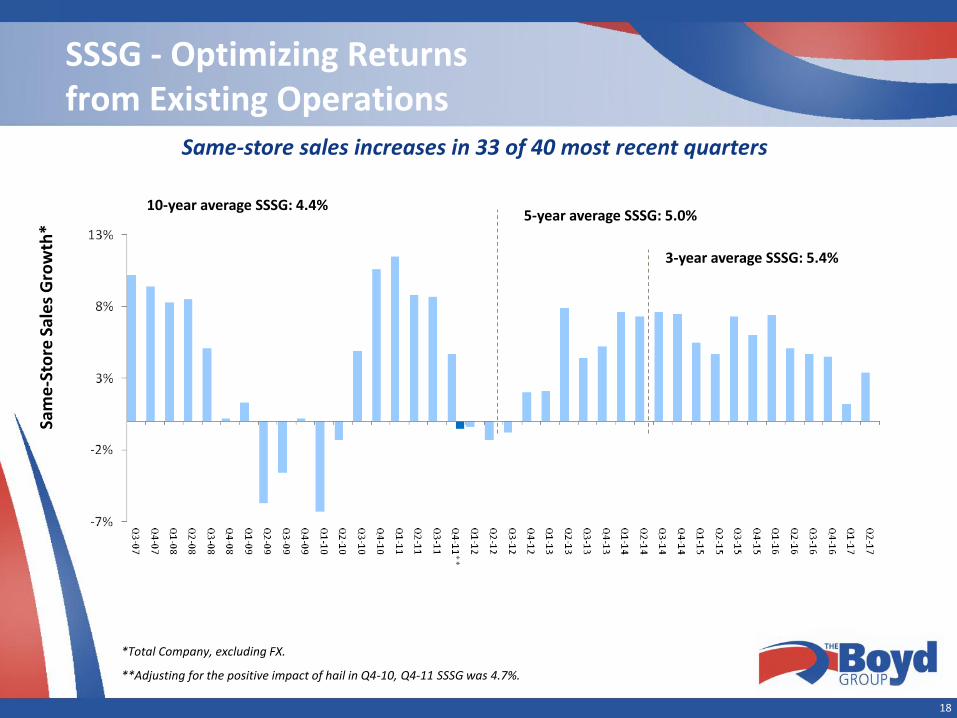
SSSG - Optimizing Returns from Existing Operations
Sam
e-S
tore
Sal
es
Gro
wth
*
Same-store sales increases in 33 of 40 most recent quarters
*Total Company, excluding FX.
**Adjusting for the positive impact of hail in Q4-10, Q4-11 SSSG was 4.7%.
3-year average SSSG: 5.4%
5-year average SSSG: 5.0%10-year average SSSG: 4.4%
18
19
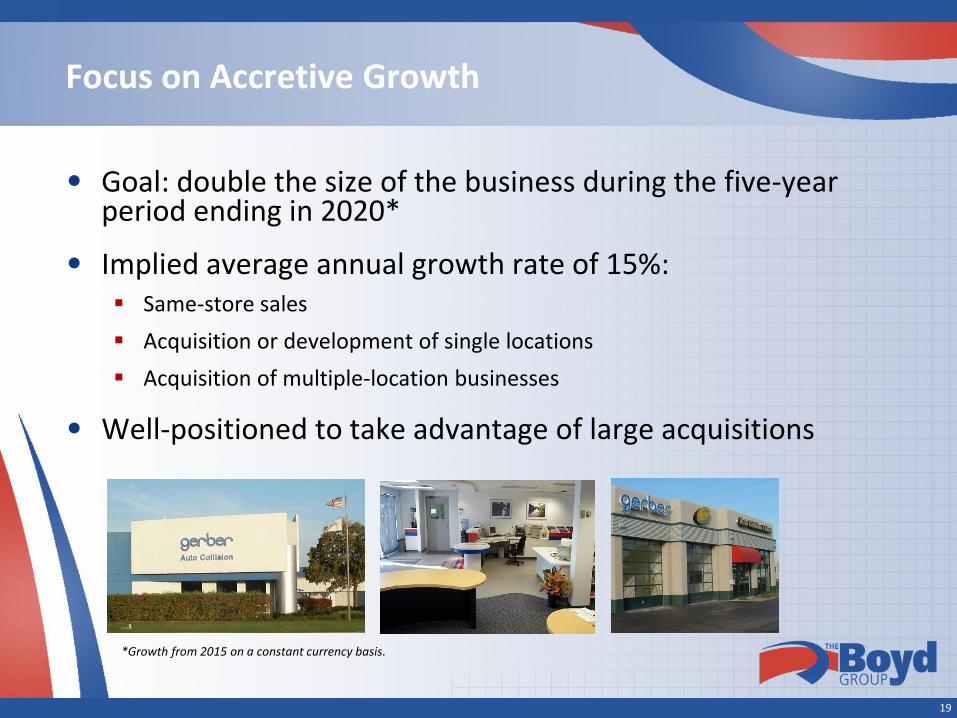
Focus on Accretive Growth
• Goal: double the size of the business during the five-year period ending in 2020*
• Implied average annual growth rate of 15%: Same-store sales
Acquisition or development of single locations
Acquisition of multiple-location businesses
• Well-positioned to take advantage of large acquisitions
*Growth from 2015 on a constant currency basis.
20
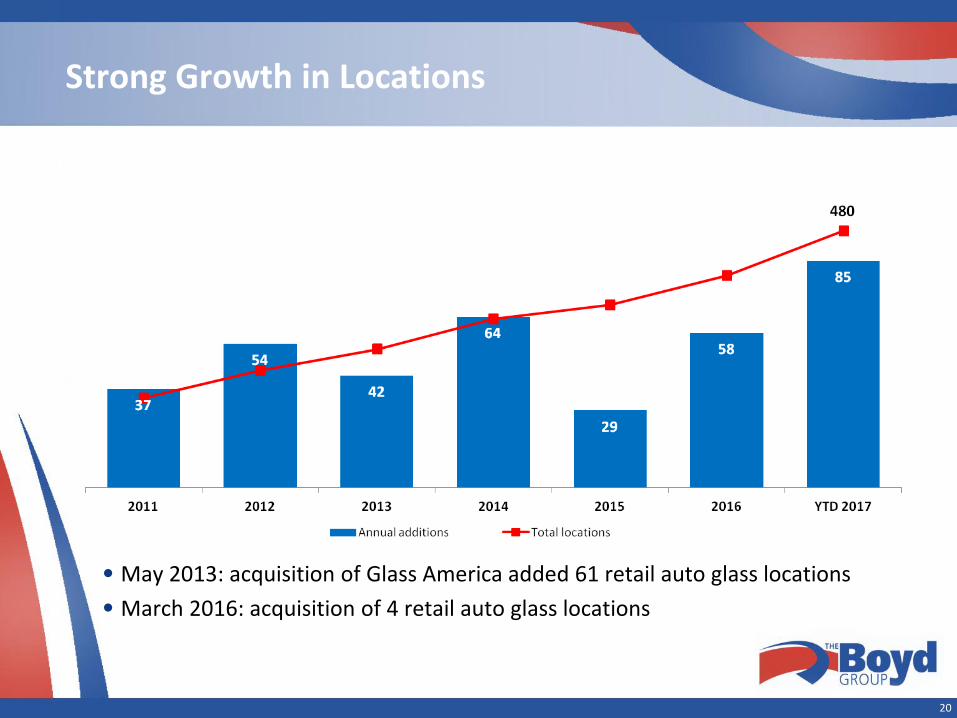
Strong Growth in Locations
• May 2013: acquisition of Glass America added 61 retail auto glass locations
• March 2016: acquisition of 4 retail auto glass locations
20

21
FinancialReview
21
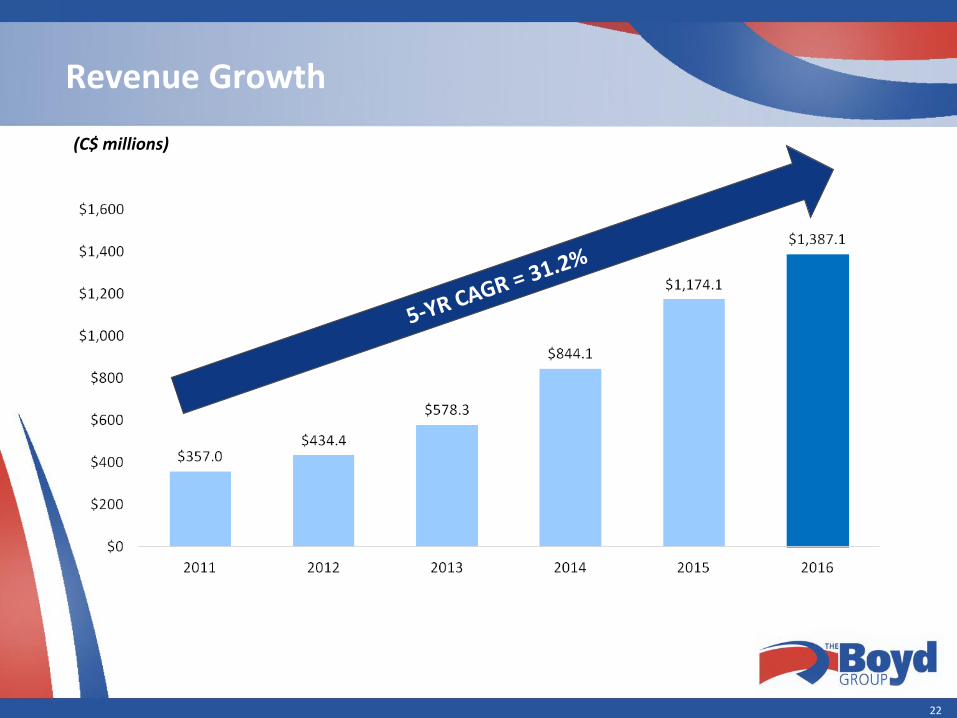
Revenue Growth
(C$ millions)
22
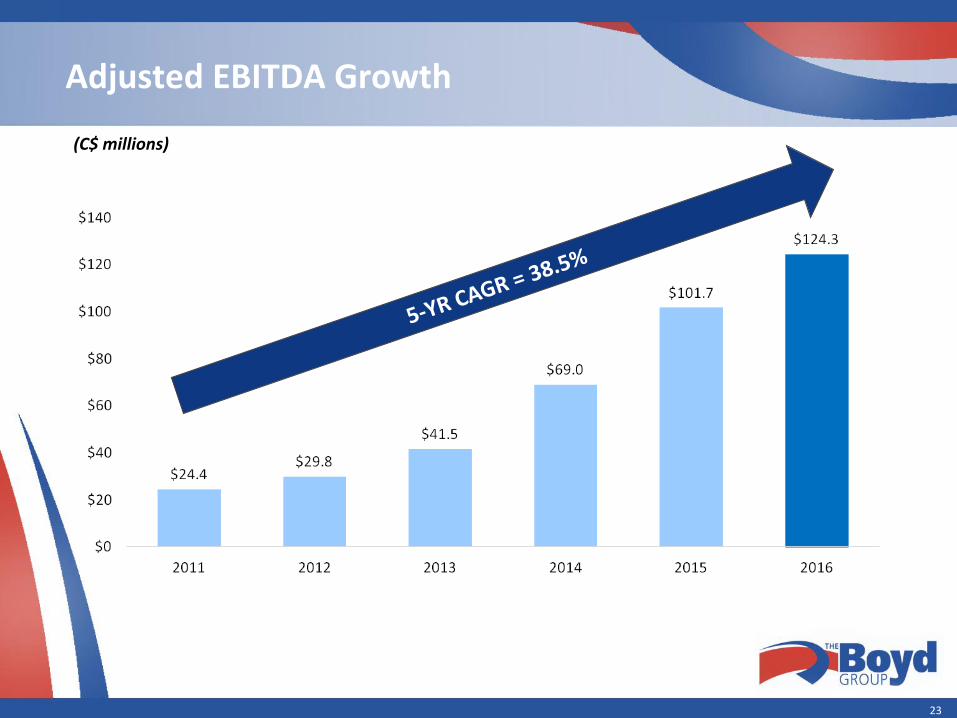
Adjusted EBITDA Growth
(C$ millions)
23

24
Financial Summary
(C$ millions, except per unit and percent amounts)
3-months ended 6-months ended
June 30,2017
June 30,2016
June 30,2017
June 30,2016
Sales $384.0 $331.0 $762.9 $681.4
Gross Profit $178.3 $152.7 $351.4 $310.8
Adjusted EBITDA* $35.5 $30.5 $68.3 $60.0
Adjusted EBITDA Margin* 9.2% 9.2% 8.9% 8.8%
Adjusted Net Earnings* $15.0 $13.6 $28.9 $26.5
Adjusted Net Earnings* per unit $0.831 $0.756 $1.602 $1.470
Adjusted Distributable Cash* $31.5 $29.8 $46.8 $33.6
Adjusted Distributable Cash* per average unit and Class A common share
$1.724 $1.630 $2.560 $1.840
Payout Ratio 7.5% 7.7% 10.1% 13.6%
Payout Ratio (TTM) 10.5% 12.2% 10.5% 12.2%
* Adjusted EBITDA, adjusted net earnings, and adjusted distributable cash are not recognized measures under International Financial Reporting Standards ("IFRS"). See the Fund’s 2017 Second Quarter MD&A for more information.
24
25
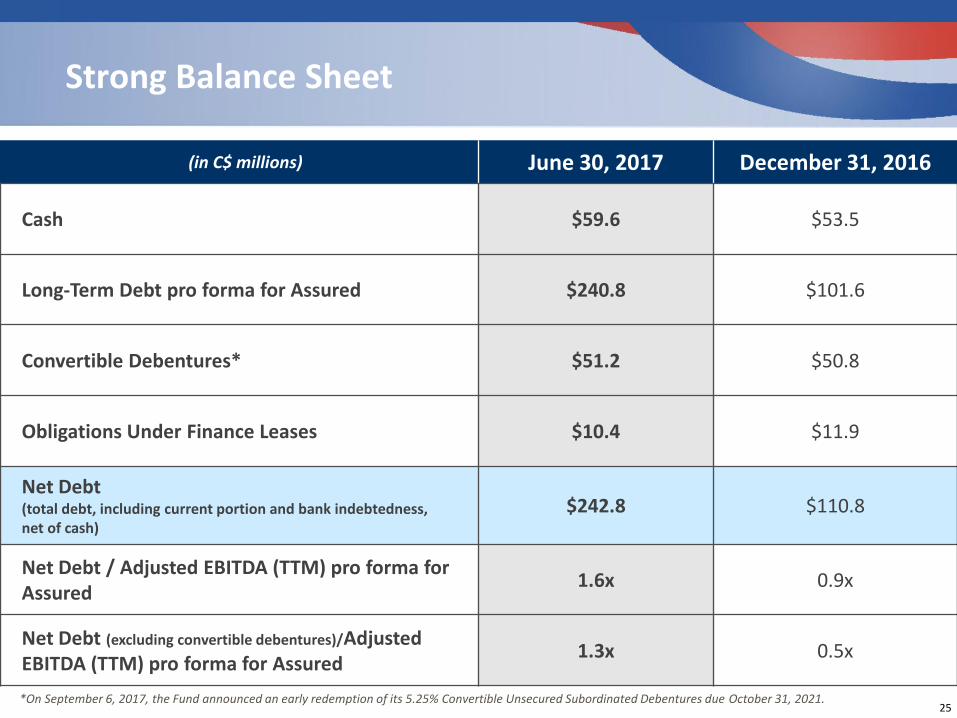
Strong Balance Sheet
(in C$ millions) June 30, 2017 December 31, 2016
Cash $59.6 $53.5
Long-Term Debt pro forma for Assured $240.8 $101.6
Convertible Debentures* $51.2 $50.8
Obligations Under Finance Leases $10.4 $11.9
Net Debt (total debt, including current portion and bank indebtedness, net of cash)
$242.8 $110.8
Net Debt / Adjusted EBITDA (TTM) pro forma for Assured
1.6x 0.9x
Net Debt (excluding convertible debentures)/Adjusted EBITDA (TTM) pro forma for Assured
1.3x 0.5x
25*On September 6, 2017, the Fund announced an early redemption of its 5.25% Convertible Unsecured Subordinated Debentures due October 31, 2021.

26
Financial Flexibility
• Cash of $59.6 million
• Net Debt to EBITDA TTM ratio of 1.6x pro forma for Assured
• 5-year committed facility of US$300 million which can increase to US$450 million with accordion feature, maturing May 2022
• Over $460 million in cash and available credit
• Only public company in the industry Access to all capital markets
27
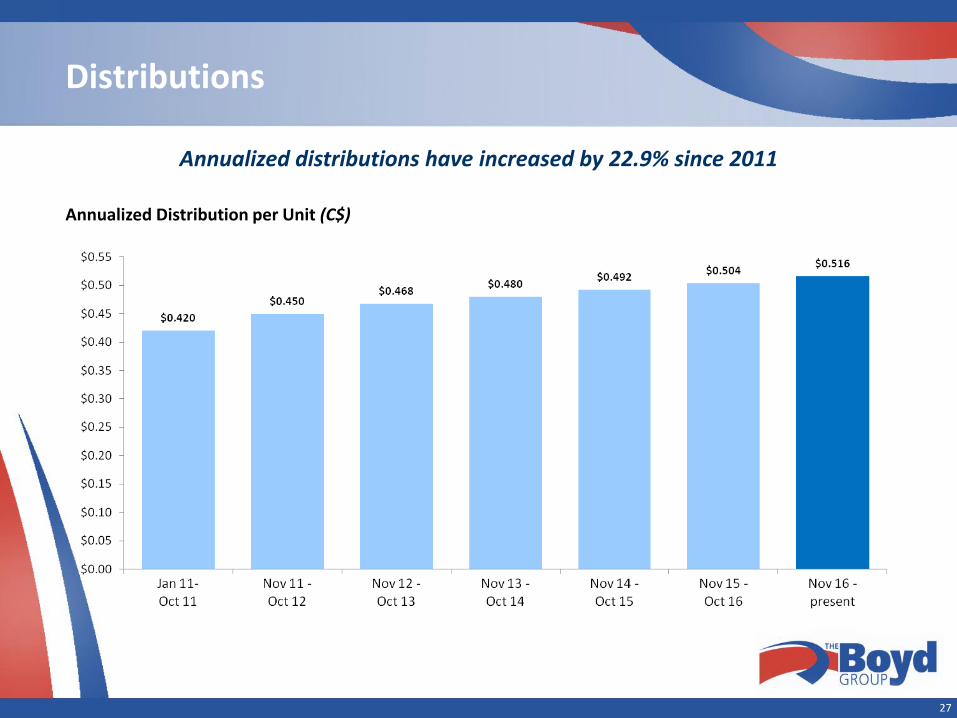
Distributions
Annualized Distribution per Unit (C$)
Annualized distributions have increased by 22.9% since 2011
27
28
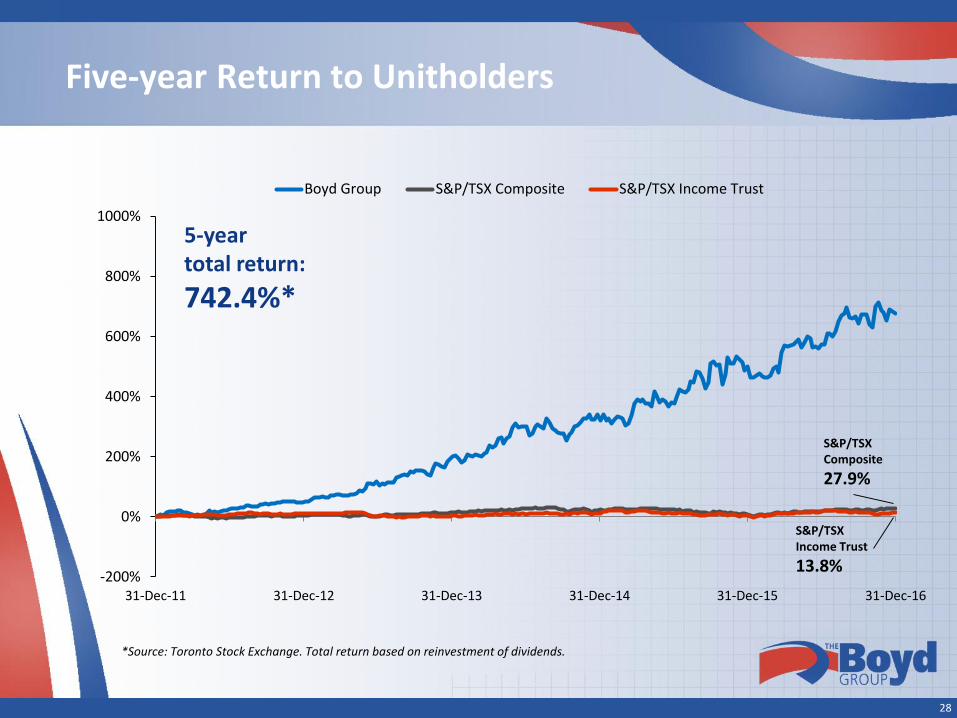
Five-year Return to Unitholders
-200%
0%
200%
400%
600%
800%
1000%
31-Dec-11 31-Dec-12 31-Dec-13 31-Dec-14 31-Dec-15 31-Dec-16
Boyd Group S&P/TSX Composite S&P/TSX Income Trust
5-year total return:
742.4%*
S&P/TSX Composite
27.9%
S&P/TSX Income Trust
13.8%
*Source: Toronto Stock Exchange. Total return based on reinvestment of dividends.

29
Delivering long-term value to unitholders
• Two consecutive years best 10-year performance on TSX
S&P/TSX Composite Index
+58.6%
BYD.UN
+9,966.5%
Source: Thomson One, includes reinvested distributions
2006-2016
S&P/TSX Composite Index
+15.4%
BYD.UN
+4,655%
2005-2015

30
Experienced & Committed Management Team
Brock BulbuckCEO
Pat PathipatiExecutive Vice-President & CFO
Tim O’DayPresident & COO
31
Acquisition of Assured Automotive: Transaction Highlights*
• Further establishes Boyd as a market leading collision repair provider in North America with 480 locations, over 7,300 employees and over $1.5B in 2016 proforma revenue
• Adds 68 locations in Canada, more than doubling current Canadian footprint Adds market-leading presence in the large Ontario market
• Adds a proven management team to Boyd’s senior management Five-year revenue CAGR of 24.7%
• Expected to be immediately accretive to earnings and cash flow
• Tax efficient acquisition structure with NPV of future tax savings of $26 million
• Initial Purchase Price of $193.6 million in cash and Fund units, representing a net of tax benefit valuation of 8.3 times adjusted EBITDA**. Final consideration increased to $200.8 million due to additional growth capital as well as an increase in the value of unit consideration from the time of announcement to closing ($88.31 to $96.15).
*The transaction was announced on May 29, 2017 and was completed July 4, 2017.** adjusted EBITDA for the trailing 12 months ended March 31, 2017, normalized for non-recurring expenses and post-closing synergies.
32
Ontario’s leading collision repair provider
• Founded 2004
• 68 locations, including 30 dealership service intake centers Unique dealership service centre intake location model
• FYE September 30, 2016 Sales: $141.0 million, Adjusted EBITDA (Normalized for non-recurring expenses): $17.8 million.
• TTM March 31, 2017 Sales: $150 million, Adjusted EBITDA (Normalized for non-recurring expenses): $18.2 million.
• Proven M&A strategy with 35 locations, including 17 intake centres, added since 2011
• Established DRP relationships with insurance clients
33
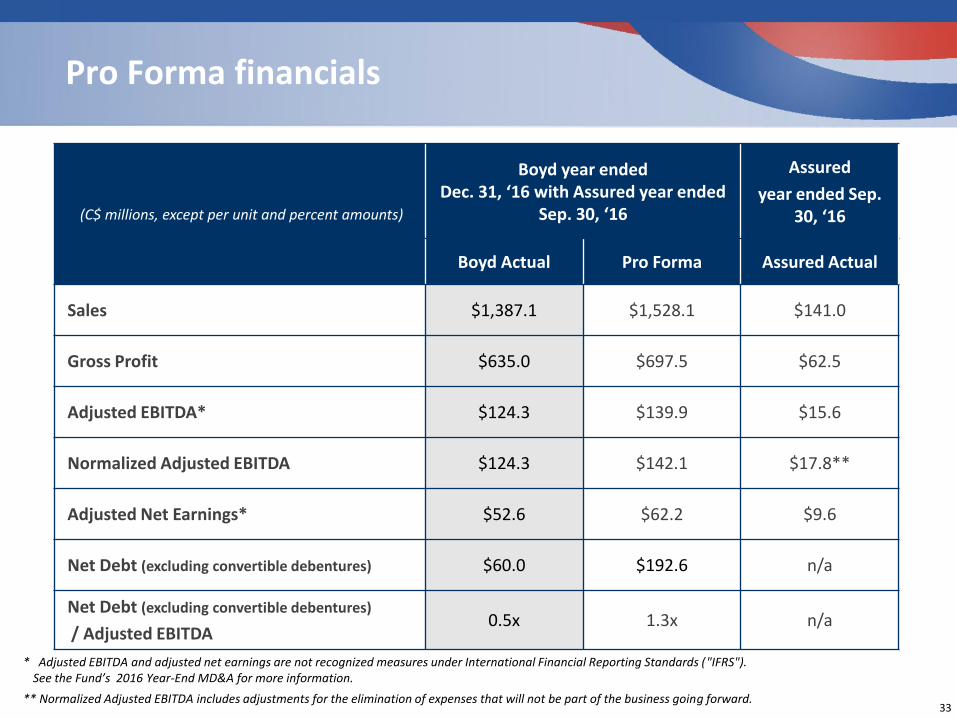
(C$ millions, except per unit and percent amounts)
Boyd year ended Dec. 31, ‘16 with Assured year ended
Sep. 30, ‘16
Assured
year ended Sep. 30, ‘16
Boyd Actual Pro Forma Assured Actual
Sales $1,387.1 $1,528.1 $141.0
Gross Profit $635.0 $697.5 $62.5
Adjusted EBITDA* $124.3 $139.9 $15.6
Normalized Adjusted EBITDA $124.3 $142.1 $17.8**
Adjusted Net Earnings* $52.6 $62.2 $9.6
Net Debt (excluding convertible debentures) $60.0 $192.6 n/a
Net Debt (excluding convertible debentures)
/ Adjusted EBITDA0.5x 1.3x n/a
* Adjusted EBITDA and adjusted net earnings are not recognized measures under International Financial Reporting Standards ("IFRS"). See the Fund’s 2016 Year-End MD&A for more information.
** Normalized Adjusted EBITDA includes adjustments for the elimination of expenses that will not be part of the business going forward.33
Pro Forma financials
34
Outlook
• Increase North American presence through:
Drive same-store sales growth through enhanced capacity utilization, development of DRP arrangements and leveraging existing major and regional insurance relationships
Acquire or develop new single locations as well as the acquisition of multi-location collision repair businesses
• Margin enhancement opportunities through operational excellence and leveraging scale over time
• Double size of the business during the five-year period ending in 2020*
*Growth from 2015 on a constant currency basis.
35
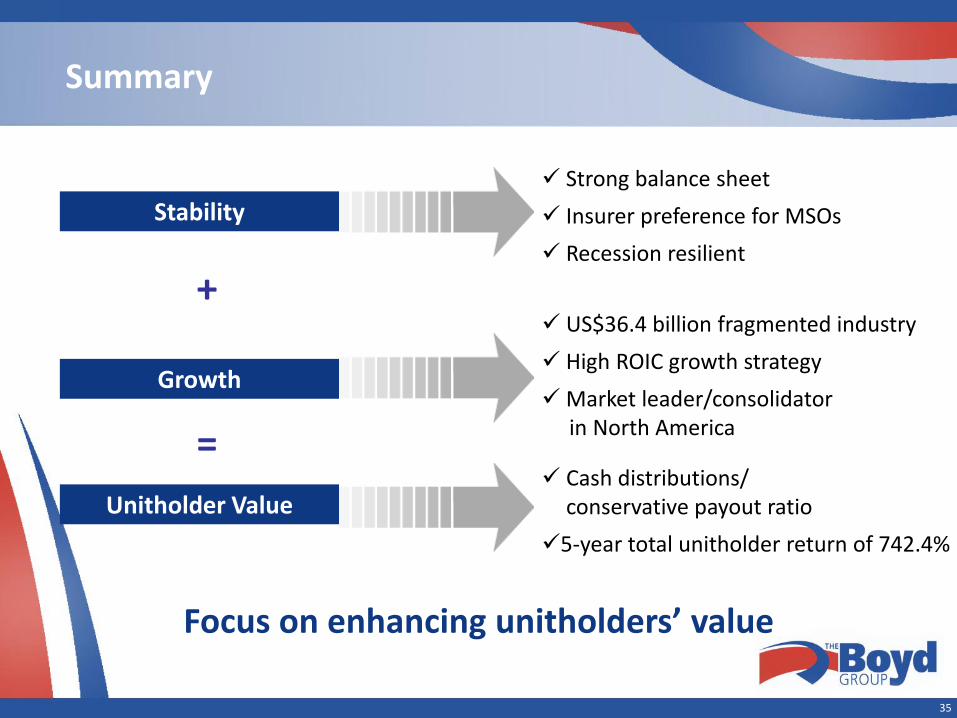
Summary
Stability
Unitholder Value
Growth
+
=
Strong balance sheet
Insurer preference for MSOs
Recession resilient
Cash distributions/conservative payout ratio
5-year total unitholder return of 742.4%
US$36.4 billion fragmented industry
High ROIC growth strategy
Market leader/consolidator in North America
Focus on enhancing unitholders’ value
35