Embed Size (px)
Citation preview
1
BP p.l.c. Group results First quarter 2016
FOR IMMEDIATE RELEASE London 26 April 2016
First Fourth First quarter quarter quarter $ million 2016 2015 2015 Profit (loss) for the period(a) (583) (3,307) 2,602 Inventory holding (gains) losses*, net of tax 98 1,074 (499) Replacement cost profit (loss)* (485) (2,233) 2,103 Net (favourable) unfavourable impact of non-operating items* and fair value accounting effects*, net of tax 1,017 2,429 474 Underlying replacement cost profit* 532 196 2,577 Replacement cost profit (loss) per ordinary share (cents) (2.63) (12.16) 11.54 per ADS (dollars) (0.16) (0.73) 0.69 Underlying replacement cost profit per ordinary share (cents) 2.88 1.06 14.14 per ADS (dollars) 0.17 0.06 0.85
• BP’s first-quarter replacement cost (RC) loss was $485 million, compared with a profit of $2,103 million a year ago. After adjusting for a net charge for non-operating items of $778 million and net unfavourable fair value accounting effects of $239 million (both on a post-tax basis), underlying RC profit for the first quarter was $532 million, compared with $2,577 million for the same period in 2015. Cumulative restructuring charges from the beginning of the fourth quarter 2014 totalled $1.9 billion by the end of the first quarter 2016.
• All amounts, including finance costs, relating to the Gulf of Mexico oil spill have been treated as non-operating items, with a net pre-tax charge of $917 million for the first quarter. The charge before interest and tax relating to the Gulf of Mexico oil spill is now reported in Other businesses and corporate, comparative amounts are also shown on this basis. For further information on the Gulf of Mexico oil spill and its consequences see page 9 and Note 2 on page 15. See also Legal proceedings on page 30.
• On 22 March, a motion to approve the Consent Decree relating to the agreements in principle to settle all outstanding federal and state claims arising from the 2010 Deepwater Horizon oil spill was filed by the US government with the district court. On 4 April, the district court approved the Consent Decree.
• Net cash provided by operating activities for the first quarter was $1.9 billion, the same as the equivalent period in 2015. Excluding amounts related to the Gulf of Mexico oil spill, net cash provided by operating activities for the first quarter was $3.0 billion, compared with $2.5 billion for the same period in 2015.
• Net debt* at 31 March 2016 was $30.0 billion, compared with $25.1 billion a year ago. The net debt ratio* at 31 March 2016 was 23.6%, compared with 21.6% at 31 December 2015 and 18.4% a year ago. Net debt and the net debt ratio are non-GAAP measures. See page 22 for more information. Following approval of the Consent Decree and finalization of the agreements described above, and to allow more flexibility in the current volatile price environment, we will revert to targeting a net debt ratio of 20-30%.
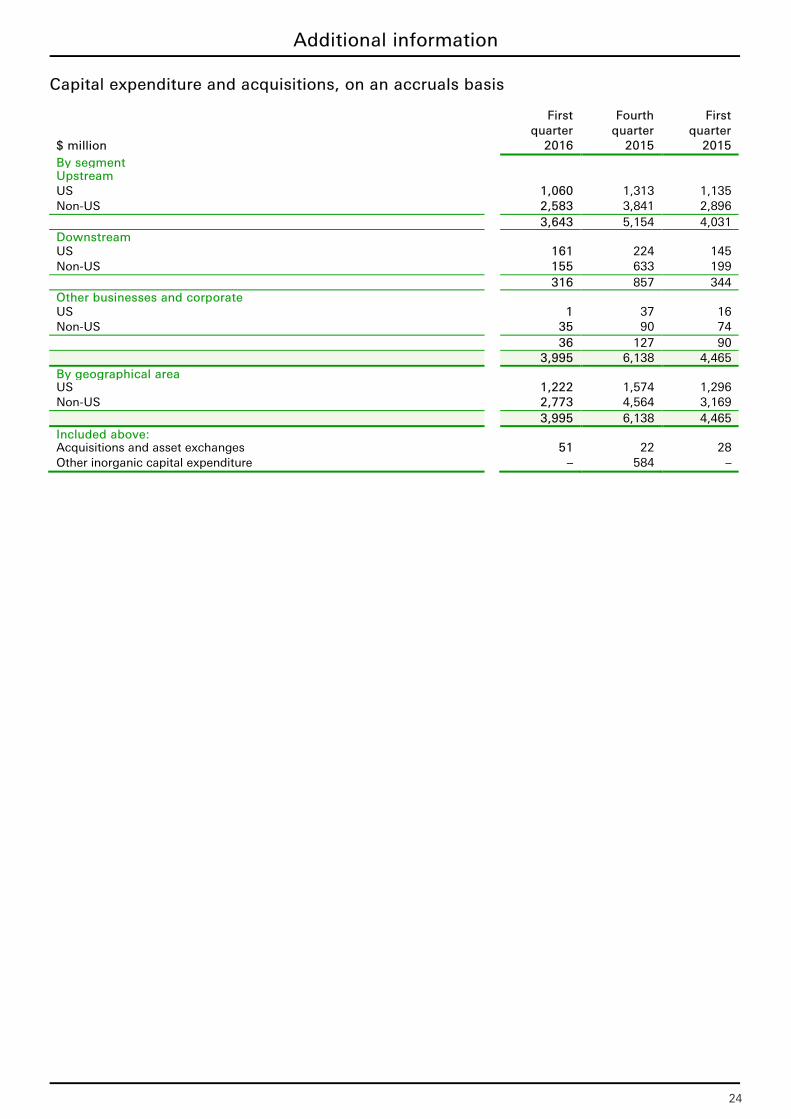
• Total capital expenditure on an accruals basis for the first quarter was $4.0 billion, of which organic capital expenditure* was $3.9 billion, compared with $4.5 billion for the same period in 2015, of which organic capital expenditure was $4.4 billion. See page 24 for further information. We expect organic capital expenditure to be around $17 billion for 2016.
• Disposal proceeds were $1.1 billion for the first quarter, compared with $1.7 billion for the same period in 2015.
• The effective tax rate (ETR) on RC profit or loss for the first quarter was 37%, compared with -42% for the same period in 2015. Adjusting for non-operating items and fair value accounting effects and a one-off adjustment as a result of the reduction in the rate of the UK North Sea supplementary charge in 2015, the underlying ETR for the first quarter was 18%, compared with 21% for the same period in 2015. The underlying ETR for the first quarter was lower than a year ago mainly due to changes in the mix of profits and foreign exchange effects from a weaker US dollar.
• BP today announced a quarterly dividend of 10.00 cents per ordinary share ($0.600 per ADS), which is expected to be paid on 17 June 2016. The corresponding amount in sterling will be announced on 7 June 2016. See page 22 for further information.
*
For items marked with an asterisk throughout this document, definitions are provided in the Glossary on page 28.
(a) Profit attributable to BP shareholders.
The commentaries above should be read in conjunction with the cautionary statement on page 31.

2
THIS PAGE IS INTENTIONALLY LEFT BLANK
3
Analysis of RC profit (loss) before interest and tax and reconciliation to profit (loss) for the period
First Fourth First
quarter quarter quarter $ million
2016 2015 2015
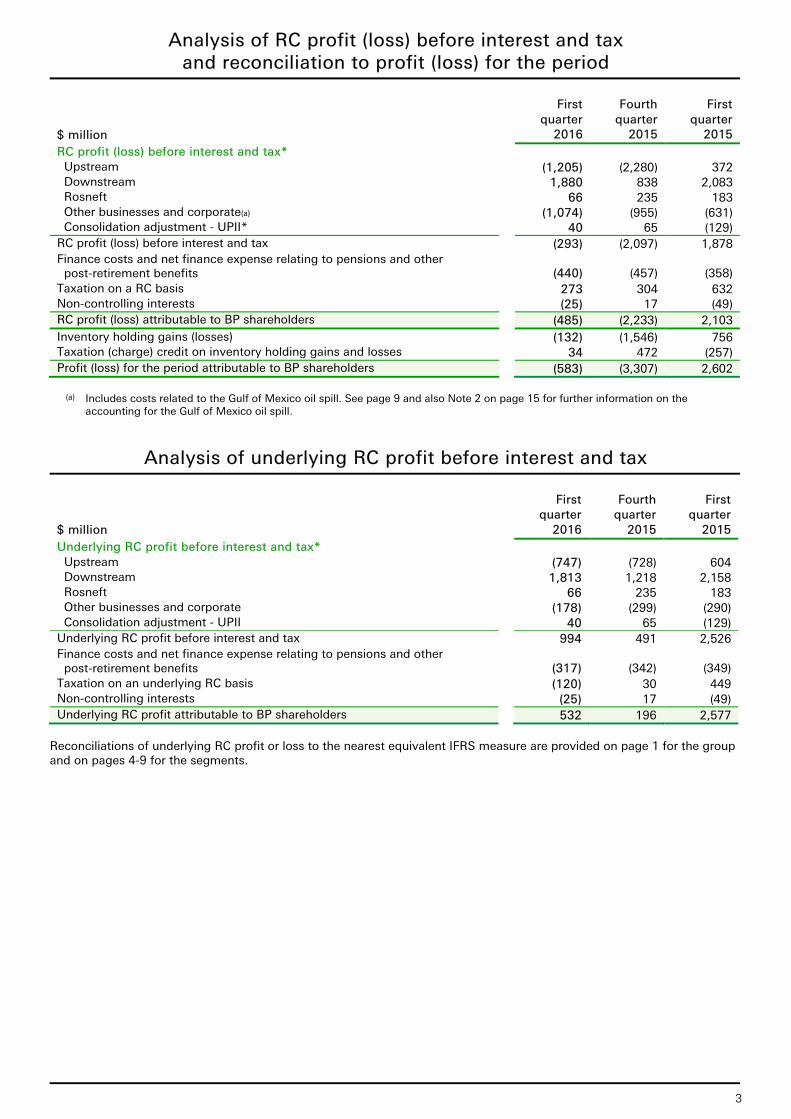
RC profit (loss) before interest and tax* Upstream (1,205) (2,280) 372 Downstream 1,880 838 2,083 Rosneft
66 235 183
Other businesses and corporate(a)
(1,074) (955) (631) Consolidation adjustment - UPII*
40 65 (129)
RC profit (loss) before interest and tax
(293) (2,097) 1,878 Finance costs and net finance expense relating to pensions and other
post-retirement benefits (440) (457) (358) Taxation on a RC basis
273 304 632
Non-controlling interests
(25) 17 (49) RC profit (loss) attributable to BP shareholders
(485) (2,233) 2,103
Inventory holding gains (losses)
(132) (1,546) 756 Taxation (charge) credit on inventory holding gains and losses
34 472 (257)
Profit (loss) for the period attributable to BP shareholders
(583) (3,307) 2,602
(a) Includes costs related to the Gulf of Mexico oil spill. See page 9 and also Note 2 on page 15 for further information on the accounting for the Gulf of Mexico oil spill.
Analysis of underlying RC profit before interest and tax
First Fourth First
quarter quarter quarter $ million
2016 2015 2015
Underlying RC profit before interest and tax* Upstream (747) (728) 604 Downstream 1,813 1,218 2,158 Rosneft
66 235 183
Other businesses and corporate
(178) (299) (290) Consolidation adjustment - UPII
40 65 (129)
Underlying RC profit before interest and tax
994 491 2,526 Finance costs and net finance expense relating to pensions and other
post-retirement benefits
(317) (342) (349) Taxation on an underlying RC basis
(120) 30 449
Non-controlling interests
(25) 17 (49) Underlying RC profit attributable to BP shareholders
532 196 2,577
Reconciliations of underlying RC profit or loss to the nearest equivalent IFRS measure are provided on page 1 for the group and on pages 4-9 for the segments.
4
Upstream
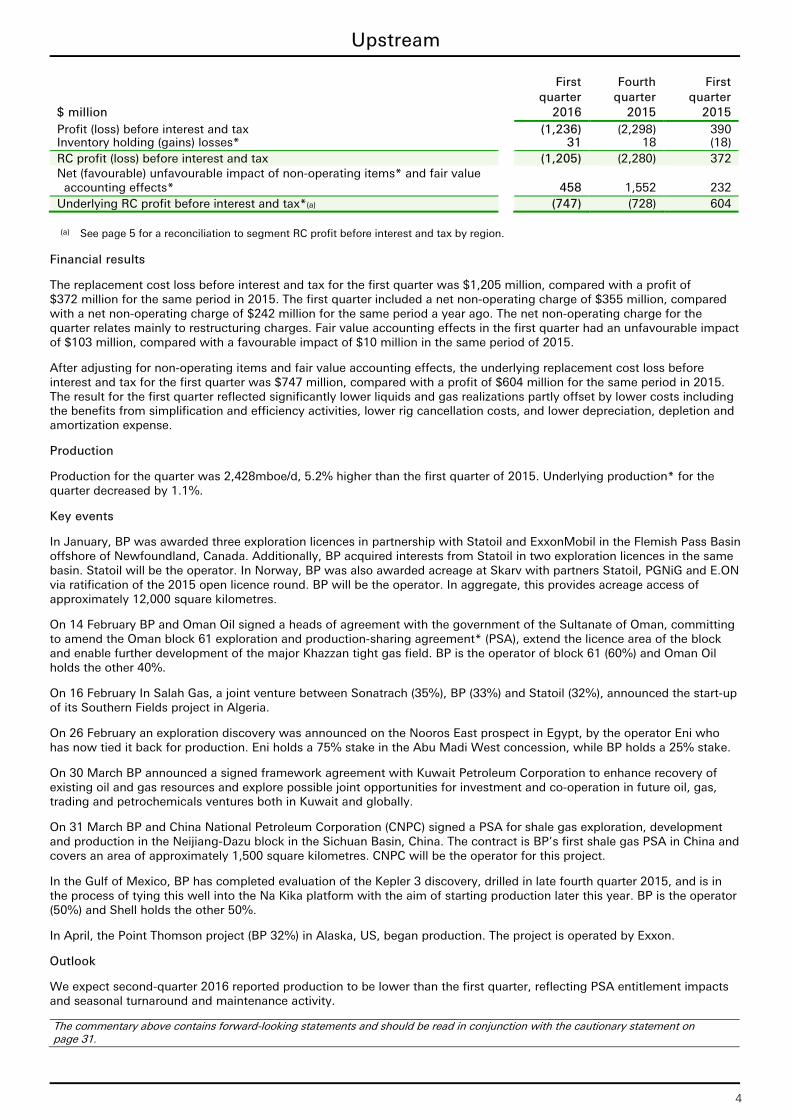
First Fourth First quarter quarter quarter $ million 2016 2015 2015 Profit (loss) before interest and tax (1,236) (2,298) 390 Inventory holding (gains) losses* 31 18 (18) RC profit (loss) before interest and tax (1,205) (2,280) 372 Net (favourable) unfavourable impact of non-operating items* and fair value accounting effects* 458 1,552 232 Underlying RC profit before interest and tax*(a) (747) (728) 604
(a) See page 5 for a reconciliation to segment RC profit before interest and tax by region.
Financial results
The replacement cost loss before interest and tax for the first quarter was $1,205 million, compared with a profit of $372 million for the same period in 2015. The first quarter included a net non-operating charge of $355 million, compared with a net non-operating charge of $242 million for the same period a year ago. The net non-operating charge for the quarter relates mainly to restructuring charges. Fair value accounting effects in the first quarter had an unfavourable impact of $103 million, compared with a favourable impact of $10 million in the same period of 2015.
After adjusting for non-operating items and fair value accounting effects, the underlying replacement cost loss before interest and tax for the first quarter was $747 million, compared with a profit of $604 million for the same period in 2015. The result for the first quarter reflected significantly lower liquids and gas realizations partly offset by lower costs including the benefits from simplification and efficiency activities, lower rig cancellation costs, and lower depreciation, depletion and amortization expense.
Production
Production for the quarter was 2,428mboe/d, 5.2% higher than the first quarter of 2015. Underlying production* for the quarter decreased by 1.1%.
Key events
In January, BP was awarded three exploration licences in partnership with Statoil and ExxonMobil in the Flemish Pass Basin offshore of Newfoundland, Canada. Additionally, BP acquired interests from Statoil in two exploration licences in the same basin. Statoil will be the operator. In Norway, BP was also awarded acreage at Skarv with partners Statoil, PGNiG and E.ON via ratification of the 2015 open licence round. BP will be the operator. In aggregate, this provides acreage access of approximately 12,000 square kilometres.
On 14 February BP and Oman Oil signed a heads of agreement with the government of the Sultanate of Oman, committing to amend the Oman block 61 exploration and production-sharing agreement* (PSA), extend the licence area of the block and enable further development of the major Khazzan tight gas field. BP is the operator of block 61 (60%) and Oman Oil holds the other 40%.
On 16 February In Salah Gas, a joint venture between Sonatrach (35%), BP (33%) and Statoil (32%), announced the start-up of its Southern Fields project in Algeria.
On 26 February an exploration discovery was announced on the Nooros East prospect in Egypt, by the operator Eni who has now tied it back for production. Eni holds a 75% stake in the Abu Madi West concession, while BP holds a 25% stake.
On 30 March BP announced a signed framework agreement with Kuwait Petroleum Corporation to enhance recovery of existing oil and gas resources and explore possible joint opportunities for investment and co-operation in future oil, gas, trading and petrochemicals ventures both in Kuwait and globally.
On 31 March BP and China National Petroleum Corporation (CNPC) signed a PSA for shale gas exploration, development and production in the Neijiang-Dazu block in the Sichuan Basin, China. The contract is BP’s first shale gas PSA in China and covers an area of approximately 1,500 square kilometres. CNPC will be the operator for this project.
In the Gulf of Mexico, BP has completed evaluation of the Kepler 3 discovery, drilled in late fourth quarter 2015, and is in the process of tying this well into the Na Kika platform with the aim of starting production later this year. BP is the operator (50%) and Shell holds the other 50%.
In April, the Point Thomson project (BP 32%) in Alaska, US, began production. The project is operated by Exxon.
Outlook
We expect second-quarter 2016 reported production to be lower than the first quarter, reflecting PSA entitlement impacts and seasonal turnaround and maintenance activity. The commentary above contains forward-looking statements and should be read in conjunction with the cautionary statement on page 31.
5
Upstream
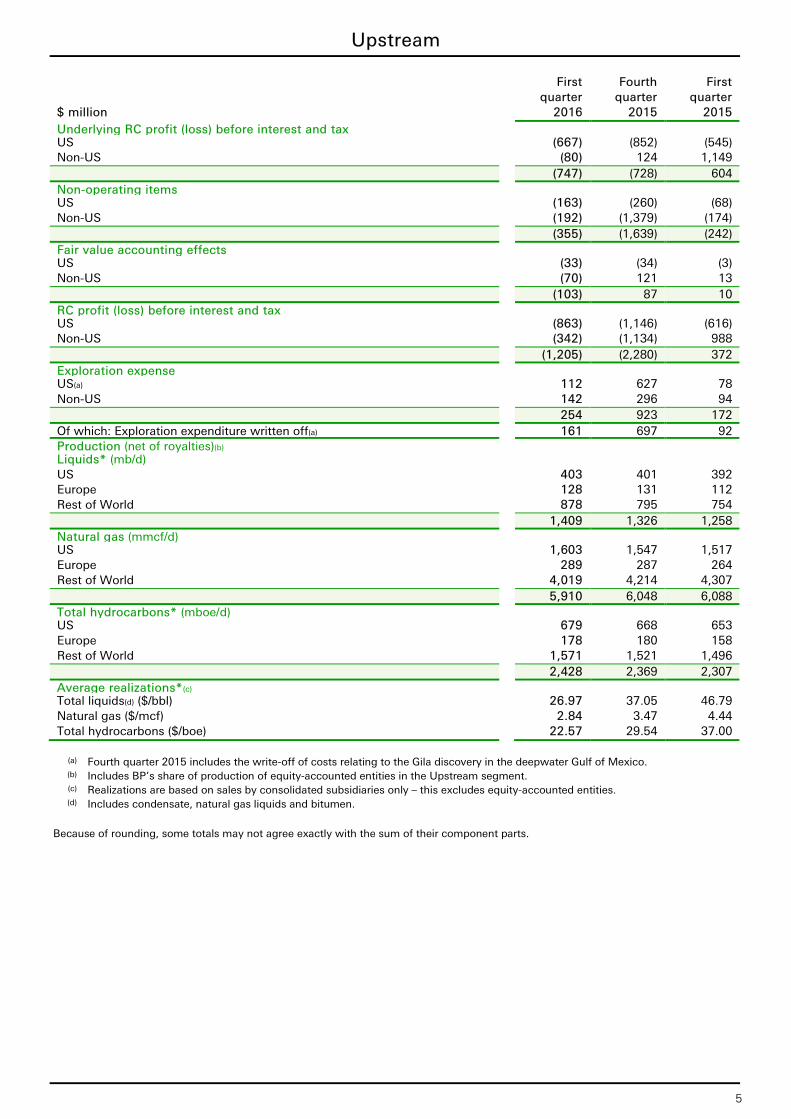
First Fourth First quarter quarter quarter $ million 2016 2015 2015 Underlying RC profit (loss) before interest and tax US (667) (852) (545) Non-US (80) 124 1,149 (747) (728) 604 Non-operating items US (163) (260) (68) Non-US (192) (1,379) (174) (355) (1,639) (242) Fair value accounting effects US (33) (34) (3) Non-US (70) 121 13 (103) 87 10 RC profit (loss) before interest and tax US (863) (1,146) (616) Non-US (342) (1,134) 988 (1,205) (2,280) 372 Exploration expense US(a) 112 627 78 Non-US 142 296 94 254 923 172 Of which: Exploration expenditure written off(a) 161 697 92 Production (net of royalties)(b) Liquids* (mb/d) US 403 401 392 Europe 128 131 112 Rest of World 878 795 754 1,409 1,326 1,258 Natural gas (mmcf/d) US 1,603 1,547 1,517 Europe 289 287 264 Rest of World 4,019 4,214 4,307 5,910 6,048 6,088 Total hydrocarbons* (mboe/d) US 679 668 653 Europe 178 180 158 Rest of World 1,571 1,521 1,496 2,428 2,369 2,307 Average realizations*(c) Total liquids(d) ($/bbl) 26.97 37.05 46.79 Natural gas ($/mcf) 2.84 3.47 4.44 Total hydrocarbons ($/boe) 22.57 29.54 37.00
(a) Fourth quarter 2015 includes the write-off of costs relating to the Gila discovery in the deepwater Gulf of Mexico. (b) Includes BP’s share of production of equity-accounted entities in the Upstream segment. (c) Realizations are based on sales by consolidated subsidiaries only – this excludes equity-accounted entities. (d) Includes condensate, natural gas liquids and bitumen.
Because of rounding, some totals may not agree exactly with the sum of their component parts.
6
Downstream
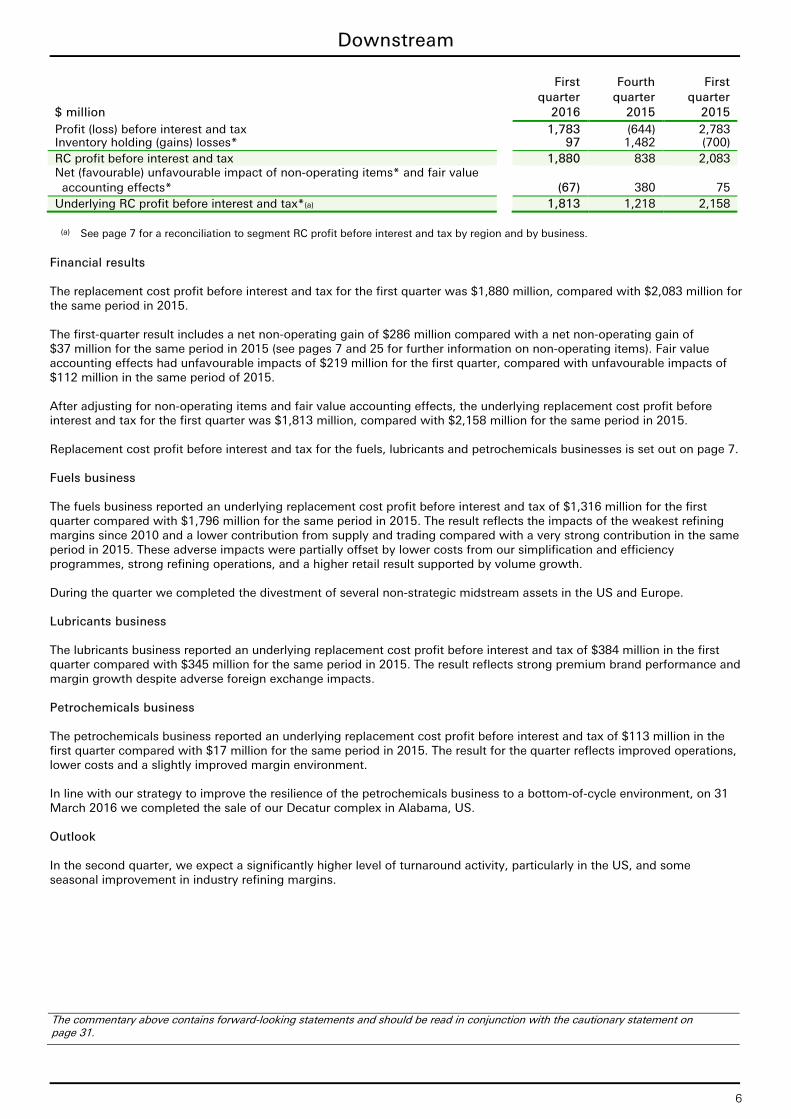
First Fourth First quarter quarter quarter $ million 2016 2015 2015 Profit (loss) before interest and tax 1,783 (644) 2,783 Inventory holding (gains) losses* 97 1,482 (700) RC profit before interest and tax 1,880 838 2,083 Net (favourable) unfavourable impact of non-operating items* and fair value accounting effects* (67) 380 75 Underlying RC profit before interest and tax*(a) 1,813 1,218 2,158
(a) See page 7 for a reconciliation to segment RC profit before interest and tax by region and by business.
Financial results The replacement cost profit before interest and tax for the first quarter was $1,880 million, compared with $2,083 million for the same period in 2015. The first-quarter result includes a net non-operating gain of $286 million compared with a net non-operating gain of $37 million for the same period in 2015 (see pages 7 and 25 for further information on non-operating items). Fair value accounting effects had unfavourable impacts of $219 million for the first quarter, compared with unfavourable impacts of $112 million in the same period of 2015. After adjusting for non-operating items and fair value accounting effects, the underlying replacement cost profit before interest and tax for the first quarter was $1,813 million, compared with $2,158 million for the same period in 2015. Replacement cost profit before interest and tax for the fuels, lubricants and petrochemicals businesses is set out on page 7. Fuels business The fuels business reported an underlying replacement cost profit before interest and tax of $1,316 million for the first quarter compared with $1,796 million for the same period in 2015. The result reflects the impacts of the weakest refining margins since 2010 and a lower contribution from supply and trading compared with a very strong contribution in the same period in 2015. These adverse impacts were partially offset by lower costs from our simplification and efficiency programmes, strong refining operations, and a higher retail result supported by volume growth. During the quarter we completed the divestment of several non-strategic midstream assets in the US and Europe. Lubricants business The lubricants business reported an underlying replacement cost profit before interest and tax of $384 million in the first quarter compared with $345 million for the same period in 2015. The result reflects strong premium brand performance and margin growth despite adverse foreign exchange impacts. Petrochemicals business The petrochemicals business reported an underlying replacement cost profit before interest and tax of $113 million in the first quarter compared with $17 million for the same period in 2015. The result for the quarter reflects improved operations, lower costs and a slightly improved margin environment. In line with our strategy to improve the resilience of the petrochemicals business to a bottom-of-cycle environment, on 31 March 2016 we completed the sale of our Decatur complex in Alabama, US. Outlook In the second quarter, we expect a significantly higher level of turnaround activity, particularly in the US, and some seasonal improvement in industry refining margins. The commentary above contains forward-looking statements and should be read in conjunction with the cautionary statement on page 31.
7
Downstream
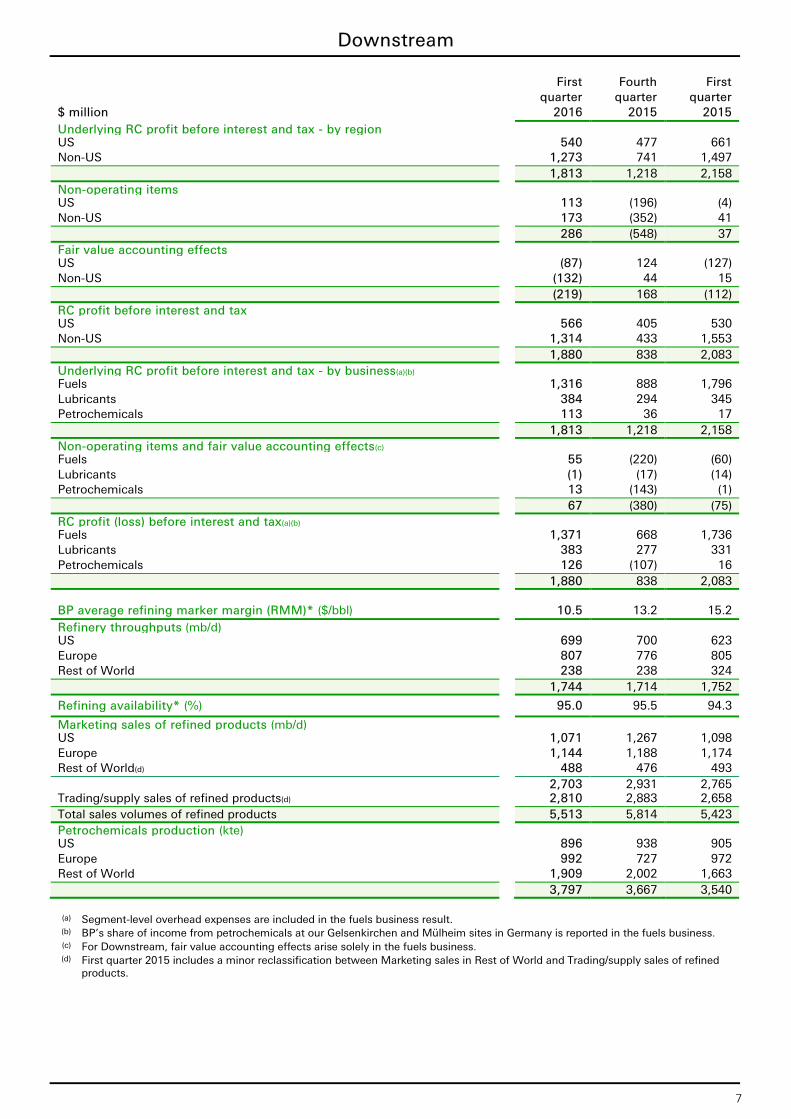
First Fourth First quarter quarter quarter $ million 2016 2015 2015 Underlying RC profit before interest and tax - by region US 540 477 661 Non-US 1,273 741 1,497 1,813 1,218 2,158 Non-operating items US 113 (196) (4) Non-US 173 (352) 41 286 (548) 37 Fair value accounting effects US (87) 124 (127) Non-US (132) 44 15 (219) 168 (112) RC profit before interest and tax US 566 405 530 Non-US 1,314 433 1,553 1,880 838 2,083 Underlying RC profit before interest and tax - by business(a)(b) Fuels 1,316 888 1,796 Lubricants 384 294 345 Petrochemicals 113 36 17 1,813 1,218 2,158 Non-operating items and fair value accounting effects(c) Fuels 55 (220) (60) Lubricants (1) (17) (14) Petrochemicals 13 (143) (1) 67 (380) (75) RC profit (loss) before interest and tax(a)(b) Fuels 1,371 668 1,736 Lubricants 383 277 331 Petrochemicals 126 (107) 16 1,880 838 2,083 BP average refining marker margin (RMM)* ($/bbl) 10.5 13.2 15.2 Refinery throughputs (mb/d) US 699 700 623 Europe 807 776 805 Rest of World 238 238 324 1,744 1,714 1,752
Refining availability* (%) 95.0 95.5 94.3
Marketing sales of refined products (mb/d) US 1,071 1,267 1,098 Europe 1,144 1,188 1,174 Rest of World(d) 488 476 493 2,703 2,931 2,765 Trading/supply sales of refined products(d) 2,810 2,883 2,658 Total sales volumes of refined products 5,513 5,814 5,423 Petrochemicals production (kte) US 896 938 905 Europe 992 727 972 Rest of World 1,909 2,002 1,663 3,797 3,667 3,540
(a) Segment-level overhead expenses are included in the fuels business result. (b) BP’s share of income from petrochemicals at our Gelsenkirchen and Mülheim sites in Germany is reported in the fuels business. (c) For Downstream, fair value accounting effects arise solely in the fuels business. (d) First quarter 2015 includes a minor reclassification between Marketing sales in Rest of World and Trading/supply sales of refined
products.
8
Rosneft
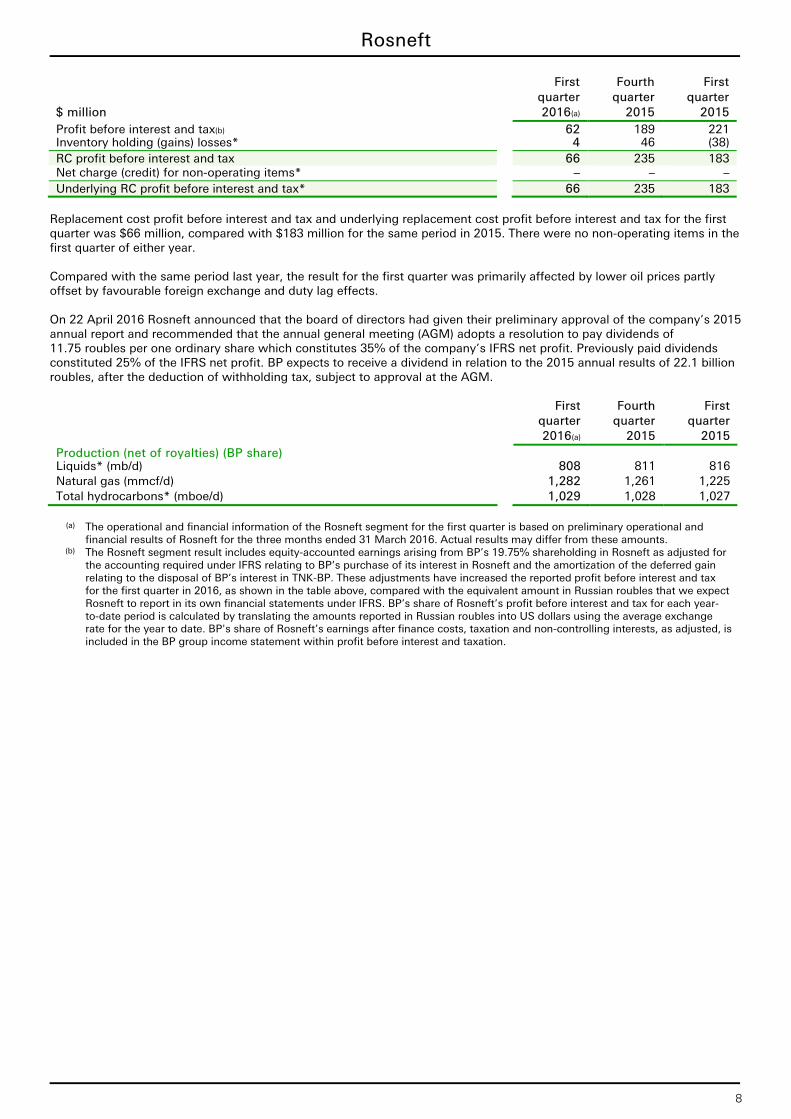
First Fourth First quarter quarter quarter $ million 2016(a) 2015 2015 Profit before interest and tax(b) 62 189 221 Inventory holding (gains) losses* 4 46 (38) RC profit before interest and tax 66 235 183 Net charge (credit) for non-operating items* – – – Underlying RC profit before interest and tax* 66 235 183
Replacement cost profit before interest and tax and underlying replacement cost profit before interest and tax for the first quarter was $66 million, compared with $183 million for the same period in 2015. There were no non-operating items in the first quarter of either year. Compared with the same period last year, the result for the first quarter was primarily affected by lower oil prices partly offset by favourable foreign exchange and duty lag effects. On 22 April 2016 Rosneft announced that the board of directors had given their preliminary approval of the company’s 2015 annual report and recommended that the annual general meeting (AGM) adopts a resolution to pay dividends of 11.75 roubles per one ordinary share which constitutes 35% of the company’s IFRS net profit. Previously paid dividends constituted 25% of the IFRS net profit. BP expects to receive a dividend in relation to the 2015 annual results of 22.1 billion roubles, after the deduction of withholding tax, subject to approval at the AGM. First Fourth First quarter quarter quarter 2016(a) 2015 2015 Production (net of royalties) (BP share) Liquids* (mb/d) 808 811 816 Natural gas (mmcf/d) 1,282 1,261 1,225 Total hydrocarbons* (mboe/d) 1,029 1,028 1,027
(a) The operational and financial information of the Rosneft segment for the first quarter is based on preliminary operational and
financial results of Rosneft for the three months ended 31 March 2016. Actual results may differ from these amounts. (b) The Rosneft segment result includes equity-accounted earnings arising from BP’s 19.75% shareholding in Rosneft as adjusted for
the accounting required under IFRS relating to BP’s purchase of its interest in Rosneft and the amortization of the deferred gain relating to the disposal of BP’s interest in TNK-BP. These adjustments have increased the reported profit before interest and tax for the first quarter in 2016, as shown in the table above, compared with the equivalent amount in Russian roubles that we expect Rosneft to report in its own financial statements under IFRS. BP’s share of Rosneft’s profit before interest and tax for each year-to-date period is calculated by translating the amounts reported in Russian roubles into US dollars using the average exchange rate for the year to date. BP's share of Rosneft’s earnings after finance costs, taxation and non-controlling interests, as adjusted, is included in the BP group income statement within profit before interest and taxation.
9
Other businesses and corporate
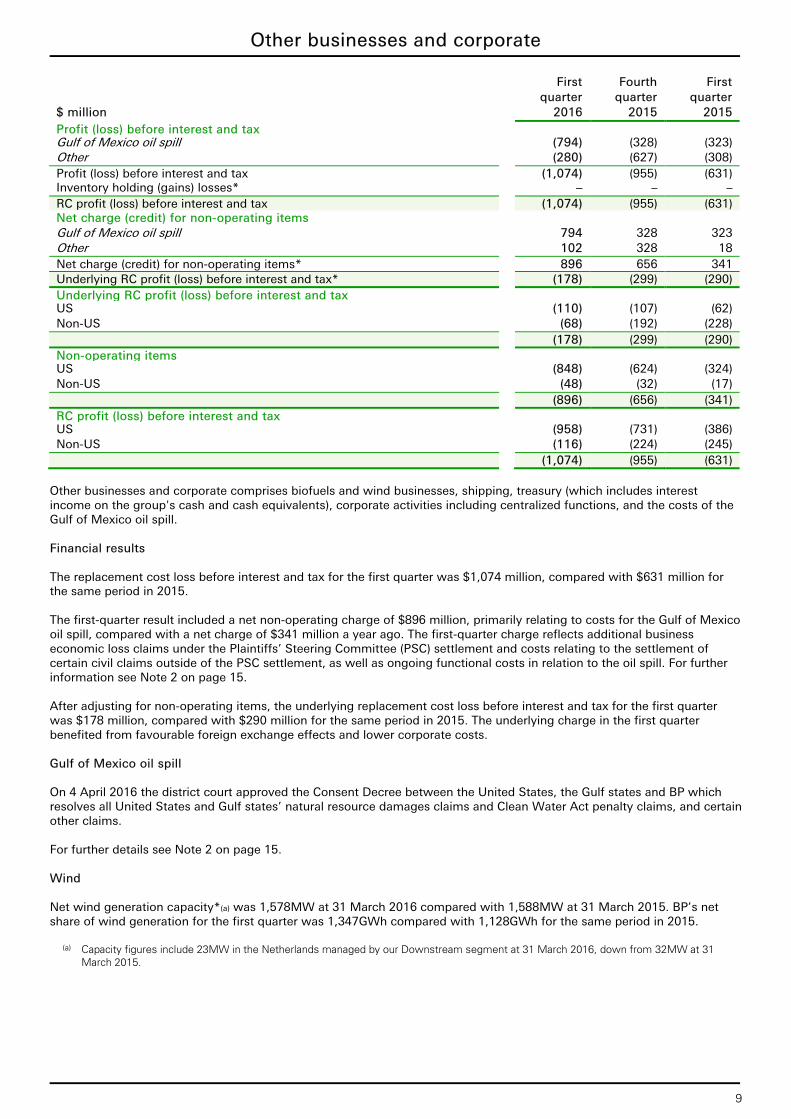
First Fourth First quarter quarter quarter $ million 2016 2015 2015 Profit (loss) before interest and tax Gulf of Mexico oil spill (794) (328) (323) Other (280) (627) (308) Profit (loss) before interest and tax (1,074) (955) (631) Inventory holding (gains) losses* – – – RC profit (loss) before interest and tax (1,074) (955) (631) Net charge (credit) for non-operating items Gulf of Mexico oil spill 794 328 323 Other 102 328 18 Net charge (credit) for non-operating items* 896 656 341 Underlying RC profit (loss) before interest and tax* (178) (299) (290) Underlying RC profit (loss) before interest and tax US (110) (107) (62) Non-US (68) (192) (228) (178) (299) (290) Non-operating items US (848) (624) (324) Non-US (48) (32) (17) (896) (656) (341) RC profit (loss) before interest and tax US (958) (731) (386) Non-US (116) (224) (245) (1,074) (955) (631)
Other businesses and corporate comprises biofuels and wind businesses, shipping, treasury (which includes interest income on the group's cash and cash equivalents), corporate activities including centralized functions, and the costs of the Gulf of Mexico oil spill. Financial results The replacement cost loss before interest and tax for the first quarter was $1,074 million, compared with $631 million for the same period in 2015. The first-quarter result included a net non-operating charge of $896 million, primarily relating to costs for the Gulf of Mexico oil spill, compared with a net charge of $341 million a year ago. The first-quarter charge reflects additional business economic loss claims under the Plaintiffs’ Steering Committee (PSC) settlement and costs relating to the settlement of certain civil claims outside of the PSC settlement, as well as ongoing functional costs in relation to the oil spill. For further information see Note 2 on page 15. After adjusting for non-operating items, the underlying replacement cost loss before interest and tax for the first quarter was $178 million, compared with $290 million for the same period in 2015. The underlying charge in the first quarter benefited from favourable foreign exchange effects and lower corporate costs. Gulf of Mexico oil spill On 4 April 2016 the district court approved the Consent Decree between the United States, the Gulf states and BP which resolves all United States and Gulf states’ natural resource damages claims and Clean Water Act penalty claims, and certain other claims. For further details see Note 2 on page 15. Wind Net wind generation capacity*(a) was 1,578MW at 31 March 2016 compared with 1,588MW at 31 March 2015. BP’s net share of wind generation for the first quarter was 1,347GWh compared with 1,128GWh for the same period in 2015.
(a) Capacity figures include 23MW in the Netherlands managed by our Downstream segment at 31 March 2016, down from 32MW at 31 March 2015.
10
Financial statements
Group income statement
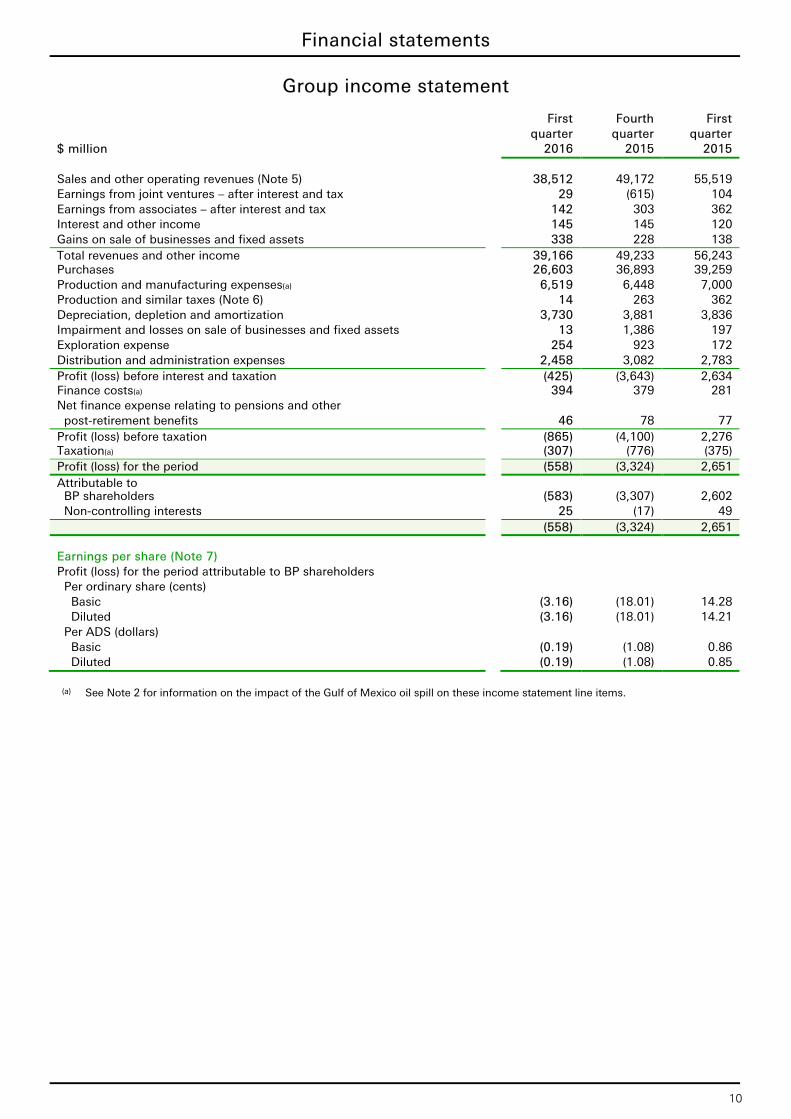
First Fourth First quarter quarter quarter $ million 2016 2015 2015 Sales and other operating revenues (Note 5) 38,512 49,172 55,519 Earnings from joint ventures – after interest and tax 29 (615) 104 Earnings from associates – after interest and tax 142 303 362 Interest and other income 145 145 120 Gains on sale of businesses and fixed assets 338 228 138 Total revenues and other income 39,166 49,233 56,243 Purchases 26,603 36,893 39,259 Production and manufacturing expenses(a) 6,519 6,448 7,000 Production and similar taxes (Note 6) 14 263 362 Depreciation, depletion and amortization 3,730 3,881 3,836 Impairment and losses on sale of businesses and fixed assets 13 1,386 197 Exploration expense 254 923 172 Distribution and administration expenses 2,458 3,082 2,783 Profit (loss) before interest and taxation (425) (3,643) 2,634 Finance costs(a) 394 379 281 Net finance expense relating to pensions and other post-retirement benefits 46 78 77 Profit (loss) before taxation (865) (4,100) 2,276 Taxation(a) (307) (776) (375) Profit (loss) for the period (558) (3,324) 2,651 Attributable to BP shareholders (583) (3,307) 2,602 Non-controlling interests 25 (17) 49 (558) (3,324) 2,651 Earnings per share (Note 7) Profit (loss) for the period attributable to BP shareholders Per ordinary share (cents) Basic (3.16) (18.01) 14.28 Diluted (3.16) (18.01) 14.21 Per ADS (dollars) Basic (0.19) (1.08) 0.86 Diluted (0.19) (1.08) 0.85
(a) See Note 2 for information on the impact of the Gulf of Mexico oil spill on these income statement line items.
11
Financial statements (continued)
Group statement of comprehensive income
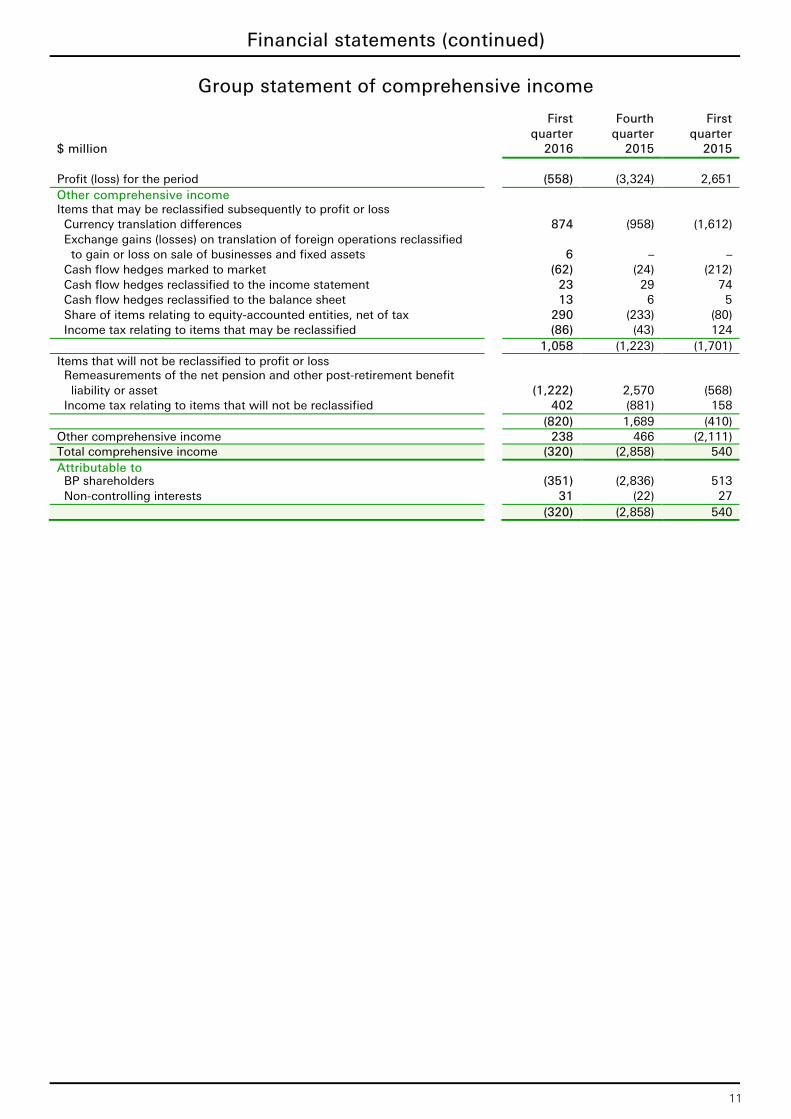
First Fourth First quarter quarter quarter $ million 2016 2015 2015 Profit (loss) for the period (558) (3,324) 2,651 Other comprehensive income Items that may be reclassified subsequently to profit or loss Currency translation differences 874 (958) (1,612) Exchange gains (losses) on translation of foreign operations reclassified to gain or loss on sale of businesses and fixed assets 6 – – Cash flow hedges marked to market (62) (24) (212) Cash flow hedges reclassified to the income statement 23 29 74 Cash flow hedges reclassified to the balance sheet 13 6 5 Share of items relating to equity-accounted entities, net of tax 290 (233) (80) Income tax relating to items that may be reclassified (86) (43) 124 1,058 (1,223) (1,701) Items that will not be reclassified to profit or loss Remeasurements of the net pension and other post-retirement benefit liability or asset (1,222) 2,570 (568) Income tax relating to items that will not be reclassified 402 (881) 158 (820) 1,689 (410) Other comprehensive income 238 466 (2,111) Total comprehensive income (320) (2,858) 540 Attributable to BP shareholders (351) (2,836) 513 Non-controlling interests 31 (22) 27 (320) (2,858) 540
12
Financial statements (continued)
Group statement of changes in equity
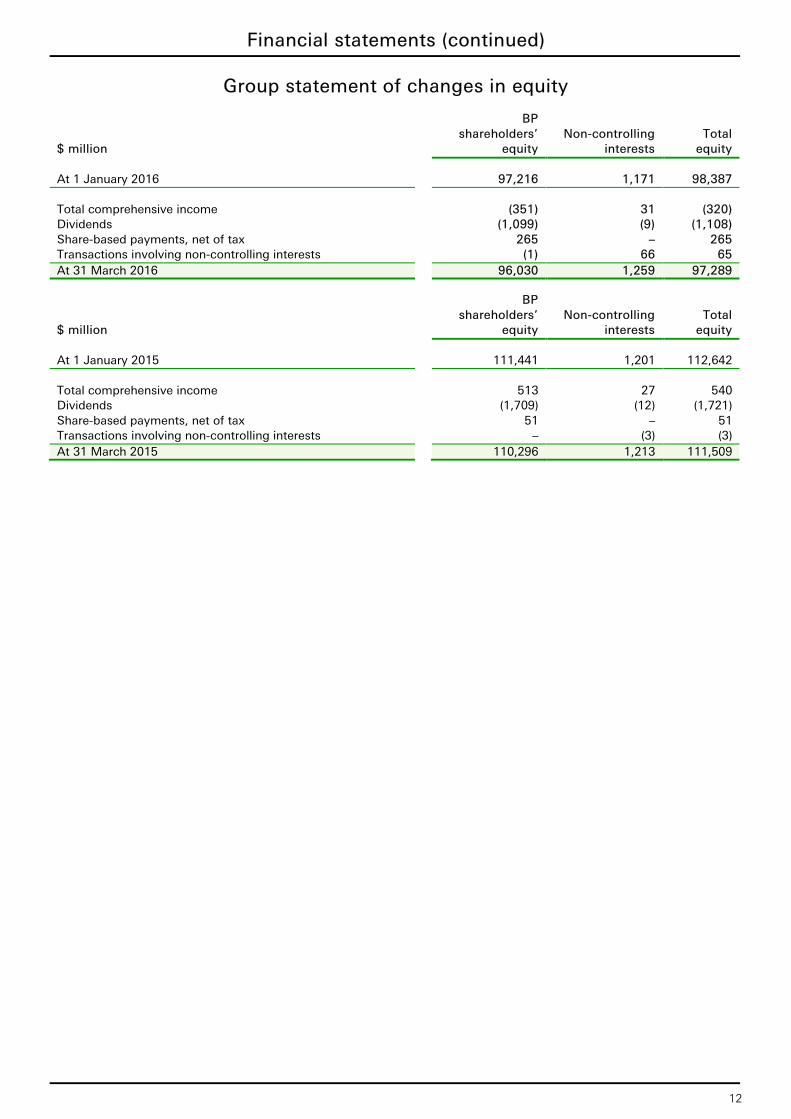
BP shareholders’ Non-controlling Total $ million equity interests equity At 1 January 2016 97,216 1,171 98,387 Total comprehensive income (351) 31 (320) Dividends (1,099) (9) (1,108) Share-based payments, net of tax 265 – 265 Transactions involving non-controlling interests (1) 66 65 At 31 March 2016 96,030 1,259 97,289 BP shareholders’ Non-controlling Total $ million equity interests equity At 1 January 2015 111,441 1,201 112,642 Total comprehensive income 513 27 540 Dividends (1,709) (12) (1,721) Share-based payments, net of tax 51 – 51 Transactions involving non-controlling interests – (3) (3) At 31 March 2015 110,296 1,213 111,509
13
Financial statements (continued)
Group balance sheet
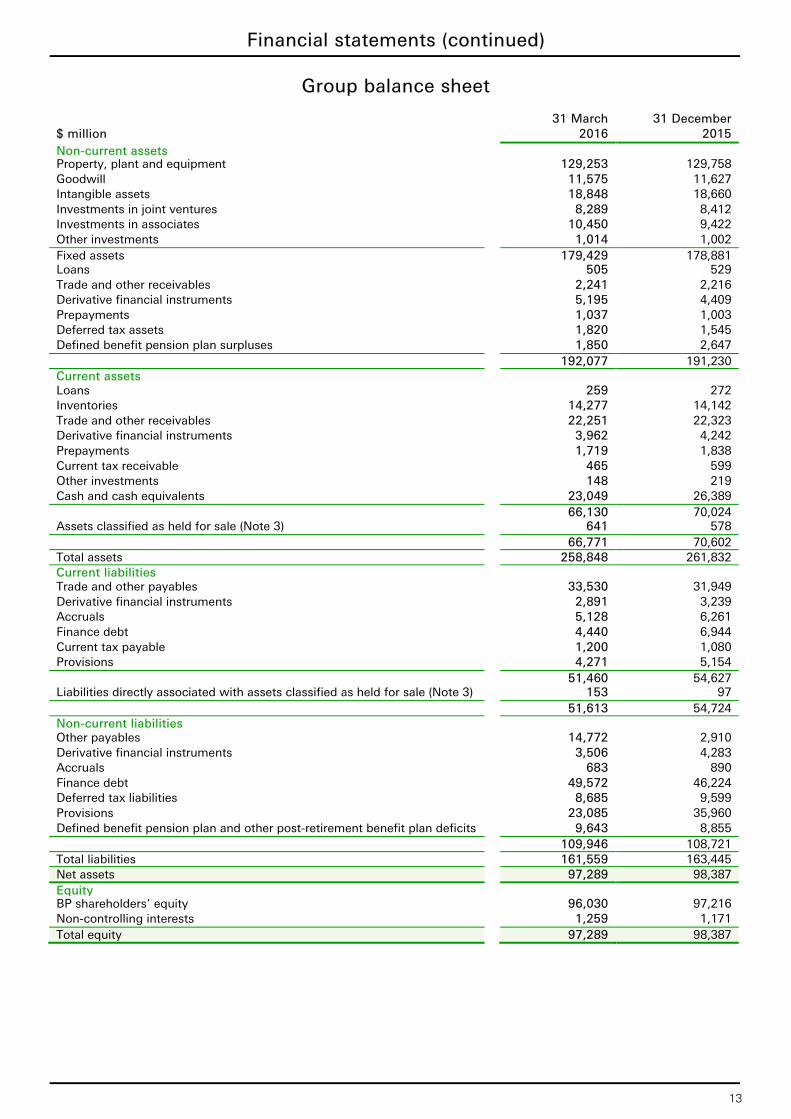
31 March 31 December $ million 2016 2015 Non-current assets Property, plant and equipment 129,253 129,758 Goodwill 11,575 11,627 Intangible assets 18,848 18,660 Investments in joint ventures 8,289 8,412 Investments in associates 10,450 9,422 Other investments 1,014 1,002 Fixed assets 179,429 178,881 Loans 505 529 Trade and other receivables 2,241 2,216 Derivative financial instruments 5,195 4,409 Prepayments 1,037 1,003 Deferred tax assets 1,820 1,545 Defined benefit pension plan surpluses 1,850 2,647 192,077 191,230 Current assets Loans 259 272 Inventories 14,277 14,142 Trade and other receivables 22,251 22,323 Derivative financial instruments 3,962 4,242 Prepayments 1,719 1,838 Current tax receivable 465 599 Other investments 148 219 Cash and cash equivalents 23,049 26,389 66,130 70,024 Assets classified as held for sale (Note 3) 641 578 66,771 70,602 Total assets 258,848 261,832 Current liabilities Trade and other payables 33,530 31,949 Derivative financial instruments 2,891 3,239 Accruals 5,128 6,261 Finance debt 4,440 6,944 Current tax payable 1,200 1,080 Provisions 4,271 5,154 51,460 54,627 Liabilities directly associated with assets classified as held for sale (Note 3) 153 97 51,613 54,724 Non-current liabilities Other payables 14,772 2,910 Derivative financial instruments 3,506 4,283 Accruals 683 890 Finance debt 49,572 46,224 Deferred tax liabilities 8,685 9,599 Provisions 23,085 35,960 Defined benefit pension plan and other post-retirement benefit plan deficits 9,643 8,855 109,946 108,721 Total liabilities 161,559 163,445 Net assets 97,289 98,387 Equity BP shareholders’ equity 96,030 97,216 Non-controlling interests 1,259 1,171 Total equity 97,289 98,387
14
Financial statements (continued)
Condensed group cash flow statement
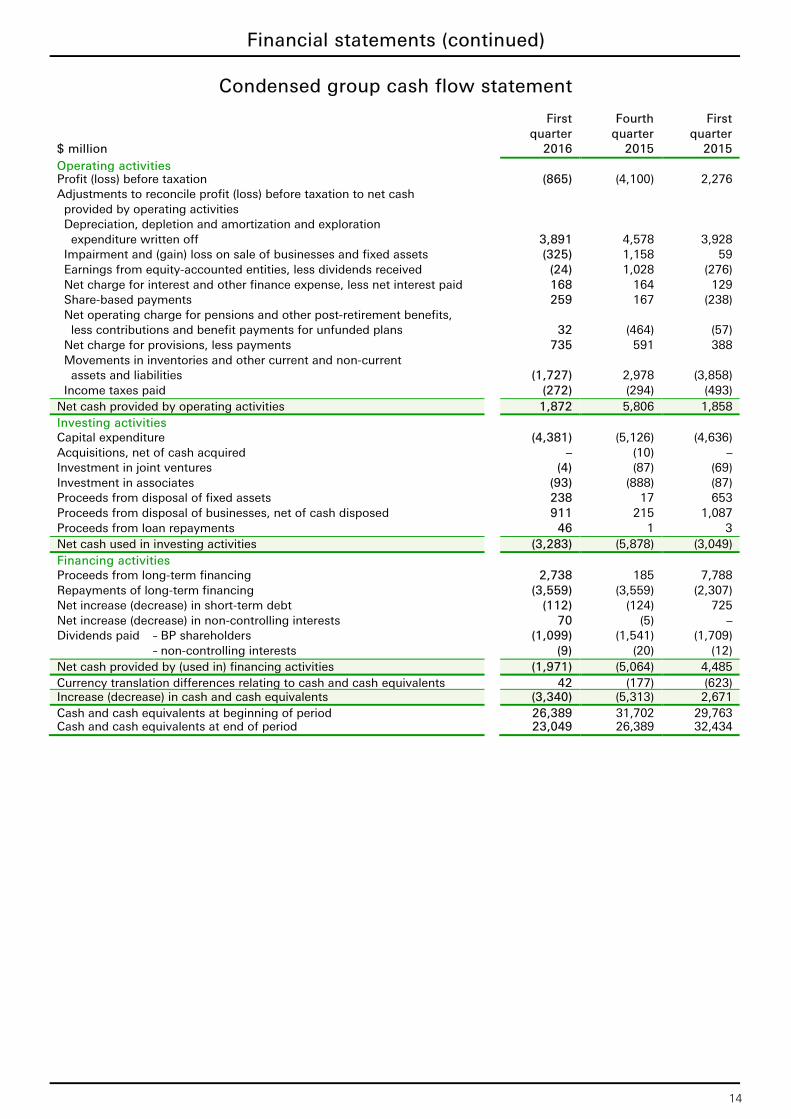
First Fourth First quarter quarter quarter $ million 2016 2015 2015 Operating activities Profit (loss) before taxation (865) (4,100) 2,276 Adjustments to reconcile profit (loss) before taxation to net cash provided by operating activities Depreciation, depletion and amortization and exploration expenditure written off 3,891 4,578 3,928 Impairment and (gain) loss on sale of businesses and fixed assets (325) 1,158 59 Earnings from equity-accounted entities, less dividends received (24) 1,028 (276) Net charge for interest and other finance expense, less net interest paid 168 164 129 Share-based payments 259 167 (238) Net operating charge for pensions and other post-retirement benefits, less contributions and benefit payments for unfunded plans 32 (464) (57) Net charge for provisions, less payments 735 591 388 Movements in inventories and other current and non-current assets and liabilities (1,727) 2,978 (3,858) Income taxes paid (272) (294) (493) Net cash provided by operating activities 1,872 5,806 1,858 Investing activities Capital expenditure (4,381) (5,126) (4,636) Acquisitions, net of cash acquired – (10) – Investment in joint ventures (4) (87) (69) Investment in associates (93) (888) (87) Proceeds from disposal of fixed assets 238 17 653 Proceeds from disposal of businesses, net of cash disposed 911 215 1,087 Proceeds from loan repayments 46 1 3 Net cash used in investing activities (3,283) (5,878) (3,049) Financing activities Proceeds from long-term financing 2,738 185 7,788 Repayments of long-term financing (3,559) (3,559) (2,307) Net increase (decrease) in short-term debt (112) (124) 725 Net increase (decrease) in non-controlling interests 70 (5) – Dividends paid – BP shareholders (1,099) (1,541) (1,709) – non-controlling interests (9) (20) (12) Net cash provided by (used in) financing activities (1,971) (5,064) 4,485 Currency translation differences relating to cash and cash equivalents 42 (177) (623) Increase (decrease) in cash and cash equivalents (3,340) (5,313) 2,671 Cash and cash equivalents at beginning of period 26,389 31,702 29,763 Cash and cash equivalents at end of period 23,049 26,389 32,434
15
Financial statements (continued)
Notes
1. Basis of preparation The interim financial information included in this report has been prepared in accordance with IAS 34 ‘Interim Financial Reporting’. The results for the interim periods are unaudited and, in the opinion of management, include all adjustments necessary for a fair presentation of the results for each period. All such adjustments are of a normal recurring nature. This report should be read in conjunction with the consolidated financial statements and related notes for the year ended 31 December 2015 included in BP Annual Report and Form 20-F 2015. BP prepares its consolidated financial statements included within BP Annual Report and Form 20-F on the basis of International Financial Reporting Standards (IFRS) as issued by the International Accounting Standards Board (IASB), IFRS as adopted by the European Union (EU) and in accordance with the provisions of the UK Companies Act 2006. IFRS as adopted by the EU differs in certain respects from IFRS as issued by the IASB. The differences have no impact on the group’s consolidated financial statements for the periods presented. The financial information presented herein has been prepared in accordance with the accounting policies expected to be used in preparing BP Annual Report and Form 20-F 2016, which do not differ significantly from those used in BP Annual Report and Form 20-F 2015. As indicated in BP Annual Report and Form 20-F 2015, the costs of the Gulf Coast Restoration Organization, which were previously presented as a reconciling item between the sum of the results of the reportable segments and the group results, are now reported as part of Other businesses and corporate. Amounts reported for comparative periods are presented on the same basis.
2. Gulf of Mexico oil spill (a) Overview As a consequence of the Gulf of Mexico oil spill, BP continues to incur various costs and has also recognized liabilities for future costs. The information presented in this note should be read in conjunction with BP Annual Report and Form 20-F 2015 – Financial statements – Note 2 and Legal proceedings on page 237 and on page 30 of this report. The group income statement includes a pre-tax charge of $917 million for the first quarter in relation to the Gulf of Mexico oil spill. The cumulative pre-tax income statement charge since the incident, in April 2010, amounts to $56,368 million. The cumulative income statement charge does not include amounts for obligations that BP considers are not possible, at this time, to measure reliably. For further information, see Provisions and contingent liabilities below. The Consent Decree between the United States, the Gulf states and BP with respect to the Clean Water Act penalty, natural resource damages and certain other claims and the Settlement Agreement with the five Gulf states that was signed in 2015 with respect to state claims for economic loss, property damage and other claims were conditional upon each other and both became effective upon approval by the court of the Consent Decree on 4 April 2016. BP also accepted releases received from the vast majority of local government entities of their economic loss, property damage and other claims, and payments required under those releases were made in 2015. The agreements described above (the Agreements) significantly reduce the uncertainties faced by BP following the Gulf of Mexico oil spill. There continues to be uncertainty regarding the outcome or resolution of current or future litigation and the extent and timing of costs relating to the incident not covered by the Agreements. The total amounts that will ultimately be paid by BP in relation to the incident will be dependent on many factors, as discussed under Provisions and contingent liabilities below, including in relation to any new information or future developments. These uncertainties could have a material impact on our consolidated financial position, results and cash flows.
16
Financial statements (continued)
Notes
2. Gulf of Mexico oil spill (continued) The amounts set out below reflect the impacts on the financial statements of the Gulf of Mexico oil spill for the periods presented. The income statement, balance sheet and cash flow statement impacts are included within the relevant line items in those statements as set out below.
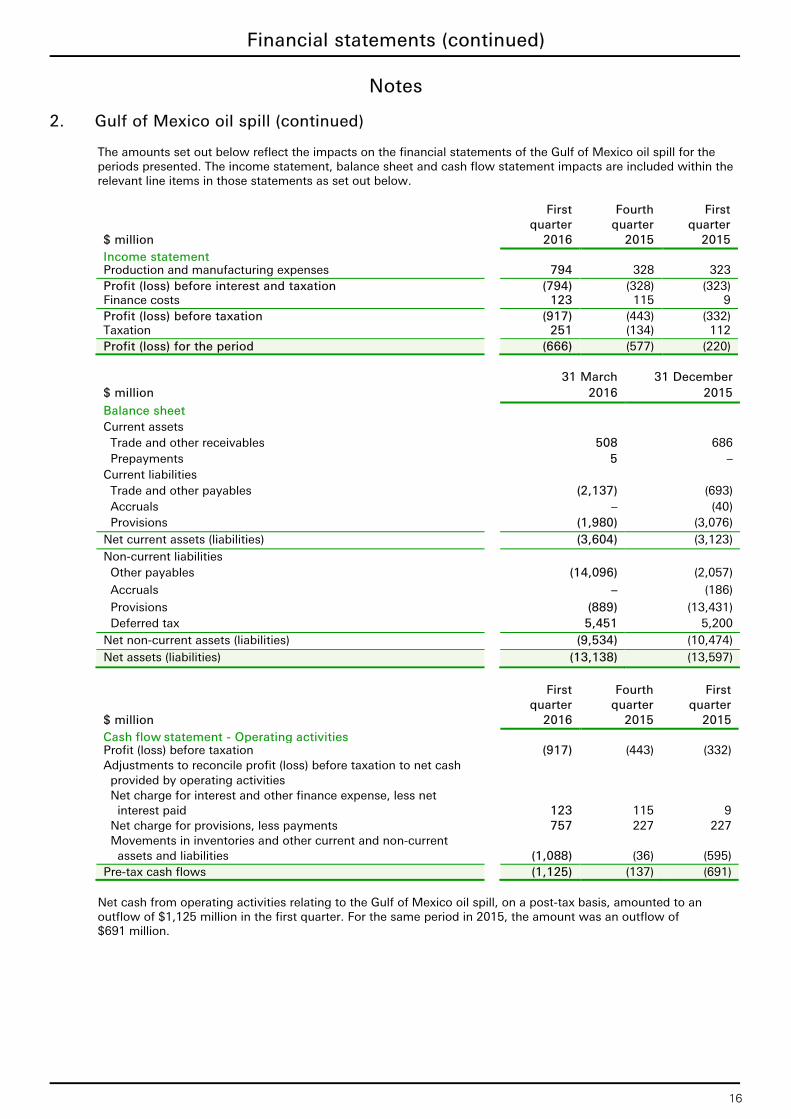
First Fourth First quarter quarter quarter $ million 2016 2015 2015 Income statement Production and manufacturing expenses 794 328 323 Profit (loss) before interest and taxation (794) (328) (323) Finance costs 123 115 9 Profit (loss) before taxation (917) (443) (332) Taxation 251 (134) 112 Profit (loss) for the period (666) (577) (220)
31 March 31 December
$ million 2016 2015
Balance sheet
Current assets
Trade and other receivables 508 686
Prepayments 5 –
Current liabilities
Trade and other payables (2,137) (693)
Accruals – (40)
Provisions (1,980) (3,076)
Net current assets (liabilities) (3,604) (3,123)
Non-current liabilities
Other payables (14,096) (2,057)
Accruals – (186)
Provisions (889) (13,431)
Deferred tax 5,451 5,200
Net non-current assets (liabilities) (9,534) (10,474)
Net assets (liabilities) (13,138) (13,597)
First Fourth First quarter quarter quarter $ million 2016 2015 2015
Cash flow statement - Operating activities Profit (loss) before taxation (917) (443) (332) Adjustments to reconcile profit (loss) before taxation to net cash provided by operating activities Net charge for interest and other finance expense, less net interest paid 123 115 9 Net charge for provisions, less payments 757 227 227 Movements in inventories and other current and non-current assets and liabilities (1,088) (36) (595)
Pre-tax cash flows (1,125) (137) (691) Net cash from operating activities relating to the Gulf of Mexico oil spill, on a post-tax basis, amounted to an outflow of $1,125 million in the first quarter. For the same period in 2015, the amount was an outflow of $691 million.

17
Financial statements (continued)
Notes
2. Gulf of Mexico oil spill (continued) Trust fund BP established the Deepwater Horizon Oil Spill Trust (the Trust), funded in the amount of $20 billion, to satisfy legitimate individual and business claims, state and local government claims resolved by BP, final judgments and settlements, state and local response costs, and natural resource damages and related costs. Fines and penalties are not covered by the trust fund. The funding of the Trust was completed in 2012. During the first quarter of 2016, the remaining cash in the Trust and associated qualified settlement funds, not allocated for specific purposes, was exhausted and BP commenced paying claims and other costs not covered by the specific-purpose cash balances. For certain costs, these payments are made by BP into a qualified settlement fund, the fund then distributes the amounts to the claimant; $539 million was paid into a qualified settlement fund during the first quarter. At 31 March 2016, $508 million of the provisions and payables are eligible to be paid from the Trust and associated qualified settlement funds. A reimbursement asset is recorded within Trade and other receivables on the balance sheet, all of which is classified as current, as payment of all amounts covered by the remaining Trust reimbursement asset may be requested over the next twelve months. During the first quarter of 2016, $632 million of provisions and $85 million of payables were paid from the Trust. (b) Provisions and contingent liabilities BP has recorded certain provisions and disclosed certain contingent liabilities as a consequence of the Gulf of Mexico oil spill. These are described below and in more detail in BP Annual Report and Form 20-F 2015 – Financial statements – Note 2. Provisions BP had recorded provisions relating to the Gulf of Mexico oil spill in relation to environmental expenditure, litigation and claims, and Clean Water Act penalties. Movements in each class of provision during the first quarter are presented in the table below.
Litigation Clean and Water Act $ million Environmental claims penalties Total At 1 January 2016 5,919 6,459 4,129 16,507 Net increase (decrease) in provision – 780 – 780 Unwinding of discount 52 25 38 115 Reclassified to Other payables (5,970) (3,741) (4,167) (13,878) Utilization – paid by BP (1) (22) – (23) – paid by the trust fund – (632) – (632) At 31 March 2016 – 2,869 – 2,869 Of which – current – 1,980 – 1,980 – non-current – 889 – 889
Environmental The environmental provision at 31 December 2015 included amounts payable for natural resource damage costs under the Consent Decree. These amounts are payable in instalments over 16 years commencing April 2017; the majority of the unpaid balance of this natural resource damages settlement accrues interest at a fixed rate. Amounts payable under the $1-billion early restoration framework agreement with natural resource trustees for the US and five Gulf states, that were not yet allocated to specific projects, were also included in environmental provisions at 31 December 2015. The provisions relating to these natural resource damage costs and the early restoration framework agreement were reclassified to Other payables during the first quarter. Litigation and claims The litigation and claims provision includes amounts that can be estimated reliably for the future cost of settling claims by individuals and businesses for damage to real or personal property, lost profits or impairment of earning capacity and loss of subsistence use of natural resources (Individual and Business Claims). Claims administration costs and legal costs have also been provided for. Amounts that cannot be measured reliably and which have therefore not been provided for are described under Contingent liabilities below.
18
Financial statements (continued)
Notes
2. Gulf of Mexico oil spill (continued) At 31 December 2015, the litigation and claims provision included amounts provided under the Agreements in relation to state claims that had not yet been paid. These amounts were reclassified to Other payables during the first quarter and are payable over 18 years; $0.9 billion is payable in July 2016. Litigation and claims – PSC settlement BP has provided for its best estimate of the cost associated with the 2012 PSC settlement agreements with the exception of the cost of business economic loss claims, except where an eligibility notice has been issued and is not subject to appeal by BP within the claims facility. See BP Annual Report and Form 20-F 2015 – Financial statements – Note 2 for further details on the settlements with the PSC and related matters. Management believes that no reliable estimate can currently be made of any business economic loss claims not yet processed or processed but not yet paid, except where an eligibility notice has been issued and is not subject to appeal by BP within the claims facility. A significant number of business economic loss claims have been received but have not yet been processed and it is not possible to quantify the total value of the claims. There are continuing uncertainties regarding the application of the revised policy for matching of revenue and expenses, introduced in May 2014, including uncertainties relating to the application of specialized frameworks to particular industries and the limited availability of detailed pre-determination claims data. Further detail on these uncertainties is provided in BP Annual Report and Form 20-F 2015 – Financial statements – Note 2. There is consequently insufficient data available to build up a track record of claims determinations under the policies and protocols that are now being applied following resolution of the matching and causation issues. We are unable to reliably estimate future trends of the number and proportion of claims that will be determined to be eligible, nor can we reliably estimate the value of such claims. A provision for such business economic loss claims will be established when these uncertainties are sufficiently reduced and a reliable estimate can be made of the liability. The current estimate for the total cost of those elements of the PSC settlement that BP considers can be reliably estimated, including amounts already paid, is $12.9 billion. The Deepwater Horizon Court Supervised Settlement Program (DHCSSP) has issued eligibility notices, many of which are disputed by BP, in respect of business economic loss claims of approximately $340 million which have not been provided for. The total cost of the PSC settlement is likely to be significantly higher than the amount recognized to date of $12.9 billion because the current estimate does not reflect business economic loss claims not yet processed or processed but not yet paid, except where an eligibility notice has been issued and is not subject to appeal by BP within the claims facility. There continues to be a high level of uncertainty with regards to the amounts that ultimately will be paid in relation to current claims as described above and the outcomes of any further litigation including by parties excluded from, or parties who opted out of, the PSC settlement. There is also uncertainty as to the cost of administering the claims process under the DHCSSP and in relation to future legal costs. The timing of payment of provisions related to the PSC settlement is dependent upon ongoing claims facility activity and is therefore also uncertain. Clean Water Act penalties The provision previously recognized for penalties under Section 311 of the Clean Water Act, as determined in the Agreements, was reclassified to Other payables during the first quarter. This amount is payable in instalments over 15 years, commencing April 2017. The unpaid balance of this penalty accrues interest at a fixed rate. Provision movements and analysis of income statement charge A net increase in provisions of $780 million was recognized for the first quarter. The net increase arises primarily due to an increase in the litigation and claims provision for business economic loss claims under the PSC settlement and costs relating to the settlement of certain civil claims outside of the PSC settlement. The remainder of the income statement charge mainly relates to finance costs and ongoing functional costs in relation to the incident. Further information on provisions is provided in BP Annual Report and Form 20-F 2015 – Financial statements – Note 2.
19
Financial statements (continued)
Notes
2. Gulf of Mexico oil spill (continued) Contingent liabilities BP currently considers that it is not possible to measure reliably other obligations arising from the incident, including: • The cost of business economic loss claims under the PSC settlement not yet processed or processed but not
yet paid (except where an eligibility notice has been issued and is not subject to appeal by BP within the claims facility).
• Any obligation that may arise from securities-related litigation. • Any obligation in relation to other potential private or non-US government litigation or claims (except for those
items provided for as described above under Provisions). • Claims asserted in civil litigation, including any further litigation by parties excluded from, or parties who opted
out of, the PSC settlement, including as set out in Legal proceedings on pages 237-241 of BP Annual Report and Form 20-F 2015, except for claims covered by settlement agreements.
It is not practicable to estimate the magnitude or possible timing of payment of these contingent liabilities. The magnitude and timing of all possible obligations in relation to the Gulf of Mexico oil spill continue to be subject to uncertainty. See also BP Annual Report and Form 20-F 2015 – Financial statements – Note 2.
3. Non-current assets held for sale On 15 January 2016 BP and Rosneft announced that they had signed definitive agreements to dissolve the German refining joint operation Ruhr Oel GmbH (ROG). The restructuring, which is expected to be completed in 2016, will result in Rosneft taking ownership of ROG’s interests in the Bayernoil, MiRO Karlsruhe and PCK Schwedt refineries. In exchange, BP will take sole ownership of the Gelsenkirchen refinery and the solvent production facility DHC Solvent Chemie. Assets and associated liabilities relating to BP’s share of ROG’s interests in the Bayernoil, MiRO Karlsruhe and PCK Schwedt refineries are classified as held for sale in the group balance sheet.
20
Financial statements (continued)
Notes
4. Analysis of replacement cost profit (loss) before interest and tax and reconciliation to profit (loss) before taxation
First Fourth First quarter quarter quarter $ million 2016 2015 2015 Upstream (1,205) (2,280) 372 Downstream 1,880 838 2,083 Rosneft 66 235 183 Other businesses and corporate(a) (1,074) (955) (631) (333) (2,162) 2,007 Consolidation adjustment – UPII* 40 65 (129) RC profit (loss) before interest and tax (293) (2,097) 1,878 Inventory holding gains (losses)* Upstream (31) (18) 18 Downstream (97) (1,482) 700 Rosneft (net of tax) (4) (46) 38 Profit (loss) before interest and tax (425) (3,643) 2,634 Finance costs 394 379 281 Net finance expense relating to pensions and other post-retirement benefits 46 78 77 Profit (loss) before taxation (865) (4,100) 2,276 RC profit (loss) before interest and tax* US (1,256) (1,429) (497) Non-US 963 (668) 2,375 (293) (2,097) 1,878
(a) Includes costs related to the Gulf of Mexico oil spill. See Note 2 for further information.
5. Sales and other operating revenues
First Fourth First quarter quarter quarter $ million 2016 2015 2015 By segment Upstream 7,431 10,212 11,630 Downstream 34,552 43,463 49,448 Other businesses and corporate 396 556 428 42,379 54,231 61,506 Less: sales and other operating revenues between segments Upstream 3,633 4,987 5,563 Downstream 118 (133) 176 Other businesses and corporate 116 205 248 3,867 5,059 5,987 Third party sales and other operating revenues Upstream 3,798 5,225 6,067 Downstream 34,434 43,596 49,272 Other businesses and corporate 280 351 180 Total sales and other operating revenues 38,512 49,172 55,519 By geographical area US 13,576 16,936 18,841 Non-US 27,146 34,773 40,011 40,722 51,709 58,852 Less: sales and other operating revenues between areas 2,210 2,537 3,333 38,512 49,172 55,519
21
Financial statements (continued)
Notes
6. Production and similar taxes
First Fourth First quarter quarter quarter $ million 2016 2015 2015 US 18 118 34 Non-US (4) 145 328 14 263 362
7. Earnings per share and shares in issue Basic earnings per ordinary share (EpS) amounts are calculated by dividing the profit for the period attributable to ordinary shareholders by the weighted average number of ordinary shares outstanding during the period. The calculation of EpS is performed separately for each discrete quarterly period, and for the year-to-date period. As a result, the sum of the discrete quarterly EpS amounts in any particular year-to-date period may not be equal to the EpS amount for the year-to-date period. For the diluted EpS calculation the weighted average number of shares outstanding during the period is adjusted for the number of shares that are potentially issuable in connection with employee share-based payment plans using the treasury stock method.
First Fourth First quarter quarter quarter $ million 2016 2015 2015 Results for the period Profit (loss) for the period attributable to BP shareholders (583) (3,307) 2,602 Less: preference dividend – 1 – Profit (loss) attributable to BP ordinary shareholders (583) (3,308) 2,602 Number of shares (thousand)(a)(b) Basic weighted average number of shares outstanding 18,468,632 18,369,064 18,220,486 ADS equivalent 3,078,105 3,061,510 3,036,747 Weighted average number of shares outstanding used to calculate diluted earnings per share 18,468,632 18,369,064 18,309,730 ADS equivalent 3,078,105 3,061,510 3,051,621 Shares in issue at period-end 18,635,861 18,412,392 18,249,422 ADS equivalent 3,105,976 3,068,732 3,041,570
(a) Excludes treasury shares and includes certain shares that will be issued in the future under employee share-based
payment plans. (b) If the inclusion of potentially issuable shares would decrease loss per share, the potentially issuable shares are excluded
from the weighted average number of shares outstanding used to calculate diluted earnings per share.
22
Financial statements (continued)
Notes
8. Dividends Dividends payable BP today announced an interim dividend of 10.00 cents per ordinary share which is expected to be paid on 17 June 2016 to shareholders and American Depositary Share (ADS) holders on the register on 6 May 2016. The corresponding amount in sterling is due to be announced on 7 June 2016, calculated based on the average of the market exchange rates for the four dealing days commencing on 1 June 2016. Holders of ADSs are expected to receive $0.600 per ADS (less applicable fees). A scrip dividend alternative is available, allowing shareholders to elect to receive their dividend in the form of new ordinary shares and ADS holders in the form of new ADSs. Details of the first-quarter dividend and timetable are available at bp.com/dividends and details of the scrip dividend programme are available at bp.com/scrip.
First Fourth First quarter quarter quarter 2016 2015 2015 Dividends paid per ordinary share cents 10.000 10.000 10.000 pence 7.012 6.634 6.670 Dividends paid per ADS (cents) 60.00 60.00 60.00 Scrip dividends Number of shares issued (millions) 154.4 49.7 15.7 Value of shares issued ($ million) 739 289 109
9. Net debt* Net debt ratio*
First Fourth First quarter quarter quarter $ million 2016 2015 2015 Gross debt 54,012 53,168 57,731 Fair value (asset) liability of hedges related to finance debt(a) (967) 379 (174) 53,045 53,547 57,557 Less: cash and cash equivalents 23,049 26,389 32,434 Net debt 29,996 27,158 25,123 Equity 97,289 98,387 111,509 Net debt ratio 23.6% 21.6% 18.4%

23
Financial statements (continued)
Notes
9. Net debt* (continued) Analysis of changes in net debt
First Fourth First quarter quarter quarter $ million 2016 2015 2015 Opening balance Finance debt 53,168 57,405 52,854 Fair value (asset) liability of hedges related to finance debt(a) 379 (57) (445) Less: cash and cash equivalents 26,389 31,702 29,763 Opening net debt 27,158 25,646 22,646 Closing balance Finance debt 54,012 53,168 57,731 Fair value (asset) liability of hedges related to finance debt(a) (967) 379 (174) Less: cash and cash equivalents 23,049 26,389 32,434 Closing net debt 29,996 27,158 25,123 Decrease (increase) in net debt (2,838) (1,512) (2,477) Movement in cash and cash equivalents (excluding exchange adjustments) (3,382) (5,136) 3,294 Net cash outflow (inflow) from financing (excluding share capital and dividends) 933 3,498 (6,206) Other movements 359 (33) 11 Movement in net debt before exchange effects (2,090) (1,671) (2,901) Exchange adjustments (748) 159 424 Decrease (increase) in net debt (2,838) (1,512) (2,477)
(a) Derivative financial instruments entered into for the purpose of managing interest rate and foreign currency exchange risk associated with net debt with a fair value liability position of $1,225 million (fourth quarter 2015 liability of $1,617 million and first quarter 2015 liability of $1,650 million) are not included in the calculation of net debt shown above as hedge accounting is not applied for these instruments.
10. Inventory valuation A provision of $677 million was held at 31 March 2016 ($1,295 million at 31 December 2015 and $797 million at 31 March 2015) to write inventories down to their net realizable value. The net movement credited to the income statement during the first quarter 2016 was $616 million (fourth quarter 2015 was a charge of $583 million and first quarter 2015 was a credit of $2,024 million).
11. Statutory accounts The financial information shown in this publication, which was approved by the Board of Directors on 25 April 2016, is unaudited and does not constitute statutory financial statements. BP Annual Report and Form 20-F 2015 has been filed with the Registrar of Companies in England and Wales. The report of the auditor on those accounts was unqualified and did not contain a statement under section 498(2) or section 498(3) of the UK Companies Act 2006.
24
Additional information
Capital expenditure and acquisitions, on an accruals basis First Fourth First quarter quarter quarter $ million 2016 2015 2015 By segment Upstream US 1,060 1,313 1,135 Non-US 2,583 3,841 2,896 3,643 5,154 4,031 Downstream US 161 224 145 Non-US 155 633 199 316 857 344 Other businesses and corporate US 1 37 16 Non-US 35 90 74 36 127 90 3,995 6,138 4,465 By geographical area US 1,222 1,574 1,296 Non-US 2,773 4,564 3,169 3,995 6,138 4,465 Included above: Acquisitions and asset exchanges 51 22 28 Other inorganic capital expenditure – 584 –
25
Additional information (continued)
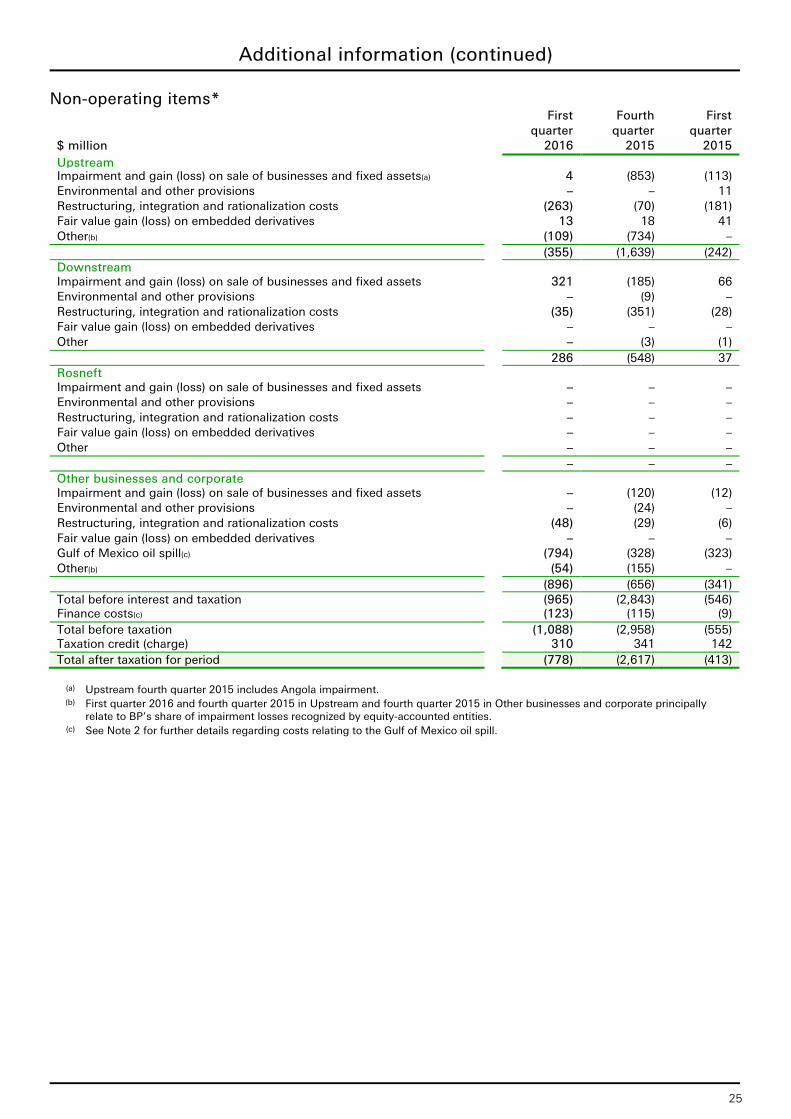
Non-operating items* First Fourth First quarter quarter quarter $ million 2016 2015 2015 Upstream Impairment and gain (loss) on sale of businesses and fixed assets(a) 4 (853) (113) Environmental and other provisions – – 11 Restructuring, integration and rationalization costs (263) (70) (181) Fair value gain (loss) on embedded derivatives 13 18 41 Other(b) (109) (734) – (355) (1,639) (242) Downstream Impairment and gain (loss) on sale of businesses and fixed assets 321 (185) 66 Environmental and other provisions – (9) – Restructuring, integration and rationalization costs (35) (351) (28) Fair value gain (loss) on embedded derivatives – – – Other – (3) (1) 286 (548) 37 Rosneft Impairment and gain (loss) on sale of businesses and fixed assets – – – Environmental and other provisions – – – Restructuring, integration and rationalization costs – – – Fair value gain (loss) on embedded derivatives – – – Other – – – – – – Other businesses and corporate Impairment and gain (loss) on sale of businesses and fixed assets – (120) (12) Environmental and other provisions – (24) – Restructuring, integration and rationalization costs (48) (29) (6) Fair value gain (loss) on embedded derivatives – – – Gulf of Mexico oil spill(c) (794) (328) (323) Other(b) (54) (155) – (896) (656) (341) Total before interest and taxation (965) (2,843) (546) Finance costs(c) (123) (115) (9) Total before taxation (1,088) (2,958) (555) Taxation credit (charge) 310 341 142 Total after taxation for period (778) (2,617) (413)
(a) Upstream fourth quarter 2015 includes Angola impairment. (b) First quarter 2016 and fourth quarter 2015 in Upstream and fourth quarter 2015 in Other businesses and corporate principally
relate to BP’s share of impairment losses recognized by equity-accounted entities. (c) See Note 2 for further details regarding costs relating to the Gulf of Mexico oil spill.
26
Additional information (continued)
Non-GAAP information on fair value accounting effects First Fourth First quarter quarter quarter $ million 2016 2015 2015
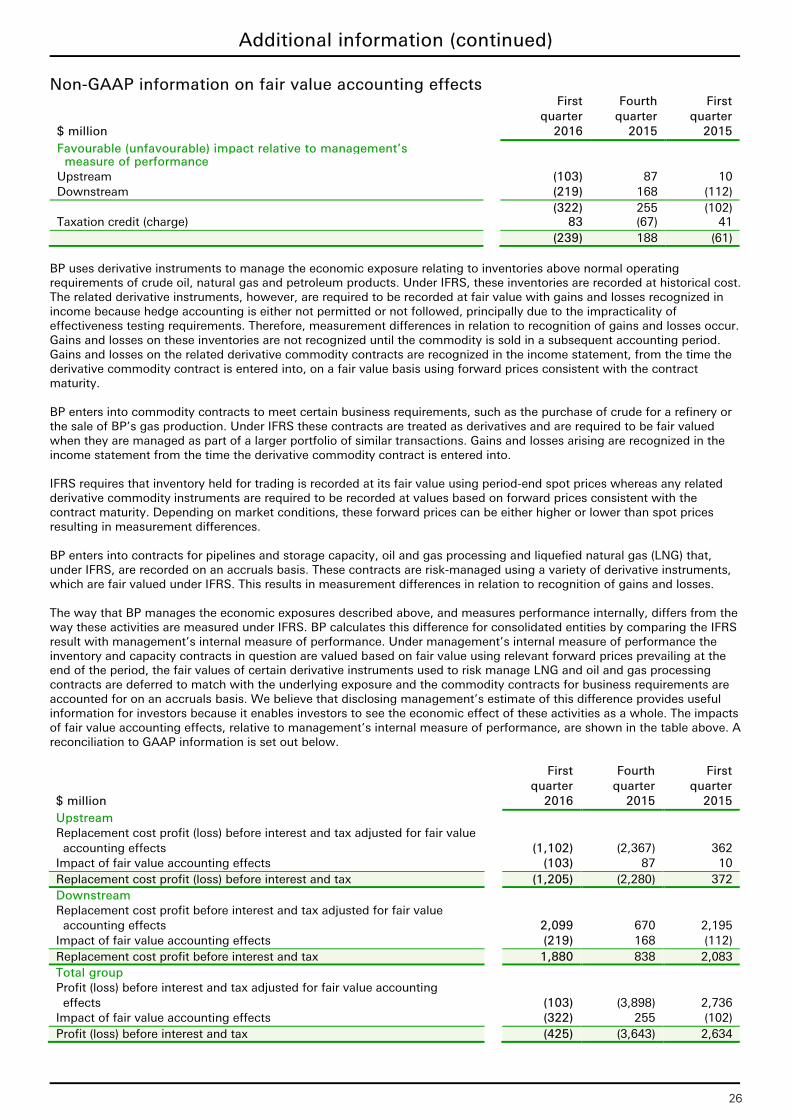
Favourable (unfavourable) impact relative to management’s measure of performance Upstream (103) 87 10 Downstream (219) 168 (112) (322) 255 (102) Taxation credit (charge) 83 (67) 41 (239) 188 (61)
BP uses derivative instruments to manage the economic exposure relating to inventories above normal operating requirements of crude oil, natural gas and petroleum products. Under IFRS, these inventories are recorded at historical cost. The related derivative instruments, however, are required to be recorded at fair value with gains and losses recognized in income because hedge accounting is either not permitted or not followed, principally due to the impracticality of effectiveness testing requirements. Therefore, measurement differences in relation to recognition of gains and losses occur. Gains and losses on these inventories are not recognized until the commodity is sold in a subsequent accounting period. Gains and losses on the related derivative commodity contracts are recognized in the income statement, from the time the derivative commodity contract is entered into, on a fair value basis using forward prices consistent with the contract maturity. BP enters into commodity contracts to meet certain business requirements, such as the purchase of crude for a refinery or the sale of BP’s gas production. Under IFRS these contracts are treated as derivatives and are required to be fair valued when they are managed as part of a larger portfolio of similar transactions. Gains and losses arising are recognized in the income statement from the time the derivative commodity contract is entered into. IFRS requires that inventory held for trading is recorded at its fair value using period-end spot prices whereas any related derivative commodity instruments are required to be recorded at values based on forward prices consistent with the contract maturity. Depending on market conditions, these forward prices can be either higher or lower than spot prices resulting in measurement differences. BP enters into contracts for pipelines and storage capacity, oil and gas processing and liquefied natural gas (LNG) that, under IFRS, are recorded on an accruals basis. These contracts are risk-managed using a variety of derivative instruments, which are fair valued under IFRS. This results in measurement differences in relation to recognition of gains and losses. The way that BP manages the economic exposures described above, and measures performance internally, differs from the way these activities are measured under IFRS. BP calculates this difference for consolidated entities by comparing the IFRS result with management’s internal measure of performance. Under management’s internal measure of performance the inventory and capacity contracts in question are valued based on fair value using relevant forward prices prevailing at the end of the period, the fair values of certain derivative instruments used to risk manage LNG and oil and gas processing contracts are deferred to match with the underlying exposure and the commodity contracts for business requirements are accounted for on an accruals basis. We believe that disclosing management’s estimate of this difference provides useful information for investors because it enables investors to see the economic effect of these activities as a whole. The impacts of fair value accounting effects, relative to management’s internal measure of performance, are shown in the table above. A reconciliation to GAAP information is set out below. First Fourth First quarter quarter quarter $ million 2016 2015 2015 Upstream Replacement cost profit (loss) before interest and tax adjusted for fair value accounting effects (1,102) (2,367) 362 Impact of fair value accounting effects (103) 87 10 Replacement cost profit (loss) before interest and tax (1,205) (2,280) 372 Downstream Replacement cost profit before interest and tax adjusted for fair value accounting effects 2,099 670 2,195 Impact of fair value accounting effects (219) 168 (112) Replacement cost profit before interest and tax 1,880 838 2,083 Total group Profit (loss) before interest and tax adjusted for fair value accounting effects (103) (3,898) 2,736 Impact of fair value accounting effects (322) 255 (102) Profit (loss) before interest and tax (425) (3,643) 2,634
27
Additional information (continued)
Realizations* and marker prices First Fourth First quarter quarter quarter 2016 2015 2015
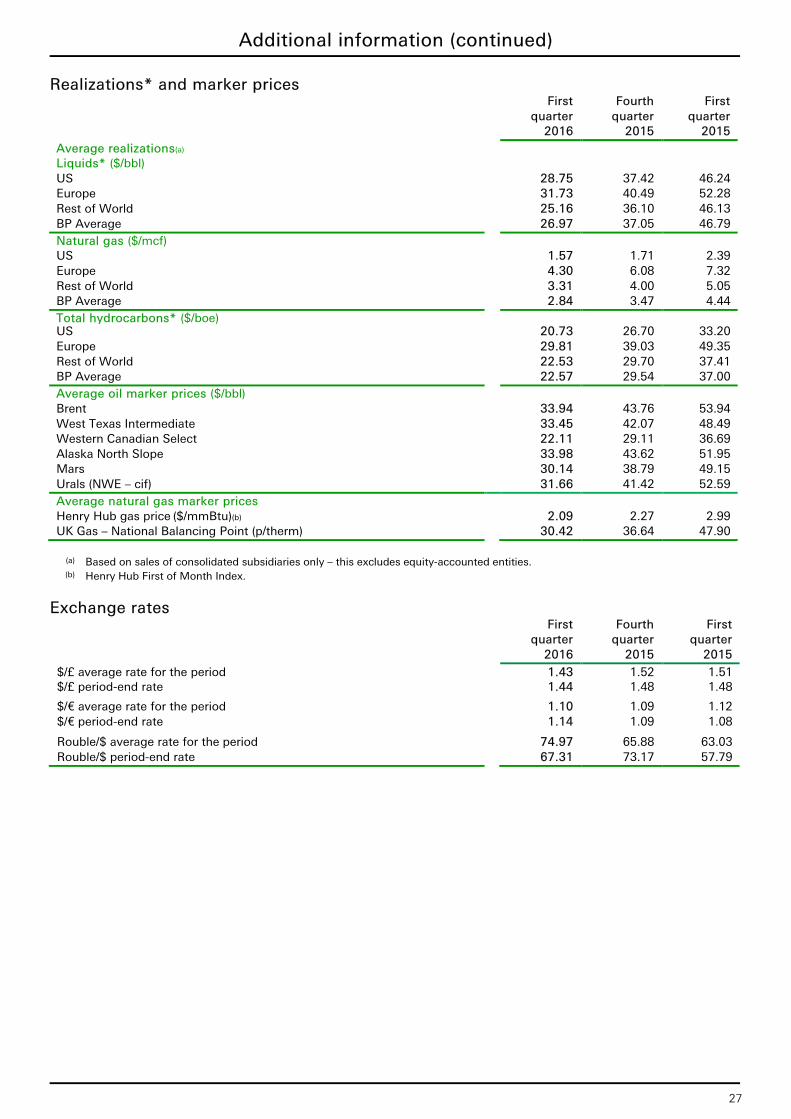
Average realizations(a) Liquids* ($/bbl) US 28.75 37.42 46.24 Europe 31.73 40.49 52.28 Rest of World 25.16 36.10 46.13 BP Average 26.97 37.05 46.79 Natural gas ($/mcf) US 1.57 1.71 2.39 Europe 4.30 6.08 7.32 Rest of World 3.31 4.00 5.05 BP Average 2.84 3.47 4.44 Total hydrocarbons* ($/boe) US 20.73 26.70 33.20 Europe 29.81 39.03 49.35 Rest of World 22.53 29.70 37.41 BP Average 22.57 29.54 37.00 Average oil marker prices ($/bbl) Brent 33.94 43.76 53.94 West Texas Intermediate 33.45 42.07 48.49 Western Canadian Select 22.11 29.11 36.69 Alaska North Slope 33.98 43.62 51.95 Mars 30.14 38.79 49.15 Urals (NWE – cif) 31.66 41.42 52.59 Average natural gas marker prices Henry Hub gas price ($/mmBtu)(b) 2.09 2.27 2.99 UK Gas – National Balancing Point (p/therm) 30.42 36.64 47.90
(a) Based on sales of consolidated subsidiaries only – this excludes equity-accounted entities. (b) Henry Hub First of Month Index.
Exchange rates First Fourth First quarter quarter quarter 2016 2015 2015
$/£ average rate for the period 1.43 1.52 1.51 $/£ period-end rate 1.44 1.48 1.48
$/€ average rate for the period 1.10 1.09 1.12 $/€ period-end rate 1.14 1.09 1.08
Rouble/$ average rate for the period 74.97 65.88 63.03 Rouble/$ period-end rate 67.31 73.17 57.79
28
Glossary
Consolidation adjustment – UPII is unrealized profit in inventory arising on inter-segment transactions. Fair value accounting effects are non-GAAP adjustments to our IFRS profit (loss) relating to certain physical inventories, pipelines and storage capacity. Management uses a fair-value basis to value these items which, under IFRS, are accounted for on an accruals basis with the exception of trading inventories, which are valued using spot prices. The adjustments have the effect of aligning the valuation basis of the physical positions with that of any associated derivative instruments, which are required to be fair valued under IFRS, in order to provide a more representative view of the ultimate economic value. Further information and a reconciliation to GAAP information is provided on page 26. Hydrocarbons – Liquids and natural gas. Natural gas is converted to oil equivalent at 5.8 billion cubic feet = 1 million barrels. Inventory holding gains and losses represent the difference between the cost of sales calculated using the replacement cost of inventory and the cost of sales calculated on the first-in first-out (FIFO) method after adjusting for any changes in provisions where the net realizable value of the inventory is lower than its cost. Under the FIFO method, which we use for IFRS reporting, the cost of inventory charged to the income statement is based on its historical cost of purchase or manufacture, rather than its replacement cost. In volatile energy markets, this can have a significant distorting effect on reported income. The amounts disclosed represent the difference between the charge to the income statement for inventory on a FIFO basis (after adjusting for any related movements in net realizable value provisions) and the charge that would have arisen based on the replacement cost of inventory. For this purpose, the replacement cost of inventory is calculated using data from each operation’s production and manufacturing system, either on a monthly basis, or separately for each transaction where the system allows this approach. The amounts disclosed are not separately reflected in the financial statements as a gain or loss. No adjustment is made in respect of the cost of inventories held as part of a trading position and certain other temporary inventory positions. See Replacement cost (RC) profit or loss definition below. Liquids – Liquids for Upstream and Rosneft comprises crude oil, condensate and natural gas liquids. For Upstream, liquids also includes bitumen. Net debt and net debt ratio are non-GAAP measures. Net debt is calculated as gross finance debt, as shown in the balance sheet, plus the fair value of associated derivative financial instruments that are used to hedge foreign currency exchange and interest rate risks relating to finance debt, for which hedge accounting is applied, less cash and cash equivalents. The net debt ratio is defined as the ratio of net debt to the total of net debt plus shareholders’ equity. All components of equity are included in the denominator of the calculation. BP believes these measures provide useful information to investors. Net debt enables investors to see the economic effect of gross debt, related hedges and cash and cash equivalents in total. The net debt ratio enables investors to see how significant net debt is relative to equity from shareholders. The derivatives are reported on the balance sheet within the headings ‘Derivative financial instruments’. Net wind generation capacity is the sum of the rated capacities of the assets/turbines that have entered into commercial operation, including BP’s share of equity-accounted entities. The gross data is the equivalent capacity on a gross-JV basis, which includes 100% of the capacity of equity-accounted entities where BP has partial ownership. Non-operating items are charges and credits included in the financial statements that BP discloses separately because it considers such disclosures to be meaningful and relevant to investors. They are items that management considers not to be part of underlying business operations and are disclosed in order to enable investors better to understand and evaluate the group’s reported financial performance. Non-operating items within equity-accounted earnings are reported net of incremental income tax reported by the equity-accounted entity. An analysis of non-operating items by region is shown on pages 5, 7 and 9, and by segment and type is shown on page 25. Organic capital expenditure excludes acquisitions, asset exchanges, and other inorganic capital expenditure. An analysis of capital expenditure by segment and region is shown on page 24. Production-sharing agreement (PSA) is an arrangement through which an oil company bears the risks and costs of exploration, development and production. In return, if exploration is successful, the oil company receives entitlement to variable physical volumes of hydrocarbons, representing recovery of the costs incurred and a stipulated share of the production remaining after such cost recovery. Realizations are the result of dividing revenue generated from hydrocarbon sales, excluding revenue generated from purchases made for resale and royalty volumes, by revenue generating hydrocarbon production volumes. Revenue generating hydrocarbon production reflects the BP share of production as adjusted for any production which does not generate revenue. Adjustments may include losses due to shrinkage, amounts consumed during processing, and contractual or regulatory host committed volumes such as royalties. Refining availability represents Solomon Associates’ operational availability, which is defined as the percentage of the year that a unit is available for processing after subtracting the annualized time lost due to turnaround activity and all planned mechanical, process and regulatory downtime.
29
Glossary (continued)
The Refining marker margin (RMM) is the average of regional indicator margins weighted for BP’s crude refining capacity in each region. Each regional marker margin is based on product yields and a marker crude oil deemed appropriate for the region. The regional indicator margins may not be representative of the margins achieved by BP in any period because of BP’s particular refinery configurations and crude and product slate. Replacement cost (RC) profit or loss reflects the replacement cost of inventories sold in the period and is arrived at by excluding inventory holding gains and losses from profit or loss. RC profit or loss is the measure of profit or loss that is required to be disclosed for each operating segment under International Financial Reporting Standards (IFRS). RC profit or loss for the group is not a recognized GAAP measure. Management believes this measure is useful to illustrate to investors the fact that crude oil and product prices can vary significantly from period to period and that the impact on our reported result under IFRS can be significant. Inventory holding gains and losses vary from period to period due to changes in prices as well as changes in underlying inventory levels. In order for investors to understand the operating performance of the group excluding the impact of price changes on the replacement of inventories, and to make comparisons of operating performance between reporting periods, BP’s management believes it is helpful to disclose this measure. Underlying production is production after adjusting for divestments and entitlement impacts in our production-sharing agreements. Underlying RC profit or loss is RC profit or loss after adjusting for non-operating items and fair value accounting effects. Underlying RC profit or loss and fair value accounting effects are not recognized GAAP measures. See pages 25 and 26 for additional information on the non-operating items and fair value accounting effects that are used to arrive at underlying RC profit or loss in order to enable a full understanding of the events and their financial impact. BP believes that underlying RC profit or loss is a useful measure for investors because it is a measure closely tracked by management to evaluate BP’s operating performance and to make financial, strategic and operating decisions and because it may help investors to understand and evaluate, in the same manner as management, the underlying trends in BP’s operational performance on a comparable basis, period on period, by adjusting for the effects of these non-operating items and fair value accounting effects. The nearest equivalent measure on an IFRS basis for the group is profit or loss for the year attributable to BP shareholders. The nearest equivalent measure on an IFRS basis for segments is RC profit or loss before interest and taxation.
30
Legal proceedings
The following discussion sets out the material developments in the group’s material legal proceedings during the recent period. For a full discussion of the group’s material legal proceedings, see pages 237-242 of BP Annual Report and Form 20-F 2015. Matters relating to the Deepwater Horizon accident and oil spill (the Incident) Consent Decree and Settlement Agreement On 2 July 2015, BP reached agreements in principle with the United States federal government and five Gulf states to settle all federal and state claims arising from the Incident. On 5 October 2015, the United States lodged a proposed Consent Decree with the federal district court in New Orleans to resolve all United States and Gulf states natural resource damage claims and all Clean Water Act penalty claims. At the same time, BP entered into a Settlement Agreement with the Gulf states for economic, property and other losses. On 22 March 2016, the United States filed a motion with the court to enter the Consent Decree as a final settlement. On 4 April 2016, the court entered the Consent Decree and also entered a final judgment on the terms set forth in the Consent Decree, at which time the Consent Decree and Settlement Agreement became effective. Oil Pollution Act (OPA) Test Case Proceedings Six OPA test cases were before the federal district court in New Orleans to address certain OPA liability questions focusing on, among other issues, whether the plaintiffs’ alleged losses tied to the 2010 federal government moratoria on deepwater drilling and federal permit delays are compensable. In December 2015, BP filed a motion to dismiss the plaintiffs’ claims arising from the moratoria or permit process, and the plaintiffs filed a motion asking the court to prevent BP from arguing that government action and/or inaction following the oil spill is a “superseding” cause with respect to some or all of the damages that plaintiffs claim. On 10 March 2016, the court granted BP’s motion and denied the plaintiffs’ motion, ruling that BP is not, as a “Responsible Party” under OPA, liable for economic losses that resulted from the 2010 deepwater drilling moratoria. The court’s order dismissed the plaintiffs’ claims with prejudice. On 19 March 2016, the plaintiffs appealed the court’s ruling to the Fifth Circuit. Other Civil Complaints On 29 March 2016, the federal district court in New Orleans issued an order dismissing in its entirety the master complaint raising claims for economic loss and property damage by private plaintiffs relating to the Incident. The court ordered that all private plaintiffs who have filed a timely claim for economic loss or property damage against BP with the court and have not released those claims to date must file and serve on BP by 2 May 2016 a sworn statement disclosing information regarding their claims. In addition, the court required plaintiffs who had not filed an individual complaint (defined as a complaint not joined in by other plaintiffs) against BP to file a new individual complaint by 2 May 2016. Per the court’s order, plaintiffs who fail to comply with the sworn statement requirement or the new individual complaint requirement by 2 May 2016 will have their claims deemed dismissed with prejudice without further notice. The deadline has been extended by 14 days for some of the plaintiffs following various extension requests. The court denied all requests seeking extensions of more than 14 days and indicated no further extensions will be granted. The court issued a supplemental order confirming that all new complaints filed will be stayed until further direction by the court. CSB Investigation On 13 April 2016, the US Chemical Safety and Hazard Investigation Board (CSB) publicly released drafts of the final two volumes of its four-volume report on its investigation into the Incident. The final two volumes primarily concern the role of the regulator in the oversight of the offshore industry and organizational and cultural factors. They include proposed recommendations to the US Department of Interior’s Bureau of Safety and Environmental Enforcement, the American Petroleum Institute, the Ocean Energy Safety Institute and the Sustainability Accounting Standards Board.
31
Cautionary statement
In order to utilize the ‘safe harbor’ provisions of the United States Private Securities Litigation Reform Act of 1995 (the ‘PSLRA’), BP is providing the following cautionary statement: The discussion in this results announcement contains certain forecasts, projections and forward-looking statements – that is, statements related to future, not past events – with respect to the financial condition, results of operations and businesses of BP and certain of the plans and objectives of BP with respect to these items. These statements may generally, but not always, be identified by the use of words such as ‘will’, ‘expects’, ‘is expected to’, ‘aims’, ‘should’, ‘may’, ‘objective’, ‘is likely to’, ‘intends’, ‘believes’, ‘anticipates’, ‘plans’, ‘we see’ or similar expressions. In particular, among other statements, net debt ratio targets, expected organic capital expenditure, the expected quarterly dividend payment and timing of such payment; plans and expectations regarding Upstream activities in Canada, Norway, Oman, Kuwait, China and the Gulf of Mexico; expectations regarding the planned restructuring of the German refining joint operation with Rosneft; expectations regarding Upstream second-quarter 2016 reported production and Downstream second-quarter 2016 turnaround activity and industry refining margins; statements regarding Rosneft’s intention to increase its dividend and the estimate of the amount of dividend payable to BP; expectations with respect to the total amounts that will ultimately be paid by BP in relation to the Gulf of Mexico incident and the timing thereof; and certain statements regarding the legal and trial proceedings, court decisions, claims, penalties, potential investigations and civil actions by regulators, government entities and/or other entities or parties and the risks associated with such proceedings; are all forward looking in nature. By their nature, forward-looking statements involve risk and uncertainty because they relate to events and depend on circumstances that will or may occur in the future and are outside the control of BP. Actual results may differ materially from those expressed in such statements, depending on a variety of factors, including: the specific factors identified in the discussions accompanying such forward-looking statements; the receipt of relevant third party and/or regulatory approvals; the timing and level of maintenance and/or turnaround activity; the timing and volume of refinery additions and outages; the timing of bringing new fields onstream; the timing, quantum and nature of certain divestments; future levels of industry product supply, demand and pricing, including supply growth in North America; OPEC quota restrictions; PSA effects; operational and safety problems; potential lapses in product quality; economic and financial market conditions generally or in various countries and regions; political stability and economic growth in relevant areas of the world; changes in laws and governmental regulations; regulatory or legal actions including the types of enforcement action pursued and the nature of remedies sought or imposed; the actions of prosecutors, regulatory authorities and courts; the timing and amount of future payments relating to the Gulf of Mexico oil spill; exchange rate fluctuations; development and use of new technology; recruitment and retention of a skilled workforce; the success or otherwise of partnering; the actions of competitors, trading partners, contractors, subcontractors, creditors, rating agencies and others; our access to future credit resources; business disruption and crisis management; the impact on our reputation of ethical misconduct and non-compliance with regulatory obligations; trading losses; major uninsured losses; decisions by Rosneft’s management and board of directors; the actions of contractors; natural disasters and adverse weather conditions; changes in public expectations and other changes to business conditions; wars and acts of terrorism; cyber-attacks or sabotage; and other factors discussed elsewhere in this report and under “Risk factors” in BP Annual Report and Form 20-F 2015 as filed with the US Securities and Exchange Commission.
Contacts
London Houston
Press Office David Nicholas Brett Clanton +44 (0)20 7496 4708 +1 281 366 8346 Investor Relations Jessica Mitchell Craig Marshall bp.com/investors +44 (0)20 7496 4962 +1 281 366 3123