Embed Size (px)
Citation preview
FUNDAMENTAL STATISTICBPT 2423 – STATISTICAL PROCESS CONTROL

CHAPTER OUTLINE Definition of Statistics Populations versus Samples Data Collection Data Analysis
Graphical & Analytical Measurements
Accuracy, Precision & Error Central Limit Theorem

LESSON OUTCOMES Recall or review basic statistical concepts Understand how to graphically and analytically
study a process by using statistics Explain how to create and intercept a frequency
diagram and a histogram Able to calculate the mean, median, mode,
range and standard deviation for a given set of numbers
Discuss the importance of the normal curve and the central limit theorem in quality assurance

INTRODUCTION If things were done right just 99.9% of the time, then
we’d have to accept: One hour of unsafe drinking water per month 20,000 incorrect drug prescriptions per year 500 incorrect surgical operations each week 22,000 checks deducted form the wrong bank accounts per
hour
Each of the above statistics deals with the quality of life as we know it. We use statistics every day to define our expectations of life around us. Statistics, when used in quality assurance, define the expectations that the consumer and the designer have for the process. Processes and products are studied using statistics.

DEFINITION OF STATISTICSSTATISTICS : the collection, tabulation, analysis, interpretation and presentation of numerical data.
Provide a viable method of supporting or clarifying a topic under discussion
Misuses of statistics have lead people to distrust them completely
Correctly applied statistics are the key that unlocks an understanding of process and system performance.

POPULATIONS VS SAMPLES A population is a collection of all possible elements,
values or items associated with a situationExample : Insurance forms at doctor’s office must be process in a day
A sample is a subset of elements or measurements taken from a populationExample : The doctor’s office may wish to sample 10 insurance claim forms per week to check the forms for completeness.
This smaller group of data is easier to collect, analyze and interpret. A sample will represent the population as long as the sample is RANDOM and UNBIASED.

POPULATIONS VS SAMPLES In a random sample, each item in the population has the
same opportunity to be selected In order to interpret and use the information, it is critical
to know:How many were sampledValidity of a sampleThe size of the whole groupThe conditions under which the survey was made

DATA COLLECTION2 types of statistics exist : Deductive statistics – describe a population or complete
group of data Inductive statistics – a limited amount of data or a
representative sample of the population In quality control, 2 types of numerical data can be
collected:
Variable Attribut
e

VARIABLES DATA ATTRIBUTES DATA
Those quality characteristics that can be measured
Tend to be CONTINUOUS
(measured value can take on any value within a range) in
nature
Those quality characteristics that are observed to be either present or
absent, conforming or nonconforming
Primarily are DISCRETE data (countable using
whole numbers)
DATA COLLECTION
DATA ANALYSIS:GRAPHICAL
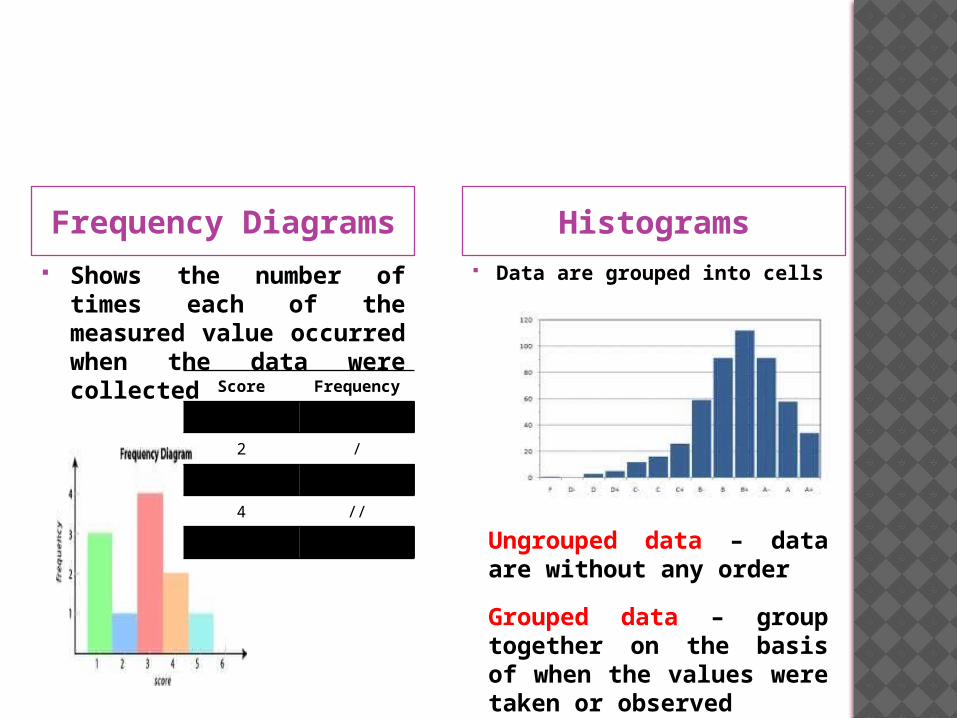
Frequency Diagrams Histograms Shows the number of times each
of the measured value occurred when the data were collected
Data are grouped into cells
Score Frequency
1 ///
2 /
3 ////
4 //
5 /Ungrouped data – data are without any order
Grouped data – group together on the basis of when the values were taken or observed

DATA ANALYSIS: ANALYTICAL
MEAN The mean of a series of measurements is determined by
adding the values together and then dividing this sum by the total number of values.
Exercise :
Data represent thickness measure-ment (in mm) of the clutch plate.
0.0625, 0.0626, 0.0624, 0.0625, 0.0627
Calculate the mean value.

MEDIAN The median is the value that divides an ordered series
of numbers so that there is an equal number of values on either side of the center.
Exercise :Determining the median for a set of numbers below:
Question 123, 25, 26, 27, 28, 29, 25, 22, 24, 24, 25, 26, 25
Question 21, 2, 4, 1, 5, 2, 6, 7
DATA ANALYSIS: ANALYTICAL

MODE The mode is the most frequently occurring number in a
group of values
Exercise :Determine mode value.
Question 1100, 101, 103, 104, 106, 107
Question 223, 25, 26, 25, 28, 25, 22, 24, 24, 25, 26
Question 3658, 659, 659, 659, 670, 670, 671, 670, 672, 674, 674, 672, 672
DATA ANALYSIS: ANALYTICAL

The Relationship Among the Mean, Median and Mode
Symmetrical Skewed Left Skewed Right
Mean, Median and Mode are the statistical values that define the center of a distribution, commonly called the measures of central tendency.
DATA ANALYSIS: ANALYTICAL

RANGE Is the difference between the highest value in a series of
values or sample and the lowest value in that same seriesR = X high – X low
Range value describes how far the data spread
STANDARD DEVIATION Shows the dispersion of the data within the distribution
Sample , s =
DATA ANALYSIS: ANALYTICAL

Range and standard deviation are two measurements that enable the investigator to determine the spread of the data
These two describe where the data are dispersed on either side of a central value, often referred to as measures of dispersion.Exercise :At an automobile-testing ground, a new type of automobile was tested for gas mileage. Seven cars, a sample of a much larger production run, were driven under typical conditions to determine the number of miles per gallon the cars got. The following miles-per-gallon readings were obtained:
36, 35, 39, 40, 35, 38, 41
Calculate the sample range and standard deviation.
DATA ANALYSIS: ANALYTICAL
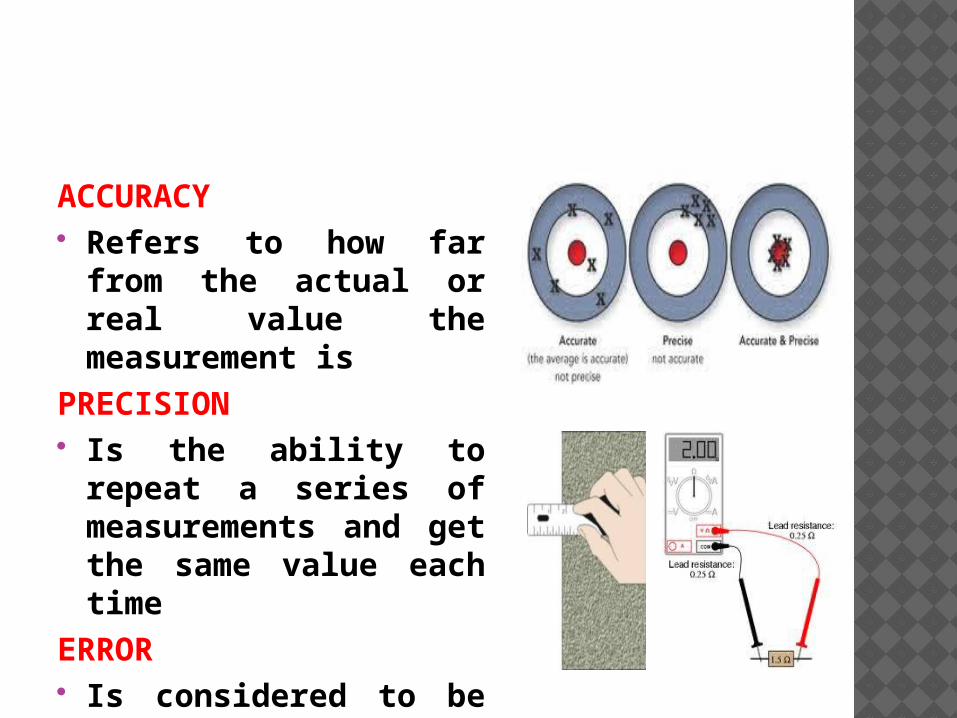
MEASUREMENTSACCURACY Refers to how far from the
actual or real value the measurement is
PRECISION Is the ability to repeat a series
of measurements and get the same value each time
ERROR Is considered to be the
difference between a value measured and the true value
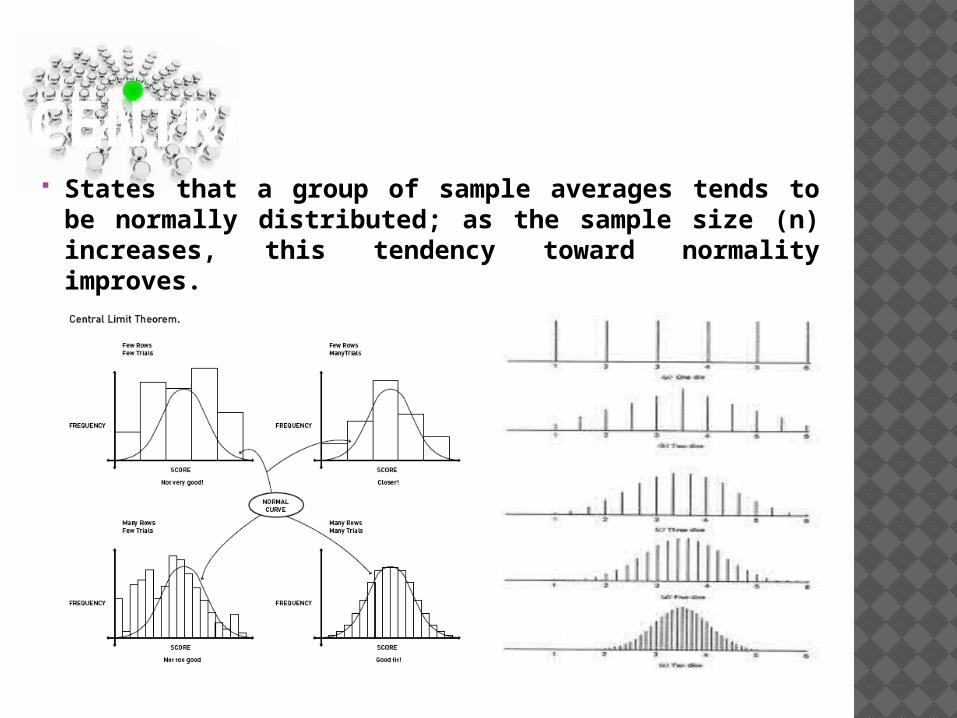
CENTRAL LIMIT THEOREM States that a group of sample averages tends to be
normally distributed; as the sample size (n) increases, this tendency toward normality improves.