Embed Size (px)
Citation preview
Submission Year 2014 Party FRANCESubmission Version v1.0 Submission Level Submitted
Submission Key FRA_2014_V1.0 Submission Status ClosedSubmitted By Frederique Millard Workbook Created 27.12.2013 02:58:15
Submitted Date 27.12.2013 02:57:02
Table 1s1Table 1s2Table 1s3Table 1(a)s1Table 1(a)s2Table 1(a)s3Table 1(b)s1Table 1(b)s2Table 1(b)s3Table 1(c)s1Table 1(c)s2Table 1(c)s3Table 1(d)s1Table 1(d)s2Table 1(d)s3Table 2(a)Table 2(b)Table 2(c)Table 2(d)Table 2(e)ITable 2(e)IITable 2(f)Table 3Table 4Table 4(a)I_2011Table 4(a)I_2012Table 4(a)IITable 4(b)Table 5Table 6(a)Table 6(b)Table 6(c)Table 7_2011Table 7_2012Table 7(a)_2011Table 7(a)_2012Table 7(b)_2011Table 7(b)_2012Table 8Table 9
BR CTF submission workbook
Contents
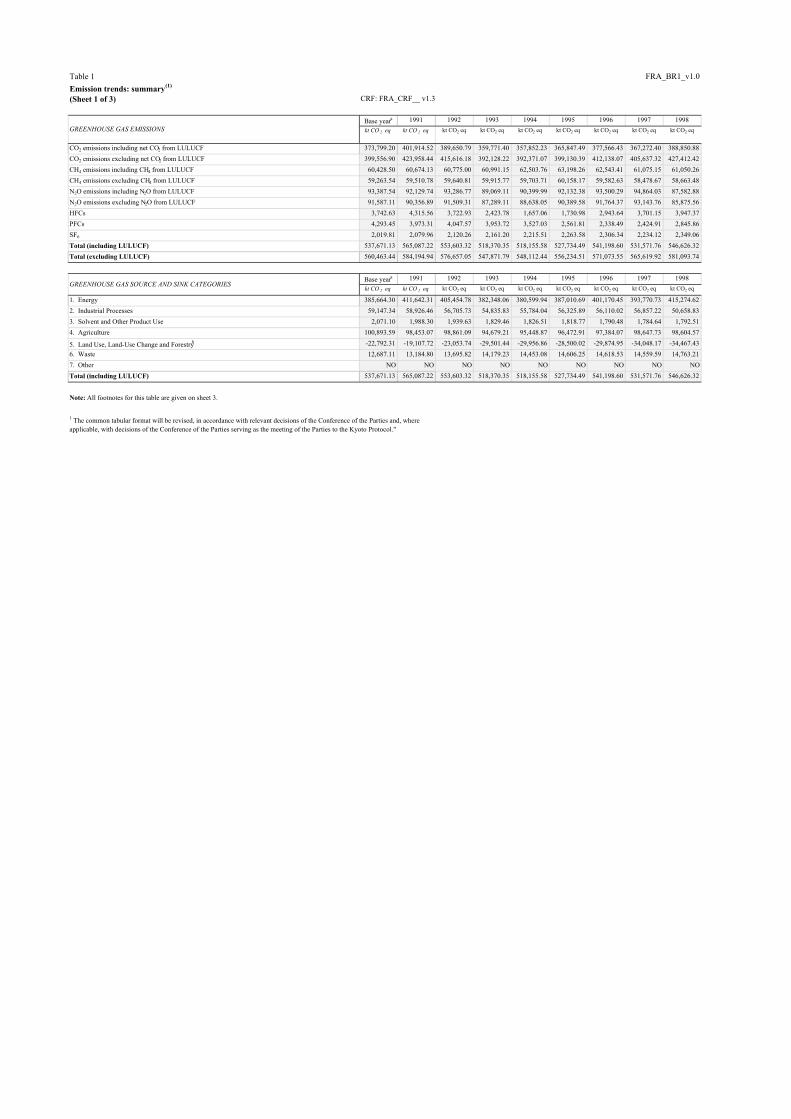
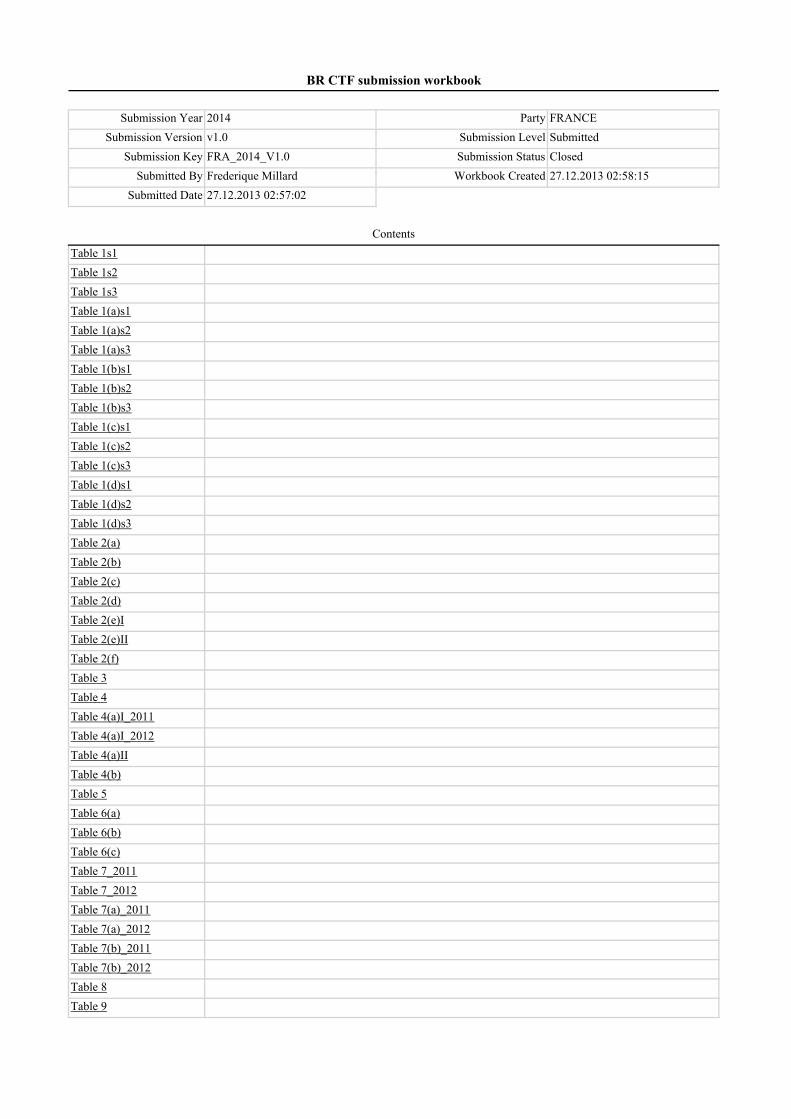
Table 1 FRA_BR1_v1.0Emission trends: summary (1) Source: Submission 2014 v1.3, FRANCE(Sheet 1 of 3) CRF: FRA_CRF__ v1.3
Base yeara 1991 1992 1993 1994 1995 1996 1997 1998kt CO 2 eq kt CO 2 eq kt CO2 eq kt CO2 eq kt CO2 eq kt CO2 eq kt CO2 eq kt CO2 eq kt CO2 eq
CO2 emissions including net CO2 from LULUCF 373,799.20 401,914.52 389,650.79 359,771.40 357,852.23 365,847.49 377,566.43 367,272.40 388,850.88CO2 emissions excluding net CO2 from LULUCF 399,556.90 423,958.44 415,616.18 392,128.22 392,371.07 399,130.39 412,138.07 405,637.32 427,412.42CH4 emissions including CH4 from LULUCF 60,428.50 60,674.13 60,775.00 60,991.15 62,503.76 63,198.26 62,543.41 61,075.15 61,050.26CH4 emissions excluding CH4 from LULUCF 59,263.54 59,510.78 59,640.81 59,915.77 59,703.71 60,158.17 59,582.63 58,478.67 58,663.48N2O emissions including N2O from LULUCF 93,387.54 92,129.74 93,286.77 89,069.11 90,399.99 92,132.38 93,500.29 94,864.03 87,582.88N2O emissions excluding N2O from LULUCF 91,587.11 90,356.89 91,509.31 87,289.11 88,638.05 90,389.58 91,764.37 93,143.76 85,875.56HFCs 3,742.63 4,315.56 3,722.93 2,423.78 1,657.06 1,730.98 2,943.64 3,701.15 3,947.37PFCs 4,293.45 3,973.31 4,047.57 3,953.72 3,527.03 2,561.81 2,338.49 2,424.91 2,845.86SF6 2,019.81 2,079.96 2,120.26 2,161.20 2,215.51 2,263.58 2,306.34 2,234.12 2,349.06Total (including LULUCF) 537,671.13 565,087.22 553,603.32 518,370.35 518,155.58 527,734.49 541,198.60 531,571.76 546,626.32Total (excluding LULUCF) 560,463.44 584,194.94 576,657.05 547,871.79 548,112.44 556,234.51 571,073.55 565,619.92 581,093.74
Base yeara 1991 1992 1993 1994 1995 1996 1997 1998kt CO 2 eq kt CO 2 eq kt CO2 eq kt CO2 eq kt CO2 eq kt CO2 eq kt CO2 eq kt CO2 eq kt CO2 eq
1. Energy 385,664.30 411,642.31 405,454.78 382,348.06 380,599.94 387,010.69 401,170.45 393,770.73 415,274.622. Industrial Processes 59,147.34 58,926.46 56,705.73 54,835.83 55,784.04 56,325.89 56,110.02 56,857.22 50,658.833. Solvent and Other Product Use 2,071.10 1,988.30 1,939.63 1,829.46 1,826.51 1,818.77 1,790.48 1,784.64 1,792.514. Agriculture 100,893.59 98,453.07 98,861.09 94,679.21 95,448.87 96,472.91 97,384.07 98,647.73 98,604.57
5. Land Use, Land-Use Change and Forestryb -22,792.31 -19,107.72 -23,053.74 -29,501.44 -29,956.86 -28,500.02 -29,874.95 -34,048.17 -34,467.436. Waste 12,687.11 13,184.80 13,695.82 14,179.23 14,453.08 14,606.25 14,618.53 14,559.59 14,763.217. Other NO NO NO NO NO NO NO NO NOTotal (including LULUCF) 537,671.13 565,087.22 553,603.32 518,370.35 518,155.58 527,734.49 541,198.60 531,571.76 546,626.32
Note: All footnotes for this table are given on sheet 3.
GREENHOUSE GAS EMISSIONS
1 The common tabular format will be revised, in accordance with relevant decisions of the Conference of the Parties and, whereapplicable, with decisions of the Conference of the Parties serving as the meeting of the Parties to the Kyoto Protocol."
GREENHOUSE GAS SOURCE AND SINK CATEGORIES
Table 1 FRA_BR1_v1.0Emission trends: summary (1) Source: Submission 2014 v1.3, FRANCE(Sheet 2 of 3) CRF: FRA_CRF__ v1.3
1999 2000 2001 2002 2003 2004 2005 2006 2007 2008kt CO 2 eq kt CO 2 eq kt CO2 eq kt CO2 eq kt CO2 eq kt CO2 eq kt CO2 eq kt CO2 eq kt CO2 eq kt CO2 eq
CO2 emissions including net CO2 from LULUCF 378,142.04 385,971.59 381,185.53 371,899.23 379,059.67 379,730.63 382,725.35 368,851.48 358,383.90 351,387.35CO2 emissions excluding net CO2 from LULUCF 419,146.03 416,174.32 416,935.39 413,513.25 422,482.11 423,995.52 428,047.67 418,610.71 408,803.99 402,268.58CH4 emissions including CH4 from LULUCF 60,624.96 61,623.18 60,769.82 59,498.11 58,030.48 56,835.91 55,979.22 55,399.70 55,366.47 55,705.58CH4 emissions excluding CH4 from LULUCF 58,422.60 59,489.57 58,765.98 57,512.87 56,071.14 55,014.62 54,175.37 53,676.34 53,664.37 54,003.55N2O emissions including N2O from LULUCF 80,640.19 80,147.61 77,462.01 75,154.86 72,413.57 70,287.55 69,661.65 67,280.88 66,889.30 67,956.07N2O emissions excluding N2O from LULUCF 78,971.71 78,508.94 75,863.24 73,573.89 70,851.72 68,797.86 68,180.62 65,815.53 65,423.95 66,459.87HFCs 4,847.42 5,706.20 6,973.15 8,164.28 9,721.16 10,440.88 11,240.69 12,052.48 12,610.29 13,605.12PFCs 3,529.22 2,486.86 2,190.99 3,477.43 3,217.74 2,179.95 1,430.37 1,166.58 923.89 563.10SF6 2,024.58 1,839.22 1,464.71 1,283.44 1,257.80 1,400.17 1,206.86 1,058.23 922.30 877.12Total (including LULUCF) 529,808.40 537,774.65 530,046.21 519,477.35 523,700.42 520,875.10 522,244.14 505,809.35 495,096.14 490,094.34Total (excluding LULUCF) 566,941.55 564,205.10 562,193.47 557,525.16 563,601.66 561,829.00 564,281.58 552,379.87 542,348.78 537,777.34
1999 2000 2001 2002 2003 2004 2005 2006 2007 2008kt CO 2 eq kt CO 2 eq kt CO2 eq kt CO2 eq kt CO2 eq kt CO2 eq kt CO2 eq kt CO2 eq kt CO2 eq kt CO2 eq
1. Energy 406,581.72 402,788.18 403,407.79 399,145.96 408,122.65 408,301.20 412,163.77 403,036.02 392,715.23 387,109.572. Industrial Processes 45,675.00 43,992.23 43,897.54 44,151.41 45,210.74 43,183.74 42,678.11 41,480.13 41,639.14 40,156.243. Solvent and Other Product Use 1,769.97 1,835.72 1,780.78 1,678.92 1,573.50 1,515.08 1,479.93 1,419.28 1,298.83 1,190.604. Agriculture 98,125.51 100,668.86 98,231.92 97,719.06 93,982.70 94,395.21 93,658.50 92,215.68 92,840.27 95,554.66
5. Land Use, Land-Use Change and Forestryb -37,133.15 -26,430.45 -32,147.26 -38,047.81 -39,901.24 -40,953.91 -42,037.44 -46,570.52 -47,252.64 -47,683.016. Waste 14,789.36 14,920.11 14,875.43 14,829.81 14,712.07 14,433.77 14,301.27 14,228.75 13,855.32 13,766.287. Other NO NO NO NO NO NO NO NO NO NOTotal (including LULUCF) 529,808.40 537,774.65 530,046.21 519,477.35 523,700.42 520,875.10 522,244.14 505,809.35 495,096.14 490,094.34
Note: All footnotes for this table are given on sheet 3.
GREENHOUSE GAS EMISSIONS
GREENHOUSE GAS SOURCE AND SINK CATEGORIES
Table 1 FRA_BR1_v1.0Emission trends: summary (1) Source: Submission 2014 v1.3, FRANCE(Sheet 3 of 3) CRF: FRA_CRF__ v1.3
2009 2010 2011 Change from base to latest reported year
kt CO 2 eq kt CO 2 eq kt CO2 eq (%)
CO2 emissions including net CO2 from LULUCF 341,780.44 354,274.66 316,240.64 -15.40CO2 emissions excluding net CO2 from LULUCF 383,669.31 392,062.24 363,834.85 -8.94CH4 emissions including CH4 from LULUCF 54,465.18 54,490.66 53,091.90 -12.14CH4 emissions excluding CH4 from LULUCF 52,746.95 52,728.37 51,453.20 -13.18N2O emissions including N2O from LULUCF 64,012.03 61,825.46 62,335.64 -33.25N2O emissions excluding N2O from LULUCF 62,507.53 60,340.16 60,887.07 -33.52HFCs 14,386.17 15,170.46 15,849.29 323.48PFCs 365.35 382.91 429.46 -90.00SF6 733.79 684.12 569.73 -71.79Total (including LULUCF) 475,742.95 486,828.26 448,516.66 -16.58Total (excluding LULUCF) 514,409.09 521,368.27 493,023.59 -12.03
2009 2010 2011 Change from base to latest reported year
kt CO 2 eq kt CO 2 eq kt CO2 eq (%)
1. Energy 370,997.98 377,858.58 349,925.25 -9.272. Industrial Processes 37,035.85 37,821.77 36,470.28 -38.343. Solvent and Other Product Use 1,055.09 1,098.89 1,125.24 -45.674. Agriculture 92,116.24 91,298.63 92,589.38 -8.23
5. Land Use, Land-Use Change and Forestryb -38,666.14 -34,540.00 -44,506.94 95.276. Waste 13,203.92 13,290.41 12,913.44 1.787. Other NO NO NO 0.00Total (including LULUCF) 475,742.95 486,828.26 448,516.66 -16.58
Notes :
(3) 1 kt CO2 eq equals 1 Gg CO2 eq.
Custom Footnotes
a The column �Base year� should be filled in only by those Parties with economies in transition that use a base year different from 1990 in accordance with the relevant decisions of the Conference of the Parties. For these Parties, this different base year is used to calculate the percentage change in the final column of this table.b Includes net CO2, CH4 and N2O from LULUCF.
GREENHOUSE GAS EMISSIONS
(1) Further detailed information could be found in the common reporting format tables of the Party�s greenhouse gas inventory, namely �Emission trends (CO2)�, �Emission trends (CH4)�, �Emission trends (N2O)� and �Emission trends (HFCs, PFCs and SF6)�, which is included in an annex to this biennial report.
Abbreviation: LULUCF = land use, land-use change and forestry.
(2) 2011 is the latest reported inventory year.
GREENHOUSE GAS SOURCE AND SINK CATEGORIES
Table 1 (a) FRA_BR1_v1.0Emission trends (CO2) Source: Submission 2014 v1.3, FRANCE(Sheet 1 of 3) CRF: FRA_CRF__ v1.3
Base year a 1991 1992 1993 1994 1995 1996 1997 1998kt kt kt kt kt kt kt kt kt
1. Energy 371,366.62 396,651.56 390,562.43 367,720.05 366,484.02 372,730.64 387,165.87 380,652.76 401,981.71A. Fuel Combustion (Sectoral Approach) 367,090.59 392,286.43 386,190.32 363,547.23 362,050.18 368,357.45 382,650.25 376,169.94 397,578.151. Energy Industries 63,747.78 75,918.70 68,512.29 56,204.59 52,691.32 55,390.81 60,497.65 56,609.88 69,365.592. Manufacturing Industries and Construction 87,329.14 88,061.70 86,644.84 79,100.90 84,824.91 84,143.17 84,371.45 85,817.11 88,326.763. Transport 120,301.94 123,061.69 127,745.35 127,601.90 128,600.29 130,299.53 131,880.44 134,184.94 136,327.954. Other Sectors 95,711.73 105,244.34 103,287.84 100,639.84 95,933.65 98,523.94 105,900.72 99,558.01 103,557.855. Other NO NO NO NO NO NO NO NO NOB. Fugitive Emissions from Fuels 4,276.03 4,365.13 4,372.11 4,172.82 4,433.85 4,373.19 4,515.62 4,482.82 4,403.551. Solid Fuels NA, NO NA, NO NA, NO NA, NO NA, NO NA, NO NA, NO NA, NO NA, NO2. Oil and Natural Gas 4,276.03 4,365.13 4,372.11 4,172.82 4,433.85 4,373.19 4,515.62 4,482.82 4,403.552. Industrial Processes 24,461.16 23,686.49 21,464.20 20,949.39 22,357.72 22,891.14 21,539.08 21,714.30 22,239.66A. Mineral Products 16,525.07 15,816.80 14,491.27 13,606.06 14,136.14 13,942.91 13,646.73 13,434.59 14,120.98B. Chemical Industry 3,185.60 3,073.48 2,626.54 2,811.13 3,010.38 3,028.30 3,194.85 3,135.22 3,099.37C. Metal Production 4,750.48 4,796.21 4,346.39 4,532.20 5,211.21 5,919.93 4,697.50 5,144.49 5,019.31D. Other Production NA NA NA NA NA NA NA NA NAE. Production of Halocarbons and SF6F. Consumption of Halocarbons and SF6G. Other NO NO NO NO NO NO NO NO NO3. Solvent and Other Product Use 1,992.48 1,909.27 1,860.20 1,749.68 1,746.42 1,738.38 1,709.80 1,703.66 1,711.224. AgricultureA. Enteric FermentationB. Manure ManagementC. Rice CultivationD. Agricultural Soils E. Prescribed Burning of SavannasF. Field Burning of Agricultural ResiduesG. Other 5. Land Use, Land-Use Change and Forestry -25,757.70 -22,043.93 -25,965.40 -32,356.83 -34,518.84 -33,282.91 -34,571.64 -38,364.92 -38,561.54A. Forest Land -38,057.75 -34,234.43 -38,031.87 -44,666.39 -47,763.11 -45,851.67 -47,998.65 -52,007.56 -52,399.83B. Cropland 16,837.15 16,752.20 16,589.42 16,728.06 16,673.36 16,420.25 16,600.54 16,493.45 16,727.46C. Grassland -12,361.60 -12,438.14 -12,467.20 -12,441.52 -12,578.72 -12,662.02 -12,433.60 -12,064.21 -11,928.43D. Wetlands -2,015.83 -2,089.64 -2,176.28 -2,275.76 -2,399.11 -2,527.00 -2,434.69 -2,468.87 -2,625.19E. Settlements 10,349.08 10,488.66 10,657.39 10,850.37 11,168.85 11,126.23 11,249.86 11,417.52 11,581.47F. Other Land 150.64 137.25 123.48 109.34 341.46 173.74 408.25 254.07 163.24G. Other -659.40 -659.83 -660.34 -660.92 38.43 37.56 36.63 10.68 -80.276. Waste 1,736.65 1,711.13 1,729.35 1,709.10 1,782.91 1,770.23 1,723.32 1,566.59 1,479.83A. Solid Waste Disposal on Land NA, NO NA, NO NA, NO NA, NO NA, NO NA, NO NA, NO NA, NO NA, NOB. Waste-water HandlingC. Waste Incineration 1,736.65 1,711.13 1,729.35 1,709.10 1,782.91 1,770.23 1,723.32 1,566.59 1,479.83D. Other NA NA NA NA NA NA NA NA NA7. Other (as specified in the summary table in CRF) NO NO NO NO NO NO NO NO NOTotal CO2 emissions including net CO2 from LULUCF 373,799.20 401,914.52 389,650.79 359,771.40 357,852.23 365,847.49 377,566.43 367,272.40 388,850.88Total CO2 emissions excluding net CO2 from LULUCF 399,556.90 423,958.44 415,616.18 392,128.22 392,371.07 399,130.39 412,138.07 405,637.32 427,412.42Memo Items:International Bunkers 17,065.59 17,045.09 18,055.20 18,151.09 17,699.10 18,009.25 19,011.73 20,040.78 21,684.62Aviation 8,976.85 8,661.56 9,947.10 10,355.92 10,756.71 10,847.74 11,499.97 11,759.06 12,569.79Marine 8,088.75 8,383.53 8,108.10 7,795.17 6,942.39 7,161.51 7,511.76 8,281.71 9,114.83Multilateral Operations 1.30 1.73 1.51 1.51 1.73 2.16 2.38 2.59 2.38CO2 Emissions from Biomass 42,016.19 48,359.34 47,370.41 46,032.92 42,130.98 43,206.74 46,331.26 43,059.08 43,276.10
Note: All footnotes for this table are given on sheet 3.
GREENHOUSE GAS SOURCE AND SINK CATEGORIES
Table 1 (a) FRA_BR1_v1.0Emission trends (CO2) Source: Submission 2014 v1.3, FRANCE(Sheet 2 of 3) CRF: FRA_CRF__ v1.3
1999 2000 2001 2002 2003 2004 2005 2006 2007 2008kt kt kt kt kt kt kt kt kt kt
1. Energy 394,606.69 391,279.97 392,833.36 389,147.23 398,313.20 398,961.87 403,369.78 394,789.31 384,862.26 379,357.48A. Fuel Combustion (Sectoral Approach) 390,509.58 387,005.42 388,647.40 385,208.28 394,419.18 395,013.84 399,521.10 390,612.79 380,926.67 375,194.881. Energy Industries 63,034.52 62,242.84 55,540.04 59,709.12 63,203.66 62,424.62 67,566.06 64,400.14 64,789.07 63,057.692. Manufacturing Industries and Construction 85,040.72 85,517.84 78,011.27 78,507.72 81,790.51 79,309.21 80,979.30 83,413.83 81,377.85 77,537.903. Transport 139,520.66 139,183.95 141,951.01 142,867.27 142,364.83 142,847.88 141,180.25 139,761.07 138,133.12 131,918.424. Other Sectors 102,913.68 100,060.80 113,145.07 104,124.17 107,060.18 110,432.14 109,795.50 103,037.74 96,626.63 102,680.885. Other NO NO NO NO NO NO NO NO NO NOB. Fugitive Emissions from Fuels 4,097.10 4,274.55 4,185.96 3,938.95 3,894.02 3,948.03 3,848.68 4,176.52 3,935.59 4,162.591. Solid Fuels NA, NO NA, NO NA, NO NA, NO NA, NO NA, NO NA, NO NA, NO NA, NO NA, NO2. Oil and Natural Gas 4,097.10 4,274.55 4,185.96 3,938.95 3,894.02 3,948.03 3,848.68 4,176.52 3,935.59 4,162.592. Industrial Processes 21,430.78 21,646.92 20,952.39 21,320.30 21,242.27 22,258.82 21,863.71 21,022.18 21,438.93 20,403.20A. Mineral Products 13,541.35 13,855.92 13,658.85 13,749.22 13,636.10 14,345.10 14,145.06 14,400.28 14,469.07 13,628.34B. Chemical Industry 2,986.91 3,131.61 2,979.00 2,630.33 2,495.55 2,572.55 2,770.19 2,018.19 2,415.96 2,432.80C. Metal Production 4,902.52 4,659.40 4,314.54 4,940.75 5,110.62 5,341.18 4,948.46 4,603.71 4,553.90 4,342.06D. Other Production NA NA NA NA NA NA NA NA NA NAE. Production of Halocarbons and SF6F. Consumption of Halocarbons and SF6G. Other NO NO NO NO NO NO NO NO NO NO3. Solvent and Other Product Use 1,688.26 1,753.44 1,697.89 1,595.42 1,489.40 1,430.35 1,394.55 1,333.31 1,212.32 1,103.594. AgricultureA. Enteric FermentationB. Manure ManagementC. Rice CultivationD. Agricultural Soils E. Prescribed Burning of SavannasF. Field Burning of Agricultural ResiduesG. Other 5. Land Use, Land-Use Change and Forestry -41,003.98 -30,202.73 -35,749.86 -41,614.02 -43,422.44 -44,264.89 -45,322.31 -49,759.23 -50,420.09 -50,881.23A. Forest Land -56,472.20 -42,770.87 -50,144.71 -55,730.06 -56,919.28 -59,537.45 -62,308.58 -68,476.10 -70,658.81 -71,534.56B. Cropland 16,667.29 15,608.79 15,793.53 15,315.65 15,324.32 15,157.79 15,163.40 15,258.11 15,370.40 16,141.89C. Grassland -11,332.85 -11,737.60 -10,888.27 -10,464.43 -10,986.54 -9,823.59 -8,916.66 -8,050.69 -7,219.22 -7,227.85D. Wetlands -2,612.79 -2,588.60 -2,444.48 -2,536.43 -2,635.75 -2,516.42 -2,469.91 -2,511.88 -2,632.24 -3,206.62E. Settlements 12,531.20 11,239.32 11,794.31 11,894.60 11,961.83 12,512.93 13,147.31 13,844.13 14,432.65 14,943.08F. Other Land 359.35 218.60 358.12 144.10 98.85 236.05 374.80 499.10 617.93 338.58G. Other -143.98 -172.37 -218.36 -237.45 -265.87 -294.20 -312.68 -321.89 -330.80 -335.756. Waste 1,420.30 1,493.98 1,451.74 1,450.31 1,437.23 1,344.48 1,419.62 1,465.92 1,290.48 1,404.31A. Solid Waste Disposal on Land NA, NO NA, NO NA, NO NA, NO NA, NO NA, NO NA, NO NA, NO NA, NO NA, NOB. Waste-water HandlingC. Waste Incineration 1,420.30 1,493.98 1,451.74 1,450.31 1,437.23 1,344.48 1,419.62 1,465.92 1,290.48 1,404.31D. Other NA NA NA NA NA NA NA NA NA NA7. Other (as specified in the summary table in CRF) NO NO NO NO NO NO NO NO NO NOTotal CO2 emissions including net CO2 from LULUCF 378,142.04 385,971.59 381,185.53 371,899.23 379,059.67 379,730.63 382,725.35 368,851.48 358,383.90 351,387.35Total CO2 emissions excluding net CO2 from LULUCF 419,146.03 416,174.32 416,935.39 413,513.25 422,482.11 423,995.52 428,047.67 418,610.71 408,803.99 402,268.58Memo Items:International Bunkers 23,136.16 24,049.17 22,764.02 22,560.49 23,372.44 25,581.43 24,962.16 26,209.92 27,184.00 26,032.73Aviation 13,875.23 14,483.18 14,638.46 14,675.79 14,799.99 15,822.45 16,044.34 16,949.36 17,691.47 17,749.38Marine 9,260.93 9,565.99 8,125.56 7,884.70 8,572.45 9,758.98 8,917.82 9,260.57 9,492.53 8,283.35Multilateral Operations 2.16 2.59 1.73 2.59 0.86 0.65 1.08 1.08 1.30 1.30CO2 Emissions from Biomass 41,973.64 40,679.46 41,868.98 40,322.73 43,099.12 43,819.08 43,953.93 44,385.46 45,936.06 50,986.41
Note: All footnotes for this table are given on sheet 3.
GREENHOUSE GAS SOURCE AND SINK CATEGORIES
Table 1(a) FRA_BR1_v1.0Emission trends (CO2) Source: Submission 2014 v1.3, FRANCE(Sheet 3 of 3) CRF: FRA_CRF__ v1.3
2009 2010 2011 Change from base to latest
reported year
kt kt kt %
1. Energy 363,733.11 370,271.98 343,104.80 -7.61A. Fuel Combustion (Sectoral Approach) 359,817.71 366,842.75 339,908.66 -7.401. Energy Industries 60,947.12 61,473.54 53,015.88 -16.832. Manufacturing Industries and Construction 66,723.38 70,918.01 67,196.43 -23.053. Transport 130,554.61 132,253.15 132,048.73 9.764. Other Sectors 101,592.60 102,198.05 87,647.61 -8.435. Other NO NO NO 0.00B. Fugitive Emissions from Fuels 3,915.39 3,429.22 3,196.14 -25.251. Solid Fuels NA, NO NA, NO NA, NO 0.002. Oil and Natural Gas 3,915.39 3,429.22 3,196.14 -25.25
2. Industrial Processes 17,575.87 19,324.66 18,324.48 -25.09A. Mineral Products 11,583.65 12,308.21 12,248.93 -25.88B. Chemical Industry 2,259.67 2,100.20 1,954.60 -38.64C. Metal Production 3,732.55 4,916.25 4,120.94 -13.25D. Other Production NA NA NA 0.00E. Production of Halocarbons and SF6F. Consumption of Halocarbons and SF6G. Other NO NO NO 0.00
3. Solvent and Other Product Use 967.61 1,010.92 1,036.79 -47.96
4. AgricultureA. Enteric FermentationB. Manure ManagementC. Rice CultivationD. Agricultural Soils E. Prescribed Burning of SavannasF. Field Burning of Agricultural ResiduesG. Other
5. Land Use, Land-Use Change and Forestry -41,888.87 -37,787.59 -47,594.21 84.78A. Forest Land -62,102.00 -55,437.29 -65,521.48 72.16B. Cropland 15,718.62 15,225.88 15,067.26 -10.51C. Grassland -7,468.07 -8,084.97 -7,617.89 -38.37D. Wetlands -3,270.43 -3,524.93 -3,522.29 74.73E. Settlements 14,722.07 14,255.06 14,228.99 37.49F. Other Land 852.54 127.42 127.42 -15.42G. Other -341.59 -348.74 -356.23 -45.98
6. Waste 1,392.73 1,454.68 1,368.78 -21.18A. Solid Waste Disposal on Land NA, NO NA, NO NA, NO 0.00B. Waste-water HandlingC. Waste Incineration 1,392.73 1,454.68 1,368.78 -21.18D. Other NA NA NA 0.00
7. Other (as specified in the summary table in CRF) NO NO NO 0.00
Total CO2 emissions including net CO2 from LULUCF 341,780.44 354,274.66 316,240.64 -15.40
Total CO2 emissions excluding net CO2 from LULUCF 383,669.31 392,062.24 363,834.85 -8.94
Memo Items:International Bunkers 24,657.46 24,447.71 25,645.61 50.28Aviation 16,361.96 16,390.28 17,023.83 89.64Marine 8,295.49 8,057.44 8,621.78 6.59
Multilateral Operations 1.58 1.35 1.13 -13.19
CO2 Emissions from Biomass 52,564.43 58,400.89 53,692.32 27.79
Abbreviations : CRF = common reporting format, LULUCF = land use, land-use change and forestry.
Custom Footnotes
GREENHOUSE GAS SOURCE AND SINK CATEGORIES
a The column �Base year� should be filled in only by those Parties with economies in transition that use a base year different from 1990 in accordance with the relevant decisions of the Conference of the Parties. For these Parties, this different base year is used to calculate the percentage change in the final column of this table.
b Fill in net emissions/removals as reported in CRF table Summary 1.A of the latest reported inventory year. For the purposes of reporting, the signs for removals are always negative (-) and for emissions positive (+).
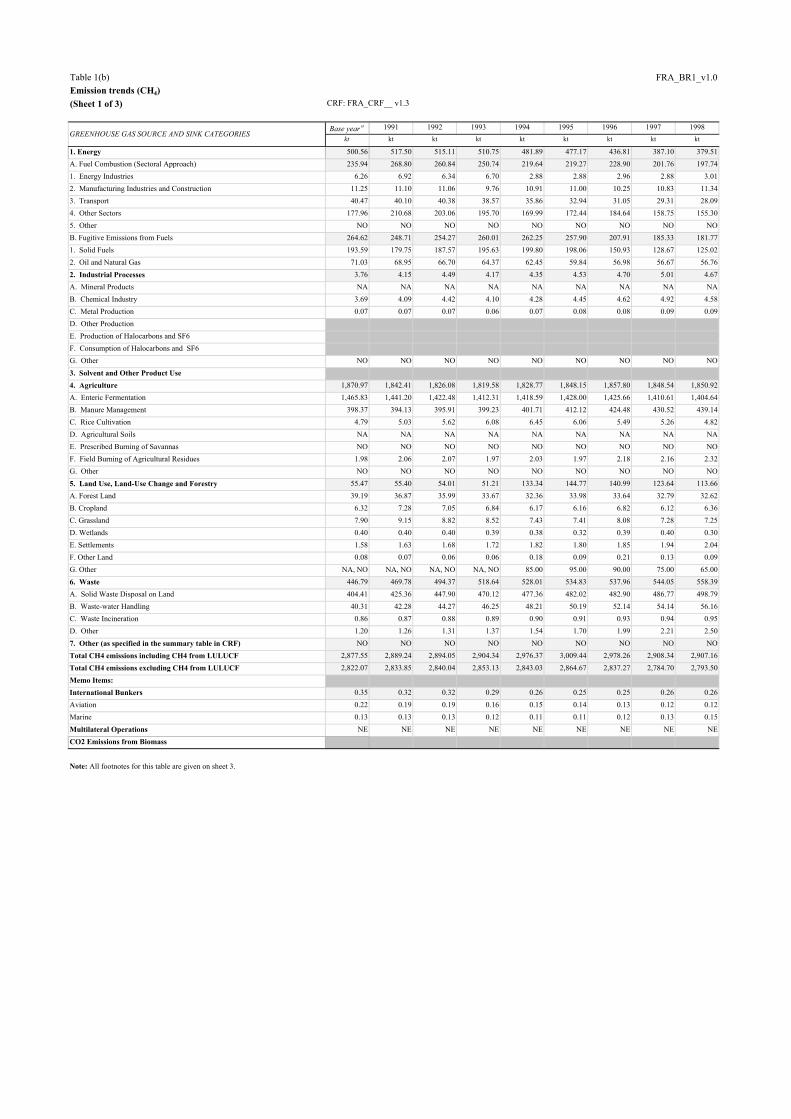
Table 1(b) FRA_BR1_v1.0Emission trends (CH4) Source: Submission 2014 v1.3, FRANCE(Sheet 1 of 3) CRF: FRA_CRF__ v1.3
Base year a 1991 1992 1993 1994 1995 1996 1997 1998kt kt kt kt kt kt kt kt kt
1. Energy 500.56 517.50 515.11 510.75 481.89 477.17 436.81 387.10 379.51A. Fuel Combustion (Sectoral Approach) 235.94 268.80 260.84 250.74 219.64 219.27 228.90 201.76 197.741. Energy Industries 6.26 6.92 6.34 6.70 2.88 2.88 2.96 2.88 3.012. Manufacturing Industries and Construction 11.25 11.10 11.06 9.76 10.91 11.00 10.25 10.83 11.343. Transport 40.47 40.10 40.38 38.57 35.86 32.94 31.05 29.31 28.094. Other Sectors 177.96 210.68 203.06 195.70 169.99 172.44 184.64 158.75 155.305. Other NO NO NO NO NO NO NO NO NOB. Fugitive Emissions from Fuels 264.62 248.71 254.27 260.01 262.25 257.90 207.91 185.33 181.771. Solid Fuels 193.59 179.75 187.57 195.63 199.80 198.06 150.93 128.67 125.022. Oil and Natural Gas 71.03 68.95 66.70 64.37 62.45 59.84 56.98 56.67 56.762. Industrial Processes 3.76 4.15 4.49 4.17 4.35 4.53 4.70 5.01 4.67A. Mineral Products NA NA NA NA NA NA NA NA NAB. Chemical Industry 3.69 4.09 4.42 4.10 4.28 4.45 4.62 4.92 4.58C. Metal Production 0.07 0.07 0.07 0.06 0.07 0.08 0.08 0.09 0.09D. Other ProductionE. Production of Halocarbons and SF6F. Consumption of Halocarbons and SF6G. Other NO NO NO NO NO NO NO NO NO3. Solvent and Other Product Use 4. Agriculture 1,870.97 1,842.41 1,826.08 1,819.58 1,828.77 1,848.15 1,857.80 1,848.54 1,850.92A. Enteric Fermentation 1,465.83 1,441.20 1,422.48 1,412.31 1,418.59 1,428.00 1,425.66 1,410.61 1,404.64B. Manure Management 398.37 394.13 395.91 399.23 401.71 412.12 424.48 430.52 439.14C. Rice Cultivation 4.79 5.03 5.62 6.08 6.45 6.06 5.49 5.26 4.82D. Agricultural Soils NA NA NA NA NA NA NA NA NAE. Prescribed Burning of Savannas NO NO NO NO NO NO NO NO NOF. Field Burning of Agricultural Residues 1.98 2.06 2.07 1.97 2.03 1.97 2.18 2.16 2.32G. Other NO NO NO NO NO NO NO NO NO5. Land Use, Land-Use Change and Forestry 55.47 55.40 54.01 51.21 133.34 144.77 140.99 123.64 113.66A. Forest Land 39.19 36.87 35.99 33.67 32.36 33.98 33.64 32.79 32.62B. Cropland 6.32 7.28 7.05 6.84 6.17 6.16 6.82 6.12 6.36C. Grassland 7.90 9.15 8.82 8.52 7.43 7.41 8.08 7.28 7.25D. Wetlands 0.40 0.40 0.40 0.39 0.38 0.32 0.39 0.40 0.30E. Settlements 1.58 1.63 1.68 1.72 1.82 1.80 1.85 1.94 2.04F. Other Land 0.08 0.07 0.06 0.06 0.18 0.09 0.21 0.13 0.09G. Other NA, NO NA, NO NA, NO NA, NO 85.00 95.00 90.00 75.00 65.006. Waste 446.79 469.78 494.37 518.64 528.01 534.83 537.96 544.05 558.39A. Solid Waste Disposal on Land 404.41 425.36 447.90 470.12 477.36 482.02 482.90 486.77 498.79B. Waste-water Handling 40.31 42.28 44.27 46.25 48.21 50.19 52.14 54.14 56.16C. Waste Incineration 0.86 0.87 0.88 0.89 0.90 0.91 0.93 0.94 0.95D. Other 1.20 1.26 1.31 1.37 1.54 1.70 1.99 2.21 2.507. Other (as specified in the summary table in CRF) NO NO NO NO NO NO NO NO NOTotal CH4 emissions including CH4 from LULUCF 2,877.55 2,889.24 2,894.05 2,904.34 2,976.37 3,009.44 2,978.26 2,908.34 2,907.16Total CH4 emissions excluding CH4 from LULUCF 2,822.07 2,833.85 2,840.04 2,853.13 2,843.03 2,864.67 2,837.27 2,784.70 2,793.50Memo Items:International Bunkers 0.35 0.32 0.32 0.29 0.26 0.25 0.25 0.26 0.26Aviation 0.22 0.19 0.19 0.16 0.15 0.14 0.13 0.12 0.12Marine 0.13 0.13 0.13 0.12 0.11 0.11 0.12 0.13 0.15Multilateral Operations NE NE NE NE NE NE NE NE NECO2 Emissions from Biomass
Note: All footnotes for this table are given on sheet 3.
GREENHOUSE GAS SOURCE AND SINK CATEGORIES

Table 1(b) FRA_BR1_v1.0Emission trends (CH4) Source: Submission 2014 v1.3, FRANCE(Sheet 2 of 3) CRF: FRA_CRF__ v1.3
1999 2000 2001 2002 2003 2004 2005 2006 2007 2008kt kt kt kt kt kt kt kt kt kt
1. Energy 358.06 337.78 291.05 265.82 247.81 222.78 195.33 174.47 157.24 153.07A. Fuel Combustion (Sectoral Approach) 183.28 167.35 161.94 144.95 146.09 141.18 129.79 113.43 103.75 98.891. Energy Industries 2.84 2.77 2.75 2.83 2.86 2.94 2.97 2.94 2.97 2.842. Manufacturing Industries and Construction 11.09 11.16 10.27 10.87 10.23 11.62 10.07 8.63 10.54 8.893. Transport 26.89 25.14 23.81 22.24 20.44 19.31 17.58 15.80 14.46 12.664. Other Sectors 142.47 128.28 125.11 109.01 112.56 107.32 99.16 86.06 75.79 74.505. Other NO NO NO NO NO NO NO NO NO NOB. Fugitive Emissions from Fuels 174.78 170.43 129.11 120.87 101.71 81.60 65.54 61.03 53.49 54.181. Solid Fuels 118.74 114.42 73.81 65.90 47.31 28.15 15.59 10.87 2.88 2.902. Oil and Natural Gas 56.04 56.01 55.30 54.96 54.40 53.45 49.96 50.17 50.61 51.282. Industrial Processes 4.79 4.88 5.06 4.80 5.36 5.67 4.53 4.26 4.02 3.53A. Mineral Products NA NA NA NA NA NA NA NA NA NAB. Chemical Industry 4.70 4.78 4.97 4.71 5.27 5.58 4.44 4.18 3.94 3.45C. Metal Production 0.09 0.10 0.09 0.09 0.09 0.09 0.09 0.09 0.09 0.08D. Other ProductionE. Production of Halocarbons and SF6F. Consumption of Halocarbons and SF6G. Other NO NO NO NO NO NO NO NO NO NO3. Solvent and Other Product Use 4. Agriculture 1,856.74 1,925.80 1,937.17 1,902.44 1,853.47 1,834.32 1,831.60 1,836.10 1,857.91 1,887.04A. Enteric Fermentation 1,404.37 1,454.45 1,457.64 1,420.56 1,377.28 1,359.49 1,355.51 1,358.79 1,369.90 1,388.32B. Manure Management 445.73 464.21 473.07 475.56 470.50 468.61 470.56 471.92 482.65 493.34C. Rice Cultivation 4.39 4.87 4.67 4.52 4.39 4.89 4.51 4.40 4.42 4.29D. Agricultural Soils NA NA NA NA NA NA NA NA NA NAE. Prescribed Burning of Savannas NO NO NO NO NO NO NO NO NO NOF. Field Burning of Agricultural Residues 2.25 2.26 1.78 1.79 1.30 1.33 1.02 0.99 0.94 1.09G. Other NO NO NO NO NO NO NO NO NO NO5. Land Use, Land-Use Change and Forestry 104.87 101.60 95.42 94.54 93.30 86.73 85.90 82.06 81.05 81.05A. Forest Land 30.54 32.35 29.90 32.00 33.35 28.82 29.17 25.80 25.47 25.73B. Cropland 6.25 5.67 6.08 5.61 6.14 6.30 6.41 6.42 6.36 6.87C. Grassland 7.04 6.26 6.68 6.24 6.25 6.62 6.92 7.08 7.15 7.22D. Wetlands 0.32 0.31 0.38 0.33 0.26 0.37 0.47 0.58 0.67 0.41E. Settlements 2.53 1.90 2.20 2.29 2.25 2.50 2.72 2.93 3.08 3.15F. Other Land 0.19 0.11 0.19 0.07 0.05 0.12 0.20 0.26 0.33 0.17G. Other 58.00 55.00 50.00 48.00 45.00 42.00 40.00 39.00 38.00 37.506. Waste 562.43 564.38 565.09 565.65 563.42 556.97 548.32 541.19 536.27 527.96A. Solid Waste Disposal on Land 501.51 502.55 502.34 503.21 501.30 495.18 485.83 477.99 472.46 463.58B. Waste-water Handling 56.59 57.11 57.66 56.97 56.26 55.56 55.94 56.29 56.61 56.89C. Waste Incineration 0.96 0.97 0.98 0.99 1.00 1.01 1.02 1.04 1.05 1.06D. Other 3.37 3.75 4.11 4.49 4.86 5.22 5.53 5.87 6.15 6.427. Other (as specified in the summary table in CRF) NO NO NO NO NO NO NO NO NO NOTotal CH4 emissions including CH4 from LULUCF 2,886.90 2,934.44 2,893.80 2,833.24 2,763.36 2,706.47 2,665.68 2,638.08 2,636.50 2,652.65Total CH4 emissions excluding CH4 from LULUCF 2,782.03 2,832.84 2,798.38 2,738.71 2,670.05 2,619.74 2,579.78 2,556.02 2,555.45 2,571.60Memo Items:International Bunkers 0.26 0.27 0.23 0.22 0.23 0.25 0.24 0.25 0.25 0.23Aviation 0.12 0.11 0.10 0.09 0.09 0.09 0.09 0.10 0.10 0.10Marine 0.15 0.15 0.13 0.13 0.14 0.16 0.14 0.15 0.15 0.13Multilateral Operations NE NE NE NE NE NE NE NE NE NECO2 Emissions from Biomass
Note: All footnotes for this table are given on sheet 3.
GREENHOUSE GAS SOURCE AND SINK CATEGORIES
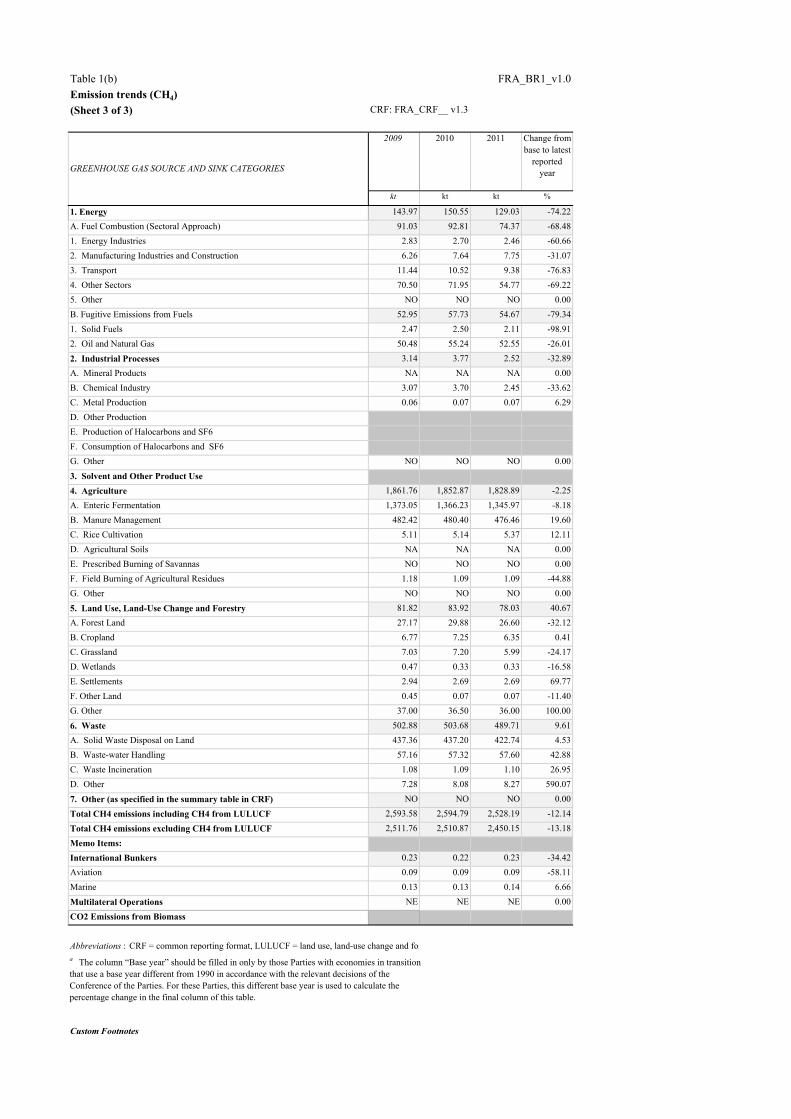
Table 1(b) FRA_BR1_v1.0Emission trends (CH4) Source: Submission 2014 v1.3, FRANCE(Sheet 3 of 3) CRF: FRA_CRF__ v1.3
2009 2010 2011 Change from base to latest
reported year
kt kt kt %
1. Energy 143.97 150.55 129.03 -74.22A. Fuel Combustion (Sectoral Approach) 91.03 92.81 74.37 -68.481. Energy Industries 2.83 2.70 2.46 -60.662. Manufacturing Industries and Construction 6.26 7.64 7.75 -31.073. Transport 11.44 10.52 9.38 -76.834. Other Sectors 70.50 71.95 54.77 -69.225. Other NO NO NO 0.00B. Fugitive Emissions from Fuels 52.95 57.73 54.67 -79.341. Solid Fuels 2.47 2.50 2.11 -98.912. Oil and Natural Gas 50.48 55.24 52.55 -26.01
2. Industrial Processes 3.14 3.77 2.52 -32.89A. Mineral Products NA NA NA 0.00B. Chemical Industry 3.07 3.70 2.45 -33.62C. Metal Production 0.06 0.07 0.07 6.29D. Other ProductionE. Production of Halocarbons and SF6F. Consumption of Halocarbons and SF6G. Other NO NO NO 0.00
3. Solvent and Other Product Use 4. Agriculture 1,861.76 1,852.87 1,828.89 -2.25A. Enteric Fermentation 1,373.05 1,366.23 1,345.97 -8.18B. Manure Management 482.42 480.40 476.46 19.60C. Rice Cultivation 5.11 5.14 5.37 12.11D. Agricultural Soils NA NA NA 0.00E. Prescribed Burning of Savannas NO NO NO 0.00F. Field Burning of Agricultural Residues 1.18 1.09 1.09 -44.88G. Other NO NO NO 0.00
5. Land Use, Land-Use Change and Forestry 81.82 83.92 78.03 40.67A. Forest Land 27.17 29.88 26.60 -32.12B. Cropland 6.77 7.25 6.35 0.41C. Grassland 7.03 7.20 5.99 -24.17D. Wetlands 0.47 0.33 0.33 -16.58E. Settlements 2.94 2.69 2.69 69.77F. Other Land 0.45 0.07 0.07 -11.40G. Other 37.00 36.50 36.00 100.00
6. Waste 502.88 503.68 489.71 9.61A. Solid Waste Disposal on Land 437.36 437.20 422.74 4.53B. Waste-water Handling 57.16 57.32 57.60 42.88C. Waste Incineration 1.08 1.09 1.10 26.95D. Other 7.28 8.08 8.27 590.07
7. Other (as specified in the summary table in CRF) NO NO NO 0.00
Total CH4 emissions including CH4 from LULUCF 2,593.58 2,594.79 2,528.19 -12.14
Total CH4 emissions excluding CH4 from LULUCF 2,511.76 2,510.87 2,450.15 -13.18
Memo Items:International Bunkers 0.23 0.22 0.23 -34.42Aviation 0.09 0.09 0.09 -58.11Marine 0.13 0.13 0.14 6.66
Multilateral Operations NE NE NE 0.00
CO2 Emissions from Biomass
Custom Footnotes
GREENHOUSE GAS SOURCE AND SINK CATEGORIES
Abbreviations : CRF = common reporting format, LULUCF = land use, land-use change and fora The column �Base year� should be filled in only by those Parties with economies in transition that use a base year different from 1990 in accordance with the relevant decisions of the Conference of the Parties. For these Parties, this different base year is used to calculate the percentage change in the final column of this table.
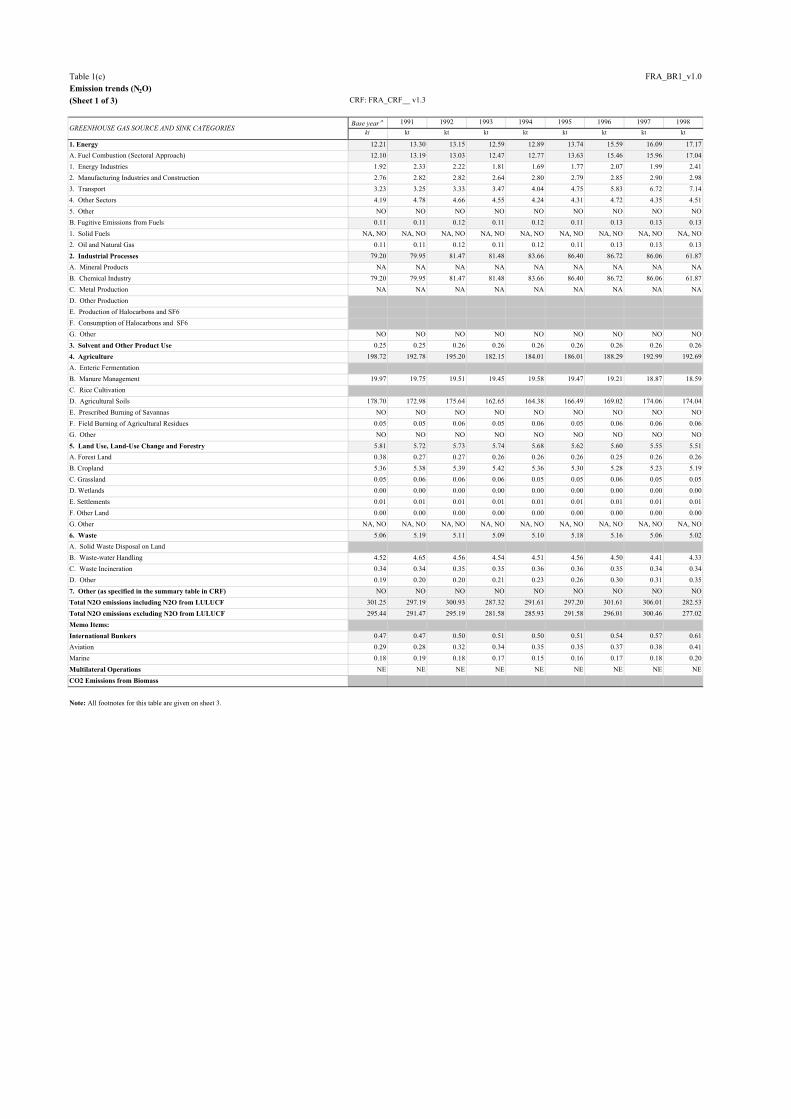
Table 1(c) FRA_BR1_v1.0Emission trends (N2O) Source: Submission 2014 v1.3, FRANCE(Sheet 1 of 3) CRF: FRA_CRF__ v1.3
Base year a 1991 1992 1993 1994 1995 1996 1997 1998kt kt kt kt kt kt kt kt kt
1. Energy 12.21 13.30 13.15 12.59 12.89 13.74 15.59 16.09 17.17A. Fuel Combustion (Sectoral Approach) 12.10 13.19 13.03 12.47 12.77 13.63 15.46 15.96 17.041. Energy Industries 1.92 2.33 2.22 1.81 1.69 1.77 2.07 1.99 2.412. Manufacturing Industries and Construction 2.76 2.82 2.82 2.64 2.80 2.79 2.85 2.90 2.983. Transport 3.23 3.25 3.33 3.47 4.04 4.75 5.83 6.72 7.144. Other Sectors 4.19 4.78 4.66 4.55 4.24 4.31 4.72 4.35 4.515. Other NO NO NO NO NO NO NO NO NOB. Fugitive Emissions from Fuels 0.11 0.11 0.12 0.11 0.12 0.11 0.13 0.13 0.131. Solid Fuels NA, NO NA, NO NA, NO NA, NO NA, NO NA, NO NA, NO NA, NO NA, NO2. Oil and Natural Gas 0.11 0.11 0.12 0.11 0.12 0.11 0.13 0.13 0.132. Industrial Processes 79.20 79.95 81.47 81.48 83.66 86.40 86.72 86.06 61.87A. Mineral Products NA NA NA NA NA NA NA NA NAB. Chemical Industry 79.20 79.95 81.47 81.48 83.66 86.40 86.72 86.06 61.87C. Metal Production NA NA NA NA NA NA NA NA NAD. Other ProductionE. Production of Halocarbons and SF6F. Consumption of Halocarbons and SF6G. Other NO NO NO NO NO NO NO NO NO3. Solvent and Other Product Use 0.25 0.25 0.26 0.26 0.26 0.26 0.26 0.26 0.264. Agriculture 198.72 192.78 195.20 182.15 184.01 186.01 188.29 192.99 192.69A. Enteric FermentationB. Manure Management 19.97 19.75 19.51 19.45 19.58 19.47 19.21 18.87 18.59C. Rice CultivationD. Agricultural Soils 178.70 172.98 175.64 162.65 164.38 166.49 169.02 174.06 174.04E. Prescribed Burning of Savannas NO NO NO NO NO NO NO NO NOF. Field Burning of Agricultural Residues 0.05 0.05 0.06 0.05 0.06 0.05 0.06 0.06 0.06G. Other NO NO NO NO NO NO NO NO NO5. Land Use, Land-Use Change and Forestry 5.81 5.72 5.73 5.74 5.68 5.62 5.60 5.55 5.51A. Forest Land 0.38 0.27 0.27 0.26 0.26 0.26 0.25 0.26 0.26B. Cropland 5.36 5.38 5.39 5.42 5.36 5.30 5.28 5.23 5.19C. Grassland 0.05 0.06 0.06 0.06 0.05 0.05 0.06 0.05 0.05D. Wetlands 0.00 0.00 0.00 0.00 0.00 0.00 0.00 0.00 0.00E. Settlements 0.01 0.01 0.01 0.01 0.01 0.01 0.01 0.01 0.01F. Other Land 0.00 0.00 0.00 0.00 0.00 0.00 0.00 0.00 0.00G. Other NA, NO NA, NO NA, NO NA, NO NA, NO NA, NO NA, NO NA, NO NA, NO6. Waste 5.06 5.19 5.11 5.09 5.10 5.18 5.16 5.06 5.02A. Solid Waste Disposal on LandB. Waste-water Handling 4.52 4.65 4.56 4.54 4.51 4.56 4.50 4.41 4.33C. Waste Incineration 0.34 0.34 0.35 0.35 0.36 0.36 0.35 0.34 0.34D. Other 0.19 0.20 0.20 0.21 0.23 0.26 0.30 0.31 0.357. Other (as specified in the summary table in CRF) NO NO NO NO NO NO NO NO NOTotal N2O emissions including N2O from LULUCF 301.25 297.19 300.93 287.32 291.61 297.20 301.61 306.01 282.53Total N2O emissions excluding N2O from LULUCF 295.44 291.47 295.19 281.58 285.93 291.58 296.01 300.46 277.02Memo Items:International Bunkers 0.47 0.47 0.50 0.51 0.50 0.51 0.54 0.57 0.61Aviation 0.29 0.28 0.32 0.34 0.35 0.35 0.37 0.38 0.41Marine 0.18 0.19 0.18 0.17 0.15 0.16 0.17 0.18 0.20Multilateral Operations NE NE NE NE NE NE NE NE NECO2 Emissions from Biomass
Note: All footnotes for this table are given on sheet 3.
GREENHOUSE GAS SOURCE AND SINK CATEGORIES
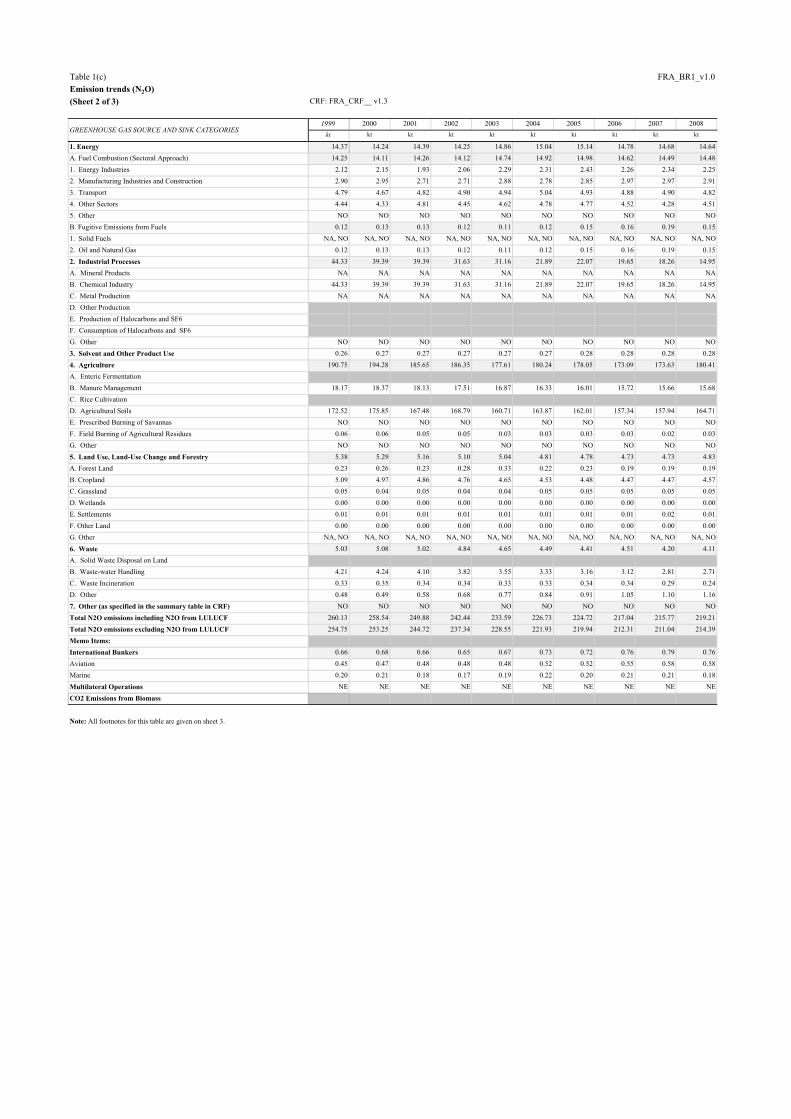
Table 1(c) FRA_BR1_v1.0Emission trends (N2O) Source: Submission 2014 v1.3, FRANCE(Sheet 2 of 3) CRF: FRA_CRF__ v1.3
1999 2000 2001 2002 2003 2004 2005 2006 2007 2008kt kt kt kt kt kt kt kt kt kt
1. Energy 14.37 14.24 14.39 14.25 14.86 15.04 15.14 14.78 14.68 14.64A. Fuel Combustion (Sectoral Approach) 14.25 14.11 14.26 14.12 14.74 14.92 14.98 14.62 14.49 14.481. Energy Industries 2.12 2.15 1.93 2.06 2.29 2.31 2.43 2.26 2.34 2.252. Manufacturing Industries and Construction 2.90 2.95 2.71 2.71 2.88 2.78 2.85 2.97 2.97 2.913. Transport 4.79 4.67 4.82 4.90 4.94 5.04 4.93 4.88 4.90 4.824. Other Sectors 4.44 4.33 4.81 4.45 4.62 4.78 4.77 4.52 4.28 4.515. Other NO NO NO NO NO NO NO NO NO NOB. Fugitive Emissions from Fuels 0.12 0.13 0.13 0.12 0.11 0.12 0.15 0.16 0.19 0.151. Solid Fuels NA, NO NA, NO NA, NO NA, NO NA, NO NA, NO NA, NO NA, NO NA, NO NA, NO2. Oil and Natural Gas 0.12 0.13 0.13 0.12 0.11 0.12 0.15 0.16 0.19 0.152. Industrial Processes 44.33 39.39 39.39 31.63 31.16 21.89 22.07 19.65 18.26 14.95A. Mineral Products NA NA NA NA NA NA NA NA NA NAB. Chemical Industry 44.33 39.39 39.39 31.63 31.16 21.89 22.07 19.65 18.26 14.95C. Metal Production NA NA NA NA NA NA NA NA NA NAD. Other ProductionE. Production of Halocarbons and SF6F. Consumption of Halocarbons and SF6G. Other NO NO NO NO NO NO NO NO NO NO3. Solvent and Other Product Use 0.26 0.27 0.27 0.27 0.27 0.27 0.28 0.28 0.28 0.284. Agriculture 190.75 194.28 185.65 186.35 177.61 180.24 178.05 173.09 173.63 180.41A. Enteric FermentationB. Manure Management 18.17 18.37 18.13 17.51 16.87 16.33 16.01 15.72 15.66 15.68C. Rice CultivationD. Agricultural Soils 172.52 175.85 167.48 168.79 160.71 163.87 162.01 157.34 157.94 164.71E. Prescribed Burning of Savannas NO NO NO NO NO NO NO NO NO NOF. Field Burning of Agricultural Residues 0.06 0.06 0.05 0.05 0.03 0.03 0.03 0.03 0.02 0.03G. Other NO NO NO NO NO NO NO NO NO NO5. Land Use, Land-Use Change and Forestry 5.38 5.29 5.16 5.10 5.04 4.81 4.78 4.73 4.73 4.83A. Forest Land 0.23 0.26 0.23 0.28 0.33 0.22 0.23 0.19 0.19 0.19B. Cropland 5.09 4.97 4.86 4.76 4.65 4.53 4.48 4.47 4.47 4.57C. Grassland 0.05 0.04 0.05 0.04 0.04 0.05 0.05 0.05 0.05 0.05D. Wetlands 0.00 0.00 0.00 0.00 0.00 0.00 0.00 0.00 0.00 0.00E. Settlements 0.01 0.01 0.01 0.01 0.01 0.01 0.01 0.01 0.02 0.01F. Other Land 0.00 0.00 0.00 0.00 0.00 0.00 0.00 0.00 0.00 0.00G. Other NA, NO NA, NO NA, NO NA, NO NA, NO NA, NO NA, NO NA, NO NA, NO NA, NO6. Waste 5.03 5.08 5.02 4.84 4.65 4.49 4.41 4.51 4.20 4.11A. Solid Waste Disposal on LandB. Waste-water Handling 4.21 4.24 4.10 3.82 3.55 3.33 3.16 3.12 2.81 2.71C. Waste Incineration 0.33 0.35 0.34 0.34 0.33 0.33 0.34 0.34 0.29 0.24D. Other 0.48 0.49 0.58 0.68 0.77 0.84 0.91 1.05 1.10 1.167. Other (as specified in the summary table in CRF) NO NO NO NO NO NO NO NO NO NOTotal N2O emissions including N2O from LULUCF 260.13 258.54 249.88 242.44 233.59 226.73 224.72 217.04 215.77 219.21Total N2O emissions excluding N2O from LULUCF 254.75 253.25 244.72 237.34 228.55 221.93 219.94 212.31 211.04 214.39Memo Items:International Bunkers 0.66 0.68 0.66 0.65 0.67 0.73 0.72 0.76 0.79 0.76Aviation 0.45 0.47 0.48 0.48 0.48 0.52 0.52 0.55 0.58 0.58Marine 0.20 0.21 0.18 0.17 0.19 0.22 0.20 0.21 0.21 0.18Multilateral Operations NE NE NE NE NE NE NE NE NE NECO2 Emissions from Biomass
Note: All footnotes for this table are given on sheet 3.
GREENHOUSE GAS SOURCE AND SINK CATEGORIES
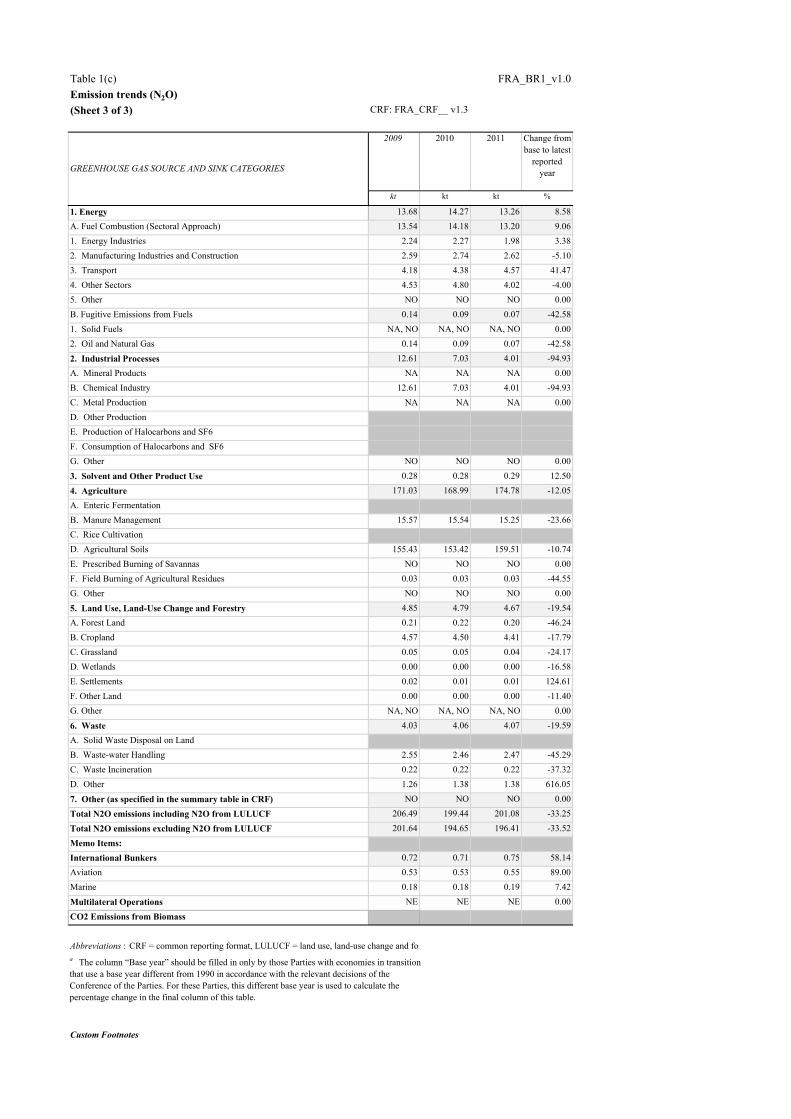
Table 1(c) FRA_BR1_v1.0Emission trends (N2O) Source: Submission 2014 v1.3, FRANCE(Sheet 3 of 3) CRF: FRA_CRF__ v1.3
2009 2010 2011 Change from base to latest
reported year
kt kt kt %
1. Energy 13.68 14.27 13.26 8.58A. Fuel Combustion (Sectoral Approach) 13.54 14.18 13.20 9.061. Energy Industries 2.24 2.27 1.98 3.382. Manufacturing Industries and Construction 2.59 2.74 2.62 -5.103. Transport 4.18 4.38 4.57 41.474. Other Sectors 4.53 4.80 4.02 -4.005. Other NO NO NO 0.00B. Fugitive Emissions from Fuels 0.14 0.09 0.07 -42.581. Solid Fuels NA, NO NA, NO NA, NO 0.002. Oil and Natural Gas 0.14 0.09 0.07 -42.58
2. Industrial Processes 12.61 7.03 4.01 -94.93A. Mineral Products NA NA NA 0.00B. Chemical Industry 12.61 7.03 4.01 -94.93C. Metal Production NA NA NA 0.00D. Other ProductionE. Production of Halocarbons and SF6F. Consumption of Halocarbons and SF6G. Other NO NO NO 0.00
3. Solvent and Other Product Use 0.28 0.28 0.29 12.50
4. Agriculture 171.03 168.99 174.78 -12.05A. Enteric FermentationB. Manure Management 15.57 15.54 15.25 -23.66C. Rice CultivationD. Agricultural Soils 155.43 153.42 159.51 -10.74E. Prescribed Burning of Savannas NO NO NO 0.00F. Field Burning of Agricultural Residues 0.03 0.03 0.03 -44.55G. Other NO NO NO 0.00
5. Land Use, Land-Use Change and Forestry 4.85 4.79 4.67 -19.54A. Forest Land 0.21 0.22 0.20 -46.24B. Cropland 4.57 4.50 4.41 -17.79C. Grassland 0.05 0.05 0.04 -24.17D. Wetlands 0.00 0.00 0.00 -16.58E. Settlements 0.02 0.01 0.01 124.61F. Other Land 0.00 0.00 0.00 -11.40G. Other NA, NO NA, NO NA, NO 0.00
6. Waste 4.03 4.06 4.07 -19.59A. Solid Waste Disposal on LandB. Waste-water Handling 2.55 2.46 2.47 -45.29C. Waste Incineration 0.22 0.22 0.22 -37.32D. Other 1.26 1.38 1.38 616.05
7. Other (as specified in the summary table in CRF) NO NO NO 0.00
Total N2O emissions including N2O from LULUCF 206.49 199.44 201.08 -33.25
Total N2O emissions excluding N2O from LULUCF 201.64 194.65 196.41 -33.52
Memo Items:International Bunkers 0.72 0.71 0.75 58.14Aviation 0.53 0.53 0.55 89.00Marine 0.18 0.18 0.19 7.42
Multilateral Operations NE NE NE 0.00
CO2 Emissions from Biomass
Custom Footnotes
GREENHOUSE GAS SOURCE AND SINK CATEGORIES
Abbreviations : CRF = common reporting format, LULUCF = land use, land-use change and fora The column �Base year� should be filled in only by those Parties with economies in transition that use a base year different from 1990 in accordance with the relevant decisions of the Conference of the Parties. For these Parties, this different base year is used to calculate the percentage change in the final column of this table.
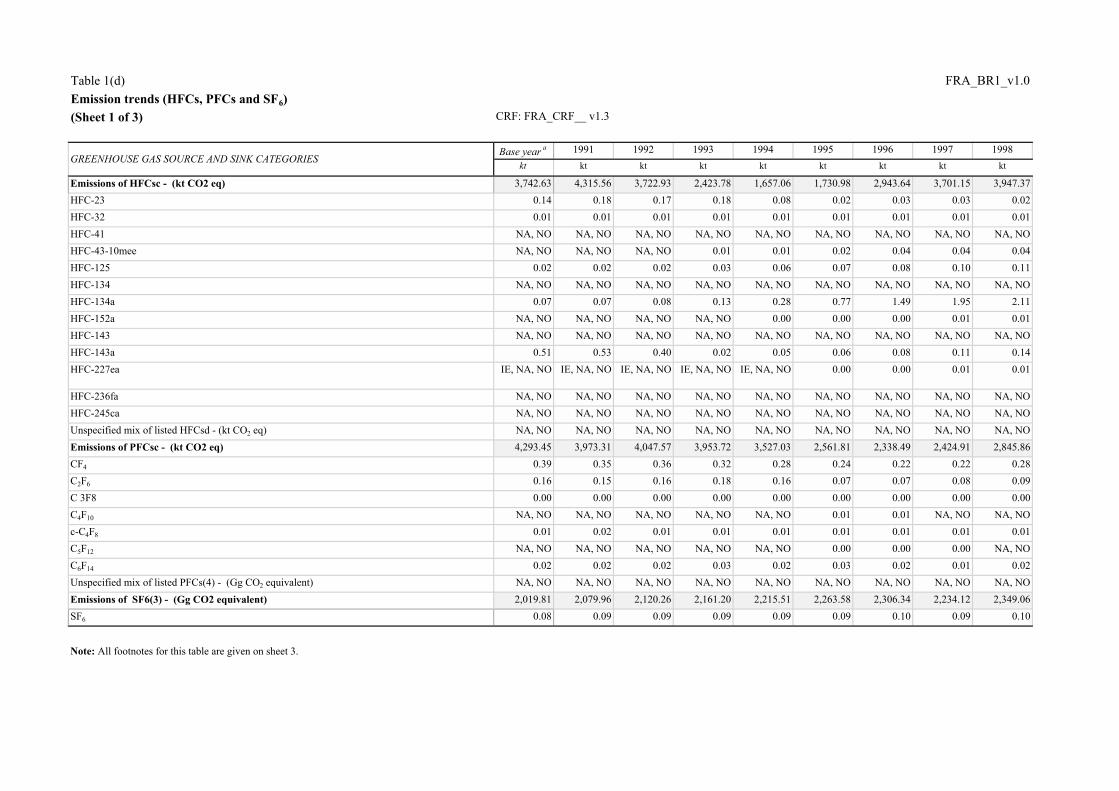
Table 1(d) FRA_BR1_v1.0Emission trends (HFCs, PFCs and SF6) Source: Submission 2014 v1.3, FRANCE(Sheet 1 of 3) CRF: FRA_CRF__ v1.3
Base year a 1991 1992 1993 1994 1995 1996 1997 1998kt kt kt kt kt kt kt kt kt
Emissions of HFCsc - (kt CO2 eq) 3,742.63 4,315.56 3,722.93 2,423.78 1,657.06 1,730.98 2,943.64 3,701.15 3,947.37HFC-23 0.14 0.18 0.17 0.18 0.08 0.02 0.03 0.03 0.02HFC-32 0.01 0.01 0.01 0.01 0.01 0.01 0.01 0.01 0.01HFC-41 NA, NO NA, NO NA, NO NA, NO NA, NO NA, NO NA, NO NA, NO NA, NOHFC-43-10mee NA, NO NA, NO NA, NO 0.01 0.01 0.02 0.04 0.04 0.04HFC-125 0.02 0.02 0.02 0.03 0.06 0.07 0.08 0.10 0.11HFC-134 NA, NO NA, NO NA, NO NA, NO NA, NO NA, NO NA, NO NA, NO NA, NOHFC-134a 0.07 0.07 0.08 0.13 0.28 0.77 1.49 1.95 2.11HFC-152a NA, NO NA, NO NA, NO NA, NO 0.00 0.00 0.00 0.01 0.01HFC-143 NA, NO NA, NO NA, NO NA, NO NA, NO NA, NO NA, NO NA, NO NA, NOHFC-143a 0.51 0.53 0.40 0.02 0.05 0.06 0.08 0.11 0.14HFC-227ea IE, NA, NO IE, NA, NO IE, NA, NO IE, NA, NO IE, NA, NO 0.00 0.00 0.01 0.01
HFC-236fa NA, NO NA, NO NA, NO NA, NO NA, NO NA, NO NA, NO NA, NO NA, NOHFC-245ca NA, NO NA, NO NA, NO NA, NO NA, NO NA, NO NA, NO NA, NO NA, NOUnspecified mix of listed HFCsd - (kt CO2 eq) NA, NO NA, NO NA, NO NA, NO NA, NO NA, NO NA, NO NA, NO NA, NOEmissions of PFCsc - (kt CO2 eq) 4,293.45 3,973.31 4,047.57 3,953.72 3,527.03 2,561.81 2,338.49 2,424.91 2,845.86CF4 0.39 0.35 0.36 0.32 0.28 0.24 0.22 0.22 0.28C2F6 0.16 0.15 0.16 0.18 0.16 0.07 0.07 0.08 0.09C 3F8 0.00 0.00 0.00 0.00 0.00 0.00 0.00 0.00 0.00C4F10 NA, NO NA, NO NA, NO NA, NO NA, NO 0.01 0.01 NA, NO NA, NOc-C4F8 0.01 0.02 0.01 0.01 0.01 0.01 0.01 0.01 0.01C5F12 NA, NO NA, NO NA, NO NA, NO NA, NO 0.00 0.00 0.00 NA, NOC6F14 0.02 0.02 0.02 0.03 0.02 0.03 0.02 0.01 0.02Unspecified mix of listed PFCs(4) - (Gg CO2 equivalent) NA, NO NA, NO NA, NO NA, NO NA, NO NA, NO NA, NO NA, NO NA, NOEmissions of SF6(3) - (Gg CO2 equivalent) 2,019.81 2,079.96 2,120.26 2,161.20 2,215.51 2,263.58 2,306.34 2,234.12 2,349.06SF6 0.08 0.09 0.09 0.09 0.09 0.09 0.10 0.09 0.10
Note: All footnotes for this table are given on sheet 3.
GREENHOUSE GAS SOURCE AND SINK CATEGORIES
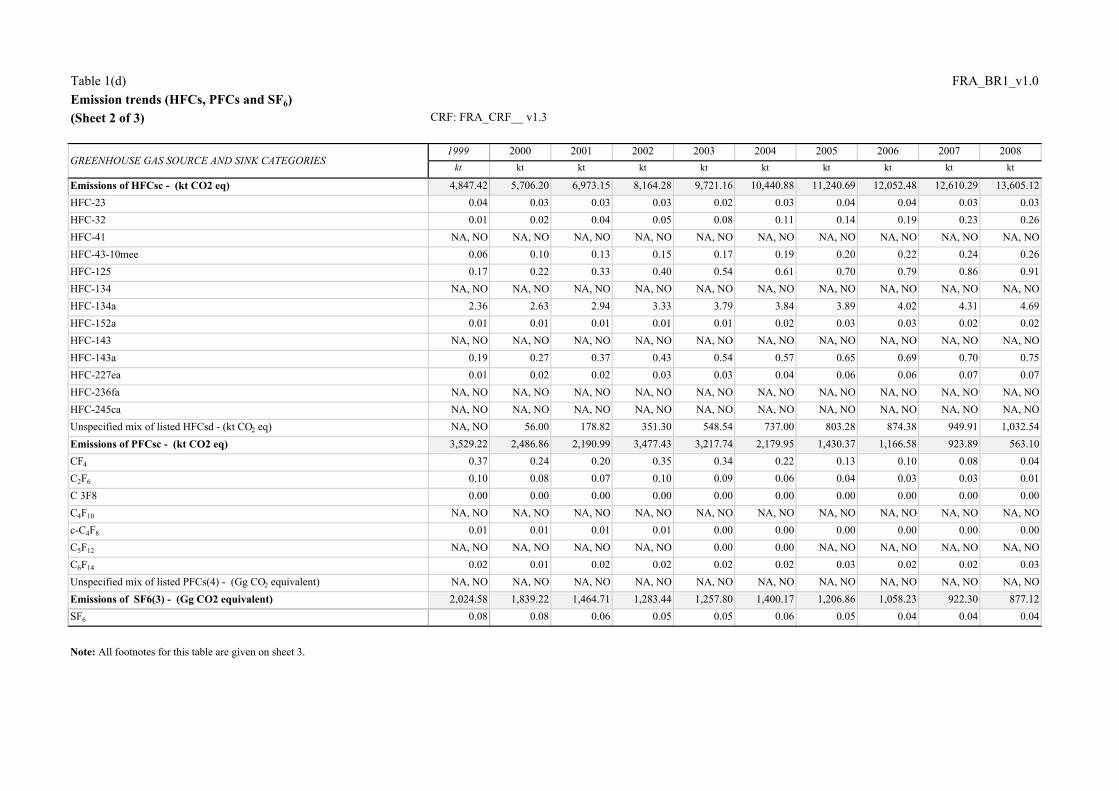
Table 1(d) FRA_BR1_v1.0Emission trends (HFCs, PFCs and SF6) Source: Submission 2014 v1.3, FRANCE(Sheet 2 of 3) CRF: FRA_CRF__ v1.3
1999 2000 2001 2002 2003 2004 2005 2006 2007 2008kt kt kt kt kt kt kt kt kt kt
Emissions of HFCsc - (kt CO2 eq) 4,847.42 5,706.20 6,973.15 8,164.28 9,721.16 10,440.88 11,240.69 12,052.48 12,610.29 13,605.12HFC-23 0.04 0.03 0.03 0.03 0.02 0.03 0.04 0.04 0.03 0.03HFC-32 0.01 0.02 0.04 0.05 0.08 0.11 0.14 0.19 0.23 0.26HFC-41 NA, NO NA, NO NA, NO NA, NO NA, NO NA, NO NA, NO NA, NO NA, NO NA, NOHFC-43-10mee 0.06 0.10 0.13 0.15 0.17 0.19 0.20 0.22 0.24 0.26HFC-125 0.17 0.22 0.33 0.40 0.54 0.61 0.70 0.79 0.86 0.91HFC-134 NA, NO NA, NO NA, NO NA, NO NA, NO NA, NO NA, NO NA, NO NA, NO NA, NOHFC-134a 2.36 2.63 2.94 3.33 3.79 3.84 3.89 4.02 4.31 4.69HFC-152a 0.01 0.01 0.01 0.01 0.01 0.02 0.03 0.03 0.02 0.02HFC-143 NA, NO NA, NO NA, NO NA, NO NA, NO NA, NO NA, NO NA, NO NA, NO NA, NOHFC-143a 0.19 0.27 0.37 0.43 0.54 0.57 0.65 0.69 0.70 0.75HFC-227ea 0.01 0.02 0.02 0.03 0.03 0.04 0.06 0.06 0.07 0.07HFC-236fa NA, NO NA, NO NA, NO NA, NO NA, NO NA, NO NA, NO NA, NO NA, NO NA, NOHFC-245ca NA, NO NA, NO NA, NO NA, NO NA, NO NA, NO NA, NO NA, NO NA, NO NA, NOUnspecified mix of listed HFCsd - (kt CO2 eq) NA, NO 56.00 178.82 351.30 548.54 737.00 803.28 874.38 949.91 1,032.54Emissions of PFCsc - (kt CO2 eq) 3,529.22 2,486.86 2,190.99 3,477.43 3,217.74 2,179.95 1,430.37 1,166.58 923.89 563.10CF4 0.37 0.24 0.20 0.35 0.34 0.22 0.13 0.10 0.08 0.04C2F6 0.10 0.08 0.07 0.10 0.09 0.06 0.04 0.03 0.03 0.01C 3F8 0.00 0.00 0.00 0.00 0.00 0.00 0.00 0.00 0.00 0.00C4F10 NA, NO NA, NO NA, NO NA, NO NA, NO NA, NO NA, NO NA, NO NA, NO NA, NOc-C4F8 0.01 0.01 0.01 0.01 0.00 0.00 0.00 0.00 0.00 0.00C5F12 NA, NO NA, NO NA, NO NA, NO 0.00 0.00 NA, NO NA, NO NA, NO NA, NOC6F14 0.02 0.01 0.02 0.02 0.02 0.02 0.03 0.02 0.02 0.03Unspecified mix of listed PFCs(4) - (Gg CO2 equivalent) NA, NO NA, NO NA, NO NA, NO NA, NO NA, NO NA, NO NA, NO NA, NO NA, NOEmissions of SF6(3) - (Gg CO2 equivalent) 2,024.58 1,839.22 1,464.71 1,283.44 1,257.80 1,400.17 1,206.86 1,058.23 922.30 877.12SF6 0.08 0.08 0.06 0.05 0.05 0.06 0.05 0.04 0.04 0.04
Note: All footnotes for this table are given on sheet 3.
GREENHOUSE GAS SOURCE AND SINK CATEGORIES
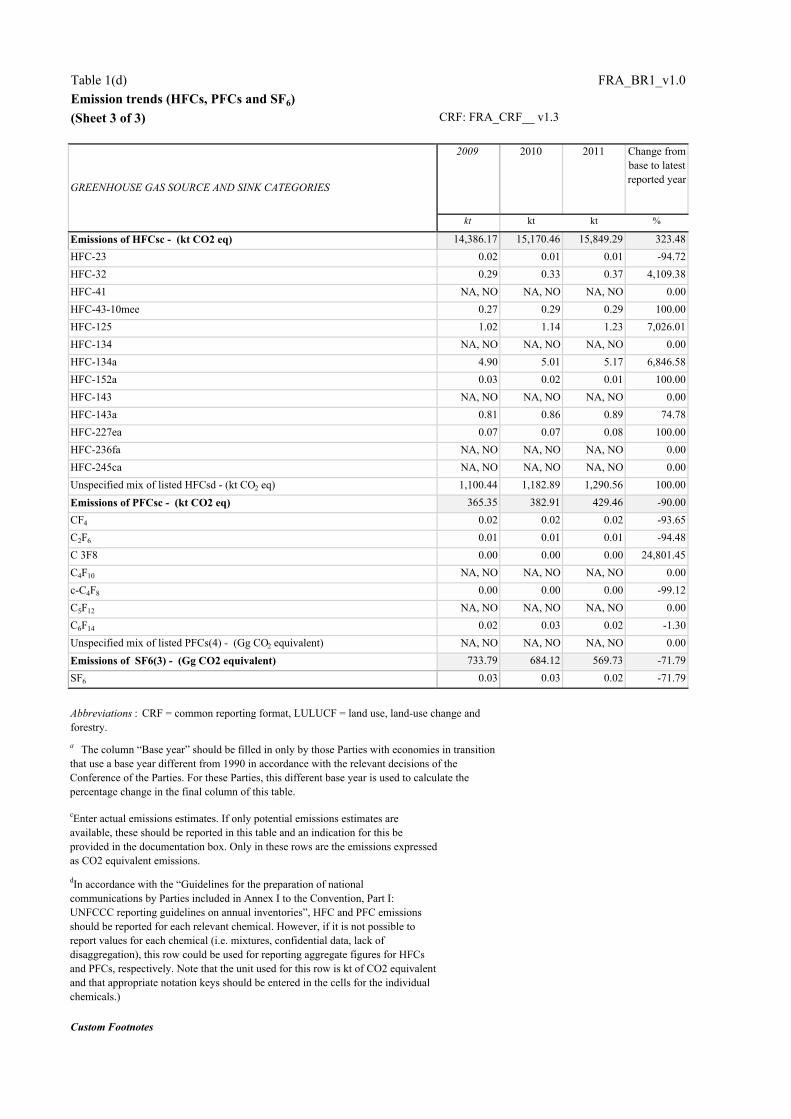
Table 1(d) FRA_BR1_v1.0Emission trends (HFCs, PFCs and SF6) Source: Submission 2014 v1.3, FRANCE(Sheet 3 of 3) CRF: FRA_CRF__ v1.3
2009 2010 2011 Change from base to latest reported year
kt kt kt %
Emissions of HFCsc - (kt CO2 eq) 14,386.17 15,170.46 15,849.29 323.48HFC-23 0.02 0.01 0.01 -94.72HFC-32 0.29 0.33 0.37 4,109.38HFC-41 NA, NO NA, NO NA, NO 0.00HFC-43-10mee 0.27 0.29 0.29 100.00HFC-125 1.02 1.14 1.23 7,026.01HFC-134 NA, NO NA, NO NA, NO 0.00HFC-134a 4.90 5.01 5.17 6,846.58HFC-152a 0.03 0.02 0.01 100.00HFC-143 NA, NO NA, NO NA, NO 0.00HFC-143a 0.81 0.86 0.89 74.78HFC-227ea 0.07 0.07 0.08 100.00HFC-236fa NA, NO NA, NO NA, NO 0.00HFC-245ca NA, NO NA, NO NA, NO 0.00Unspecified mix of listed HFCsd - (kt CO2 eq) 1,100.44 1,182.89 1,290.56 100.00Emissions of PFCsc - (kt CO2 eq) 365.35 382.91 429.46 -90.00CF4 0.02 0.02 0.02 -93.65C2F6 0.01 0.01 0.01 -94.48C 3F8 0.00 0.00 0.00 24,801.45C4F10 NA, NO NA, NO NA, NO 0.00c-C4F8 0.00 0.00 0.00 -99.12C5F12 NA, NO NA, NO NA, NO 0.00C6F14 0.02 0.03 0.02 -1.30Unspecified mix of listed PFCs(4) - (Gg CO2 equivalent) NA, NO NA, NO NA, NO 0.00Emissions of SF6(3) - (Gg CO2 equivalent) 733.79 684.12 569.73 -71.79SF6 0.03 0.03 0.02 -71.79
cEnter actual emissions estimates. If only potential emissions estimates are available, these should be reported in this table and an indication for this be provided in the documentation box. Only in these rows are the emissions expressed as CO2 equivalent emissions.
dIn accordance with the �Guidelines for the preparation of national communications by Parties included in Annex I to the Convention, Part I: UNFCCC reporting guidelines on annual inventories�, HFC and PFC emissions should be reported for each relevant chemical. However, if it is not possible to report values for each chemical (i.e. mixtures, confidential data, lack of disaggregation), this row could be used for reporting aggregate figures for HFCs and PFCs, respectively. Note that the unit used for this row is kt of CO2 equivalent and that appropriate notation keys should be entered in the cells for the individual chemicals.)
Custom Footnotes
GREENHOUSE GAS SOURCE AND SINK CATEGORIES
Abbreviations : CRF = common reporting format, LULUCF = land use, land-use change and forestry.a The column �Base year� should be filled in only by those Parties with economies in transition that use a base year different from 1990 in accordance with the relevant decisions of the Conference of the Parties. For these Parties, this different base year is used to calculate the percentage change in the final column of this table.

Table 2(a) FRA_BR1_v1.0Description of quantified economy-wide emission reduction target: base year a
PartyBase year /base period
% of base year/base period % of 1990 b
20.00 20.00Period for reaching target
b Optional.
France1990
BY-2020
a Reporting by a developed country Party on the information specified in the common tabular format does not prejudge the position of other Parties with regard to the treatment of units from market-based mechanisms under the Convention or other market-based mechanisms towards achievement of quantified economy-wide emission reduction targets.
Emission reduction target
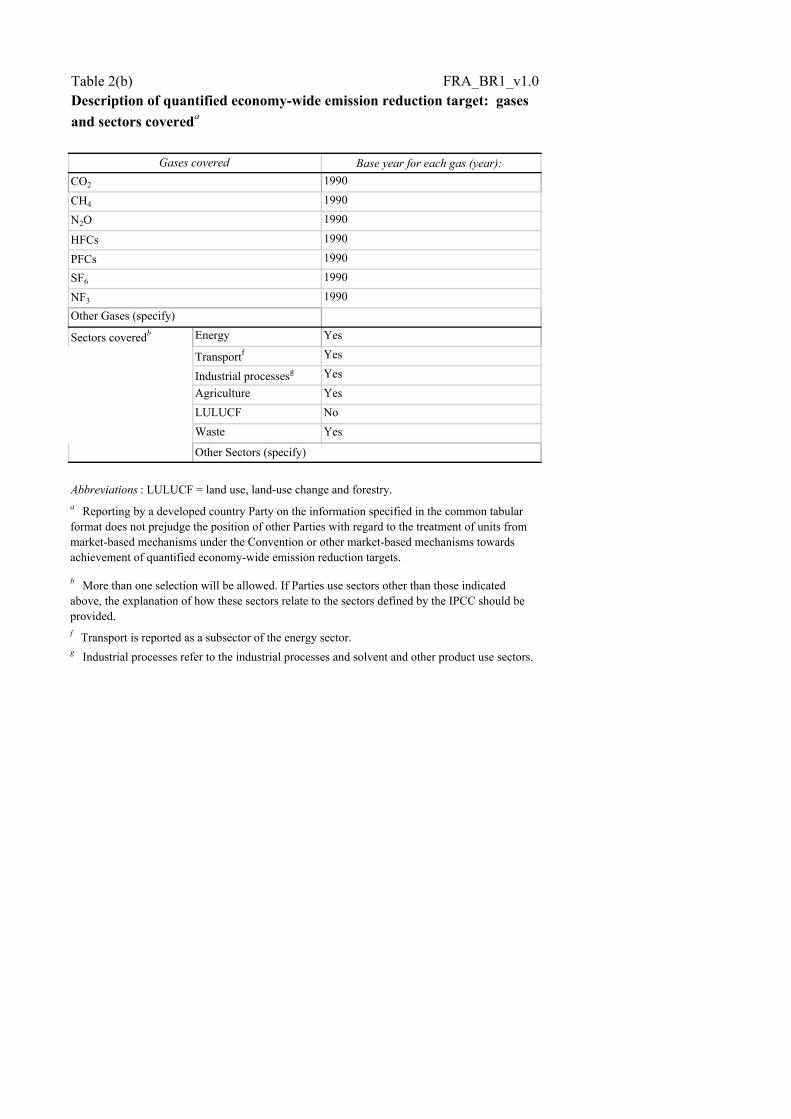
Table 2(b) FRA_BR1_v1.0
Base year for each gas (year): 1990199019901990199019901990
Energy Yes
Transportf Yes
Industrial processesg YesAgriculture YesLULUCF NoWaste Yes
Abbreviations : LULUCF = land use, land-use change and forestry.
Description of quantified economy-wide emission reduction target: gases and sectors covereda
Gases covered CO2
CH4
N2O
HFCsPFCsSF6
NF3
Other Sectors (specify)
Other Gases (specify)
Sectors coveredb
b More than one selection will be allowed. If Parties use sectors other than those indicated above, the explanation of how these sectors relate to the sectors defined by the IPCC should be provided.
g Industrial processes refer to the industrial processes and solvent and other product use sectors.
a Reporting by a developed country Party on the information specified in the common tabular format does not prejudge the position of other Parties with regard to the treatment of units from market-based mechanisms under the Convention or other market-based mechanisms towards achievement of quantified economy-wide emission reduction targets.
f Transport is reported as a subsector of the energy sector.

Table 2(c) FRA_BR1_v1.0
Gases GWP values b
CO2 4nd ARCH4 4nd ARN2O 4nd ARHFCs 4nd ARPFCs 4nd ARSF6 4nd ARNF3 4nd AR
Abbreviations : GWP = global warming potential
Description of quantified economy-wide emission reduction target: global warming potential values (GWP)a
a Reporting by a developed country Party on the information specified in the common tabular format does not prejudge the position of other Parties with regard to the treatment of units from market-based mechanisms under the Convention or other market-based mechanisms towards achievement of quantified economy-wide emission reduction targets.b Please specify the reference for the GWP: Second Assessment Report of the Intergovernmental Panel on Climate Change (IPCC) or the Fourth Assessment Report of the IPCC.
Other Gases (specify)
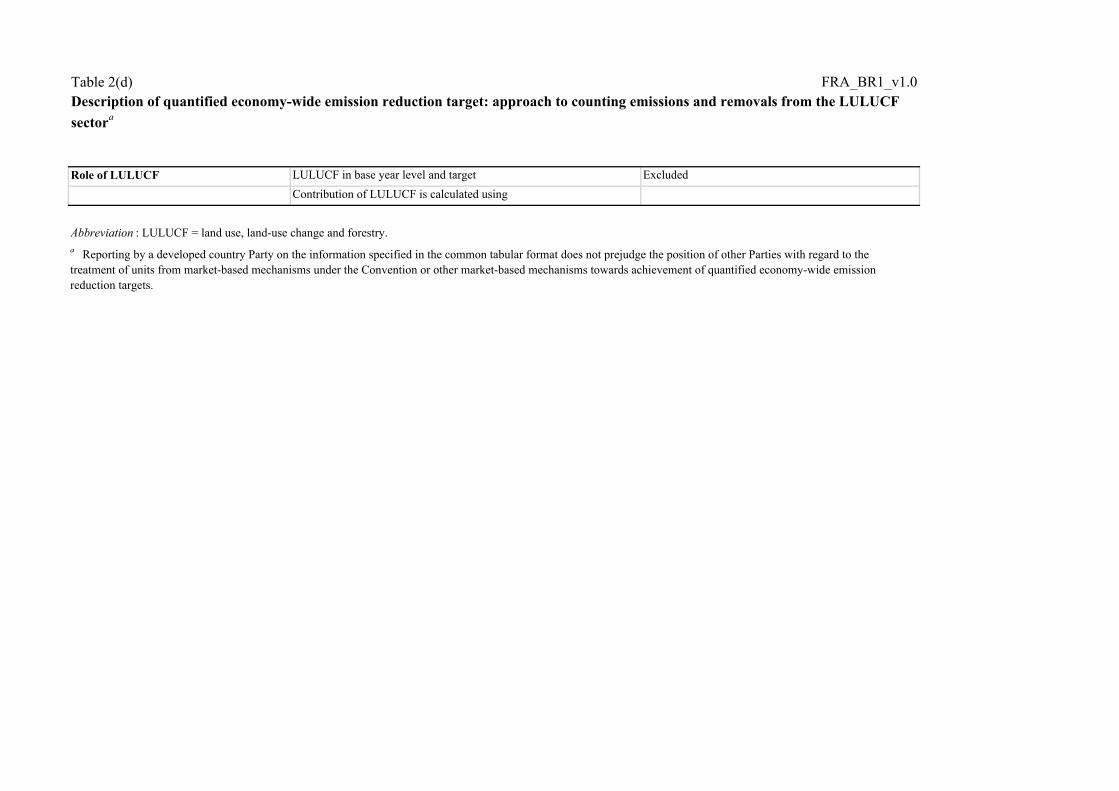
Table 2(d) FRA_BR1_v1.0
Role of LULUCF LULUCF in base year level and target ExcludedContribution of LULUCF is calculated using
Abbreviation : LULUCF = land use, land-use change and forestry.a Reporting by a developed country Party on the information specified in the common tabular format does not prejudge the position of other Parties with regard to the treatment of units from market-based mechanisms under the Convention or other market-based mechanisms towards achievement of quantified economy-wide emission reduction targets.
Description of quantified economy-wide emission reduction target: approach to counting emissions and removals from the LULUCF sectora
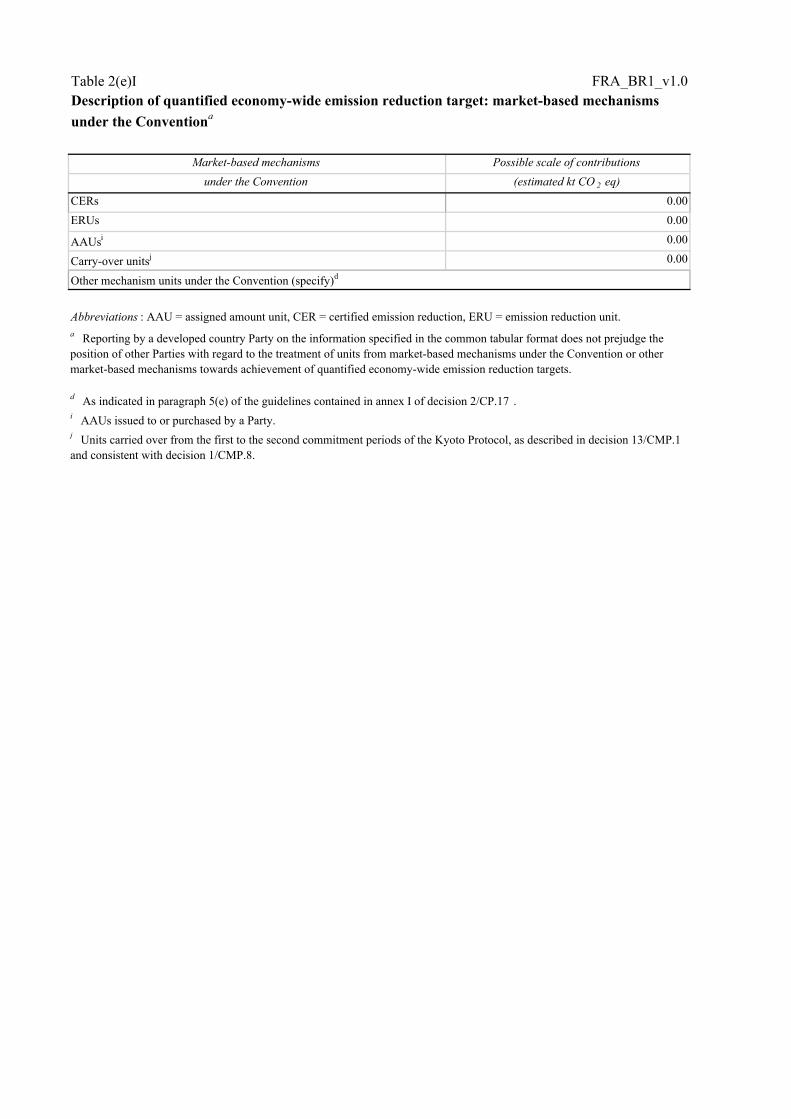
Table 2(e)I FRA_BR1_v1.0
Market-based mechanisms Possible scale of contributions under the Convention (estimated kt CO 2 eq)
CERs 0.00ERUs 0.00
AAUsi 0.00
Carry-over unitsj 0.00
Abbreviations : AAU = assigned amount unit, CER = certified emission reduction, ERU = emission reduction unit.
i AAUs issued to or purchased by a Party.j Units carried over from the first to the second commitment periods of the Kyoto Protocol, as described in decision 13/CMP.1 and consistent with decision 1/CMP.8.
a Reporting by a developed country Party on the information specified in the common tabular format does not prejudge the position of other Parties with regard to the treatment of units from market-based mechanisms under the Convention or other market-based mechanisms towards achievement of quantified economy-wide emission reduction targets.
d As indicated in paragraph 5(e) of the guidelines contained in annex I of decision 2/CP.17 .
Description of quantified economy-wide emission reduction target: market-based mechanisms under the Conventiona
Other mechanism units under the Convention (specify)d
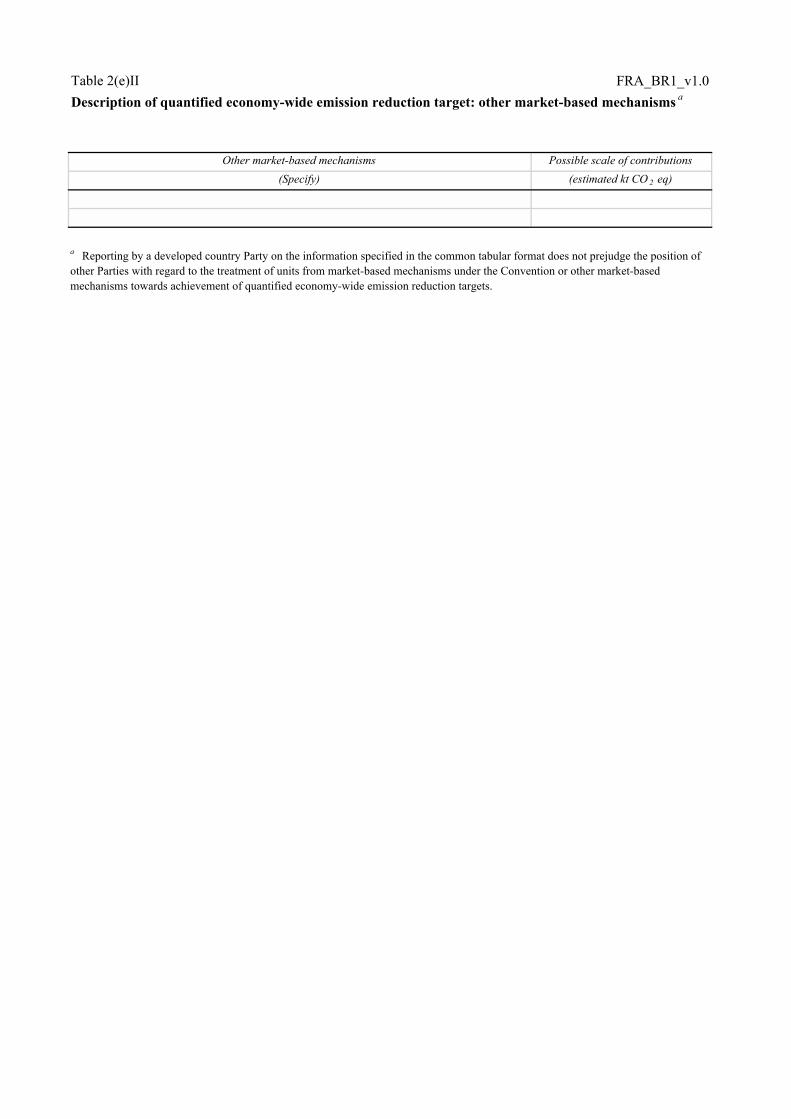
Table 2(e)II FRA_BR1_v1.0
Other market-based mechanisms Possible scale of contributions (Specify) (estimated kt CO 2 eq)
a Reporting by a developed country Party on the information specified in the common tabular format does not prejudge the position of other Parties with regard to the treatment of units from market-based mechanisms under the Convention or other market-based mechanisms towards achievement of quantified economy-wide emission reduction targets.
Description of quantified economy-wide emission reduction target: other market-based mechanisms a
Table 2(f) FRA_BR1_v1.0
Description of quantified economy-wide emission reduction target: any other information a,b
Custom Footnotes
a Reporting by a developed country Party on the information specified in the common tabular format does not prejudge the position of other Parties with regard to the treatment of units from market-based mechanisms under the Convention or other market-based mechanisms towards achievement of quantified economy-wide emission reduction targets.
b This information could include information on the domestic legal status of the target or the total assigned amount of emission units for the period for reaching a target. Some of this information is presented in the narrative part of the biennial report.
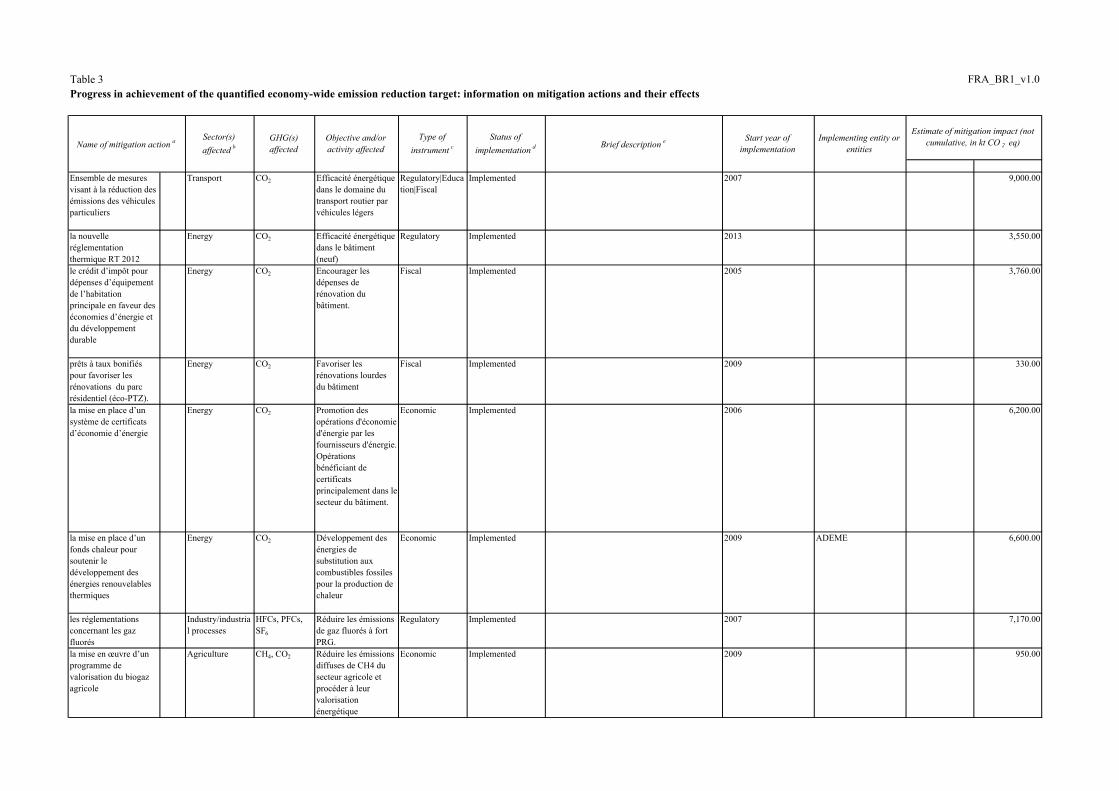
Table 3 FRA_BR1_v1.0Progress in achievement of the quantified economy-wide emission reduction target: information on mitigation actions and their effects
Ensemble de mesures visant à la réduction des émissions des véhicules particuliers
Transport CO2 Efficacité énergétique dans le domaine du transport routier par véhicules légers
Regulatory|Education|Fiscal
Implemented 2007 9,000.00
la nouvelle réglementation thermique RT 2012
Energy CO2 Efficacité énergétique dans le bâtiment (neuf)
Regulatory Implemented 2013 3,550.00
le crédit d�impôt pour dépenses d�équipement de l�habitation principale en faveur des économies d�énergie et du développement durable
Energy CO2 Encourager les dépenses de rénovation du bâtiment.
Fiscal Implemented 2005 3,760.00
prêts à taux bonifiés pour favoriser les rénovations du parc résidentiel (éco-PTZ).
Energy CO2 Favoriser les rénovations lourdes du bâtiment
Fiscal Implemented 2009 330.00
la mise en place d�un système de certificats d�économie d�énergie
Energy CO2 Promotion des opérations d'économie d'énergie par les fournisseurs d'énergie. Opérations bénéficiant de certificats principalement dans le secteur du bâtiment.
Economic Implemented 2006 6,200.00
la mise en place d�un fonds chaleur pour soutenir le développement des énergies renouvelables thermiques
Energy CO2 Développement des énergies de substitution aux combustibles fossiles pour la production de chaleur
Economic Implemented 2009 ADEME 6,600.00
les réglementations concernant les gaz fluorés
Industry/industrial processes
HFCs, PFCs, SF6
Réduire les émissions de gaz fluorés à fort PRG.
Regulatory Implemented 2007 7,170.00
la mise en �uvre d�un programme de valorisation du biogaz agricole
Agriculture CH4, CO2 Réduire les émissions diffuses de CH4 du secteur agricole et procéder à leur valorisation énergétique
Economic Implemented 2009 950.00
Brief description e Start year of implementation
Implementing entity or entitiesName of mitigation action a
Estimate of mitigation impact (not cumulative, in kt CO 2 eq)Objective and/or
activity affectedType of
instrument cStatus of
implementation dSector(s) affected b
GHG(s) affected
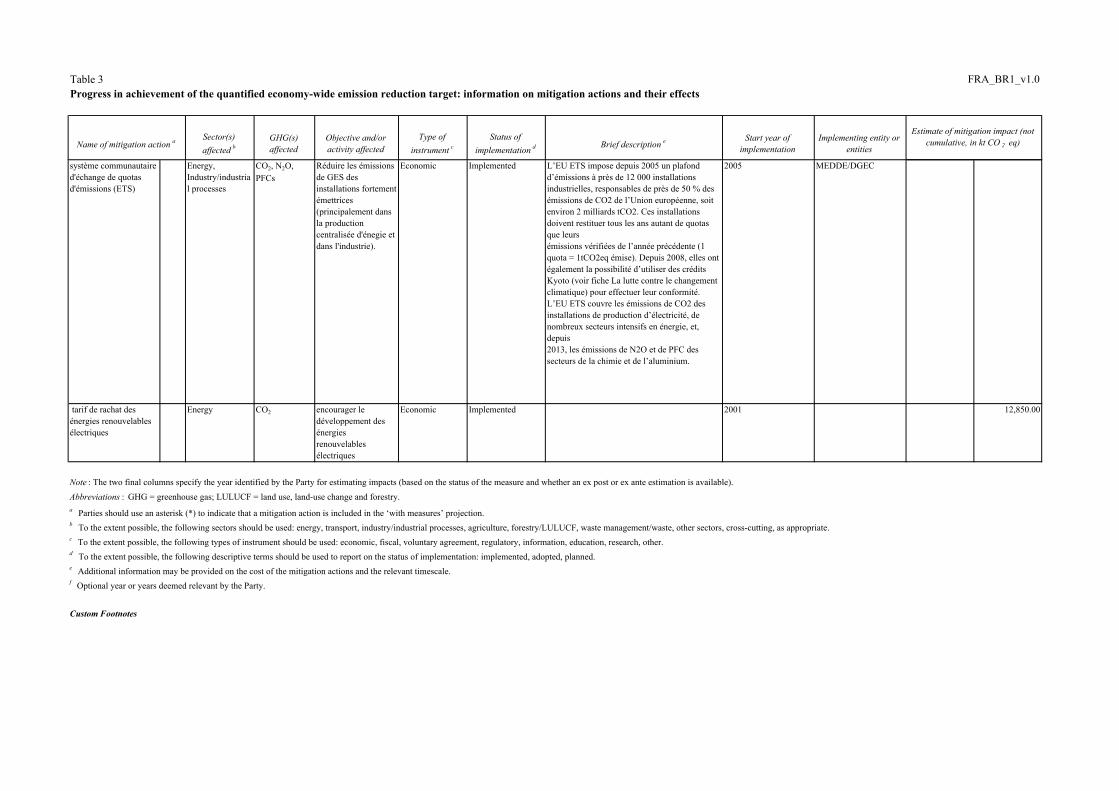
Table 3 FRA_BR1_v1.0Progress in achievement of the quantified economy-wide emission reduction target: information on mitigation actions and their effects
Brief description e Start year of implementation
Implementing entity or entitiesName of mitigation action a
Estimate of mitigation impact (not cumulative, in kt CO 2 eq)Objective and/or
activity affectedType of
instrument cStatus of
implementation dSector(s) affected b
GHG(s) affected
système communautaire d'échange de quotas d'émissions (ETS)
Energy, Industry/industrial processes
CO2, N2O, PFCs
Réduire les émissions de GES des installations fortement émettrices (principalement dans la production centralisée d'énegie et dans l'industrie).
Economic Implemented L�EU ETS impose depuis 2005 un plafond d�émissions à près de 12 000 installationsindustrielles, responsables de près de 50 % des émissions de CO2 de l�Union européenne, soitenviron 2 milliards tCO2. Ces installations doivent restituer tous les ans autant de quotas que leursémissions vérifiées de l�année précédente (1 quota = 1tCO2eq émise). Depuis 2008, elles ontégalement la possibilité d�utiliser des crédits Kyoto (voir fiche La lutte contre le changementclimatique) pour effectuer leur conformité. L�EU ETS couvre les émissions de CO2 desinstallations de production d�électricité, de nombreux secteurs intensifs en énergie, et, depuis2013, les émissions de N2O et de PFC des secteurs de la chimie et de l�aluminium.
2005 MEDDE/DGEC
tarif de rachat des énergies renouvelables électriques
Energy CO2 encourager le développement des énergies renouvelables électriques
Economic Implemented 2001 12,850.00
Note : The two final columns specify the year identified by the Party for estimating impacts (based on the status of the measure and whether an ex post or ex ante estimation is available).
Abbreviations : GHG = greenhouse gas; LULUCF = land use, land-use change and forestry.
Custom Footnotes
a Parties should use an asterisk (*) to indicate that a mitigation action is included in the �with measures� projection.b To the extent possible, the following sectors should be used: energy, transport, industry/industrial processes, agriculture, forestry/LULUCF, waste management/waste, other sectors, cross-cutting, as appropriate. c To the extent possible, the following types of instrument should be used: economic, fiscal, voluntary agreement, regulatory, information, education, research, other.d To the extent possible, the following descriptive terms should be used to report on the status of implementation: implemented, adopted, planned. e Additional information may be provided on the cost of the mitigation actions and the relevant timescale.f Optional year or years deemed relevant by the Party.
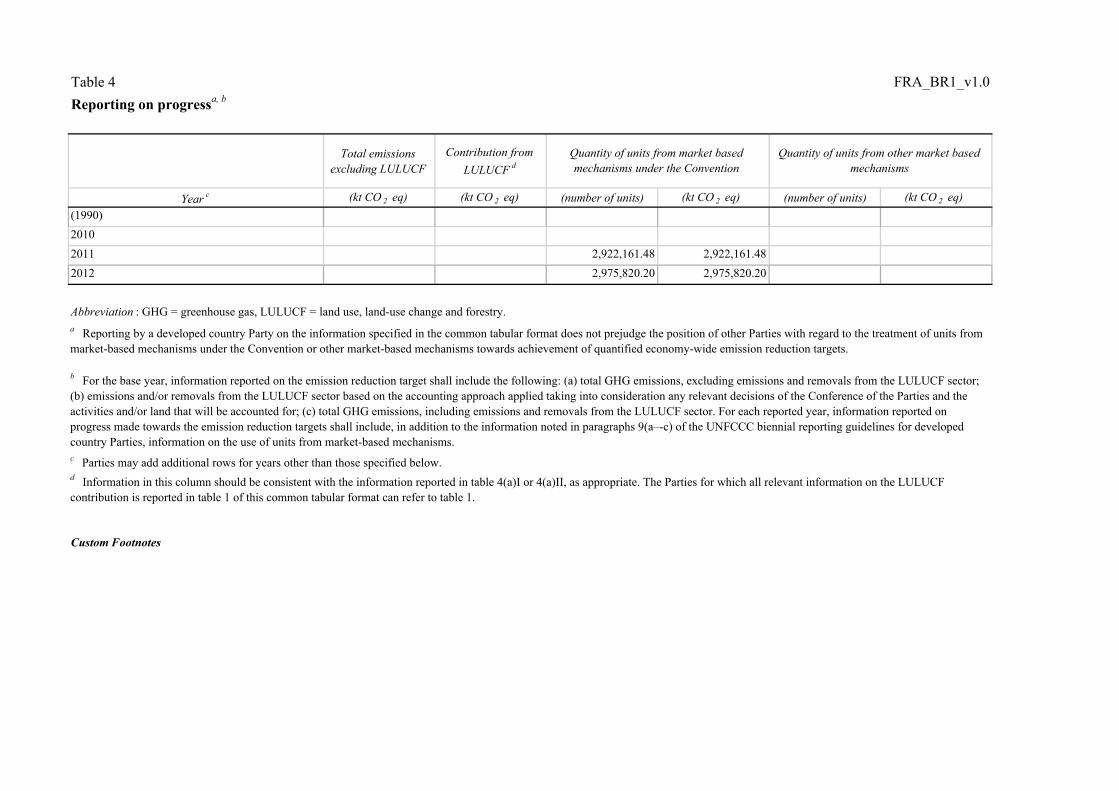
Table 4 FRA_BR1_v1.0Reporting on progressa, b
Total emissions excluding LULUCF
Contribution from LULUCF d
Year c (kt CO 2 eq) (kt CO 2 eq) (number of units) (kt CO 2 eq) (number of units) (kt CO 2 eq) (1990)20102011 2,922,161.48 2,922,161.482012 2,975,820.20 2,975,820.20
Abbreviation : GHG = greenhouse gas, LULUCF = land use, land-use change and forestry.
Custom Footnotes
d Information in this column should be consistent with the information reported in table 4(a)I or 4(a)II, as appropriate. The Parties for which all relevant information on the LULUCF contribution is reported in table 1 of this common tabular format can refer to table 1.
Quantity of units from other market based mechanisms
Quantity of units from market based mechanisms under the Convention
a Reporting by a developed country Party on the information specified in the common tabular format does not prejudge the position of other Parties with regard to the treatment of units from market-based mechanisms under the Convention or other market-based mechanisms towards achievement of quantified economy-wide emission reduction targets.
b For the base year, information reported on the emission reduction target shall include the following: (a) total GHG emissions, excluding emissions and removals from the LULUCF sector; (b) emissions and/or removals from the LULUCF sector based on the accounting approach applied taking into consideration any relevant decisions of the Conference of the Parties and the activities and/or land that will be accounted for; (c) total GHG emissions, including emissions and removals from the LULUCF sector. For each reported year, information reported on progress made towards the emission reduction targets shall include, in addition to the information noted in paragraphs 9(a�-c) of the UNFCCC biennial reporting guidelines for developed country Parties, information on the use of units from market-based mechanisms.c Parties may add additional rows for years other than those specified below.

Table 4(a)I FRA_BR1_v1.0
Net GHG emissions/removals from
LULUCF categories c
Base year/period or reference level value d
Contribution from LULUCF for reported year
Cumulative contribution from
LULUCF e
Total LULUCFA. Forest land
1. Forest land remaining forest land2. Land converted to forest land
3. Other g
B. Cropland1. Cropland remaining cropland2. Land converted to cropland
3. Other g
C. Grassland1. Grassland remaining grassland2. Land converted to grassland
3. Other g
D. Wetlands1. Wetland remaining wetland2. Land converted to wetland
3. Other g
E. Settlements1. Settlements remaining settlements2. Land converted to settlements
3. Other g
F. Other land1. Other land remaining other land2. Land converted to other land
3. Other g
Harvested wood products
Abbreviations : GHG = greenhouse gas, LULUCF = land use, land-use change and forestry.
Custom Footnotes
Progress in achieving the quantified economy-wide emission reduction targets � further information on mitigation actions relevant to the contribution of the land use, land-use change and forestry sector in 2011 a,b
Accounting approach f
(kt CO 2 eq)
f Label each accounting approach and indicate where additional information is provided within this biennial report explaining how it was implemented, including all relevant accounting parameters (i.e. natural disturbances, caps).g Specify what was used for the category �other�. Explain in this biennial report how each was defined and how it relates to the categories used for reporting under the Convention or its Kyoto Protocol.
a Reporting by a developed country Party on the information specified in the common tabular format does not prejudge the position of other Parties with regard to the treatment of units from market-based mechanisms under the Convention or other market-based mechanisms towards achievement of quantified economy-wide emission reduction targetsb Parties that use the LULUCF approach that is based on table 1 do not need to complete this table, but should indicate the approach in table 2. Parties should fill in a separate table for each year, namely 2011 and 2012, where 2014 is the reporting year. c For each category, enter the net emissions or removals reported in the most recent inventory submission for the corresponding inventory year. If a category differs from that used for the reporting under the Convention or its Kyoto Protocol, explain in the biennial report how the value was derivedd Enter one reference level or base year/period value for each category. Explain in the biennial report how these values have been calculated.e If applicable to the accounting approach chosen. Explain in this biennial report to which years or period the cumulative contribution refers to.
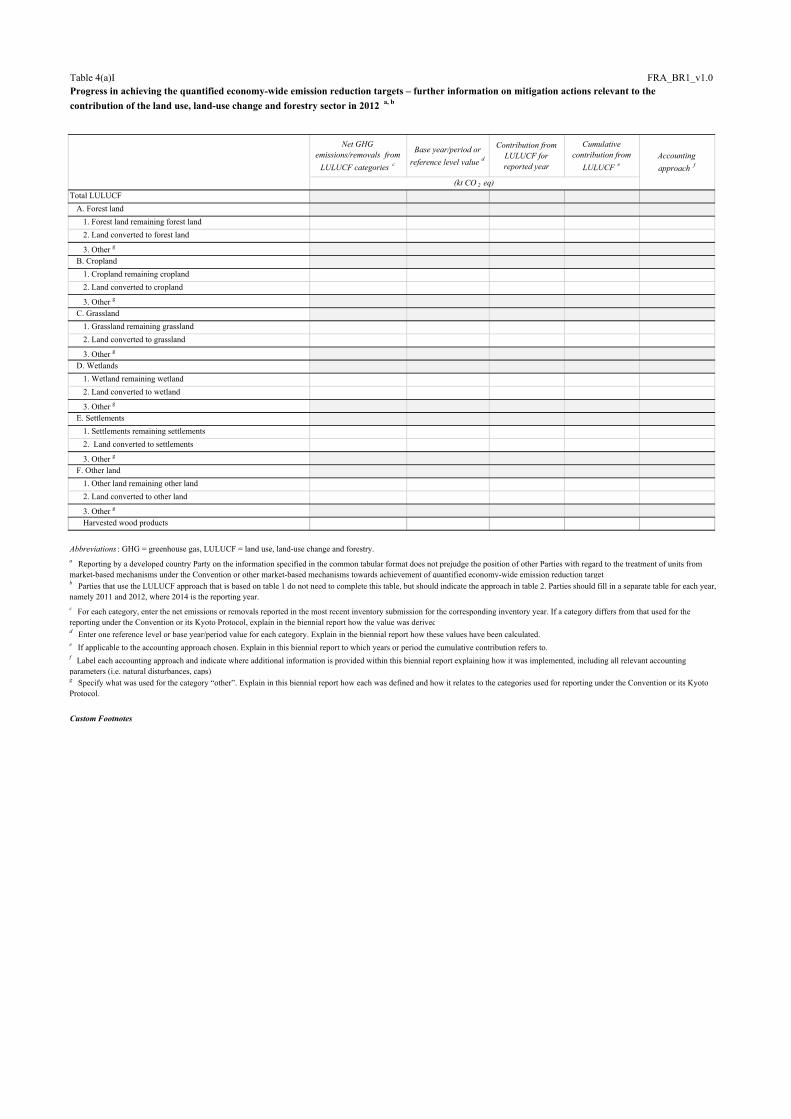
Table 4(a)I FRA_BR1_v1.0
Net GHG emissions/removals from
LULUCF categories c
Base year/period or reference level value d
Contribution from LULUCF for reported year
Cumulative contribution from
LULUCF e
Total LULUCFA. Forest land
1. Forest land remaining forest land2. Land converted to forest land
3. Other g
B. Cropland1. Cropland remaining cropland2. Land converted to cropland
3. Other g
C. Grassland1. Grassland remaining grassland2. Land converted to grassland
3. Other g
D. Wetlands1. Wetland remaining wetland2. Land converted to wetland
3. Other g
E. Settlements1. Settlements remaining settlements2. Land converted to settlements
3. Other g
F. Other land1. Other land remaining other land2. Land converted to other land
3. Other g
Harvested wood products
Abbreviations : GHG = greenhouse gas, LULUCF = land use, land-use change and forestry.
Custom Footnotes
Progress in achieving the quantified economy-wide emission reduction targets � further information on mitigation actions relevant to the contribution of the land use, land-use change and forestry sector in 2012 a, b
d Enter one reference level or base year/period value for each category. Explain in the biennial report how these values have been calculated.e If applicable to the accounting approach chosen. Explain in this biennial report to which years or period the cumulative contribution refers to.f Label each accounting approach and indicate where additional information is provided within this biennial report explaining how it was implemented, including all relevant accounting parameters (i.e. natural disturbances, caps).g Specify what was used for the category �other�. Explain in this biennial report how each was defined and how it relates to the categories used for reporting under the Convention or its Kyoto Protocol.
Accounting approach f
(kt CO 2 eq)
a Reporting by a developed country Party on the information specified in the common tabular format does not prejudge the position of other Parties with regard to the treatment of units from market-based mechanisms under the Convention or other market-based mechanisms towards achievement of quantified economy-wide emission reduction targetsb Parties that use the LULUCF approach that is based on table 1 do not need to complete this table, but should indicate the approach in table 2. Parties should fill in a separate table for each year, namely 2011 and 2012, where 2014 is the reporting year. c For each category, enter the net emissions or removals reported in the most recent inventory submission for the corresponding inventory year. If a category differs from that used for the reporting under the Convention or its Kyoto Protocol, explain in the biennial report how the value was derived
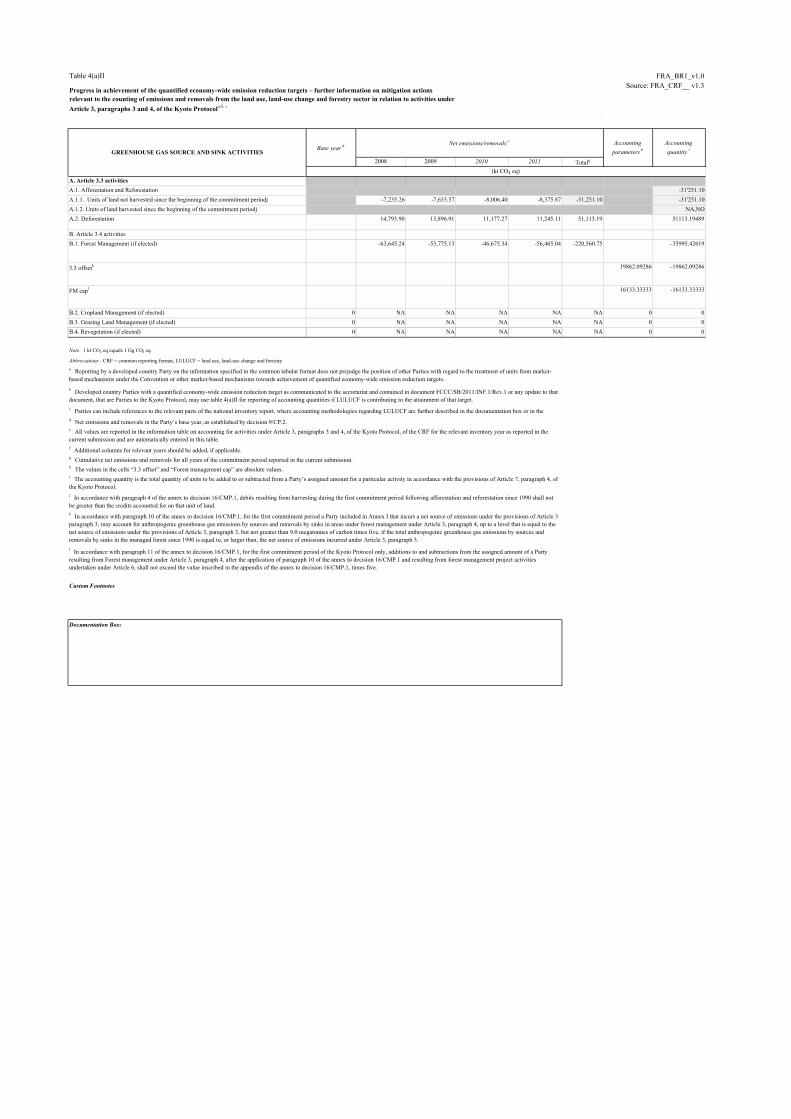
Table 4(a)II FRA_BR1_v1.0Source: FRA_CRF__ v1.3
2008 2009 2010 2011 Totalg
A. Article 3.3 activities A.1. Afforestation and Reforestation -31'251.10A.1.1. Units of land not harvested since the beginning of the commitment periodj -7,235.26 -7,633.57 -8,006.40 -8,375.87 -31,251.10 -31'251.10A.1.2. Units of land harvested since the beginning of the commitment periodj NA,NOA.2. Deforestation 14,793.90 13,896.91 11,177.27 11,245.11 51,113.19 51113.19489
B. Article 3.4 activitiesB.1. Forest Management (if elected) -63,645.24 -53,775.13 -46,675.34 -56,465.04 -220,560.75 -35995.42619
3.3 offsetk 19862.09286 -19862.09286
FM capl 16133.33333 -16133.33333
B.2. Cropland Management (if elected) 0 NA NA NA NA NA 0 0B.3. Grazing Land Management (if elected) 0 NA NA NA NA NA 0 0B.4. Revegetation (if elected) 0 NA NA NA NA NA 0 0
Note: 1 kt CO2 eq equals 1 Gg CO2 eq.
Abbreviations : CRF = common reporting format, LULUCF = land use, land-use change and forestry.
Custom Footnotes
Accounting parameters h
Accounting quantity i
(kt CO2 eq)
Documentation Box:
l In accordance with paragraph 11 of the annex to decision 16/CMP.1, for the first commitment period of the Kyoto Protocol only, additions to and subtractions from the assigned amount of a Party resulting from Forest management under Article 3, paragraph 4, after the application of paragraph 10 of the annex to decision 16/CMP.1 and resulting from forest management project activities undertaken under Article 6, shall not exceed the value inscribed in the appendix of the annex to decision 16/CMP.1, times five.
f Additional columns for relevant years should be added, if applicable.g Cumulative net emissions and removals for all years of the commitment period reported in the current submission.h The values in the cells �3.3 offset� and �Forest management cap� are absolute values. i The accounting quantity is the total quantity of units to be added to or subtracted from a Party�s assigned amount for a particular activity in accordance with the provisions of Article 7, paragraph 4, of the Kyoto Protocol.j In accordance with paragraph 4 of the annex to decision 16/CMP.1, debits resulting from harvesting during the first commitment period following afforestation and reforestation since 1990 shall not be greater than the credits accounted for on that unit of land.k In accordance with paragraph 10 of the annex to decision 16/CMP.1, for the first commitment period a Party included in Annex I that incurs a net source of emissions under the provisions of Article 3 paragraph 3, may account for anthropogenic greenhouse gas emissions by sources and removals by sinks in areas under forest management under Article 3, paragraph 4, up to a level that is equal to the net source of emissions under the provisions of Article 3, paragraph 3, but not greater than 9.0 megatonnes of carbon times five, if the total anthropogenic greenhouse gas emissions by sources and removals by sinks in the managed forest since 1990 is equal to, or larger than, the net source of emissions incurred under Article 3, paragraph 3.
Progress in achievement of the quantified economy-wide emission reduction targets � further information on mitigation actions relevant to the counting of emissions and removals from the land use, land-use change and forestry sector in relation to activities under Article 3, paragraphs 3 and 4, of the Kyoto Protocola,b, c
GREENHOUSE GAS SOURCE AND SINK ACTIVITIESBase year d
d Net emissions and removals in the Party�s base year, as established by decision 9/CP.2.e All values are reported in the information table on accounting for activities under Article 3, paragraphs 3 and 4, of the Kyoto Protocol, of the CRF for the relevant inventory year as reported in the current submission and are automatically entered in this table.
a Reporting by a developed country Party on the information specified in the common tabular format does not prejudge the position of other Parties with regard to the treatment of units from market-based mechanisms under the Convention or other market-based mechanisms towards achievement of quantified economy-wide emission reduction targets.b Developed country Parties with a quantified economy-wide emission reduction target as communicated to the secretariat and contained in document FCCC/SB/2011/INF.1/Rev.1 or any update to that document, that are Parties to the Kyoto Protocol, may use table 4(a)II for reporting of accounting quantities if LULUCF is contributing to the attainment of that target. c Parties can include references to the relevant parts of the national inventory report, where accounting methodologies regarding LULUCF are further described in the documentation box or in the bi i l
Net emissions/removals e

Table 4(b) FRA_BR1_v1.0Reporting on progressa, b, c
2011 2012(number of units) 2,922,161.48 2,975,820.20
(kt CO 2 eq) 2,922,161.48 2,975,820.20(number of units) 2,849,444.11 2,899,359.25(kt CO2 eq) 2,849,444.11 2,899,359.25(number of units) 8,597.11 22,682.87(kt CO2 eq) 8,597.11 22,682.87(number of units) 64,120.26 53,778.08(kt CO2 eq) 64,120.26 53,778.08(number of units) 0.00 0.00(kt CO2 eq) 0.00(number of units) 0.00 0.00(kt CO2 eq) 0.00
(number of units)(kt CO 2 eq)
(number of units)(kt CO 2 eq)
(number of units) 2,922,161.48 2,975,820.20
(kt CO 2 eq) 2,922,161.48 2,975,820.20
c Parties may include this information, as appropriate and if relevant to their target.d Units surrendered by that Party for that year that have not been previously surrendered by that or any other Party.e Additional rows for each market-based mechanism should be added, if applicable.
Custom Footnotes
b For each reported year, information reported on progress made towards the emission reduction target shall include, in addition to the information noted in paragraphs 9(a-c) of the reporting guidelines, on the use of units from market-based mechanisms.
Abbreviations : AAUs = assigned amount units, CERs = certified emission reductions, ERUs = emission reduction units, lCERs = long-term certified emission reductions, tCERs = temporary certified emission reductions.
a Reporting by a developed country Party on the information specified in the common tabular format does not prejudge the position of other Parties with regard to the treatment of units from market-based mechanisms under the Convention or other market-based mechanisms towards achievement of quantified economy-wide emission reduction targets
Total
Note: 2011 is the latest reporting year.
Other units d,e
Units of market based mechanismsYear
Units from market-based mechanisms under the Convention
Units from other market-based mechanisms
Kyoto Protocol units d
Kyoto Protocol units
AAUs
ERUs
CERs
tCERs
lCERs
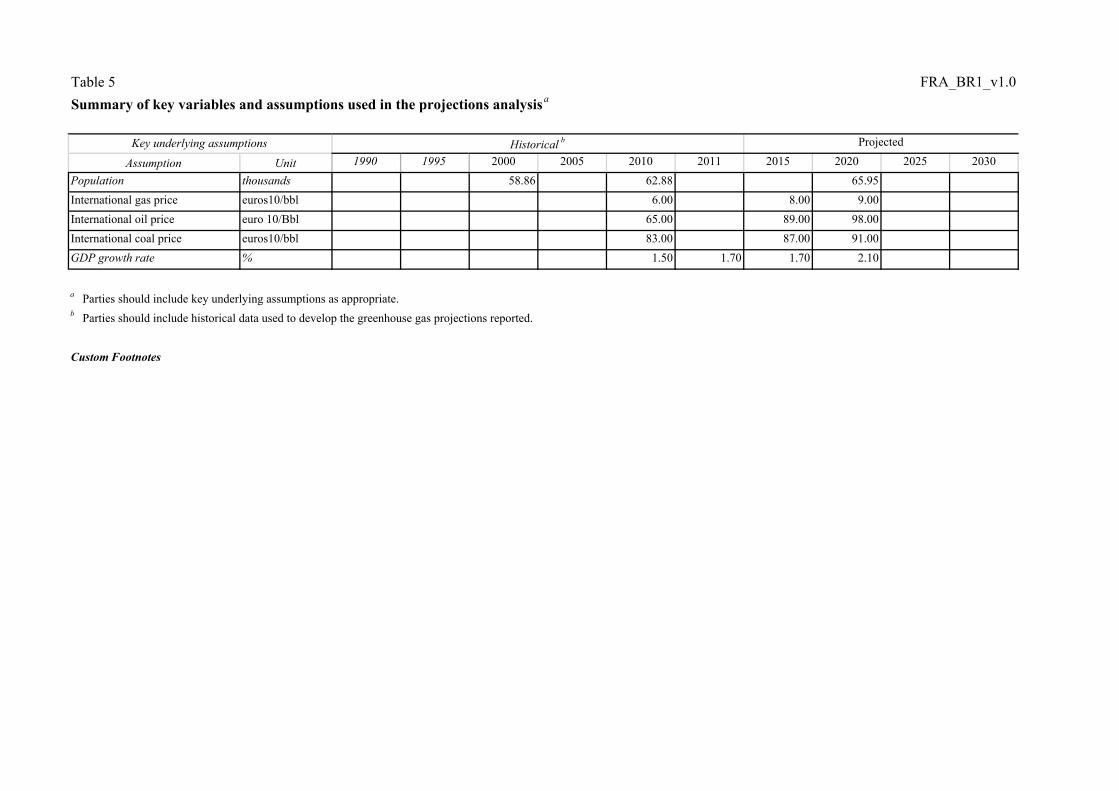
Table 5 FRA_BR1_v1.0Summary of key variables and assumptions used in the projections analysisa
Assumption Unit 1990 1995 2000 2005 2010 2011 2015 2020 2025 2030Population thousands 58.86 62.88 65.95International gas price euros10/bbl 6.00 8.00 9.00International oil price euro 10/Bbl 65.00 89.00 98.00International coal price euros10/bbl 83.00 87.00 91.00GDP growth rate % 1.50 1.70 1.70 2.10
b Parties should include historical data used to develop the greenhouse gas projections reported.
Custom Footnotes
Key underlying assumptions
a Parties should include key underlying assumptions as appropriate.
Historical b Projected
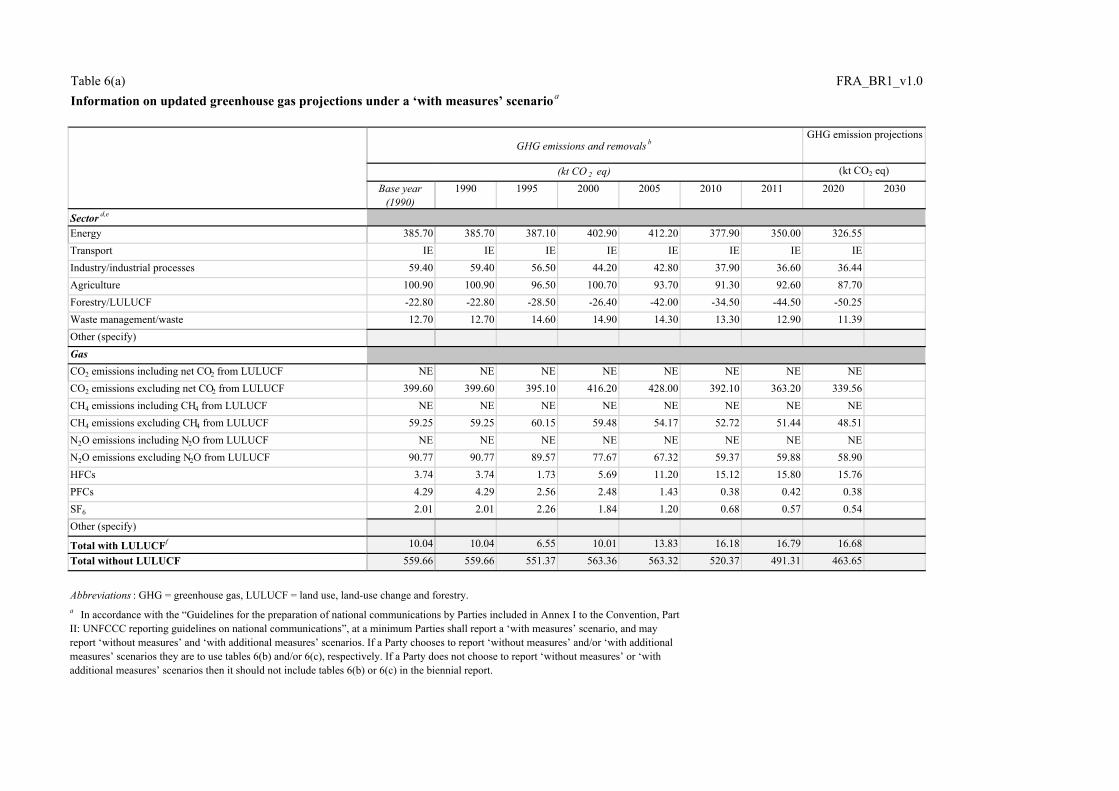
Table 6(a) FRA_BR1_v1.0Information on updated greenhouse gas projections under a �with measures� scenarioa
Base year (1990)
1990 1995 2000 2005 2010 2011 2020 2030
Sector d,e
Energy 385.70 385.70 387.10 402.90 412.20 377.90 350.00 326.55Transport IE IE IE IE IE IE IE IEIndustry/industrial processes 59.40 59.40 56.50 44.20 42.80 37.90 36.60 36.44Agriculture 100.90 100.90 96.50 100.70 93.70 91.30 92.60 87.70Forestry/LULUCF -22.80 -22.80 -28.50 -26.40 -42.00 -34.50 -44.50 -50.25Waste management/waste 12.70 12.70 14.60 14.90 14.30 13.30 12.90 11.39Other (specify)Gas CO2 emissions including net CO2 from LULUCF NE NE NE NE NE NE NE NECO2 emissions excluding net CO2 from LULUCF 399.60 399.60 395.10 416.20 428.00 392.10 363.20 339.56CH4 emissions including CH4 from LULUCF NE NE NE NE NE NE NE NECH4 emissions excluding CH4 from LULUCF 59.25 59.25 60.15 59.48 54.17 52.72 51.44 48.51N2O emissions including N2O from LULUCF NE NE NE NE NE NE NE NEN2O emissions excluding N2O from LULUCF 90.77 90.77 89.57 77.67 67.32 59.37 59.88 58.90HFCs 3.74 3.74 1.73 5.69 11.20 15.12 15.80 15.76PFCs 4.29 4.29 2.56 2.48 1.43 0.38 0.42 0.38SF6 2.01 2.01 2.26 1.84 1.20 0.68 0.57 0.54Other (specify)
Total with LULUCFf 10.04 10.04 6.55 10.01 13.83 16.18 16.79 16.68Total without LULUCF 559.66 559.66 551.37 563.36 563.32 520.37 491.31 463.65
Abbreviations : GHG = greenhouse gas, LULUCF = land use, land-use change and forestry.
(kt CO2 eq)
GHG emission projections
a In accordance with the �Guidelines for the preparation of national communications by Parties included in Annex I to the Convention, Part II: UNFCCC reporting guidelines on national communications�, at a minimum Parties shall report a �with measures� scenario, and may report �without measures� and �with additional measures� scenarios. If a Party chooses to report �without measures� and/or �with additional measures� scenarios they are to use tables 6(b) and/or 6(c), respectively. If a Party does not choose to report �without measures� or �with additional measures� scenarios then it should not include tables 6(b) or 6(c) in the biennial report.
(kt CO 2 eq)
GHG emissions and removals b
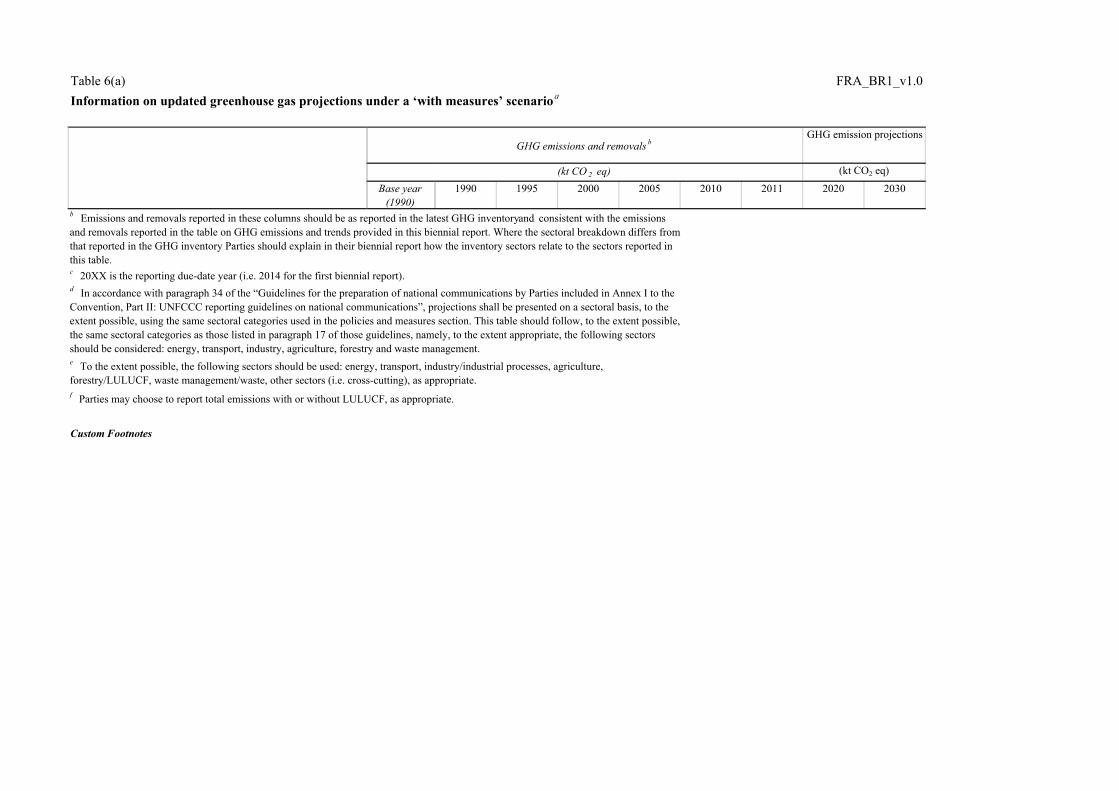
Table 6(a) FRA_BR1_v1.0Information on updated greenhouse gas projections under a �with measures� scenarioa
Base year (1990)
1990 1995 2000 2005 2010 2011 2020 2030
(kt CO2 eq)
GHG emission projections
(kt CO 2 eq)
GHG emissions and removals b
Custom Footnotes
d In accordance with paragraph 34 of the �Guidelines for the preparation of national communications by Parties included in Annex I to the Convention, Part II: UNFCCC reporting guidelines on national communications�, projections shall be presented on a sectoral basis, to the extent possible, using the same sectoral categories used in the policies and measures section. This table should follow, to the extent possible, the same sectoral categories as those listed in paragraph 17 of those guidelines, namely, to the extent appropriate, the following sectors should be considered: energy, transport, industry, agriculture, forestry and waste management. e To the extent possible, the following sectors should be used: energy, transport, industry/industrial processes, agriculture, forestry/LULUCF, waste management/waste, other sectors (i.e. cross-cutting), as appropriate. f Parties may choose to report total emissions with or without LULUCF, as appropriate.
c 20XX is the reporting due-date year (i.e. 2014 for the first biennial report).
b Emissions and removals reported in these columns should be as reported in the latest GHG inventory and consistent with the emissions and removals reported in the table on GHG emissions and trends provided in this biennial report. Where the sectoral breakdown differs from that reported in the GHG inventory Parties should explain in their biennial report how the inventory sectors relate to the sectors reported in this table.
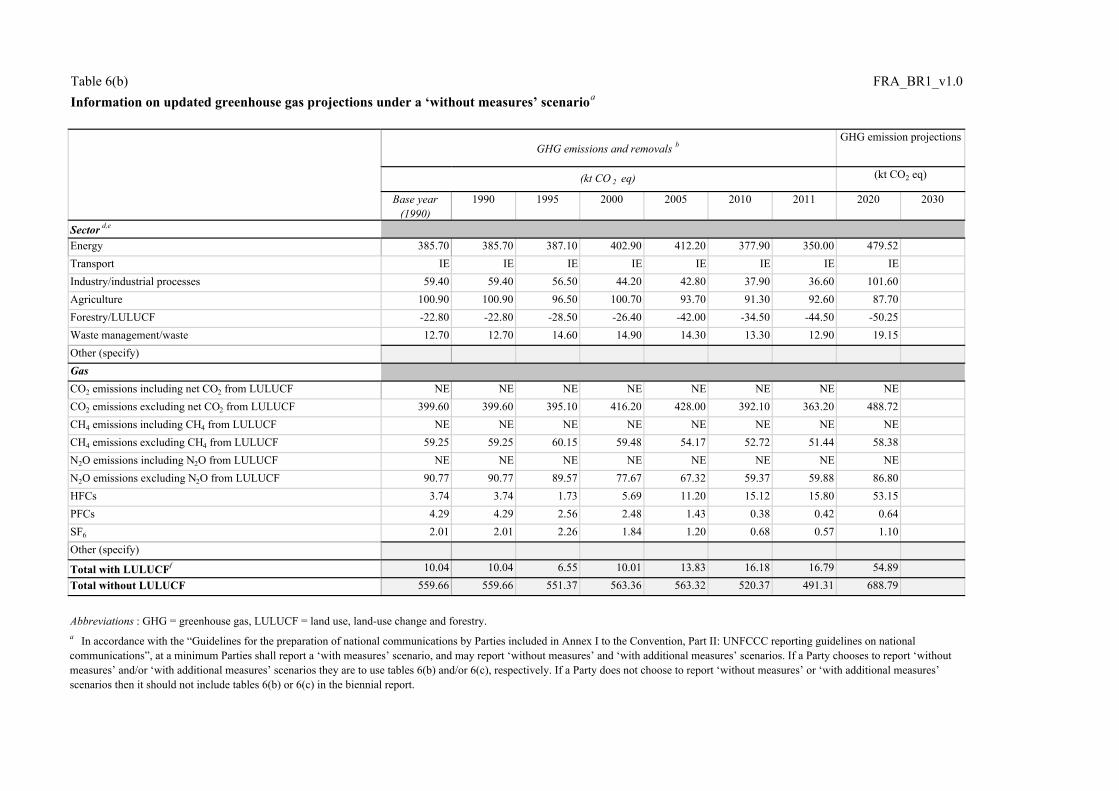
Table 6(b) FRA_BR1_v1.0Information on updated greenhouse gas projections under a �without measures� scenarioa
Base year (1990)
1990 1995 2000 2005 2010 2011 2020 2030
Sector d,e
Energy 385.70 385.70 387.10 402.90 412.20 377.90 350.00 479.52Transport IE IE IE IE IE IE IE IEIndustry/industrial processes 59.40 59.40 56.50 44.20 42.80 37.90 36.60 101.60Agriculture 100.90 100.90 96.50 100.70 93.70 91.30 92.60 87.70Forestry/LULUCF -22.80 -22.80 -28.50 -26.40 -42.00 -34.50 -44.50 -50.25Waste management/waste 12.70 12.70 14.60 14.90 14.30 13.30 12.90 19.15Other (specify)Gas CO2 emissions including net CO2 from LULUCF NE NE NE NE NE NE NE NECO2 emissions excluding net CO2 from LULUCF 399.60 399.60 395.10 416.20 428.00 392.10 363.20 488.72CH4 emissions including CH4 from LULUCF NE NE NE NE NE NE NE NECH4 emissions excluding CH4 from LULUCF 59.25 59.25 60.15 59.48 54.17 52.72 51.44 58.38N2O emissions including N2O from LULUCF NE NE NE NE NE NE NE NEN2O emissions excluding N2O from LULUCF 90.77 90.77 89.57 77.67 67.32 59.37 59.88 86.80HFCs 3.74 3.74 1.73 5.69 11.20 15.12 15.80 53.15PFCs 4.29 4.29 2.56 2.48 1.43 0.38 0.42 0.64SF6 2.01 2.01 2.26 1.84 1.20 0.68 0.57 1.10Other (specify)
Total with LULUCFf 10.04 10.04 6.55 10.01 13.83 16.18 16.79 54.89Total without LULUCF 559.66 559.66 551.37 563.36 563.32 520.37 491.31 688.79
Abbreviations : GHG = greenhouse gas, LULUCF = land use, land-use change and forestry.a In accordance with the �Guidelines for the preparation of national communications by Parties included in Annex I to the Convention, Part II: UNFCCC reporting guidelines on national communications�, at a minimum Parties shall report a �with measures� scenario, and may report �without measures� and �with additional measures� scenarios. If a Party chooses to report �without measures� and/or �with additional measures� scenarios they are to use tables 6(b) and/or 6(c), respectively. If a Party does not choose to report �without measures� or �with additional measures� scenarios then it should not include tables 6(b) or 6(c) in the biennial report.
(kt CO 2 eq)
GHG emissions and removals b
(kt CO2 eq)
GHG emission projections

Table 6(b) FRA_BR1_v1.0Information on updated greenhouse gas projections under a �without measures� scenarioa
Base year (1990)
1990 1995 2000 2005 2010 2011 2020 2030
(kt CO 2 eq)
GHG emissions and removals b
(kt CO2 eq)
GHG emission projections
b Emissions and removals reported in these columns should be as reported in the latest GHG inventory and consistent with the emissions and removals reported in the table on GHG emissions and trends provided in this biennial report. Where the sectoral breakdown differs from that reported in the GHG inventory Parties should explain in their biennial report how the inventory sectors relate to the sectors reported in this table.
c 20XX is the reporting due-date year (i.e. 2014 for the first biennial report).d In accordance with paragraph 34 of the �Guidelines for the preparation of national communications by Parties included in Annex I to the Convention, Part II: UNFCCC reporting guidelines on national communications�, projections shall be presented on a sectoral basis, to the extent possible, using the same sectoral categories used in the policies and measures section. This table should follow, to the extent possible, the same sectoral categories as those listed in paragraph 17 of those guidelines, namely, to the extent appropriate, the following sectors should be considered: energy, transport, industry, agriculture, forestry and waste management.
e To the extent possible, the following sectors should be used: energy, transport, industry/industrial processes, agriculture, forestry/LULUCF, waste management/waste, other sectors (i.e. cross-cutting), as appropriate. f Parties may choose to report total emissions with or without LULUCF, as appropriate.

Table 6(c) FRA_BR1_v1.0Information on updated greenhouse gas projections under a �with additional measures� scenario a
Base year (1990)
1990 1995 2000 2005 2010 2011 2020 2030
Sector d,e
Energy 385.70 385.70 387.10 402.90 412.20 377.90 350.00 288.87Transport IE IE IE IE IE IE IE IEIndustry/industrial processes 59.40 59.40 56.50 44.20 42.80 37.90 36.60 37.46Agriculture 100.90 100.90 96.50 100.70 93.70 91.30 92.60 87.01Forestry/LULUCF -22.80 -22.80 -28.50 -26.40 -42.00 -34.50 -44.50 -50.25Waste management/waste 12.70 12.70 14.60 14.90 14.30 13.30 12.90 11.39Other (specify)Gas CO2 emissions including net CO2 from LULUCF NE NE NE NE NE NE NE NECO2 emissions excluding net CO2 from LULUCF 399.60 399.60 395.10 416.20 428.00 392.10 363.20 303.29CH4 emissions including CH4 from LULUCF NE NE NE NE NE NE NE NECH4 emissions excluding CH4 from LULUCF 59.25 59.25 60.15 59.48 54.17 52.72 51.44 47.88N2O emissions including N2O from LULUCF NE NE NE NE NE NE NE NEN2O emissions excluding N2O from LULUCF 90.77 90.77 89.57 77.67 67.32 59.37 59.88 58.90HFCs 3.74 3.74 1.73 5.69 11.20 15.12 15.80 15.74PFCs 4.29 4.29 2.56 2.48 1.43 0.38 0.42 0.38SF6 2.01 2.01 2.26 1.84 1.20 0.68 0.57 0.54Other (specify)
Total with LULUCFf 10.04 10.04 6.55 10.01 13.83 16.18 16.79 16.66Total without LULUCF 559.66 559.66 551.37 563.36 563.32 520.37 491.31 426.73
Abbreviations : GHG = greenhouse gas, LULUCF = land use, land-use change and forestry.a In accordance with the �Guidelines for the preparation of national communications by Parties included in Annex I to the Convention, Part II: UNFCCC reporting guidelines on national communications�, at a minimum Parties shall report a �with measures� scenario, and may report �without measures� and �with additional measures� scenarios. If a Party chooses to report �without measures� and/or �with additional measures� scenarios they are to use tables 6(b) and/or 6(c), respectively. If a Party does not choose to report �without measures� or �with additional measures� scenarios then it should not include tables 6(b) or 6(c) in the biennial report.
(kt CO 2 eq)
GHG emissions and removals b
(kt CO2 eq)
GHG emission projections

Table 6(c) FRA_BR1_v1.0Information on updated greenhouse gas projections under a �with additional measures� scenario a
Base year (1990)
1990 1995 2000 2005 2010 2011 2020 2030(kt CO 2 eq)
GHG emissions and removals b
(kt CO2 eq)
GHG emission projections
f Parties may choose to report total emissions with or without LULUCF, as appropriate.
b Emissions and removals reported in these columns should be as reported in the latest GHG inventory and consistent with the emissions and removals reported in the table on GHG emissions and trends provided in this biennial report. Where the sectoral breakdown differs from that reported in the GHG inventory Parties should explain in their biennial report how the inventory sectors relate to the sectors reported in this table.
c 20XX is the reporting due-date year (i.e. 2014 for the first biennial report).d In accordance with paragraph 34 of the �Guidelines for the preparation of national communications by Parties included in Annex I to the Convention, Part II: UNFCCC reporting guidelines on national communications�, projections shall be presented on a sectoral basis, to the extent possible, using the same sectoral categories used in the policies and measures section. This table should follow, to the extent possible, the same sectoral categories as those listed in paragraph 17 of those guidelines, namely, to the extent appropriate, the following sectors should be considered: energy, transport, industry, agriculture, forestry and waste management.
e To the extent possible, the following sectors should be used: energy, transport, industry/industrial processes, agriculture, forestry/LULUCF, waste management/waste, other sectors (i.e. cross-cutting), as appropriate.
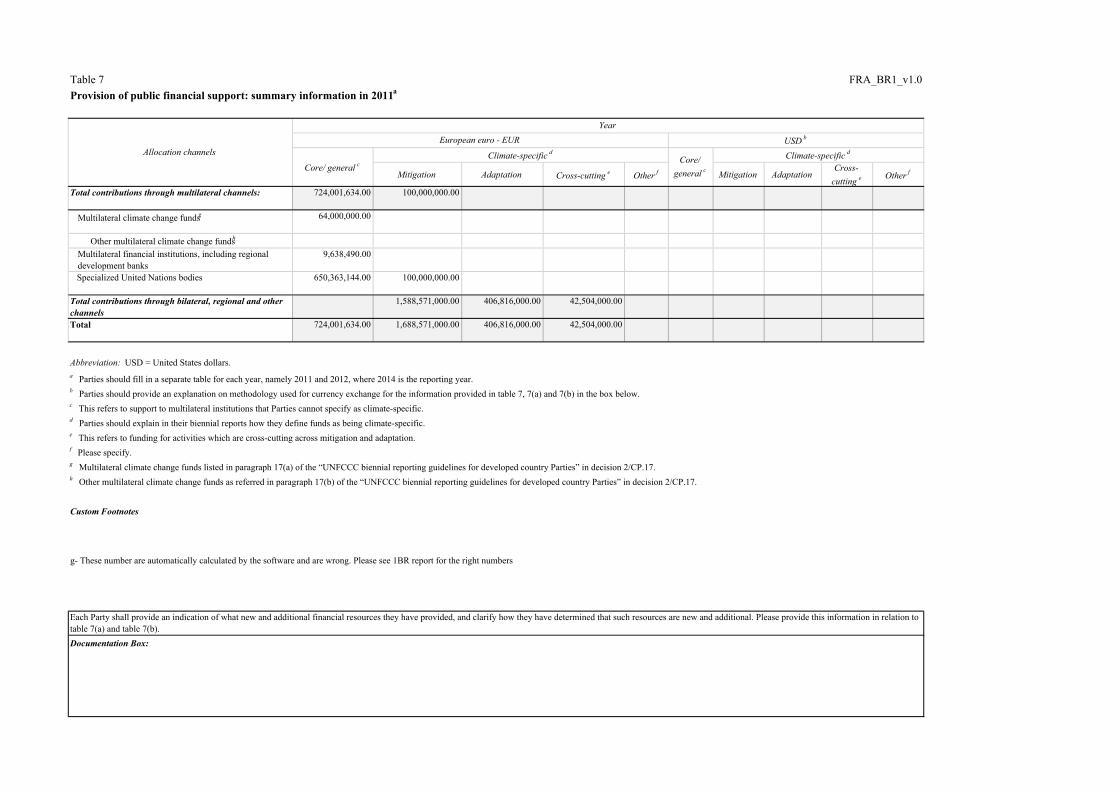
Table 7 FRA_BR1_v1.0Provision of public financial support: summary information in 2011a
Mitigation Adaptation Cross-cutting e Other f Mitigation AdaptationCross-
cutting e Other f
Total contributions through multilateral channels: 724,001,634.00 100,000,000.00
Multilateral climate change fundsg 64,000,000.00
Other multilateral climate change fundsh
Multilateral financial institutions, including regional development banks
9,638,490.00
Specialized United Nations bodies 650,363,144.00 100,000,000.00
Total contributions through bilateral, regional and other channels
1,588,571,000.00 406,816,000.00 42,504,000.00
Total 724,001,634.00 1,688,571,000.00 406,816,000.00 42,504,000.00
Abbreviation: USD = United States dollars.a Parties should fill in a separate table for each year, namely 2011 and 2012, where 2014 is the reporting year. b Parties should provide an explanation on methodology used for currency exchange for the information provided in table 7, 7(a) and 7(b) in the box below.c This refers to support to multilateral institutions that Parties cannot specify as climate-specific.d Parties should explain in their biennial reports how they define funds as being climate-specific.e This refers to funding for activities which are cross-cutting across mitigation and adaptation.f Please specify.g Multilateral climate change funds listed in paragraph 17(a) of the �UNFCCC biennial reporting guidelines for developed country Parties� in decision 2/CP.17.h Other multilateral climate change funds as referred in paragraph 17(b) of the �UNFCCC biennial reporting guidelines for developed country Parties� in decision 2/CP.17.
Custom Footnotes
Documentation Box:
Each Party shall provide an indication of what new and additional financial resources they have provided, and clarify how they have determined that such resources are new and additional. Please provide this information in relation to table 7(a) and table 7(b).
European euro - EUR
Climate-specific d
USD b
Allocation channels
Year
Climate-specific d
Core/ general c Core/ general c
g- These number are automatically calculated by the software and are wrong. Please see 1BR report for the right numbers
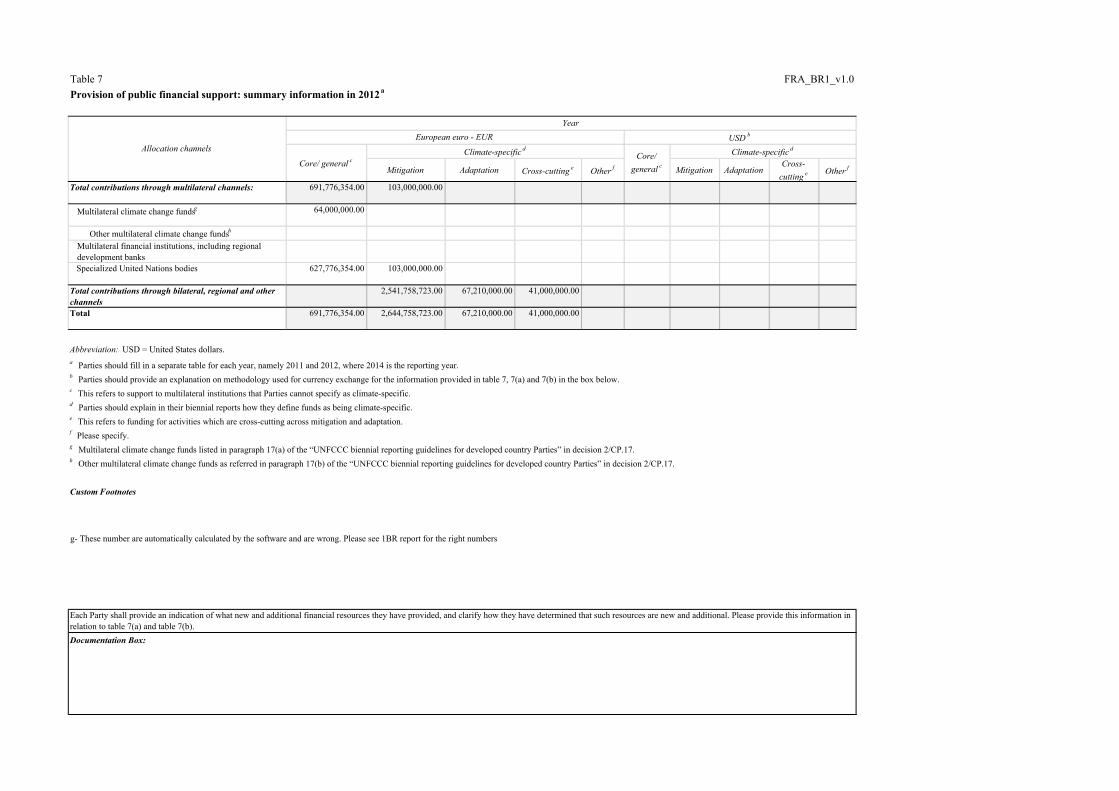
Table 7 FRA_BR1_v1.0Provision of public financial support: summary information in 2012a
Mitigation Adaptation Cross-cutting e Other f Mitigation AdaptationCross-
cutting e Other f
Total contributions through multilateral channels: 691,776,354.00 103,000,000.00
Multilateral climate change fundsg 64,000,000.00
Other multilateral climate change fundsh
Multilateral financial institutions, including regional development banks
Specialized United Nations bodies 627,776,354.00 103,000,000.00
Total contributions through bilateral, regional and other channels
2,541,758,723.00 67,210,000.00 41,000,000.00
Total 691,776,354.00 2,644,758,723.00 67,210,000.00 41,000,000.00
Abbreviation: USD = United States dollars.a Parties should fill in a separate table for each year, namely 2011 and 2012, where 2014 is the reporting year. b Parties should provide an explanation on methodology used for currency exchange for the information provided in table 7, 7(a) and 7(b) in the box below.c This refers to support to multilateral institutions that Parties cannot specify as climate-specific.d Parties should explain in their biennial reports how they define funds as being climate-specific.e This refers to funding for activities which are cross-cutting across mitigation and adaptation.f Please specify.g Multilateral climate change funds listed in paragraph 17(a) of the �UNFCCC biennial reporting guidelines for developed country Parties� in decision 2/CP.17.h Other multilateral climate change funds as referred in paragraph 17(b) of the �UNFCCC biennial reporting guidelines for developed country Parties� in decision 2/CP.17.
Custom Footnotes
Documentation Box:
Each Party shall provide an indication of what new and additional financial resources they have provided, and clarify how they have determined that such resources are new and additional. Please provide this information in relation to table 7(a) and table 7(b).
YearEuropean euro - EUR USD b
Core/ general cClimate-specific d
Core/ general c
Climate-specific dAllocation channels
g- These number are automatically calculated by the software and are wrong. Please see 1BR report for the right numbers

Table 7(a) FRA_BR1_v1.0Provision of public financial support: contribution through multilateral channels in 2011a
European euro - EUR
USD European euro - EUR
USD
Total contributions through multilateral channels 724,001,634.00 100,000,000.00
Multilateral climate change funds g 64,000,000.001. Global Environment Facility 64,000,000.00 Provided ODA Grant Cross-cutting Cross-cutting2. Least Developed Countries Fund3. Special Climate Change Fund4. Adaptation Fund5. Green Climate Fund6. UNFCCC Trust Fund for Supplementary Activities7. Other multilateral climate change funds
Multilateral financial institutions, including regional development banks 9,638,490.001. World Bank 6,638,490.00 Provided ODA Grant Cross-cutting Cross-cutting2. International Finance Corporation3. African Development Bank Provided ODA Grant Cross-cutting4. Asian Development Bank Provided ODA Grant Cross-cutting5. European Bank for Reconstruction and Development 3,000,000.00 Provided ODA Grant Other () Other (NA)6. Inter-American Development Bank Provided ODA Equity Cross-cutting Cross-cutting7. Other
Specialized United Nations bodies 650,363,144.00 100,000,000.001. United Nations Development Programme2. United Nations Environment Programme 650,363,144.00 100,000,000.00African development bank and capital increase 14,240,296.00 Provided ODA Equity Cross-cutting Cross-cuttingAsian development bank capital increase 11,513,000.00 Provided ODA Equity Cross-cutting Cross-cuttingFund for special operations (LADB) 1,725,100.00 Provided ODA Grant Cross-cutting Cross-cuttingMultilateral Investment Fund (laDB 1,740,000.00 Provided ODA Grant Cross-cutting Cross-cuttingInternational Fund for agricultural development (IFAD) 11,700,000.00 Provided ODA Grant Cross-cutting AgricultureInter-American development bank capital increase 4,724,000.00 Provided ODA Equity Cross-cutting Cross-cuttingCTF 100,000,000.00 Provided ODA Concessional Loan Mitigation EnergyAfrican development fund 133,333,333.00 Provided ODA Grant Cross-cutting Cross-cuttingAsian Development fund 24,321,500.00 Provided ODA Grant Cross-cutting Cross-cuttingIDA 423,599,011.00 Provided ODA Grant Cross-cutting Cross-cuttingIBRD capital increase 23,466,904.00 Provided ODA Equity Cross-cutting Cross-cutting3. Other
Custom Footnotes
h -Attention, dans les tableaux 7a, la non maniabilité du logiciel n�a pas permis de classer correctement les fonds ajoutés par la France. Ainsi, tous les fonds de la catégorie « United Nations environnement programme» doivent être comptabilisés et classés dans la partie « Multilateral financial institutions , including regional development banks » sauf le fonds CTF qui doit être comptabilisé et classé dans la partie « Multilateral climate change funds ».
Donor funding Core/general d
c Parties may select several applicable sectors. Parties may report sectoral distribution, as applicable, under �Other�.
Total amount
Climate-specific eStatus b Funding source f Financial
instrument f Type of support f, g Sector c
Abbreviations: ODA = official development assistance, OOF = other official flows.a Parties should fill in a separate table for each year, namely 2011 and 2012, where 2014 is the reporting year. b Parties should explain, in their biennial reports, the methodologies used to specify the funds as provided, committed and/or pledged. Parties will provide the information for as many status categories as appropriate in the following order of priority: provided, committed, pledged.
f Please specify.g Cross-cutting type of support refers to funding for activities which are cross-cutting across mitigation and adaptation.
d This refers to support to multilateral institutions that Parties cannot specify as climate-specific.e Parties should explain in their biennial reports how they define funds as being climate-specific.

Table 7(a) FRA_BR1_v1.0Provision of public financial support: contribution through multilateral channels in 2012a
European euro - EUR USD
European euro - EUR USD
Total contributions through multilateral channels 691,776,354.00 103,000,000.00
Multilateral climate change funds g 64,000,000.001. Global Environment Facility 64,000,000.00 Provided ODA Grant Cross-cutting Cross-cutting2. Least Developed Countries Fund3. Special Climate Change Fund4. Adaptation Fund5. Green Climate Fund6. UNFCCC Trust Fund for Supplementary Activities7. Other multilateral climate change funds
Multilateral financial institutions, including regional development banks1. World Bank2. International Finance Corporation3. African Development Bank4. Asian Development Bank5. European Bank for Reconstruction and Development6. Inter-American Development Bank7. Other
Specialized United Nations bodies 627,776,354.00 103,000,000.001. United Nations Development Programme2. United Nations Environment Programme 627,776,354.00 103,000,000.00CTF 103,000,000.00 Provided ODA Concessional Loan Mitigation EnergyIDA 400,000,000.00 Provided ODA Grant Cross-cutting Cross-cuttingIBDR capital increase 24,106,425.00 Provided ODA Equity Cross-cutting Cross-cuttingAfrican development fund 133,333,333.00 Provided ODA Grant Cross-cutting Cross-cuttingAfrican Development bank capital increase 14,240,296.00 Provided ODA Equity Cross-cutting Cross-cuttingAsian development fund 24,284,900.00 Provided ODA Grant Cross-cutting Cross-cuttingAsian development bank capital increase 11,929,000.00 Provided ODA Equity Cross-cutting Cross-cuttingMultilateral Investment Fund (la DB) 1,735,000.00 Provided ODA Grant Cross-cutting Cross-cuttingFund for special operation (laDB) 1,723,400.00 Provided ODA Grant Cross-cutting Cross-cuttingInter-American development Bank capital increase 4,724,000.00 Provided ODA Equity Cross-cutting Cross-cuttingIFAD 11,700,000.00 Provided ODA Grant Cross-cutting Agriculture3. Other
Custom Footnotes
h -Attention, dans les tableaux 7a, la non maniabilité du logiciel n�a pas permis de classer correctement les fonds ajoutés par la France. Ainsi, tous les fonds de la catégorie « United Nations environnement programme» doivent être comptabilisés et classés dans la partie « Multilateral financial institutions , including regional development banks » sauf le fonds CTF qui doit être comptabilisé et classé dans la partie « Multilateral climate change funds ».
c Parties may select several applicable sectors. Parties may report sectoral distribution, as applicable, under �Other�.
Donor funding
Total amount
Status b Funding source f Financial instrument f Type of support f, gCore/general d
Sector cClimate-specific e
Abbreviations: ODA = official development assistance, OOF = other official flows.a Parties should fill in a separate table for each year, namely 2011 and 2012, where 2014 is the reporting year. b Parties should explain, in their biennial reports, the methodologies used to specify the funds as provided, committed and/or pledged. Parties will provide the information for as many status categories as appropriate in the following order of priority: provided, committed, pledged.
f Please specify.g Cross-cutting type of support refers to funding for activities which are cross-cutting across mitigation and adaptation.
e Parties should explain in their biennial reports how they define funds as being climate-specific.
d This refers to support to multilateral institutions that Parties cannot specify as climate-specific.
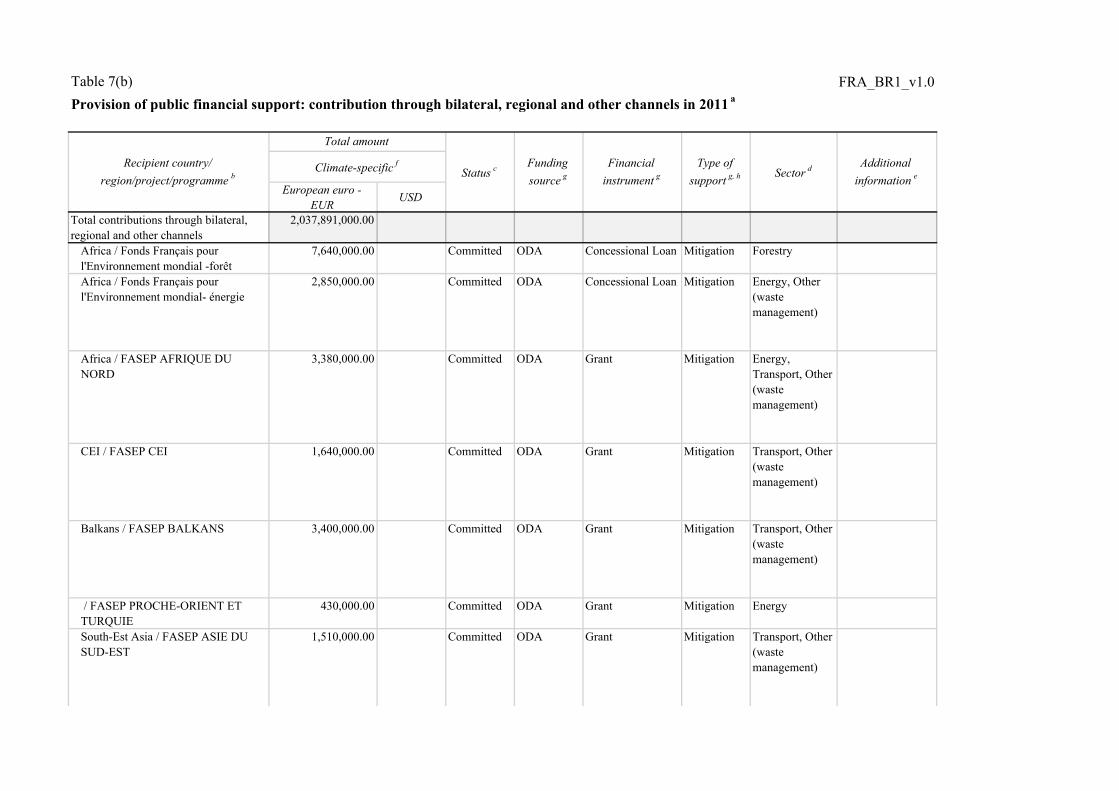
Table 7(b) FRA_BR1_v1.0Provision of public financial support: contribution through bilateral, regional and other channels in 2011 a
European euro - EUR USD
Total contributions through bilateral, regional and other channels
2,037,891,000.00
Africa / Fonds Français pour l'Environnement mondial -forêt
7,640,000.00 Committed ODA Concessional Loan Mitigation Forestry
Africa / Fonds Français pour l'Environnement mondial- énergie
2,850,000.00 Committed ODA Concessional Loan Mitigation Energy, Other (waste management)
Africa / FASEP AFRIQUE DU NORD
3,380,000.00 Committed ODA Grant Mitigation Energy, Transport, Other (waste management)
CEI / FASEP CEI 1,640,000.00 Committed ODA Grant Mitigation Transport, Other (waste management)
Balkans / FASEP BALKANS 3,400,000.00 Committed ODA Grant Mitigation Transport, Other (waste management)
/ FASEP PROCHE-ORIENT ET TURQUIE
430,000.00 Committed ODA Grant Mitigation Energy
South-Est Asia / FASEP ASIE DU SUD-EST
1,510,000.00 Committed ODA Grant Mitigation Transport, Other (waste management)
Sector d Additional information e
Total amount
Recipient country/ region/project/programme b
Climate-specific fStatus c Funding
source gFinancial
instrument gType of
support g, h

Table 7(b) FRA_BR1_v1.0Provision of public financial support: contribution through bilateral, regional and other channels in 2011 a
European euro - EUR USD
Sector d Additional information e
Total amount
Recipient country/ region/project/programme b
Climate-specific fStatus c Funding
source gFinancial
instrument gType of
support g, h
Africa / FASEP AFRIQUE SUBSAHARIENNE
430,000.00 Committed ODA Grant Mitigation Other (waste management)
latina America / FASEP AMERIQUE LATINE
863,000.00 Provided ODA Grant Mitigation Transport, Agriculture
Africa / AFD AFRIQUE SUBSAHARIENNE
7,504,000.00 Committed ODA Grant Cross-cutting
Forestry, Agriculture, Cross-cutting
Africa / AFD AFRIQUE SUBSAHARIENNE
5,446,000.00 Committed ODA Grant Adaptation Agriculture
Africa / AFD AFRIQUE SUBSAHARIENNE
1,110,000.00 Committed ODA Grant Mitigation Forestry
Latin America and the Caribbean / AFD AMERIQUE LATINE
76,800,000.00 Committed ODA Concessional Loan Adaptation Other (water ressources)
Asia Pacific / AFD ASIE 20,500,000.00 Committed ODA Concessional Loan Adaptation Water and sanitation
Asia Pacific / AFD ASIE 141,000,000.00 Committed ODA Concessional Loan Mitigation Energy
Africa / Fond Français pour l'Environnement mondial- plan climat
750,000.00 Committed ODA Concessional Loan Adaptation Other (capacity-building)
Mediterranean / Fond Français pour l'Environnement mondial- Méditerranée ecosystèmes boisés
2,650,000.00 Committed ODA Concessional Loan Mitigation Forestry
Colombia / Fond français pour l'Environnement Redd+
1,460,000.00 Committed ODA Concessional Loan Mitigation Forestry
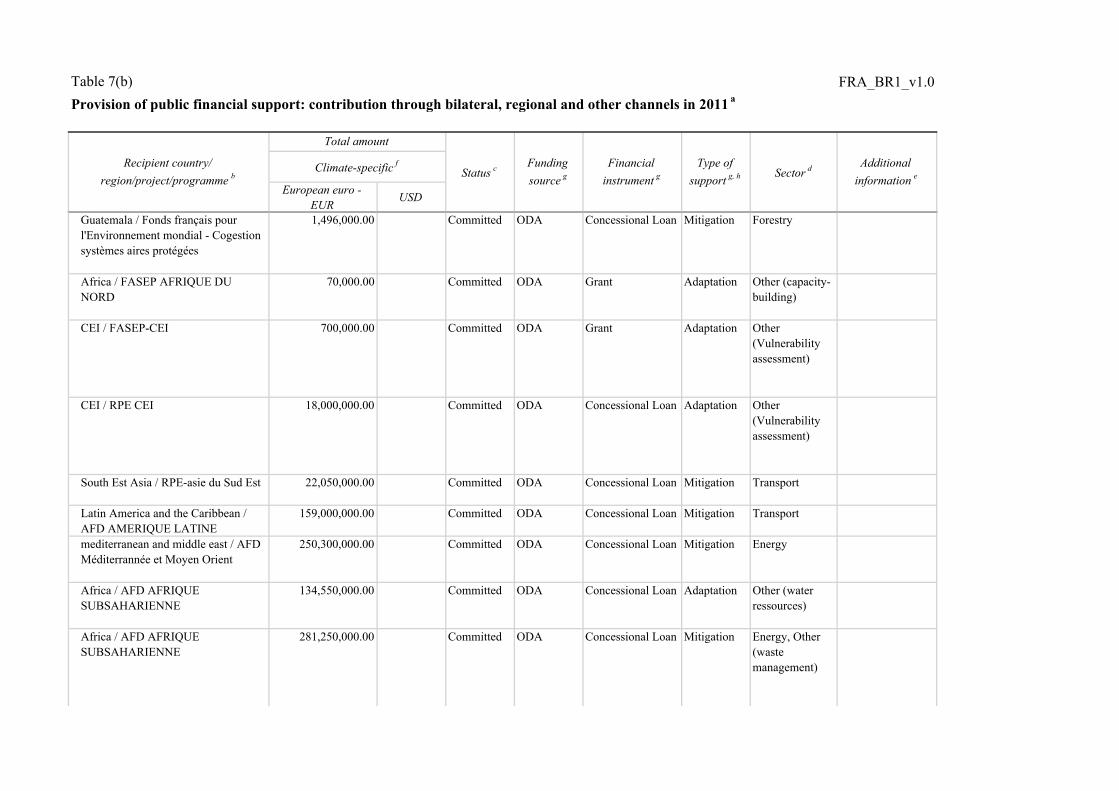
Table 7(b) FRA_BR1_v1.0Provision of public financial support: contribution through bilateral, regional and other channels in 2011 a
European euro - EUR USD
Sector d Additional information e
Total amount
Recipient country/ region/project/programme b
Climate-specific fStatus c Funding
source gFinancial
instrument gType of
support g, h
Guatemala / Fonds français pour l'Environnement mondial - Cogestion systèmes aires protégées
1,496,000.00 Committed ODA Concessional Loan Mitigation Forestry
Africa / FASEP AFRIQUE DU NORD
70,000.00 Committed ODA Grant Adaptation Other (capacity-building)
CEI / FASEP-CEI 700,000.00 Committed ODA Grant Adaptation Other (Vulnerability assessment)
CEI / RPE CEI 18,000,000.00 Committed ODA Concessional Loan Adaptation Other (Vulnerability assessment)
South Est Asia / RPE-asie du Sud Est 22,050,000.00 Committed ODA Concessional Loan Mitigation Transport
Latin America and the Caribbean / AFD AMERIQUE LATINE
159,000,000.00 Committed ODA Concessional Loan Mitigation Transport
mediterranean and middle east / AFD Méditerrannée et Moyen Orient
250,300,000.00 Committed ODA Concessional Loan Mitigation Energy
Africa / AFD AFRIQUE SUBSAHARIENNE
134,550,000.00 Committed ODA Concessional Loan Adaptation Other (water ressources)
Africa / AFD AFRIQUE SUBSAHARIENNE
281,250,000.00 Committed ODA Concessional Loan Mitigation Energy, Other (waste management)
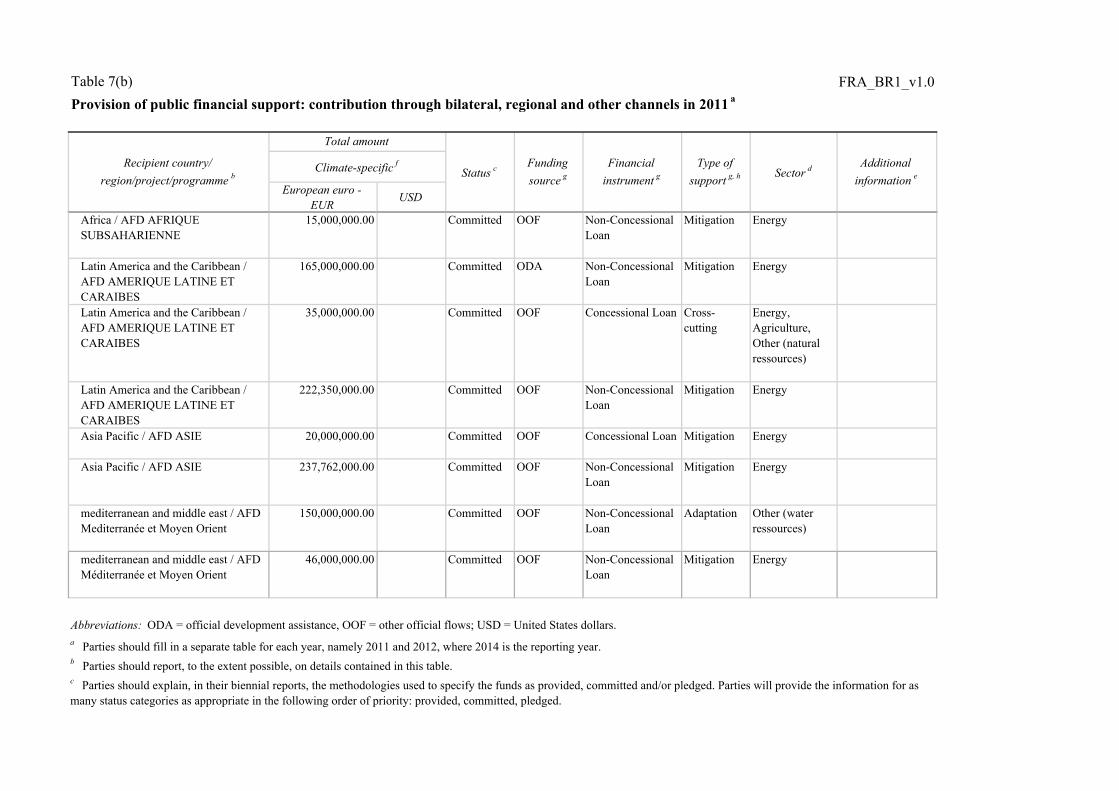
Table 7(b) FRA_BR1_v1.0Provision of public financial support: contribution through bilateral, regional and other channels in 2011 a
European euro - EUR USD
Sector d Additional information e
Total amount
Recipient country/ region/project/programme b
Climate-specific fStatus c Funding
source gFinancial
instrument gType of
support g, h
Africa / AFD AFRIQUE SUBSAHARIENNE
15,000,000.00 Committed OOF Non-Concessional Loan
Mitigation Energy
Latin America and the Caribbean / AFD AMERIQUE LATINE ET CARAIBES
165,000,000.00 Committed ODA Non-Concessional Loan
Mitigation Energy
Latin America and the Caribbean / AFD AMERIQUE LATINE ET CARAIBES
35,000,000.00 Committed OOF Concessional Loan Cross-cutting
Energy, Agriculture, Other (natural ressources)
Latin America and the Caribbean / AFD AMERIQUE LATINE ET CARAIBES
222,350,000.00 Committed OOF Non-Concessional Loan
Mitigation Energy
Asia Pacific / AFD ASIE 20,000,000.00 Committed OOF Concessional Loan Mitigation Energy
Asia Pacific / AFD ASIE 237,762,000.00 Committed OOF Non-Concessional Loan
Mitigation Energy
mediterranean and middle east / AFD Mediterranée et Moyen Orient
150,000,000.00 Committed OOF Non-Concessional Loan
Adaptation Other (water ressources)
mediterranean and middle east / AFD Méditerranée et Moyen Orient
46,000,000.00 Committed OOF Non-Concessional Loan
Mitigation Energy
Abbreviations: ODA = official development assistance, OOF = other official flows; USD = United States dollars.a Parties should fill in a separate table for each year, namely 2011 and 2012, where 2014 is the reporting year.b Parties should report, to the extent possible, on details contained in this table.c Parties should explain, in their biennial reports, the methodologies used to specify the funds as provided, committed and/or pledged. Parties will provide the information for as many status categories as appropriate in the following order of priority: provided, committed, pledged.
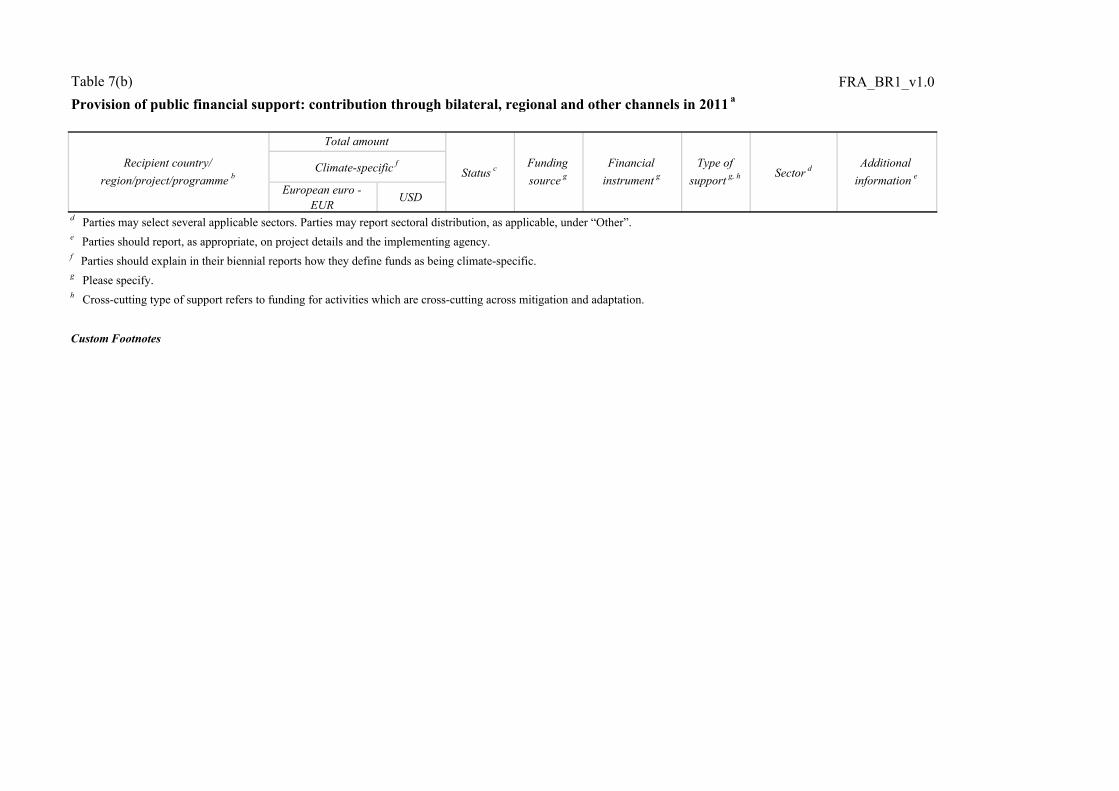
Table 7(b) FRA_BR1_v1.0Provision of public financial support: contribution through bilateral, regional and other channels in 2011 a
European euro - EUR USD
Sector d Additional information e
Total amount
Recipient country/ region/project/programme b
Climate-specific fStatus c Funding
source gFinancial
instrument gType of
support g, h
Custom Footnotes
d Parties may select several applicable sectors. Parties may report sectoral distribution, as applicable, under �Other�.e Parties should report, as appropriate, on project details and the implementing agency.f Parties should explain in their biennial reports how they define funds as being climate-specific. g Please specify.h Cross-cutting type of support refers to funding for activities which are cross-cutting across mitigation and adaptation.
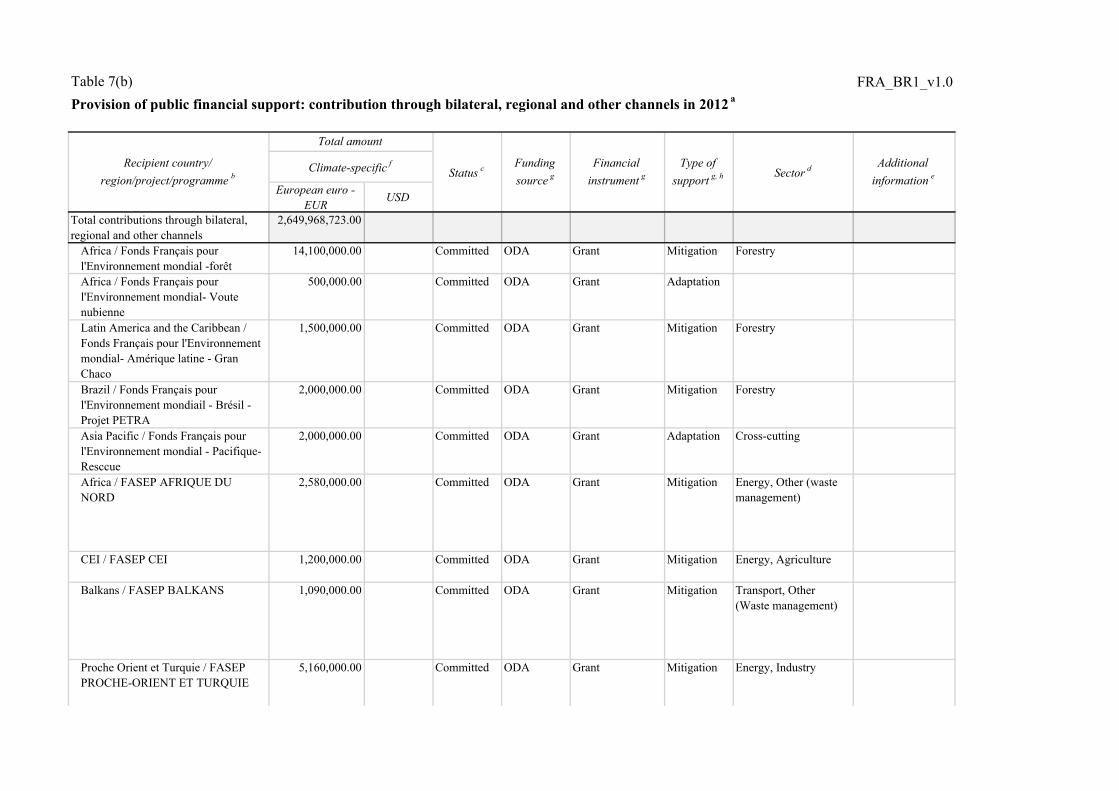
Table 7(b) FRA_BR1_v1.0Provision of public financial support: contribution through bilateral, regional and other channels in 2012 a
European euro - EUR USD
Total contributions through bilateral, regional and other channels
2,649,968,723.00
Africa / Fonds Français pour l'Environnement mondial -forêt
14,100,000.00 Committed ODA Grant Mitigation Forestry
Africa / Fonds Français pour l'Environnement mondial- Voute nubienne
500,000.00 Committed ODA Grant Adaptation
Latin America and the Caribbean / Fonds Français pour l'Environnement mondial- Amérique latine - Gran Chaco
1,500,000.00 Committed ODA Grant Mitigation Forestry
Brazil / Fonds Français pour l'Environnement mondiail - Brésil - Projet PETRA
2,000,000.00 Committed ODA Grant Mitigation Forestry
Asia Pacific / Fonds Français pour l'Environnement mondial - Pacifique- Resccue
2,000,000.00 Committed ODA Grant Adaptation Cross-cutting
Africa / FASEP AFRIQUE DU NORD
2,580,000.00 Committed ODA Grant Mitigation Energy, Other (waste management)
CEI / FASEP CEI 1,200,000.00 Committed ODA Grant Mitigation Energy, Agriculture
Balkans / FASEP BALKANS 1,090,000.00 Committed ODA Grant Mitigation Transport, Other (Waste management)
Proche Orient et Turquie / FASEP PROCHE-ORIENT ET TURQUIE
5,160,000.00 Committed ODA Grant Mitigation Energy, Industry
Recipient country/ region/project/programme b
Total amount
Status c Funding source g
Financial instrument g
Type of support g, h Sector d Additional
information eClimate-specific f
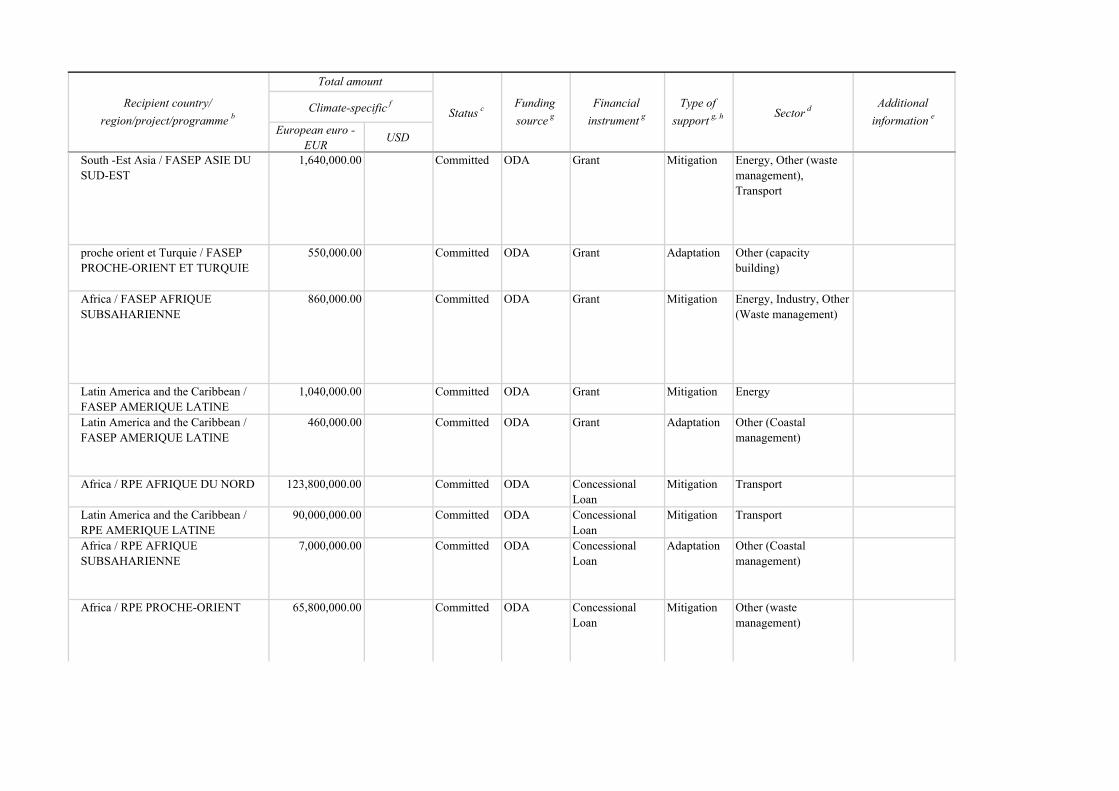
European euro - EUR USD
Recipient country/ region/project/programme b
Total amount
Status c Funding source g
Financial instrument g
Type of support g, h Sector d Additional
information eClimate-specific f
South -Est Asia / FASEP ASIE DU SUD-EST
1,640,000.00 Committed ODA Grant Mitigation Energy, Other (waste management), Transport
proche orient et Turquie / FASEP PROCHE-ORIENT ET TURQUIE
550,000.00 Committed ODA Grant Adaptation Other (capacity building)
Africa / FASEP AFRIQUE SUBSAHARIENNE
860,000.00 Committed ODA Grant Mitigation Energy, Industry, Other (Waste management)
Latin America and the Caribbean / FASEP AMERIQUE LATINE
1,040,000.00 Committed ODA Grant Mitigation Energy
Latin America and the Caribbean / FASEP AMERIQUE LATINE
460,000.00 Committed ODA Grant Adaptation Other (Coastal management)
Africa / RPE AFRIQUE DU NORD 123,800,000.00 Committed ODA Concessional Loan
Mitigation Transport
Latin America and the Caribbean / RPE AMERIQUE LATINE
90,000,000.00 Committed ODA Concessional Loan
Mitigation Transport
Africa / RPE AFRIQUE SUBSAHARIENNE
7,000,000.00 Committed ODA Concessional Loan
Adaptation Other (Coastal management)
Africa / RPE PROCHE-ORIENT 65,800,000.00 Committed ODA Concessional Loan
Mitigation Other (waste management)
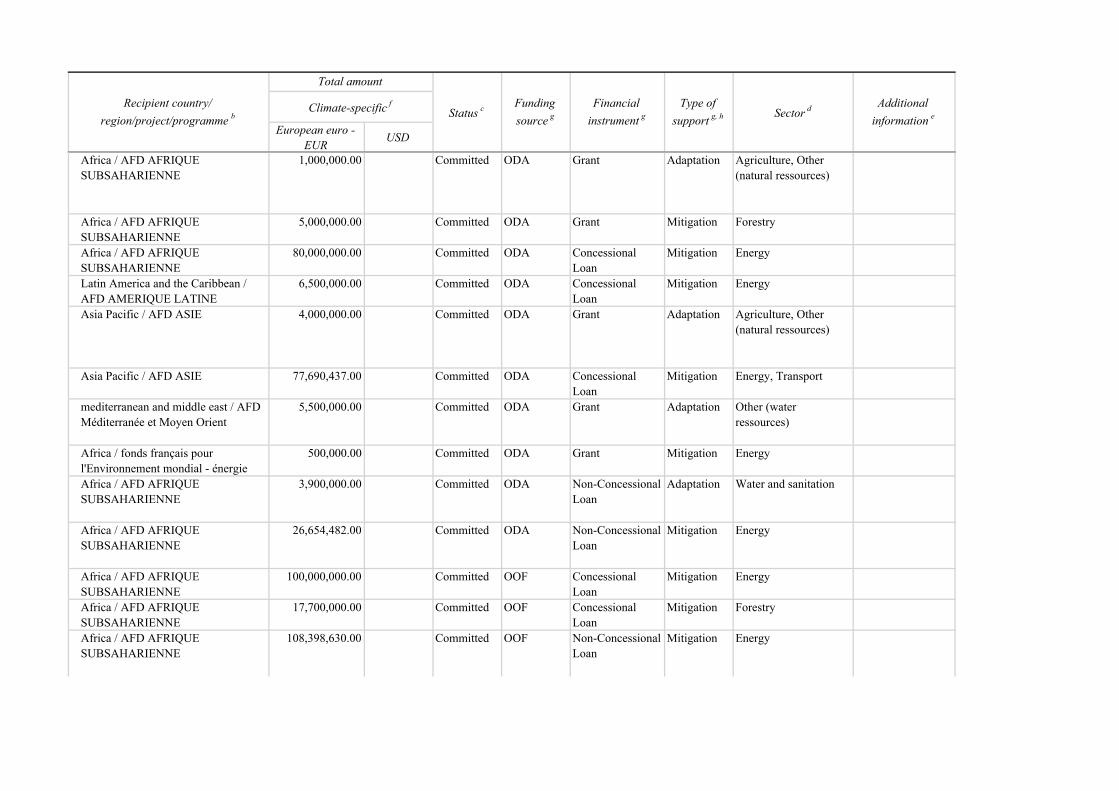
European euro - EUR USD
Recipient country/ region/project/programme b
Total amount
Status c Funding source g
Financial instrument g
Type of support g, h Sector d Additional
information eClimate-specific f
Africa / AFD AFRIQUE SUBSAHARIENNE
1,000,000.00 Committed ODA Grant Adaptation Agriculture, Other (natural ressources)
Africa / AFD AFRIQUE SUBSAHARIENNE
5,000,000.00 Committed ODA Grant Mitigation Forestry
Africa / AFD AFRIQUE SUBSAHARIENNE
80,000,000.00 Committed ODA Concessional Loan
Mitigation Energy
Latin America and the Caribbean / AFD AMERIQUE LATINE
6,500,000.00 Committed ODA Concessional Loan
Mitigation Energy
Asia Pacific / AFD ASIE 4,000,000.00 Committed ODA Grant Adaptation Agriculture, Other (natural ressources)
Asia Pacific / AFD ASIE 77,690,437.00 Committed ODA Concessional Loan
Mitigation Energy, Transport
mediterranean and middle east / AFD Méditerranée et Moyen Orient
5,500,000.00 Committed ODA Grant Adaptation Other (water ressources)
Africa / fonds français pour l'Environnement mondial - énergie
500,000.00 Committed ODA Grant Mitigation Energy
Africa / AFD AFRIQUE SUBSAHARIENNE
3,900,000.00 Committed ODA Non-Concessional Loan
Adaptation Water and sanitation
Africa / AFD AFRIQUE SUBSAHARIENNE
26,654,482.00 Committed ODA Non-Concessional Loan
Mitigation Energy
Africa / AFD AFRIQUE SUBSAHARIENNE
100,000,000.00 Committed OOF Concessional Loan
Mitigation Energy
Africa / AFD AFRIQUE SUBSAHARIENNE
17,700,000.00 Committed OOF Concessional Loan
Mitigation Forestry
Africa / AFD AFRIQUE SUBSAHARIENNE
108,398,630.00 Committed OOF Non-Concessional Loan
Mitigation Energy
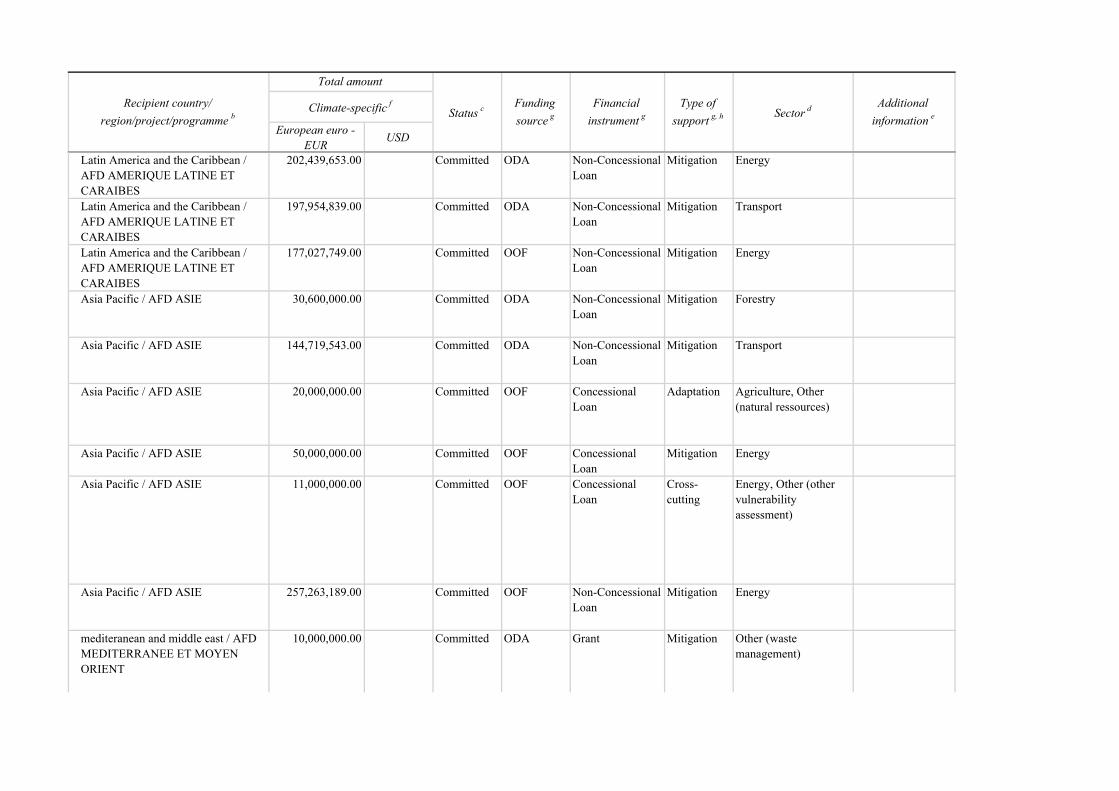
European euro - EUR USD
Recipient country/ region/project/programme b
Total amount
Status c Funding source g
Financial instrument g
Type of support g, h Sector d Additional
information eClimate-specific f
Latin America and the Caribbean / AFD AMERIQUE LATINE ET CARAIBES
202,439,653.00 Committed ODA Non-Concessional Loan
Mitigation Energy
Latin America and the Caribbean / AFD AMERIQUE LATINE ET CARAIBES
197,954,839.00 Committed ODA Non-Concessional Loan
Mitigation Transport
Latin America and the Caribbean / AFD AMERIQUE LATINE ET CARAIBES
177,027,749.00 Committed OOF Non-Concessional Loan
Mitigation Energy
Asia Pacific / AFD ASIE 30,600,000.00 Committed ODA Non-Concessional Loan
Mitigation Forestry
Asia Pacific / AFD ASIE 144,719,543.00 Committed ODA Non-Concessional Loan
Mitigation Transport
Asia Pacific / AFD ASIE 20,000,000.00 Committed OOF Concessional Loan
Adaptation Agriculture, Other (natural ressources)
Asia Pacific / AFD ASIE 50,000,000.00 Committed OOF Concessional Loan
Mitigation Energy
Asia Pacific / AFD ASIE 11,000,000.00 Committed OOF Concessional Loan
Cross-cutting
Energy, Other (other vulnerability assessment)
Asia Pacific / AFD ASIE 257,263,189.00 Committed OOF Non-Concessional Loan
Mitigation Energy
mediteranean and middle east / AFD MEDITERRANEE ET MOYEN ORIENT
10,000,000.00 Committed ODA Grant Mitigation Other (waste management)
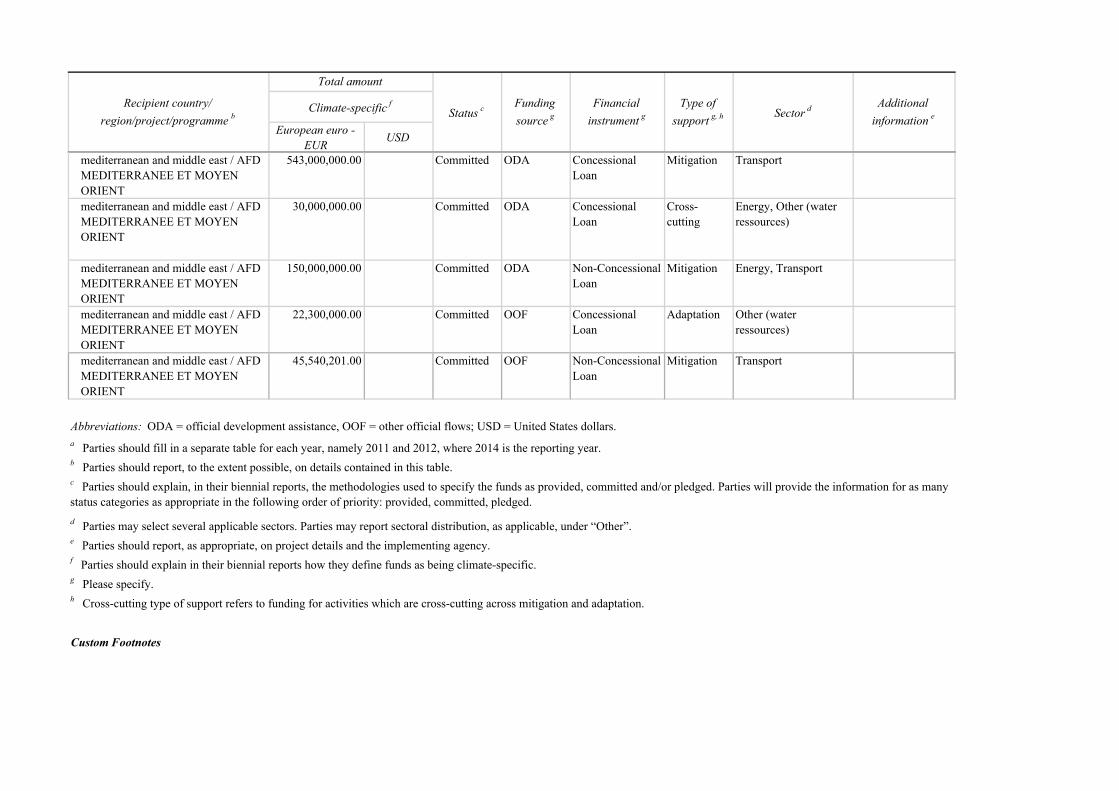
European euro - EUR USD
Recipient country/ region/project/programme b
Total amount
Status c Funding source g
Financial instrument g
Type of support g, h Sector d Additional
information eClimate-specific f
mediterranean and middle east / AFD MEDITERRANEE ET MOYEN ORIENT
543,000,000.00 Committed ODA Concessional Loan
Mitigation Transport
mediterranean and middle east / AFD MEDITERRANEE ET MOYEN ORIENT
30,000,000.00 Committed ODA Concessional Loan
Cross-cutting
Energy, Other (water ressources)
mediterranean and middle east / AFD MEDITERRANEE ET MOYEN ORIENT
150,000,000.00 Committed ODA Non-Concessional Loan
Mitigation Energy, Transport
mediterranean and middle east / AFD MEDITERRANEE ET MOYEN ORIENT
22,300,000.00 Committed OOF Concessional Loan
Adaptation Other (water ressources)
mediterranean and middle east / AFD MEDITERRANEE ET MOYEN ORIENT
45,540,201.00 Committed OOF Non-Concessional Loan
Mitigation Transport
Abbreviations: ODA = official development assistance, OOF = other official flows; USD = United States dollars.
Custom Footnotes
d Parties may select several applicable sectors. Parties may report sectoral distribution, as applicable, under �Other�.e Parties should report, as appropriate, on project details and the implementing agency.f Parties should explain in their biennial reports how they define funds as being climate-specific. g Please specify.h Cross-cutting type of support refers to funding for activities which are cross-cutting across mitigation and adaptation.
c Parties should explain, in their biennial reports, the methodologies used to specify the funds as provided, committed and/or pledged. Parties will provide the information for as many status categories as appropriate in the following order of priority: provided, committed, pledged.
a Parties should fill in a separate table for each year, namely 2011 and 2012, where 2014 is the reporting year.b Parties should report, to the extent possible, on details contained in this table.
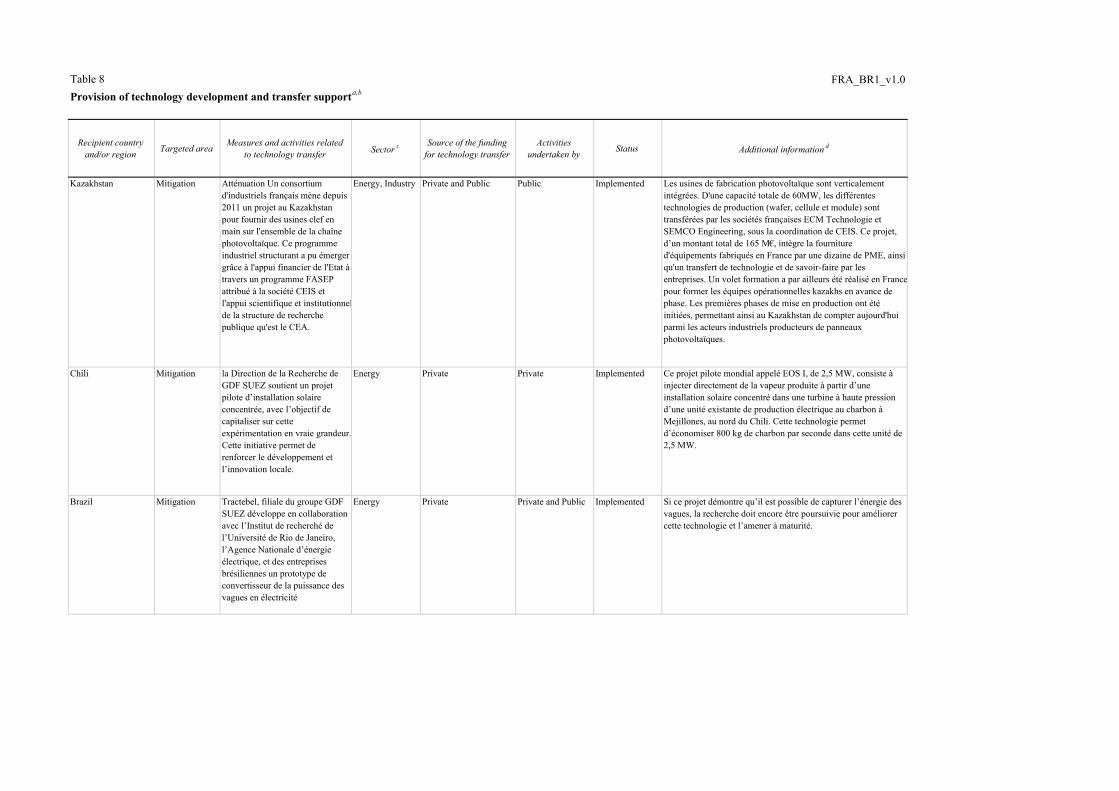
Table 8 FRA_BR1_v1.0Provision of technology development and transfer supporta,b
Recipient country and/or region Targeted area Measures and activities related
to technology transfer Sector c Source of the funding for technology transfer
Activities undertaken by Status Additional information d
Kazakhstan Mitigation Atténuation Un consortium d'industriels français mène depuis 2011 un projet au Kazakhstan pour fournir des usines clef en main sur l'ensemble de la chaîne photovoltaïque. Ce programme industriel structurant a pu émerger grâce à l'appui financier de l'Etat à travers un programme FASEP attribué à la société CEIS et l'appui scientifique et institutionnelde la structure de recherche publique qu'est le CEA.
Energy, Industry Private and Public Public Implemented Les usines de fabrication photovoltaïque sont verticalement intégrées. D'une capacité totale de 60MW, les différentes technologies de production (wafer, cellule et module) sont transférées par les sociétés françaises ECM Technologie et SEMCO Engineering, sous la coordination de CEIS. Ce projet, d�un montant total de 165 M�, intègre la fourniture d'équipements fabriqués en France par une dizaine de PME, ainsi qu'un transfert de technologie et de savoir-faire par les entreprises. Un volet formation a par ailleurs été réalisé en Francepour former les équipes opérationnelles kazakhs en avance de phase. Les premières phases de mise en production ont été initiées, permettant ainsi au Kazakhstan de compter aujourd'hui parmi les acteurs industriels producteurs de panneaux photovoltaïques.
Chili Mitigation la Direction de la Recherche de GDF SUEZ soutient un projet pilote d�installation solaire concentrée, avec l�objectif de capitaliser sur cette expérimentation en vraie grandeur.Cette initiative permet de renforcer le développement et l�innovation locale.
Energy Private Private Implemented Ce projet pilote mondial appelé EOS I, de 2,5 MW, consiste à injecter directement de la vapeur produite à partir d�une installation solaire concentré dans une turbine à haute pression d�une unité existante de production électrique au charbon à Mejillones, au nord du Chili. Cette technologie permet d�économiser 800 kg de charbon par seconde dans cette unité de 2,5 MW.
Brazil Mitigation Tractebel, filiale du groupe GDF SUEZ développe en collaboration avec l�Institut de recherché de l�Université de Rio de Janeiro, l�Agence Nationale d�énergie électrique, et des entreprises brésiliennes un prototype de convertisseur de la puissance des vagues en électricité
Energy Private Private and Public Implemented Si ce projet démontre qu�il est possible de capturer l�énergie des vagues, la recherche doit encore être poursuivie pour améliorer cette technologie et l�amener à maturité.

Table 8 FRA_BR1_v1.0Provision of technology development and transfer supporta,b
Recipient country and/or region Targeted area Measures and activities related
to technology transfer Sector c Source of the funding for technology transfer
Activities undertaken by Status Additional information d
united arab emirates Mitigation Total participe, en partenariat avec d�autres sociétés, à la joint venture Shams Power Company qui a permis la construction et le développement de Shams 1, la plus grande centrale à solaire concentré en activité dans le monde.
Energy Private Private Implemented Ce projet de centrale thermique solaire d�une capacité de 100 MW alimentera 20 000 foyers aux Emirats Arabes Unis (EAU) et permettra d�éviter l�émission d�environ 175 000 tonnes de CO2 par an. Intégrant les technologies cylindro-paraboliques les plus récentes, ainsi qu'un système de refroidissement sec qui réduit de façon significative la consommation d�eau, Shams 1 illustre l�efficacité de la collaboration entre différentes entreprises pour aboutir à des solutions énergétiques à grande échelle et respectueuses de l�environnement, qui permettent de répondre à la hausse des besoins mondiaux en énergie et à la diversification des mix énergétiques.
world Mitigation La France est membre fondateur et accueille à Paris le siège de l�Agence Internationale de l�Energie (AIE). Celle-ci permet en particulier l'appui et l'accélération des transferts de technologie, ainsi que le partage d'expériences, dans les domaines de l�énergie et de l�efficacité énergétique.
Energy Public Public Implemented Fondée à l�OCDE en 1974, à la suite du premier choc pétrolier, sa mission initiale était de coordonner les mesures à prendre en temps de crise des approvisionnements pétroliers. Si cette mission reste au c�ur de ses activités, son mandat s�est progressivement élargi pour prendre en considération la sécurité énergétique, le développement économique et durable, et plus récemment les enjeux climatiques. L�AIE facilite la coordination des politiques énergétiques de ses 29 pays membres, qui s�emploient à assurer pour leurs citoyens des approvisionnements en énergie fiables, propres et à des prix abordables. L�AIE est l�organisation de référence dans le domaine de l�énergie, et produit chaque année le rapport de référence en matière énergétique au niveau mondial, le World Energy Outlook (WEO).

Table 8 FRA_BR1_v1.0Provision of technology development and transfer supporta,b
Recipient country and/or region Targeted area Measures and activities related
to technology transfer Sector c Source of the funding for technology transfer
Activities undertaken by Status Additional information d
world Mitigation and Adaptation
A travers des soutiens humains et financiers, et une coopération en renforcement, la France travaille activement au sein de l'IRENA (Agence internationale de l'énergierenouvelable) pour faciliter la transition énergétique des pays en développement, vers une croissance sobre en carbone. La France est d'ailleurs le sixième contributeur de l�Agence (1,4 MUSD en 2012).
Energy Public Public Implemented La montée en puissance de l�agence, créée en 2009 et comptant aujourd'hui plus d'une centaine de membres, mérite d'être saluée. Cette agence se veut opérationnelle en fournissant une plateformed'appui aux pays souhaitant mettre en oeuvre les énergies renouvelables. Elle permet le développement et le partage d'outilsfavorisant le déploiement des énergies renouvelables à grande échelle et dans tous les pays. L'appui qu'elle fournit spécifiquement aux pays en développement, dont les moins avancés et les petites îles, est jugé prioritaire par la France. Cette Agence inscrit aujourd'hui son action dans le cadre fédérateur de la démarche Sustainable Energy for All (SE4All) proposé par le secrétaire général des Nations Unies. Poussant trois objectifs importants pour un développement sobre en carbone, cette initiative large a permis de catalyser l'action en offrant un cadre commun et une visibilité accrue à ces enjeux. La France participe activement à cette initiative, directement en apportant un appui humain ou en mobilisant ses acteurs de la coopération sur le terrain, ou indirectement à travers l'action de l'Union Européenne et la facilité financière mise en place. L'accèsà l'énergie est un thème cher à la France qu'elle porte à travers sesactions de coopération.
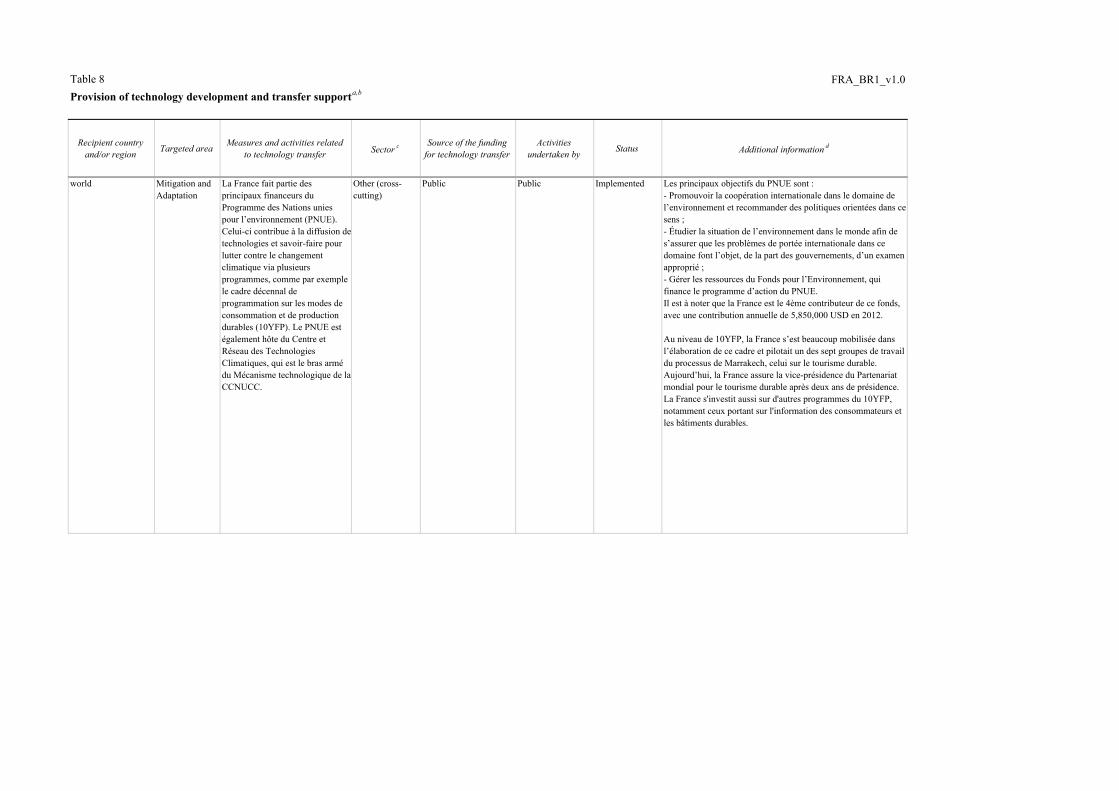
Table 8 FRA_BR1_v1.0Provision of technology development and transfer supporta,b
Recipient country and/or region Targeted area Measures and activities related
to technology transfer Sector c Source of the funding for technology transfer
Activities undertaken by Status Additional information d
world Mitigation and Adaptation
La France fait partie des principaux financeurs du Programme des Nations unies pour l�environnement (PNUE). Celui-ci contribue à la diffusion detechnologies et savoir-faire pour lutter contre le changement climatique via plusieurs programmes, comme par exemple le cadre décennal de programmation sur les modes de consommation et de production durables (10YFP). Le PNUE est également hôte du Centre et Réseau des Technologies Climatiques, qui est le bras armé du Mécanisme technologique de la CCNUCC.
Other (cross-cutting)
Public Public Implemented Les principaux objectifs du PNUE sont :- Promouvoir la coopération internationale dans le domaine de l�environnement et recommander des politiques orientées dans ce sens ;- Étudier la situation de l�environnement dans le monde afin de s�assurer que les problèmes de portée internationale dans ce domaine font l�objet, de la part des gouvernements, d�un examen approprié ;- Gérer les ressources du Fonds pour l�Environnement, qui finance le programme d�action du PNUE. Il est à noter que la France est le 4ème contributeur de ce fonds, avec une contribution annuelle de 5,850,000 USD en 2012.
Au niveau de 10YFP, la France s�est beaucoup mobilisée dans l�élaboration de ce cadre et pilotait un des sept groupes de travail du processus de Marrakech, celui sur le tourisme durable. Aujourd�hui, la France assure la vice-présidence du Partenariat mondial pour le tourisme durable après deux ans de présidence. La France s'investit aussi sur d'autres programmes du 10YFP, notamment ceux portant sur l'information des consommateurs et les bâtiments durables.
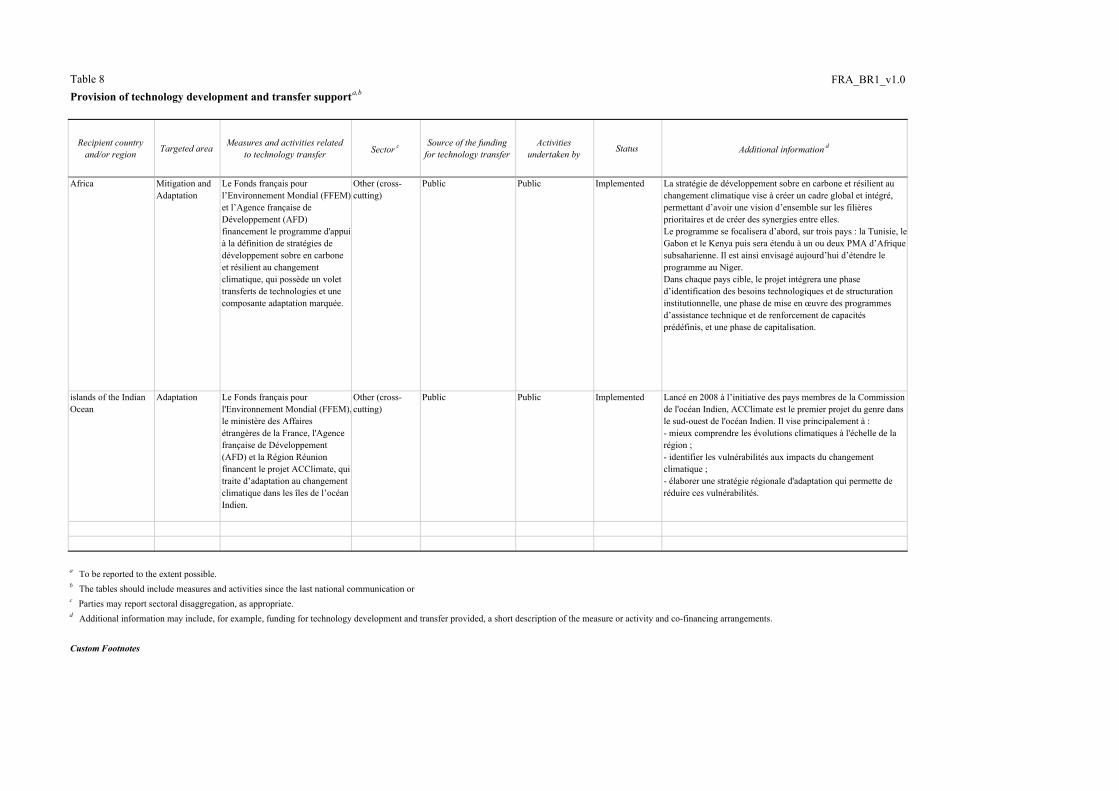
Table 8 FRA_BR1_v1.0Provision of technology development and transfer supporta,b
Recipient country and/or region Targeted area Measures and activities related
to technology transfer Sector c Source of the funding for technology transfer
Activities undertaken by Status Additional information d
Africa Mitigation and Adaptation
Le Fonds français pour l�Environnement Mondial (FFEM) et l�Agence française de Développement (AFD) financement le programme d'appui à la définition de stratégies de développement sobre en carbone et résilient au changement climatique, qui possède un volet transferts de technologies et une composante adaptation marquée.
Other (cross-cutting)
Public Public Implemented La stratégie de développement sobre en carbone et résilient au changement climatique vise à créer un cadre global et intégré, permettant d�avoir une vision d�ensemble sur les filières prioritaires et de créer des synergies entre elles.Le programme se focalisera d�abord, sur trois pays : la Tunisie, leGabon et le Kenya puis sera étendu à un ou deux PMA d�Afrique subsaharienne. Il est ainsi envisagé aujourd�hui d�étendre le programme au Niger.Dans chaque pays cible, le projet intégrera une phase d�identification des besoins technologiques et de structuration institutionnelle, une phase de mise en �uvre des programmes d�assistance technique et de renforcement de capacités prédéfinis, et une phase de capitalisation.
islands of the Indian Ocean
Adaptation Le Fonds français pour l'Environnement Mondial (FFEM),le ministère des Affaires étrangères de la France, l'Agence française de Développement (AFD) et la Région Réunion financent le projet ACClimate, qui traite d�adaptation au changement climatique dans les îles de l�océan Indien.
Other (cross-cutting)
Public Public Implemented Lancé en 2008 à l�initiative des pays membres de la Commission de l'océan Indien, ACClimate est le premier projet du genre dans le sud-ouest de l'océan Indien. Il vise principalement à :- mieux comprendre les évolutions climatiques à l'échelle de la région ;- identifier les vulnérabilités aux impacts du changement climatique ;- élaborer une stratégie régionale d'adaptation qui permette de réduire ces vulnérabilités.
a To be reported to the extent possible.
Custom Footnotes
b The tables should include measures and activities since the last national communication or c Parties may report sectoral disaggregation, as appropriate. d Additional information may include, for example, funding for technology development and transfer provided, a short description of the measure or activity and co-financing arrangements.

Table 9 FRA_BR1_v1.0Provision of capacity-building supporta
Recipient country/region Targeted area Programme or project
title Description of programme or project b,c
Africa Mitigation capacity building in Africa
En 2012, la France a soutenu une session de formation organisée par l�association Geres (Groupe Énergies Renouvelables, Environnement et Solidarités).
Africa Multiple Areas AMMA Concernant le SMOC en Afrique, l�expérience interna-tionale AMMA s�est prolongée depuis 2010. AMMA-CATCH, système d�observation pour un suivi à long terme des impacts de la mousson en Afrique de l�Ouest a été maintenu. Il avait été initié par le MESR et il bénéficie du soutien de l�IRD (Institut de re-cherche pour le développement) et de l�INSU (L�Institut national des sciences de l�Univers).
mediteranean basin Multiple Areas MISTRALS Lancé en 2008 pour une durée prévue jusqu�en 2020, MISTRALS a pris de l�ampleur sur le terrain en 2010. C�est un méta-programme international de recherches fondamentales et d�observations interdis-ciplinaires et systématiques dédié à la compréhension du fonctionnement et de l�évolution de l�environnement dans le bassin méditerranéen sous les pressions du changement global anthropique pour en prédire l�évolution future. Au-delà de sa vocation académique, MISTRALS a également pour ambition de transformer les objectifs et résultats de recherche en concepts et données accessibles aux décideurs, acteurs territoriaux et gestionnaires, afin d�identifier les besoins et nécessités nationaux et transnationaux et de répondre aux enjeux sociétaux, environnemen-taux et économiques pour le développement durable des pays et des populations partageant l�aire médi-terranéenne.
Maldives Mitigation capacity building L�objectif de la formation a été de fournir une critique constructive de l�inventaire dont disposait les Mal-dives au regard du savoir-faire de la France et de leur pro¬poser une stratégie pour pérenniser ce travail d�inventaire qui avait été réalisé en 2010 et mettre en place un système national.
Southern Europe, mediteranean basin, Europe, Vietnam
Adaptation bilaterales and multilaterales cooperations
L�Observatoire National sur les Effets du Réchauffe-ment Climatique, a participé à différents travaux :
�l�adaptation steering group installé par la Commis-sion européenne pour l�élaboration d�une stratégie communautaire d�adaptation au changement cli-matique (2009-2013) ;
�l�adaptation working group for knowledge base installé par la Commission européenne pour la structuration et les tests de la plateforme d�échange d�expérience Climate-Adapt (2009-2012) ;
�rencontre des pays d�Europe du sud pour le par-tage d�expérience en matière de planification d�adaptation (Rome, 2012) ;
�rencontre multilatérale de pays d�Europe pour le partage d�expériences en matière d�étude des im-pacts et des vulnérabilités au changement clima-tique : Suisse, Allemagne, Italie, Autriche, Slovénie (Berne, 2012) ;
�atelier de travail avec les pays riverains de la Mé-diterranée organisé par le Plan Bleu (Le Caire, 2012) ;
�dialogue multilatéral avec les pays riverains de l�arc alpin dans le cadre de la convention alpine (Vienne, 2013) ;
�atelier de travail bilatéral sur les politiques d�adaptation Pologne-France (Varsovie, 2013) ;
�participation au groupe de parties prenantes du projet européen de recherche Impact2C (Vienne, 2013) ;
�rencontre bilatérale de partage d�expérience en matière d�étude de vulnérabilité et de politique d�adaptation avec le Vietnam (Paris, 2011) ;
�échange technique pour la structuration d�un ob-servatoire du changement climatique à Maurice (Port-Louis, 2011) ;
�Météo-France et les ministères concernés partici-pent aux travaux de mise en place du cadre mon-dial pour les services climatiques dans le cadre de l�OMM (depuis 2009).
Recipient country/region Targeted area Programme or project
title Description of programme or project b,c
a To be reported to the extent possible.
c Additional information may be provided on, for example, the measure or activity and co-financing arrangements.
Custom Footnotes
b Each Party included in Annex II to the Convention shall provide information, to the extent possible, on how it has provided capacity-building support that responds to the existing and emerging capacity-building needs identified by Parties not included in Annex I to the Convention in the areas of mitigation, adaptation and technology development and transfer.