Embed Size (px)
Citation preview

Submission Year 2014 Party UKRAINE
Submission Version v1.0 Submission Level Submitted
Submission Key UKR_2014_V1.0 Submission Status Closed
Submitted By Vladimir Sytyk Workbook Created 30.12.2013 06:04:11
Submitted Date 30.12.2013 06:03:17
Table 1s1
Table 1s2
Table 1s3
Table 1(a)s1
Table 1(a)s2
Table 1(a)s3
Table 1(b)s1
Table 1(b)s2
Table 1(b)s3
Table 1(c)s1
Table 1(c)s2
Table 1(c)s3
Table 1(d)s1
Table 1(d)s2
Table 1(d)s3
Table 2(a)
Table 2(b)
Table 2(c)
Table 2(d)
Table 2(e)I
Table 2(e)II
Table 2(f)
Table 3
Table 4
Table 4(a)I_2011
Table 4(a)I_2012
Table 4(a)II
Table 4(b)
Table 5
Table 6(a)
Table 6(b)
Table 6(c)
Table 7_2011
Table 7_2012
Table 7(a)_2011
Table 7(a)_2012
Table 7(b)_2011
Table 7(b)_2012
Table 8
Table 9
BR CTF submission workbook
Contents

Table 1 UKR_BR1_v1.0
Emission trends: summary (1) Source: Submission 2014 v1.1, UKRAINE
(Sheet 1 of 3) CRF: UKR_CRF__ v1.1
Base yeara 1991 1992 1993 1994 1995 1996 1997 1998
kt CO 2 eq kt CO 2 eq kt CO2 eq kt CO2 eq kt CO2 eq kt CO2 eq kt CO2 eq kt CO2 eq kt CO2 eq
CO2 emissions including net CO2 from LULUCF 649,193.99 540,376.82 477,090.25 415,282.97 340,703.90 311,570.92 269,275.04 274,869.92 257,957.38
CO2 emissions excluding net CO2 from LULUCF 718,951.47 618,211.62 542,206.30 464,813.63 402,965.22 360,356.18 324,399.74 309,703.55 308,601.12
CH4 emissions including CH4 from LULUCF 151,649.21 144,780.56 134,149.37 124,223.66 112,261.38 98,977.61 92,097.66 85,253.79 81,273.37
CH4 emissions excluding CH4 from LULUCF 151,640.82 144,775.68 134,137.29 124,207.12 112,214.05 98,963.32 92,059.95 85,251.14 81,259.51
N2O emissions including N2O from LULUCF 59,110.02 55,096.46 51,011.83 46,930.21 42,063.24 39,107.13 33,965.05 32,965.64 29,775.88
N2O emissions excluding N2O from LULUCF 59,098.04 55,085.36 50,998.82 46,915.56 42,040.74 39,093.28 33,945.33 32,955.00 29,762.80
HFCs NA, NE,
NO
NA, NE,
NO
NA, NE,
NO
NA, NE,
NO
NA, NE,
NO
NA, NE,
NO
NA, NE,
NO
5.83 11.35
PFCs 203.23 162.19 122.68 123.72 138.94 153.45 123.45 126.68 103.97
SF6 0.01 0.02 0.03 0.06 0.07 0.07 0.07 0.13 0.20
Total (including LULUCF) 860,156.45 740,416.05 662,374.17 586,560.63 495,167.53 449,809.18 395,461.27 393,221.99 369,122.16
Total (excluding LULUCF) 929,893.57 818,234.87 727,465.12 636,060.10 557,359.01 498,566.30 450,528.53 428,042.32 419,738.95
Base yeara 1991 1992 1993 1994 1995 1996 1997 1998
kt CO 2 eq kt CO 2 eq kt CO2 eq kt CO2 eq kt CO2 eq kt CO2 eq kt CO2 eq kt CO2 eq kt CO2 eq
1. Energy 735,556.41 642,078.50 560,444.49 490,761.10 432,104.09 386,146.51 350,237.27 329,600.82 325,739.79
2. Industrial Processes 79,841.03 66,511.10 65,768.79 51,320.18 40,318.20 35,680.17 33,807.30 37,857.25 37,919.37
3. Solvent and Other Product Use 376.80 377.62 378.98 378.04 375.24 372.11 368.64 365.39 362.11
4. Agriculture 103,602.53 98,749.95 90,422.81 83,262.01 74,490.40 66,469.10 56,324.83 50,456.46 45,936.36
5. Land Use, Land-Use Change and Forestryb -69,737.11 -77,818.82 -65,090.95 -49,499.46 -62,191.49 -48,757.12 -55,067.26 -34,820.33 -50,616.79
6. Waste 10,516.80 10,517.70 10,450.05 10,338.76 10,071.09 9,898.41 9,790.50 9,762.40 9,781.32
7. Other NA NA NA NA NA NA NA NA NA
Total (including LULUCF) 860,156.45 740,416.05 662,374.17 586,560.63 495,167.53 449,809.18 395,461.27 393,221.99 369,122.16
Note: All footnotes for this table are given on sheet 3.
GREENHOUSE GAS EMISSIONS
1 The common tabular format will be revised, in accordance with relevant decisions of the Conference of the Parties and, where
applicable, with decisions of the Conference of the Parties serving as the meeting of the Parties to the Kyoto Protocol."
GREENHOUSE GAS SOURCE AND SINK CATEGORIES

Table 1 UKR_BR1_v1.0
Emission trends: summary (1) Source: Submission 2014 v1.1, UKRAINE
(Sheet 2 of 3) CRF: UKR_CRF__ v1.1
1999 2000 2001 2002 2003 2004 2005 2006 2007 2008
kt CO 2 eq kt CO 2 eq kt CO2 eq kt CO2 eq kt CO2 eq kt CO2 eq kt CO2 eq kt CO2 eq kt CO2 eq kt CO2 eq
CO2 emissions including net CO2 from LULUCF 238,509.09 242,687.71 258,989.84 262,203.21 258,739.68 278,742.45 282,146.26 295,918.02 286,438.71 314,071.67
CO2 emissions excluding net CO2 from LULUCF 302,449.17 293,541.68 298,878.73 302,103.38 317,865.12 319,172.49 320,602.57 337,358.11 340,500.23 324,540.64
CH4 emissions including CH4 from LULUCF 78,930.97 75,609.26 74,382.38 73,351.95 72,435.52 71,388.28 70,224.71 69,174.03 67,897.49 66,370.63
CH4 emissions excluding CH4 from LULUCF 78,912.59 75,605.82 74,368.21 73,340.75 72,429.90 71,387.41 70,219.46 69,165.09 67,791.88 66,337.03
N2O emissions including N2O from LULUCF 28,084.41 26,498.38 26,886.39 27,523.02 26,043.43 26,337.66 26,104.49 26,744.87 27,409.32 29,669.85
N2O emissions excluding N2O from LULUCF 28,070.15 26,487.97 26,873.22 27,510.62 26,032.36 26,327.83 26,093.52 26,732.87 27,372.52 29,651.83
HFCs 12.07 14.12 25.96 57.47 94.57 167.79 253.76 355.98 498.64 571.58
PFCs 87.74 99.74 96.59 85.02 66.49 80.44 122.66 95.80 133.33 150.16
SF6 0.32 0.44 0.49 1.12 2.09 3.23 4.68 4.48 5.45 9.79
Total (including LULUCF) 345,624.61 344,909.64 360,381.65 363,221.78 357,381.77 376,719.85 378,856.57 392,293.17 382,382.94 410,843.68
Total (excluding LULUCF) 409,532.06 395,749.77 400,243.20 403,098.37 416,490.52 417,139.17 417,296.66 433,712.33 436,302.05 421,261.03
1999 2000 2001 2002 2003 2004 2005 2006 2007 2008
kt CO 2 eq kt CO 2 eq kt CO2 eq kt CO2 eq kt CO2 eq kt CO2 eq kt CO2 eq kt CO2 eq kt CO2 eq kt CO2 eq
1. Energy 318,342.47 305,878.26 307,388.70 309,244.72 321,604.00 320,256.95 320,170.93 332,561.58 329,315.73 318,755.30
2. Industrial Processes 39,579.02 42,278.99 44,643.63 45,227.19 49,341.70 51,592.99 52,395.40 56,409.52 62,673.19 56,147.47
3. Solvent and Other Product Use 358.56 354.89 351.51 348.22 345.45 342.97 340.38 338.52 336.35 334.73
4. Agriculture 41,478.91 37,372.46 37,858.60 38,106.22 34,910.65 34,472.41 33,809.10 33,662.41 33,076.44 35,176.48
5. Land Use, Land-Use Change and Forestryb -63,907.45 -50,840.12 -39,861.54 -39,876.58 -59,108.75 -40,419.33 -38,440.09 -41,419.15 -53,919.11 -10,417.35
6. Waste 9,773.10 9,865.17 10,000.76 10,172.01 10,288.72 10,473.85 10,580.85 10,740.29 10,900.35 10,847.05
7. Other NA NA NA NA NA NA NA NA NA NA
Total (including LULUCF) 345,624.61 344,909.64 360,381.65 363,221.78 357,381.77 376,719.85 378,856.57 392,293.17 382,382.94 410,843.68
Note: All footnotes for this table are given on sheet 3.
GREENHOUSE GAS EMISSIONS
GREENHOUSE GAS SOURCE AND SINK CATEGORIES

Table 1 UKR_BR1_v1.0
Emission trends: summary (1) Source: Submission 2014 v1.1, UKRAINE
(Sheet 3 of 3) CRF: UKR_CRF__ v1.1
2009 2010 2011 Change from
base to latest
reported year
kt CO 2 eq kt CO 2 eq kt CO2 eq (%)
CO2 emissions including net CO2 from LULUCF 256,336.56 251,713.87 298,172.52 -54.07
CO2 emissions excluding net CO2 from LULUCF 274,633.14 289,707.97 305,463.58 -57.51
CH4 emissions including CH4 from LULUCF 63,010.39 63,882.49 63,330.77 -58.24
CH4 emissions excluding CH4 from LULUCF 62,995.26 63,859.24 63,329.94 -58.24
N2O emissions including N2O from LULUCF 27,049.56 28,968.74 32,057.00 -45.77
N2O emissions excluding N2O from LULUCF 27,035.90 28,952.98 32,056.52 -45.76
HFCs 586.03 658.05 717.42 100.00
PFCs 46.49 22.98 IE, NA, NO -100.00
SF6 9.81 10.18 8.82 108,429.41
Total (including LULUCF) 347,038.84 345,256.31 394,286.53 -54.16
Total (excluding LULUCF) 365,306.64 383,211.39 401,576.28 -56.81
2009 2010 2011 Change from
base to latest
reported year
kt CO 2 eq kt CO 2 eq kt CO2 eq (%)
1. Energy 278,484.40 290,857.51 305,225.35 -58.50
2. Industrial Processes 42,095.19 46,480.58 48,783.74 -38.90
3. Solvent and Other Product Use 333.42 332.01 330.77 -12.22
4. Agriculture 33,484.87 34,507.43 36,190.30 -65.07
5. Land Use, Land-Use Change and Forestryb -18,267.80 -37,955.08 -7,289.75 -89.55
6. Waste 10,908.77 11,033.86 11,046.12 5.03
7. Other NA NA NA 0.00
Total (including LULUCF) 347,038.84 345,256.31 394,286.53 -54.16
Notes :
(3) 1 kt CO2 eq equals 1 Gg CO2 eq.
Custom Footnotes
a The column “Base year” should be filled in only by those Parties with economies in transition that use a base year different from 1990 in
accordance with the relevant decisions of the Conference of the Parties. For these Parties, this different base year is used to calculate the
percentage change in the final column of this table.
b Includes net CO2, CH4 and N2O from LULUCF.
GREENHOUSE GAS EMISSIONS
(1) Further detailed information could be found in the common reporting format tables of the Party’s greenhouse gas inventory, namely
“Emission trends (CO2)”, “Emission trends (CH4)”, “Emission trends (N2O)” and “Emission trends (HFCs, PFCs and SF6)”, which is included
in an annex to this biennial report.
Abbreviation: LULUCF = land use, land-use change and forestry.
(2) 2011 is the latest reported inventory year.
GREENHOUSE GAS SOURCE AND SINK CATEGORIES

Table 1 (a) UKR_BR1_v1.0
Emission trends (CO2) Source: Submission 2014 v1.1, UKRAINE
(Sheet 1 of 3) CRF: UKR_CRF__ v1.1
Base yeara 1991 1992 1993 1994 1995 1996 1997 1998
kt kt kt kt kt kt kt kt kt
1. Energy 644,641.30 556,511.17 480,617.26 416,922.32 365,471.95 327,008.95 293,207.70 274,733.43 273,179.10
A. Fuel Combustion (Sectoral Approach) 643,745.41 555,735.40 479,890.23 416,301.07 364,916.53 326,473.28 292,680.57 274,193.03 272,637.05
1. Energy Industries 271,267.11 231,768.82 198,275.00 170,574.45 148,431.64 131,964.35 115,135.67 107,455.22 100,985.85
2. Manufacturing Industries and Construction 191,007.54 162,361.69 138,228.91 118,388.90 102,610.19 90,912.98 81,085.37 75,167.78 72,689.55
3. Transport 89,956.53 78,671.58 68,281.40 59,073.11 51,234.21 44,980.79 39,705.19 36,419.90 40,903.04
4. Other Sectors 91,409.20 81,988.25 73,544.57 66,259.66 60,307.00 56,007.55 53,843.17 51,999.66 54,392.88
5. Other 105.03 945.06 1,560.35 2,004.95 2,333.50 2,607.61 2,911.18 3,150.47 3,665.73
B. Fugitive Emissions from Fuels 895.89 775.77 727.03 621.25 555.41 535.67 527.13 540.40 542.05
1. Solid Fuels 458.73 377.99 367.08 280.38 224.80 212.26 202.62 217.31 239.50
2. Oil and Natural Gas 437.15 397.78 359.96 340.87 330.61 323.41 324.50 323.09 302.55
2. Industrial Processes 74,310.18 61,700.45 61,589.04 47,891.32 37,493.27 33,347.22 31,192.04 34,970.12 35,422.03
A. Mineral Products 24,539.01 19,821.37 19,717.01 15,266.44 12,594.86 9,935.74 8,067.24 8,989.25 9,319.42
B. Chemical Industry 6,807.98 6,474.27 6,779.10 5,742.92 4,887.54 5,429.90 5,466.52 5,348.52 5,231.75
C. Metal Production 42,963.19 35,404.81 35,092.93 26,881.96 20,010.87 17,981.58 17,658.28 20,632.34 20,870.85
D. Other Production NO NO NO NO NO NO NO NO NO
E. Production of Halocarbons and SF6
F. Consumption of Halocarbons and SF6
G. Other NA NA NA NA NA NA NA NA NA
3. Solvent and Other Product Use NA, NE NA, NE NA, NE NA, NE NA, NE NA, NE NA, NE NA, NE NA, NE
4. Agriculture
A. Enteric Fermentation
B. Manure Management
C. Rice Cultivation
D. Agricultural Soils
E. Prescribed Burning of Savannas
F. Field Burning of Agricultural Residues
G. Other
5. Land Use, Land-Use Change and Forestry -69,757.49 -77,834.80 -65,116.05 -49,530.66 -62,261.32 -48,785.25 -55,124.70 -34,833.62 -50,643.74
A. Forest Land -57,199.58 -59,744.52 -59,804.55 -59,209.39 -59,935.76 -60,653.04 -58,568.03 -58,915.41 -61,898.36
B. Cropland -13,191.97 -19,137.65 -6,801.50 8,593.83 -3,481.07 10,790.20 2,332.26 22,907.11 9,002.24
C. Grassland 607.04 1,014.99 1,181.87 1,057.81 1,130.87 1,053.30 1,021.70 1,154.56 1,236.64
D. Wetlands 23.56 23.95 26.19 26.09 24.05 22.33 24.66 18.63 118.70
E. Settlements 3.00 7.29 244.08 0.87 0.53 0.57 47.73 NO 897.05
F. Other Land 0.46 1.13 37.87 0.12 0.05 1.40 16.99 1.48 NO
G. Other NO NO NO NO NO NO NO NO NO
6. Waste IE, NA IE, NA IE, NA IE, NA IE, NA IE, NA IE, NA IE, NA IE, NA
A. Solid Waste Disposal on Land NA NA NA NA NA NA NA NA NA
B. Waste-water Handling
C. Waste Incineration IE IE IE IE IE IE IE IE IE
D. Other NA NA NA NA NA NA NA NA NA
7. Other (as specified in the summary table in CRF) NA NA NA NA NA NA NA NA NA
Total CO2 emissions including net CO2 from LULUCF 649,193.99 540,376.82 477,090.25 415,282.97 340,703.90 311,570.92 269,275.04 274,869.92 257,957.38
Total CO2 emissions excluding net CO2 from LULUCF 718,951.47 618,211.62 542,206.30 464,813.63 402,965.22 360,356.18 324,399.74 309,703.55 308,601.12
Memo Items:
International Bunkers 5,896.15 2,044.68 1,721.38 1,398.07 1,074.77 751.47 428.16 415.39 859.98
Aviation 2,367.98 2,044.68 1,721.38 1,398.07 1,074.77 751.47 428.16 415.39 396.70
Marine 3,528.17 NA, NE, NO NA, NE, NO NA, NE, NO NA, NE, NO NA, NE, NO NA, NE, NO NA, NE, NO 463.28
Multilateral Operations NE NE NE NE NE NE NE NE NE
CO2 Emissions from Biomass 4,107.16 3,466.36 2,923.84 2,475.31 2,115.46 1,843.28 1,770.60 1,961.97 2,752.29
Note: All footnotes for this table are given on sheet 3.
GREENHOUSE GAS SOURCE AND SINK CATEGORIES

Table 1 (a) UKR_BR1_v1.0
Emission trends (CO2) Source: Submission 2014 v1.1, UKRAINE
(Sheet 2 of 3) CRF: UKR_CRF__ v1.1
1999 2000 2001 2002 2003 2004 2005 2006 2007 2008
kt kt kt kt kt kt kt kt kt kt
1. Energy 265,505.80 254,320.88 257,250.60 260,336.02 272,160.20 271,028.71 272,064.67 284,945.21 282,842.57 273,036.40
A. Fuel Combustion (Sectoral Approach) 265,018.36 253,810.18 256,733.45 259,856.31 271,547.19 270,325.76 271,500.22 284,405.06 282,174.28 272,306.60
1. Energy Industries 103,695.43 96,731.37 99,861.55 99,530.06 104,995.62 98,330.40 99,515.57 107,242.15 106,623.44 105,644.17
2. Manufacturing Industries and Construction 72,873.34 74,374.74 72,227.26 70,941.41 74,663.33 75,808.30 75,771.78 79,194.06 81,904.91 73,103.49
3. Transport 35,244.40 34,349.39 35,808.60 39,611.77 40,498.98 43,739.71 43,827.44 45,115.63 46,148.15 45,980.40
4. Other Sectors 49,324.37 45,147.16 45,809.91 48,092.39 49,688.84 50,869.94 50,887.91 51,097.94 45,950.77 46,320.99
5. Other 3,880.82 3,207.51 3,026.13 1,680.68 1,700.42 1,577.42 1,497.52 1,755.27 1,547.00 1,257.55
B. Fugitive Emissions from Fuels 487.45 510.71 517.15 479.71 613.01 702.94 564.45 540.15 668.30 729.80
1. Solid Fuels 186.56 214.20 219.59 180.19 295.34 364.33 212.57 176.83 307.07 377.40
2. Oil and Natural Gas 300.88 296.51 297.56 299.52 317.67 338.62 351.88 363.32 361.22 352.40
2. Industrial Processes 36,943.37 39,220.80 41,628.13 41,767.36 45,704.92 48,143.78 48,537.90 52,412.90 57,657.65 51,504.25
A. Mineral Products 9,334.23 9,521.30 10,597.40 10,766.49 11,935.32 13,191.51 14,037.34 14,348.85 15,676.96 14,327.28
B. Chemical Industry 5,894.06 5,684.98 5,910.71 5,959.62 6,392.24 6,128.63 6,554.88 6,575.06 6,397.33 6,156.88
C. Metal Production 21,715.08 24,014.52 25,120.02 25,041.25 27,377.35 28,823.63 27,945.68 31,488.99 35,583.36 31,020.08
D. Other Production NO NO NO NO NO NO NO NO NO NO
E. Production of Halocarbons and SF6
F. Consumption of Halocarbons and SF6
G. Other NA NA NA NA NA NA NA NA NA NA
3. Solvent and Other Product Use NA, NE NA, NE NA, NE NA, NE NA, NE NA, NE NA, NE NA, NE NA, NE NA, NE
4. Agriculture
A. Enteric Fermentation
B. Manure Management
C. Rice Cultivation
D. Agricultural Soils
E. Prescribed Burning of Savannas
F. Field Burning of Agricultural Residues
G. Other
5. Land Use, Land-Use Change and Forestry -63,940.09 -50,853.97 -39,888.88 -39,900.18 -59,125.44 -40,430.04 -38,456.31 -41,440.09 -54,061.51 -10,468.97
A. Forest Land -61,330.75 -60,247.07 -59,581.92 -58,494.46 -57,345.67 -56,087.30 -56,207.24 -55,673.70 -53,481.36 -55,907.33
B. Cropland -3,773.68 8,077.23 18,241.51 17,285.38 -3,408.29 13,592.92 15,621.60 11,920.58 -2,937.94 42,472.67
C. Grassland 1,153.61 1,303.29 1,440.67 1,286.90 1,615.40 2,043.56 2,118.95 2,303.09 2,337.80 2,630.61
D. Wetlands 10.15 8.83 7.78 6.38 9.85 6.60 7.14 5.94 10.51 5.94
E. Settlements 0.57 NO 1.53 15.62 NO 10.13 3.25 3.03 3.45 329.14
F. Other Land 0.01 3.74 1.56 NO 3.27 4.05 NO 0.96 6.03 NO
G. Other NO NO NO NO NO NO NO NO NO NO
6. Waste IE, NA IE, NA IE, NA IE, NA IE, NA IE, NA IE, NA IE, NA IE, NA IE, NA
A. Solid Waste Disposal on Land NA NA NA NA NA NA NA NA NA NA
B. Waste-water Handling
C. Waste Incineration IE IE IE IE IE IE IE IE IE IE
D. Other NA NA NA NA NA NA NA NA NA NA
7. Other (as specified in the summary table in CRF) NA NA NA NA NA NA NA NA NA NA
Total CO2 emissions including net CO2 from LULUCF 238,509.09 242,687.71 258,989.84 262,203.21 258,739.68 278,742.45 282,146.26 295,918.02 286,438.71 314,071.67
Total CO2 emissions excluding net CO2 from LULUCF 302,449.17 293,541.68 298,878.73 302,103.38 317,865.12 319,172.49 320,602.57 337,358.11 340,500.23 324,540.64
Memo Items:
International Bunkers 734.08 697.19 724.85 622.27 628.66 761.49 847.71 958.14 993.79 1,042.21
Aviation 363.42 360.14 361.75 407.28 475.52 576.50 638.02 752.89 854.03 933.64
Marine 370.66 337.05 363.10 214.99 153.15 184.99 209.69 205.24 139.77 108.57
Multilateral Operations NE NE NE NE NE NE NE NE 0.01 0.00
CO2 Emissions from Biomass 2,670.25 2,961.37 3,717.79 3,825.87 4,028.37 3,556.32 3,405.98 3,580.50 3,610.41 3,644.84
Note: All footnotes for this table are given on sheet 3.
GREENHOUSE GAS SOURCE AND SINK CATEGORIES

Table 1(a) UKR_BR1_v1.0
Emission trends (CO2) Source: Submission 2014 v1.1, UKRAINE
(Sheet 3 of 3) CRF: UKR_CRF__ v1.1
2009 2010 2011 Change
from base to
latest
reported
yearkt kt kt %
1. Energy 235,914.08 247,387.08 261,674.31 -59.41
A. Fuel Combustion (Sectoral Approach) 235,212.97 246,614.68 260,886.69 -59.47
1. Energy Industries 96,370.73 102,214.54 111,310.92 -58.97
2. Manufacturing Industries and Construction 54,422.45 58,777.21 65,106.46 -65.91
3. Transport 40,103.83 39,462.80 36,230.51 -59.72
4. Other Sectors 43,424.55 45,160.83 47,069.85 -48.51
5. Other 891.40 999.30 1,168.96 1,013.02
B. Fugitive Emissions from Fuels 701.11 772.40 787.62 -12.09
1. Solid Fuels 367.82 472.75 546.20 19.07
2. Oil and Natural Gas 333.29 299.65 241.42 -44.78
2. Industrial Processes 38,719.07 42,320.89 43,788.79 -41.07
A. Mineral Products 9,031.51 9,322.52 10,982.80 -55.24
B. Chemical Industry 3,851.23 5,239.74 6,824.69 0.25
C. Metal Production 25,836.33 27,758.63 25,981.30 -39.53
D. Other Production NO NO NO 0.00
E. Production of Halocarbons and SF6
F. Consumption of Halocarbons and SF6
G. Other NA NA NA 0.00
3. Solvent and Other Product Use NA, NE NA, NE NA, NE 0.00
4. Agriculture
A. Enteric Fermentation
B. Manure Management
C. Rice Cultivation
D. Agricultural Soils
E. Prescribed Burning of Savannas
F. Field Burning of Agricultural Residues
G. Other
5. Land Use, Land-Use Change and Forestry -18,296.58 -37,994.09 -7,291.06 -89.55
A. Forest Land -57,723.04 -55,401.91 -61,892.32 8.20
B. Cropland 36,436.02 14,411.37 51,340.40 -489.18
C. Grassland 2,983.24 2,990.56 3,248.66 435.16
D. Wetlands 5.79 5.82 5.79 -75.41
E. Settlements 1.31 0.06 6.40 113.68
F. Other Land 0.10 0.01 NO -100.00
G. Other NO NO NO 0.00
6. Waste IE, NA IE, NA 0.48 100.00
A. Solid Waste Disposal on Land NA NA NA 0.00
B. Waste-water Handling
C. Waste Incineration IE IE 0.48 100.00
D. Other NA NA NA 0.00
7. Other (as specified in the summary table in CRF) NA NA NA 0.00
Total CO2 emissions including net CO2 from LULUCF 256,336.56 251,713.87 298,172.52 -54.07
Total CO2 emissions excluding net CO2 from LULUCF 274,633.14 289,707.97 305,463.58 -57.51
Memo Items:
International Bunkers 893.99 1,015.03 879.81 -85.08
Aviation 819.19 892.19 793.44 -66.49
Marine 74.81 122.83 86.36 -97.55
Multilateral Operations 0.00 0.00 NO 0.00
CO2 Emissions from Biomass 3,993.34 3,835.78 3,961.44 -3.55
Abbreviations : CRF = common reporting format, LULUCF = land use, land-use change and forestry.
Custom Footnotes
GREENHOUSE GAS SOURCE AND SINK CATEGORIES
a The column “Base year” should be filled in only by those Parties with economies in transition that use a base
year different from 1990 in accordance with the relevant decisions of the Conference of the Parties. For these
Parties, this different base year is used to calculate the percentage change in the final column of this table.
b Fill in net emissions/removals as reported in CRF table Summary 1.A of the latest reported inventory year.
For the purposes of reporting, the signs for removals are always negative (-) and for emissions positive (+).

Table 1(b) UKR_BR1_v1.0
Emission trends (CH4) Source: Submission 2014 v1.1, UKRAINE
(Sheet 1 of 3) CRF: UKR_CRF__ v1.1
Base yeara 1991 1992 1993 1994 1995 1996 1997 1998
kt kt kt kt kt kt kt kt kt
1. Energy 4,229.99 3,989.32 3,728.04 3,453.00 3,118.05 2,767.40 2,675.17 2,574.16 2,465.38
A. Fuel Combustion (Sectoral Approach) 209.09 173.98 143.93 118.81 98.32 82.29 63.98 56.76 50.46
1. Energy Industries 5.54 4.43 3.55 2.87 2.36 2.00 1.69 1.52 1.41
2. Manufacturing Industries and Construction 15.83 13.42 11.36 9.64 8.25 7.19 6.18 5.63 5.21
3. Transport 27.85 23.85 20.26 17.12 14.47 12.34 10.70 9.32 9.88
4. Other Sectors 159.83 132.19 108.64 89.02 73.07 60.57 45.20 40.06 33.70
5. Other 0.05 0.09 0.13 0.15 0.17 0.18 0.20 0.22 0.26
B. Fugitive Emissions from Fuels 4,020.90 3,815.34 3,584.11 3,334.20 3,019.73 2,685.11 2,611.19 2,517.40 2,414.92
1. Solid Fuels 2,478.47 2,388.13 2,212.32 2,037.73 1,805.53 1,522.05 1,428.45 1,375.04 1,353.69
2. Oil and Natural Gas 1,542.43 1,427.21 1,371.79 1,296.47 1,214.20 1,163.06 1,182.74 1,142.36 1,061.23
2. Industrial Processes 62.69 51.42 48.94 37.13 28.45 25.38 24.54 27.91 28.22
A. Mineral Products NE NE NE NE NE NE NE NE NE
B. Chemical Industry 22.26 18.45 17.12 12.73 10.29 9.18 8.49 9.35 9.38
C. Metal Production 40.43 32.97 31.82 24.40 18.16 16.20 16.05 18.55 18.84
D. Other Production
E. Production of Halocarbons and SF6
F. Consumption of Halocarbons and SF6
G. Other NA NA NA NA NA NA NA NA NA
3. Solvent and Other Product Use
4. Agriculture 2,507.56 2,427.16 2,181.99 1,997.92 1,778.11 1,505.09 1,272.26 1,045.75 963.18
A. Enteric Fermentation 1,658.42 1,619.78 1,454.77 1,399.82 1,323.06 1,178.81 1,049.68 891.97 859.24
B. Manure Management 840.84 800.51 719.94 593.42 450.56 321.88 217.98 149.28 99.80
C. Rice Cultivation 8.31 6.87 7.29 4.68 4.48 4.40 4.60 4.50 4.14
D. Agricultural Soils NA, NE NA, NE NA, NE NA, NE NA, NE NA, NE NA, NE NA, NE NA, NE
E. Prescribed Burning of Savannas NO NO NO NO NO NO NO NO NO
F. Field Burning of Agricultural Residues NO NO NO NO NO NO NO NO NO
G. Other NA NA NA NA NA NA NA NA NA
5. Land Use, Land-Use Change and Forestry 0.40 0.23 0.58 0.79 2.25 0.68 1.80 0.13 0.66
A. Forest Land 0.40 0.23 0.58 0.79 2.25 0.68 1.80 0.13 0.66
B. Cropland NA, NO NA, NO NA, NO NA, NO NA, NO NA, NO NA, NO NA, NO NA, NO
C. Grassland NO NO NO NO NO NO NO NO NO
D. Wetlands NO NO NO NO NO NO NO NO NO
E. Settlements NO NO NO NO NO NO NO NO NO
F. Other Land NO NO NO NO NO NO NO NO NO
G. Other NO NO NO NO NO NO NO NO NO
6. Waste 420.75 426.19 428.52 426.57 418.92 414.68 411.85 411.77 412.71
A. Solid Waste Disposal on Land 275.61 285.78 293.00 297.39 298.97 297.84 297.81 298.72 300.50
B. Waste-water Handling 145.14 140.41 135.51 129.18 119.95 116.84 114.04 113.05 112.22
C. Waste Incineration NE NE NE NE NE NE NE NE NE
D. Other NO NO NO NO NO NO NO NO NO
7. Other (as specified in the summary table in CRF) NA NA NA NA NA NA NA NA NA
Total CH4 emissions including CH4 from LULUCF 7,221.39 6,894.31 6,388.07 5,915.41 5,345.78 4,713.22 4,385.60 4,059.70 3,870.16
Total CH4 emissions excluding CH4 from LULUCF 7,220.99 6,894.08 6,387.49 5,914.62 5,343.53 4,712.54 4,383.81 4,059.58 3,869.50
Memo Items:
International Bunkers 0.59 0.30 0.26 0.21 0.16 0.11 0.06 0.06 0.08
Aviation 0.35 0.30 0.26 0.21 0.16 0.11 0.06 0.06 0.05
Marine 0.24 NA, NE, NO NA, NE, NO NA, NE, NO NA, NE, NO NA, NE, NO NA, NE, NO NA, NE, NO 0.03
Multilateral Operations NE NE NE NE NE NE NE NE NE
CO2 Emissions from Biomass
Note: All footnotes for this table are given on sheet 3.
GREENHOUSE GAS SOURCE AND SINK CATEGORIES

Table 1(b) UKR_BR1_v1.0
Emission trends (CH4) Source: Submission 2014 v1.1, UKRAINE
(Sheet 2 of 3) CRF: UKR_CRF__ v1.1
1999 2000 2001 2002 2003 2004 2005 2006 2007 2008
kt kt kt kt kt kt kt kt kt kt
1. Energy 2,480.37 2,420.29 2,350.20 2,288.60 2,312.73 2,302.99 2,248.62 2,221.00 2,165.11 2,130.55
A. Fuel Combustion (Sectoral Approach) 46.77 42.39 44.27 46.77 50.71 52.56 50.83 51.72 49.24 45.34
1. Energy Industries 1.42 1.28 1.40 1.29 1.40 1.36 1.40 1.49 1.45 1.43
2. Manufacturing Industries and Construction 5.43 5.70 5.66 5.67 5.99 6.11 6.05 6.39 6.84 6.10
3. Transport 8.94 9.54 12.05 14.54 16.44 18.40 20.67 20.89 21.44 19.65
4. Other Sectors 30.70 25.62 24.92 25.11 26.72 26.52 22.57 22.79 19.36 18.04
5. Other 0.28 0.26 0.23 0.16 0.16 0.16 0.13 0.17 0.15 0.12
B. Fugitive Emissions from Fuels 2,433.61 2,377.90 2,305.93 2,241.83 2,262.02 2,250.43 2,197.79 2,169.27 2,115.87 2,085.21
1. Solid Fuels 1,355.44 1,309.70 1,256.23 1,190.91 1,135.76 1,103.46 1,026.35 1,000.10 962.80 963.10
2. Oil and Natural Gas 1,078.17 1,068.20 1,049.70 1,050.92 1,126.26 1,146.97 1,171.44 1,169.17 1,153.06 1,122.10
2. Industrial Processes 30.39 33.69 34.62 35.49 38.72 40.83 39.21 41.30 44.56 39.58
A. Mineral Products NE NE NE NE NE NE NE NE NE NE
B. Chemical Industry 9.68 10.56 10.87 10.62 12.14 12.95 11.54 11.66 12.47 11.69
C. Metal Production 20.71 23.13 23.74 24.87 26.58 27.88 27.67 29.64 32.08 27.89
D. Other Production
E. Production of Halocarbons and SF6
F. Consumption of Halocarbons and SF6
G. Other NA NA NA NA NA NA NA NA NA NA
3. Solvent and Other Product Use
4. Agriculture 832.44 727.95 732.71 738.27 660.93 611.53 606.41 574.68 553.77 526.72
A. Enteric Fermentation 747.83 663.16 675.13 676.59 601.48 560.60 553.44 513.35 490.45 462.49
B. Manure Management 80.23 59.75 53.82 57.90 54.96 46.68 48.68 57.00 59.10 60.27
C. Rice Cultivation 4.38 5.04 3.76 3.78 4.48 4.26 4.28 4.32 4.22 3.96
D. Agricultural Soils NA, NE NA, NE NA, NE NA, NE NA, NE NA, NE NA, NE NA, NE NA, NE NA, NE
E. Prescribed Burning of Savannas NO NO NO NO NO NO NO NO NO NO
F. Field Burning of Agricultural Residues NO NO NO NO NO NO NO NO NO NO
G. Other NA NA NA NA NA NA NA NA NA NA
5. Land Use, Land-Use Change and Forestry 0.88 0.16 0.67 0.53 0.27 0.04 0.25 0.43 5.03 1.60
A. Forest Land 0.88 0.16 0.67 0.53 0.27 0.04 0.25 0.43 5.03 1.60
B. Cropland NA, NO NA, NO NA, NO NA, NO NA, NO NA, NO NA, NO NA, NO NA, NO NA, NO
C. Grassland NO NO NO NO NO NO NO NO NO NO
D. Wetlands NO NO NO NO NO NO NO NO NO NO
E. Settlements NO NO NO NO NO NO NO NO NO NO
F. Other Land NO NO NO NO NO NO NO NO NO NO
G. Other NO NO NO NO NO NO NO NO NO NO
6. Waste 414.54 418.34 423.82 430.06 436.66 444.05 449.55 456.60 464.75 462.05
A. Solid Waste Disposal on Land 302.99 306.08 309.64 314.94 319.52 323.51 326.97 333.44 336.29 339.78
B. Waste-water Handling 111.55 112.27 114.19 115.12 117.14 120.55 122.58 123.11 128.45 122.27
C. Waste Incineration NE NE NE NE NE NE NE NE NE NE
D. Other NO NO NO NO NO NO NO 0.05 0.00 0.00
7. Other (as specified in the summary table in CRF) NA NA NA NA NA NA NA NA NA NA
Total CH4 emissions including CH4 from LULUCF 3,758.62 3,600.44 3,542.02 3,492.95 3,449.31 3,399.44 3,344.03 3,294.00 3,233.21 3,160.51
Total CH4 emissions excluding CH4 from LULUCF 3,757.74 3,600.28 3,541.34 3,492.42 3,449.04 3,399.40 3,343.78 3,293.58 3,228.18 3,158.91
Memo Items:
International Bunkers 0.07 0.06 0.06 0.05 0.05 0.06 0.06 0.06 0.05 0.04
Aviation 0.04 0.04 0.03 0.04 0.04 0.05 0.04 0.04 0.05 0.03
Marine 0.03 0.02 0.02 0.01 0.01 0.01 0.01 0.01 0.01 0.01
Multilateral Operations NE NE NE NE NE NE NE NE 0.00 0.00
CO2 Emissions from Biomass
Note: All footnotes for this table are given on sheet 3.
GREENHOUSE GAS SOURCE AND SINK CATEGORIES

Table 1(b) UKR_BR1_v1.0
Emission trends (CH4) Source: Submission 2014 v1.1, UKRAINE
(Sheet 3 of 3) CRF: UKR_CRF__ v1.1
2009 2010 2011 Change from
base to latest
reported
year
kt kt kt %
1. Energy 1,985.61 2,027.95 2,009.55 -52.49
A. Fuel Combustion (Sectoral Approach) 38.98 37.65 33.79 -83.84
1. Energy Industries 1.38 1.39 1.62 -70.77
2. Manufacturing Industries and Construction 4.55 4.95 6.74 -57.41
3. Transport 15.55 14.11 6.89 -75.27
4. Other Sectors 17.43 17.11 18.33 -88.53
5. Other 0.08 0.09 0.21 367.07
B. Fugitive Emissions from Fuels 1,946.64 1,990.31 1,975.76 -50.86
1. Solid Fuels 944.18 935.93 929.07 -62.51
2. Oil and Natural Gas 1,002.46 1,054.38 1,046.69 -32.14
2. Industrial Processes 32.80 35.26 37.27 -40.55
A. Mineral Products NE NE NE 0.00
B. Chemical Industry 9.69 10.63 11.28 -49.31
C. Metal Production 23.11 24.63 25.99 -35.73
D. Other Production
E. Production of Halocarbons and SF6
F. Consumption of Halocarbons and SF6
G. Other NA NA NA 0.00
3. Solvent and Other Product Use
4. Agriculture 514.81 505.23 495.87 -80.23
A. Enteric Fermentation 446.16 427.78 417.24 -74.84
B. Manure Management 63.76 71.59 72.71 -91.35
C. Rice Cultivation 4.90 5.86 5.92 -28.76
D. Agricultural Soils NA, NE NA, NE NA, NE 0.00
E. Prescribed Burning of Savannas NO NO NO 0.00
F. Field Burning of Agricultural Residues NO NO NO 0.00
G. Other NA NA NA 0.00
5. Land Use, Land-Use Change and Forestry 0.72 1.11 0.04 -90.17
A. Forest Land 0.72 1.11 0.04 -90.17
B. Cropland NA, NO NA, NO NA, NO 0.00
C. Grassland NO NO NO 0.00
D. Wetlands NO NO NO 0.00
E. Settlements NO NO NO 0.00
F. Other Land NO NO NO 0.00
G. Other NO NO NO 0.00
6. Waste 466.54 472.47 473.03 12.42
A. Solid Waste Disposal on Land 344.03 347.98 346.83 25.84
B. Waste-water Handling 122.51 124.49 126.19 -13.06
C. Waste Incineration NE NE NE 0.00
D. Other 0.00 0.00 0.00 100.00
7. Other (as specified in the summary table in CRF) NA NA NA 0.00
Total CH4 emissions including CH4 from LULUCF 3,000.49 3,042.02 3,015.75 -58.24
Total CH4 emissions excluding CH4 from LULUCF 2,999.77 3,040.92 3,015.71 -58.24
Memo Items:
International Bunkers 0.03 0.03 0.01 -97.52
Aviation 0.02 0.02 0.01 -97.51
Marine 0.01 0.01 0.01 -97.55
Multilateral Operations 0.00 0.00 NO 0.00
CO2 Emissions from Biomass
Custom Footnotes
GREENHOUSE GAS SOURCE AND SINK CATEGORIES
Abbreviations : CRF = common reporting format, LULUCF = land use, land-use change and forestry.
a The column “Base year” should be filled in only by those Parties with economies in transition
that use a base year different from 1990 in accordance with the relevant decisions of the
Conference of the Parties. For these Parties, this different base year is used to calculate the
percentage change in the final column of this table.

Table 1(c) UKR_BR1_v1.0
Emission trends (N2O) Source: Submission 2014 v1.1, UKRAINE
(Sheet 1 of 3) CRF: UKR_CRF__ v1.1
Base yeara 1991 1992 1993 1994 1995 1996 1997 1998
kt kt kt kt kt kt kt kt kt
1. Energy 6.73 5.78 4.96 4.28 3.72 3.30 2.75 2.61 2.54
A. Fuel Combustion (Sectoral Approach) 6.72 5.78 4.96 4.27 3.72 3.29 2.74 2.61 2.54
1. Energy Industries 2.15 1.90 1.68 1.50 1.36 1.26 1.06 1.07 0.99
2. Manufacturing Industries and Construction 1.59 1.34 1.13 0.95 0.81 0.71 0.57 0.53 0.48
3. Transport 1.88 1.61 1.38 1.17 1.00 0.86 0.73 0.65 0.73
4. Other Sectors 1.10 0.92 0.76 0.64 0.53 0.45 0.36 0.34 0.32
5. Other 0.00 0.01 0.01 0.01 0.02 0.02 0.02 0.02 0.02
B. Fugitive Emissions from Fuels 0.00 0.00 0.00 0.00 0.00 0.00 0.00 0.00 0.00
1. Solid Fuels NA, NE NA, NE NA, NE NA, NE NA, NE NA, NE NA, NE NA, NE NA, NE
2. Oil and Natural Gas 0.00 0.00 0.00 0.00 0.00 0.00 0.00 0.00 0.00
2. Industrial Processes 12.94 11.51 9.77 8.15 6.74 5.31 6.38 7.00 5.77
A. Mineral Products NE NE NE NE NE NE NE NE NE
B. Chemical Industry 12.94 11.51 9.77 8.15 6.74 5.31 6.38 7.00 5.77
C. Metal Production NE NE NE NE NE NE NE NE NE
D. Other Production
E. Production of Halocarbons and SF6
F. Consumption of Halocarbons and SF6
G. Other NA NA NA NA NA NA NA NA NA
3. Solvent and Other Product Use 1.22 1.22 1.22 1.22 1.21 1.20 1.19 1.18 1.17
4. Agriculture 164.33 154.13 143.87 133.24 119.84 112.46 95.51 91.92 82.93
A. Enteric Fermentation
B. Manure Management 27.76 27.27 27.74 25.83 24.74 23.85 21.33 18.33 16.88
C. Rice Cultivation
D. Agricultural Soils 129.89 120.39 109.78 101.70 89.87 83.78 69.98 70.07 62.87
E. Prescribed Burning of Savannas NO NO NO NO NO NO NO NO NO
F. Field Burning of Agricultural Residues NO NO NO NO NO NO NO NO NO
G. Other 6.68 6.46 6.36 5.72 5.23 4.84 4.20 3.52 3.18
5. Land Use, Land-Use Change and Forestry 0.04 0.04 0.04 0.05 0.07 0.04 0.06 0.03 0.04
A. Forest Land 0.03 0.03 0.04 0.04 0.07 0.04 0.06 0.03 0.04
B. Cropland NA, NO NA, NO NA, NO NA, NO NA, NO NA, NO NA, NO NA, NO NA, NO
C. Grassland NO NO NO NO NO NO NO NO NO
D. Wetlands 0.01 0.01 0.01 0.01 0.01 0.00 0.00 0.00 0.00
E. Settlements NO NO NO NO NO NO NO NO NO
F. Other Land NO NO NO NO NO NO NO NO NO
G. Other NO NO NO NO NO NO NO NO NO
6. Waste 5.42 5.06 4.68 4.45 4.11 3.84 3.68 3.60 3.59
A. Solid Waste Disposal on Land
B. Waste-water Handling 5.42 5.06 4.68 4.45 4.11 3.84 3.68 3.60 3.59
C. Waste Incineration IE IE IE IE IE IE IE IE IE
D. Other NO NO NO NO NO NO NO NO NO
7. Other (as specified in the summary table in CRF) NA NA NA NA NA NA NA NA NA
Total N2O emissions including N2O from LULUCF 190.68 177.73 164.55 151.39 135.69 126.15 109.56 106.34 96.05
Total N2O emissions excluding N2O from LULUCF 190.64 177.69 164.51 151.34 135.62 126.11 109.50 106.31 96.01
Memo Items:
International Bunkers 0.13 0.09 0.07 0.06 0.05 0.03 0.02 0.02 0.02
Aviation 0.10 0.09 0.07 0.06 0.05 0.03 0.02 0.02 0.02
Marine 0.03 NA, NE, NO NA, NE, NO NA, NE, NO NA, NE, NO NA, NE, NO NA, NE, NO NA, NE, NO 0.00
Multilateral Operations NE NE NE NE NE NE NE NE NE
CO2 Emissions from Biomass
Note: All footnotes for this table are given on sheet 3.
GREENHOUSE GAS SOURCE AND SINK CATEGORIES

Table 1(c) UKR_BR1_v1.0
Emission trends (N2O) Source: Submission 2014 v1.1, UKRAINE
(Sheet 2 of 3) CRF: UKR_CRF__ v1.1
1999 2000 2001 2002 2003 2004 2005 2006 2007 2008
kt kt kt kt kt kt kt kt kt kt
1. Energy 2.42 2.36 2.53 2.74 2.83 2.79 2.86 3.15 3.24 3.15
A. Fuel Combustion (Sectoral Approach) 2.41 2.36 2.53 2.73 2.82 2.79 2.85 3.14 3.24 3.15
1. Energy Industries 0.98 0.91 1.03 1.06 1.09 0.98 1.07 1.27 1.29 1.33
2. Manufacturing Industries and Construction 0.51 0.53 0.51 0.51 0.52 0.52 0.51 0.57 0.61 0.54
3. Transport 0.59 0.62 0.69 0.84 0.89 0.98 0.99 1.03 1.09 1.04
4. Other Sectors 0.30 0.27 0.27 0.31 0.30 0.29 0.27 0.26 0.23 0.23
5. Other 0.03 0.02 0.02 0.02 0.02 0.01 0.01 0.01 0.01 0.01
B. Fugitive Emissions from Fuels 0.00 0.00 0.00 0.00 0.00 0.00 0.00 0.00 0.00 0.00
1. Solid Fuels NA, NE NA, NE NA, NE NA, NE NA, NE NA, NE NA, NE NA, NE NA, NE NA, NE
2. Oil and Natural Gas 0.00 0.00 0.00 0.00 0.00 0.00 0.00 0.00 0.00 0.00
2. Industrial Processes 6.12 7.21 6.99 8.29 8.58 7.55 8.56 8.62 11.10 9.94
A. Mineral Products NE NE NE NE NE NE NE NE NE NE
B. Chemical Industry 6.12 7.21 6.99 8.29 8.58 7.55 8.56 8.62 11.10 9.94
C. Metal Production NE NE NE NE NE NE NE NE NE NE
D. Other Production
E. Production of Halocarbons and SF6
F. Consumption of Halocarbons and SF6
G. Other NA NA NA NA NA NA NA NA NA NA
3. Solvent and Other Product Use 1.16 1.14 1.13 1.12 1.11 1.11 1.10 1.09 1.09 1.08
4. Agriculture 77.41 71.24 72.49 72.91 67.84 69.77 67.98 69.66 69.18 77.79
A. Enteric Fermentation
B. Manure Management 16.14 14.79 14.14 14.52 13.65 12.22 11.62 11.58 11.08 10.37
C. Rice Cultivation
D. Agricultural Soils 58.26 53.74 55.78 55.73 51.69 55.34 54.23 55.92 56.03 65.48
E. Prescribed Burning of Savannas NO NO NO NO NO NO NO NO NO NO
F. Field Burning of Agricultural Residues NO NO NO NO NO NO NO NO NO NO
G. Other 3.02 2.71 2.57 2.66 2.50 2.22 2.13 2.15 2.07 1.94
5. Land Use, Land-Use Change and Forestry 0.05 0.03 0.04 0.04 0.04 0.03 0.04 0.04 0.12 0.06
A. Forest Land 0.04 0.03 0.04 0.04 0.03 0.03 0.03 0.04 0.12 0.06
B. Cropland NA, NO NA, NO NA, NO NA, NO NA, NO NA, NO NA, NO NA, NO NA, NO NA, NO
C. Grassland NO NO NO NO NO NO NO NO NO NO
D. Wetlands 0.00 0.00 0.00 0.00 0.00 0.00 0.00 0.00 0.00 0.00
E. Settlements NO NO NO NO NO NO NO NO NO NO
F. Other Land NO NO NO NO NO NO NO NO NO NO
G. Other NO NO NO NO NO NO NO NO NO NO
6. Waste 3.44 3.48 3.55 3.68 3.61 3.71 3.68 3.71 3.68 3.69
A. Solid Waste Disposal on Land
B. Waste-water Handling 3.44 3.48 3.55 3.68 3.61 3.71 3.68 3.71 3.68 3.69
C. Waste Incineration IE IE IE IE IE IE IE IE IE IE
D. Other NO NO NO NO NO NO NO 0.00 0.00 0.00
7. Other (as specified in the summary table in CRF) NA NA NA NA NA NA NA NA NA NA
Total N2O emissions including N2O from LULUCF 90.59 85.48 86.73 88.78 84.01 84.96 84.21 86.27 88.42 95.71
Total N2O emissions excluding N2O from LULUCF 90.55 85.45 86.69 88.74 83.98 84.93 84.17 86.24 88.30 95.65
Memo Items:
International Bunkers 0.02 0.02 0.02 0.02 0.02 0.03 0.03 0.03 0.04 0.04
Aviation 0.02 0.02 0.02 0.02 0.02 0.02 0.03 0.03 0.04 0.04
Marine 0.00 0.00 0.00 0.00 0.00 0.00 0.00 0.00 0.00 0.00
Multilateral Operations NE NE NE NE NE NE NE NE 0.00 0.00
CO2 Emissions from Biomass
Note: All footnotes for this table are given on sheet 3.
GREENHOUSE GAS SOURCE AND SINK CATEGORIES

Table 1(c) UKR_BR1_v1.0
Emission trends (N2O) Source: Submission 2014 v1.1, UKRAINE
(Sheet 3 of 3) CRF: UKR_CRF__ v1.1
2009 2010 2011 Change from
base to latest
reported
year
kt kt kt %
1. Energy 2.81 2.85 4.36 -35.24
A. Fuel Combustion (Sectoral Approach) 2.81 2.85 4.35 -35.23
1. Energy Industries 1.23 1.28 2.28 6.28
2. Manufacturing Industries and Construction 0.45 0.48 0.64 -59.65
3. Transport 0.90 0.86 1.17 -37.87
4. Other Sectors 0.22 0.22 0.25 -77.07
5. Other 0.01 0.01 0.01 197.81
B. Fugitive Emissions from Fuels 0.00 0.00 0.00 -45.43
1. Solid Fuels NA, NE NA, NE NA, NE 0.00
2. Oil and Natural Gas 0.00 0.00 0.00 -45.43
2. Industrial Processes 6.60 8.80 11.25 -13.09
A. Mineral Products NE NE NE 0.00
B. Chemical Industry 6.60 8.80 11.25 -13.09
C. Metal Production NE NE NE 0.00
D. Other Production
E. Production of Halocarbons and SF6
F. Consumption of Halocarbons and SF6
G. Other NA NA NA 0.00
3. Solvent and Other Product Use 1.08 1.07 1.07 -12.22
4. Agriculture 73.14 77.09 83.15 -49.40
A. Enteric Fermentation
B. Manure Management 10.27 10.31 10.03 -63.88
C. Rice Cultivation
D. Agricultural Soils 60.94 64.80 71.18 -45.20
E. Prescribed Burning of Savannas NO NO NO 0.00
F. Field Burning of Agricultural Residues NO NO NO 0.00
G. Other 1.93 1.98 1.94 -70.93
5. Land Use, Land-Use Change and Forestry 0.04 0.05 0.00 -95.97
A. Forest Land 0.04 0.05 0.00 -99.06
B. Cropland NA, NO NA, NO NA, NO 0.00
C. Grassland NO NO NO 0.00
D. Wetlands 0.00 0.00 0.00 -75.39
E. Settlements NO NO NO 0.00
F. Other Land NO NO NO 0.00
G. Other NO NO NO 0.00
6. Waste 3.59 3.59 3.59 -33.84
A. Solid Waste Disposal on Land
B. Waste-water Handling 3.58 3.59 3.59 -33.85
C. Waste Incineration IE IE 0.00 100.00
D. Other 0.00 0.00 0.00 100.00
7. Other (as specified in the summary table in CRF) NA NA NA 0.00
Total N2O emissions including N2O from LULUCF 87.26 93.45 103.41 -45.77
Total N2O emissions excluding N2O from LULUCF 87.21 93.40 103.41 -45.76
Memo Items:
International Bunkers 0.04 0.04 0.03 -74.26
Aviation 0.03 0.04 0.03 -67.70
Marine 0.00 0.00 0.00 -97.54
Multilateral Operations 0.00 0.00 NO 0.00
CO2 Emissions from Biomass
Custom Footnotes
GREENHOUSE GAS SOURCE AND SINK CATEGORIES
Abbreviations : CRF = common reporting format, LULUCF = land use, land-use change and forestry.
a The column “Base year” should be filled in only by those Parties with economies in transition
that use a base year different from 1990 in accordance with the relevant decisions of the
Conference of the Parties. For these Parties, this different base year is used to calculate the
percentage change in the final column of this table.

Table 1(d) UKR_BR1_v1.0
Emission trends (HFCs, PFCs and SF6) Source: Submission 2014 v1.1, UKRAINE
(Sheet 1 of 3) CRF: UKR_CRF__ v1.1
Base yeara 1991 1992 1993 1994 1995 1996 1997 1998
kt kt kt kt kt kt kt kt kt
Emissions of HFCsc - (kt CO2 eq) NA, NE, NO NA, NE, NO NA, NE, NO NA, NE, NO NA, NE, NO NA, NE, NO NA, NE, NO 5.83 11.35
HFC-23 NA, NO NA, NO NA, NO NA, NO NA, NO NA, NO NA, NO NA, NO NA, NO
HFC-32 NA, NO NA, NO NA, NO NA, NO NA, NO NA, NO NA, NO NA, NO NA, NO
HFC-41 NA, NO NA, NO NA, NO NA, NO NA, NO NA, NO NA, NO NA, NO NA, NO
HFC-43-10mee NA, NO NA, NO NA, NO NA, NO NA, NO NA, NO NA, NO NA, NO NA, NO
HFC-125 NA, NO NA, NO NA, NO NA, NO NA, NO NA, NO NA, NO NA, NO NA, NO
HFC-134 NA, NO NA, NO NA, NO NA, NO NA, NO NA, NO NA, NO NA, NO NA, NO
HFC-134a NA, NO NA, NO NA, NO NA, NO NA, NO NA, NO NA, NO 0.00 0.01
HFC-152a NA, NO NA, NO NA, NO NA, NO NA, NO NA, NO NA, NO NA, NO NA, NO
HFC-143 NA, NO NA, NO NA, NO NA, NO NA, NO NA, NO NA, NO NA, NO NA, NO
HFC-143a NA, NO NA, NO NA, NO NA, NO NA, NO NA, NO NA, NO NA, NO NA, NO
HFC-227ea NA, NO NA, NO NA, NO NA, NO NA, NO NA, NO NA, NO 0.00 0.00
HFC-236fa NA, NO NA, NO NA, NO NA, NO NA, NO NA, NO NA, NO NA, NO NA, NO
HFC-245ca NA, NO NA, NO NA, NO NA, NO NA, NO NA, NO NA, NO NA, NO NA, NO
Unspecified mix of listed HFCsd - (kt CO2 eq) NA, NO NA, NO NA, NO NA, NO NA, NO NA, NO NA, NO NA, NO NA, NO
Emissions of PFCsc - (kt CO2 eq) 203.23 162.19 122.68 123.72 138.94 153.45 123.45 126.68 103.97
CF4 0.03 0.02 0.02 0.02 0.02 0.02 0.02 0.02 0.01
C2F6 0.00 0.00 0.00 0.00 0.00 0.00 0.00 0.00 0.00
C 3F8 NA, NO NA, NO NA, NO NA, NO NA, NO NA, NO NA, NO NA, NO NA, NO
C4F10 NA, NO NA, NO NA, NO NA, NO NA, NO NA, NO NA, NO NA, NO NA, NO
c-C4F8 NA, NO NA, NO NA, NO NA, NO NA, NO NA, NO NA, NO NA, NO NA, NO
C5F12 NA, NO NA, NO NA, NO NA, NO NA, NO NA, NO NA, NO NA, NO NA, NO
C6F14 NA, NO NA, NO NA, NO NA, NO NA, NO NA, NO NA, NO NA, NO NA, NO
Unspecified mix of listed PFCs(4) - (Gg CO2 equivalent) NA, NO NA, NO NA, NO NA, NO NA, NO NA, NO NA, NO NA, NO NA, NO
Emissions of SF6(3) - (Gg CO2 equivalent) 0.01 0.02 0.03 0.06 0.07 0.07 0.07 0.13 0.20
SF6 0.00 0.00 0.00 0.00 0.00 0.00 0.00 0.00 0.00
Note: All footnotes for this table are given on sheet 3.
GREENHOUSE GAS SOURCE AND SINK CATEGORIES
Table 1(d) UKR_BR1_v1.0
Emission trends (HFCs, PFCs and SF6) Source: Submission 2014 v1.1, UKRAINE
(Sheet 2 of 3) CRF: UKR_CRF__ v1.1
1999 2000 2001 2002 2003 2004 2005 2006 2007 2008
kt kt kt kt kt kt kt kt kt kt
Emissions of HFCsc - (kt CO2 eq) 12.07 14.12 25.96 57.47 94.57 167.79 253.76 355.98 498.64 571.58
HFC-23 NA, NO NA, NO NA, NO NA, NO NA, NO NA, NO NA, NO NA, NO NA, NO NA, NO
HFC-32 NA, NO NA, NO NA, NO 0.00 0.00 0.00 0.00 0.00 0.00 0.00
HFC-41 NA, NO NA, NO NA, NO NA, NO NA, NO NA, NO NA, NO NA, NO NA, NO NA, NO
HFC-43-10mee NA, NO NA, NO NA, NO NA, NO NA, NO NA, NO NA, NO NA, NO NA, NO NA, NO
HFC-125 NA, NO NA, NO NA, NO 0.00 0.00 0.00 0.01 0.01 0.02 0.02
HFC-134 NA, NO NA, NO NA, NO NA, NO NA, NO NA, NO NA, NO NA, NO NA, NO NA, NO
HFC-134a 0.01 0.01 0.02 0.04 0.05 0.08 0.10 0.14 0.20 0.25
HFC-152a NA, NO NA, NO NA, NO IE, NA, NO IE, NA, NO IE, NA, NO IE, NA, NO NA, NO NA, NO NA, NO
HFC-143 NA, NO NA, NO NA, NO NA, NO NA, NO NA, NO NA, NO NA, NO NA, NO NA, NO
HFC-143a NA, NO NA, NO 0.00 0.00 0.00 0.00 0.01 0.01 0.01 0.01
HFC-227ea 0.00 0.00 0.00 0.00 0.00 0.00 0.00 0.00 0.00 0.00
HFC-236fa NA, NO NA, NO NA, NO NA, NO NA, NO NA, NO NA, NO NA, NO NA, NO NA, NO
HFC-245ca NA, NO NA, NO NA, NO NA, NO NA, NO NA, NO NA, NO NA, NO NA, NO NA, NO
Unspecified mix of listed HFCsd - (kt CO2 eq) NA, NO NA, NO NA, NO 3.83 13.05 44.77 82.64 105.18 136.94 137.55
Emissions of PFCsc - (kt CO2 eq) 87.74 99.74 96.59 85.02 66.49 80.44 122.66 95.80 133.33 150.16
CF4 0.01 0.01 0.01 0.01 0.01 0.01 0.02 0.01 0.02 0.02
C2F6 0.00 0.00 0.00 0.00 0.00 0.00 0.00 0.00 0.00 0.00
C 3F8 NA, NO NA, NO NA, NO NA, NO NA, NO NA, NO NA, NO NA, NO NA, NO NA, NO
C4F10 NA, NO NA, NO NA, NO NA, NO NA, NO NA, NO NA, NO NA, NO NA, NO NA, NO
c-C4F8 NA, NO NA, NO NA, NO NA, NO NA, NO NA, NO NA, NO NA, NO NA, NO NA, NO
C5F12 NA, NO NA, NO NA, NO NA, NO NA, NO NA, NO NA, NO NA, NO NA, NO NA, NO
C6F14 NA, NO NA, NO NA, NO NA, NO NA, NO NA, NO NA, NO NA, NO NA, NO NA, NO
Unspecified mix of listed PFCs(4) - (Gg CO2 equivalent) NA, NO NA, NO NA, NO NA, NO NA, NO NA, NO NA, NO NA, NO NA, NO NA, NO
Emissions of SF6(3) - (Gg CO2 equivalent) 0.32 0.44 0.49 1.12 2.09 3.23 4.68 4.48 5.45 9.79
SF6 0.00 0.00 0.00 0.00 0.00 0.00 0.00 0.00 0.00 0.00
Note: All footnotes for this table are given on sheet 3.
GREENHOUSE GAS SOURCE AND SINK CATEGORIES
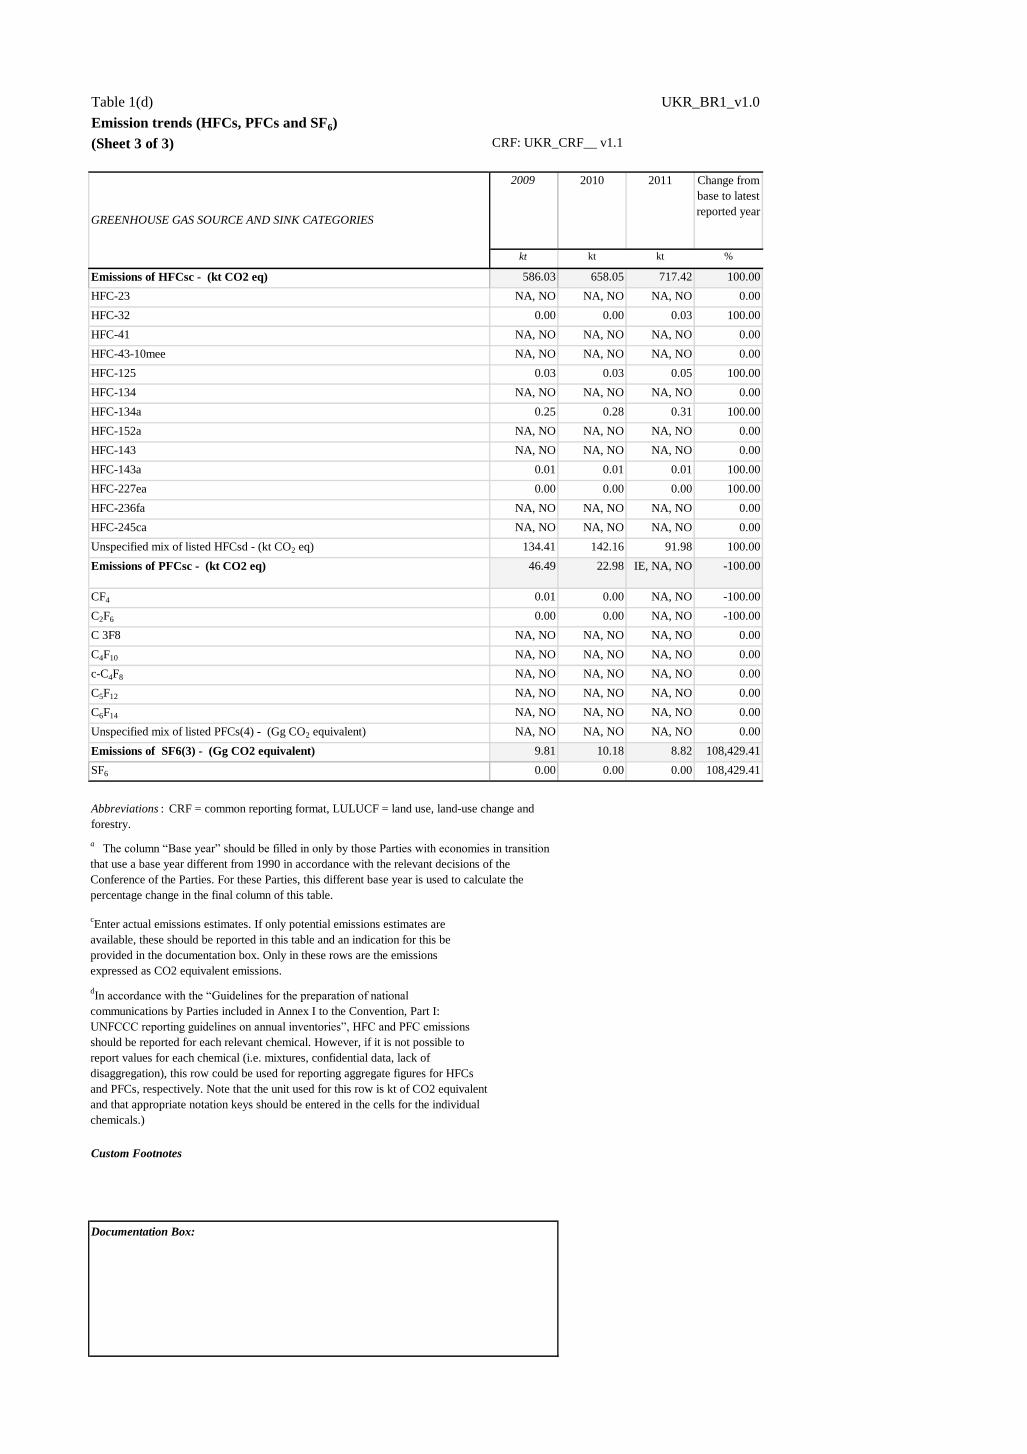
Table 1(d) UKR_BR1_v1.0
Emission trends (HFCs, PFCs and SF6) Source: Submission 2014 v1.1, UKRAINE
(Sheet 3 of 3) CRF: UKR_CRF__ v1.1
2009 2010 2011 Change from
base to latest
reported year
kt kt kt %
Emissions of HFCsc - (kt CO2 eq) 586.03 658.05 717.42 100.00
HFC-23 NA, NO NA, NO NA, NO 0.00
HFC-32 0.00 0.00 0.03 100.00
HFC-41 NA, NO NA, NO NA, NO 0.00
HFC-43-10mee NA, NO NA, NO NA, NO 0.00
HFC-125 0.03 0.03 0.05 100.00
HFC-134 NA, NO NA, NO NA, NO 0.00
HFC-134a 0.25 0.28 0.31 100.00
HFC-152a NA, NO NA, NO NA, NO 0.00
HFC-143 NA, NO NA, NO NA, NO 0.00
HFC-143a 0.01 0.01 0.01 100.00
HFC-227ea 0.00 0.00 0.00 100.00
HFC-236fa NA, NO NA, NO NA, NO 0.00
HFC-245ca NA, NO NA, NO NA, NO 0.00
Unspecified mix of listed HFCsd - (kt CO2 eq) 134.41 142.16 91.98 100.00
Emissions of PFCsc - (kt CO2 eq) 46.49 22.98 IE, NA, NO -100.00
CF4 0.01 0.00 NA, NO -100.00
C2F6 0.00 0.00 NA, NO -100.00
C 3F8 NA, NO NA, NO NA, NO 0.00
C4F10 NA, NO NA, NO NA, NO 0.00
c-C4F8 NA, NO NA, NO NA, NO 0.00
C5F12 NA, NO NA, NO NA, NO 0.00
C6F14 NA, NO NA, NO NA, NO 0.00
Unspecified mix of listed PFCs(4) - (Gg CO2 equivalent) NA, NO NA, NO NA, NO 0.00
Emissions of SF6(3) - (Gg CO2 equivalent) 9.81 10.18 8.82 108,429.41
SF6 0.00 0.00 0.00 108,429.41
cEnter actual emissions estimates. If only potential emissions estimates are
available, these should be reported in this table and an indication for this be
provided in the documentation box. Only in these rows are the emissions
expressed as CO2 equivalent emissions.
dIn accordance with the “Guidelines for the preparation of national
communications by Parties included in Annex I to the Convention, Part I:
UNFCCC reporting guidelines on annual inventories”, HFC and PFC emissions
should be reported for each relevant chemical. However, if it is not possible to
report values for each chemical (i.e. mixtures, confidential data, lack of
disaggregation), this row could be used for reporting aggregate figures for HFCs
and PFCs, respectively. Note that the unit used for this row is kt of CO2 equivalent
and that appropriate notation keys should be entered in the cells for the individual
chemicals.)
Custom Footnotes
GREENHOUSE GAS SOURCE AND SINK CATEGORIES
Abbreviations : CRF = common reporting format, LULUCF = land use, land-use change and
forestry.
a The column “Base year” should be filled in only by those Parties with economies in transition
that use a base year different from 1990 in accordance with the relevant decisions of the
Conference of the Parties. For these Parties, this different base year is used to calculate the
percentage change in the final column of this table.
Documentation Box:

Table 2(a) UKR_BR1_v1.0
Description of quantified economy-wide emission reduction target: base yeara
Party
Base year /base period
% of base year/base period % of 1990 b
100.00 0.00
Period for reaching target
b Optional.
Ukraine
1990
2008-2012
a Reporting by a developed country Party on the information specified in the common tabular format does not prejudge the position of other Parties with regard to the
treatment of units from market-based mechanisms under the Convention or other market-based mechanisms towards achievement of quantified economy-wide emission
reduction targets.
Emission reduction target

Table 2(b) UKR_BR1_v1.0
Base year for each gas (year):
1990
1990
1990
1990
1990
1990
Energy Yes
Transportf Yes
Industrial processesg Yes
Agriculture Yes
LULUCF Yes
Waste Yes
Solvents and Other
Product Use
Yes
Abbreviations : LULUCF = land use, land-use change and forestry.
Other Gases (specify)
Sectors coveredb
b More than one selection will be allowed. If Parties use sectors other than those indicated
above, the explanation of how these sectors relate to the sectors defined by the IPCC should be
provided.
g Industrial processes refer to the industrial processes and solvent and other product use sectors.
a Reporting by a developed country Party on the information specified in the common tabular
format does not prejudge the position of other Parties with regard to the treatment of units from
market-based mechanisms under the Convention or other market-based mechanisms towards
achievement of quantified economy-wide emission reduction targets.
f Transport is reported as a subsector of the energy sector.
Description of quantified economy-wide emission reduction target: gases
and sectors covereda
Gases covered
CO2
CH4
N2O
HFCs
PFCs
SF6
NF3
Other Sectors (specify)

Table 2(c) UKR_BR1_v1.0
Gases GWP values b
CO2 2nd AR
CH4 2nd AR
N2O 2nd AR
HFCs 2nd AR
PFCs 2nd AR
SF6 2nd AR
NF3 2nd AR
Abbreviations : GWP = global warming potential
Description of quantified economy-wide emission reduction target: global
warming potential values (GWP)a
a Reporting by a developed country Party on the information specified in the common tabular format
does not prejudge the position of other Parties with regard to the treatment of units from market-based
mechanisms under the Convention or other market-based mechanisms towards achievement of
quantified economy-wide emission reduction targets.b
Please specify the reference for the GWP: Second Assessment Report of the Intergovernmental
Panel on Climate Change (IPCC) or the Fourth Assessment Report of the IPCC.
Other Gases (specify)

Table 2(d) UKR_BR1_v1.0
Role of LULUCF LULUCF in base year level and target Included
Contribution of LULUCF is calculated using Land-based approach
Abbreviation : LULUCF = land use, land-use change and forestry.
a Reporting by a developed country Party on the information specified in the common tabular format does not prejudge the position of other Parties with regard to the
treatment of units from market-based mechanisms under the Convention or other market-based mechanisms towards achievement of quantified economy-wide emission
reduction targets.
Description of quantified economy-wide emission reduction target: approach to counting emissions and removals from the LULUCF
sectora

Table 2(e)I UKR_BR1_v1.0
Market-based mechanisms Possible scale of contributions
under the Convention (estimated kt CO 2 eq)
CERs 0.00
ERUs 0.00
AAUsi 46,041,846.63
Carry-over unitsj 0.00
Abbreviations : AAU = assigned amount unit, CER = certified emission reduction, ERU = emission reduction unit.
i AAUs issued to or purchased by a Party.
j Units carried over from the first to the second commitment periods of the Kyoto Protocol, as described in decision 13/CMP.1
and consistent with decision 1/CMP.8.
a Reporting by a developed country Party on the information specified in the common tabular format does not prejudge the
position of other Parties with regard to the treatment of units from market-based mechanisms under the Convention or other
market-based mechanisms towards achievement of quantified economy-wide emission reduction targets.
d As indicated in paragraph 5(e) of the guidelines contained in annex I of decision 2/CP.17 .
Description of quantified economy-wide emission reduction target: market-based mechanisms
under the Conventiona
Other mechanism units under the Convention (specify)d

Table 2(e)II UKR_BR1_v1.0
Other market-based mechanisms Possible scale of contributions
(Specify) (estimated kt CO 2 eq)
a Reporting by a developed country Party on the information specified in the common tabular format does not prejudge the position of
other Parties with regard to the treatment of units from market-based mechanisms under the Convention or other market-based
mechanisms towards achievement of quantified economy-wide emission reduction targets.
Description of quantified economy-wide emission reduction target: other market-based mechanismsa

Table 2(f) UKR_BR1_v1.0
Description of quantified economy-wide emission reduction target: any other informationa,b
Custom Footnotes
a Reporting by a developed country Party on the information specified in the common tabular format does not prejudge the position of other Parties with regard to the treatment of units from
market-based mechanisms under the Convention or other market-based mechanisms towards achievement of quantified economy-wide emission reduction targets.
b This information could include information on the domestic legal status of the target or the total assigned amount of emission units for the period for reaching a target. Some of this information is
presented in the narrative part of the biennial report.

Table 3 UKR_BR1_v1.0
Progress in achievement of the quantified economy-wide emission reduction target: information on mitigation actions and their effects
Green Investment
Scheme projects
Energy,
Transport, Other
(Manufacturing
industries and
construction)
CO2 Reduction of СО2
emissions
Other (Financing
of these activities
has been
conducted with
funds gained from
selling of AAUs,
as it provided by
Article 17 of KP
with an
agreement of
quote buyer.)
Adopted The projects are confirmed with Parties
purchased AAUs and are realized in different
regions of Ukraine. The projects presumably
imply increase of energy efficiency in social
sphere.
2011 State Environmental
Investment Agency,
local self-government
institutions.
120.00
Sectoral program of
energy efficiency and
energy saving up to
2017
Energy, Other
(Manufacturing
industries and
construction)
CO2 Energy efficiency. Regulatory|Econo
mic|Voluntary
Agreement|Infor
mation|Other
(Budget
financing)
Adopted The program is developed for black iron,
machine building, chemical and oil, light
industry, woodworking and other industries of
Ukraine .
2009 Ministry of industrial
policy, local self-
government institutions,
private entities.
19,000.00
State targeted economic
program of energy
efficiency and
development of the
alternative energy
generation secor for
2010-2015.
Energy,
Transport, Other
(Manufacturing
industries and
construction)
CO2 Energy efficiency. Economic|Volunt
ary
Agreement|Regul
atory|Information|
Other (Budget
financing)
Adopted Decrease of energy capacity of the GDP. 2010 Cabinet of Ministers of
Ukraine, central
executive
authorities,local self-
government institutions.
50,000.00
Note : The two final columns specify the year identified by the Party for estimating impacts (based on the status of the measure and whether an ex post or ex ante estimation is available).
Abbreviations : GHG = greenhouse gas; LULUCF = land use, land-use change and forestry.
Custom Footnotes
Brief descriptione Start year of
implementation
Implementing entity or
entitiesName of mitigation action
a
f Optional year or years deemed relevant by the Party.
Estimate of mitigation impact (not
cumulative, in kt CO 2 eq)Objective and/or
activity affected
Type of
instrumentc
Status of
implementationd
Sector(s)
affectedb
GHG(s)
affected
a Parties should use an asterisk (*) to indicate that a mitigation action is included in the ‘with measures’ projection.
b To the extent possible, the following sectors should be used: energy, transport, industry/industrial processes, agriculture, forestry/LULUCF, waste management/waste, other sectors, cross-cutting, as appropriate.
c To the extent possible, the following types of instrument should be used: economic, fiscal, voluntary agreement, regulatory, information, education, research, other.
d To the extent possible, the following descriptive terms should be used to report on the status of implementation: implemented, adopted, planned.
e Additional information may be provided on the cost of the mitigation actions and the relevant timescale.

Table 4 UKR_BR1_v1.0
Reporting on progressa, b
Total emissions
excluding LULUCF
Contribution from
LULUCFd
Yearc (kt CO 2 eq) (kt CO 2 eq) (number of units) (kt CO 2 eq) (number of units) (kt CO 2 eq)
(1990) 929,893.57 -69,737.11
2010 383,211.39 -37,955.08 0.00 0.00 0.00 0.00
2011 401,576.28 -7,289.75
2012
Abbreviation : GHG = greenhouse gas, LULUCF = land use, land-use change and forestry.
Custom Footnotes
The share of sinks of LULUCF sector in total emissions is stated in Table 1.
d Information in this column should be consistent with the information reported in table 4(a)I or 4(a)II, as appropriate. The Parties for which all relevant information on the LULUCF
contribution is reported in table 1 of this common tabular format can refer to table 1.
Quantity of units from other market based
mechanisms
Quantity of units from market based
mechanisms under the Convention
a Reporting by a developed country Party on the information specified in the common tabular format does not prejudge the position of other Parties with regard to the treatment of units
from market-based mechanisms under the Convention or other market-based mechanisms towards achievement of quantified economy-wide emission reduction targets.
b For the base year, information reported on the emission reduction target shall include the following: (a) total GHG emissions, excluding emissions and removals from the LULUCF sector;
(b) emissions and/or removals from the LULUCF sector based on the accounting approach applied taking into consideration any relevant decisions of the Conference of the Parties and the
activities and/or land that will be accounted for; (c) total GHG emissions, including emissions and removals from the LULUCF sector. For each reported year, information reported on
progress made towards the emission reduction targets shall include, in addition to the information noted in paragraphs 9(a–c) of the UNFCCC biennial reporting guidelines for developed
country Parties, information on the use of units from market-based mechanisms.c
Parties may add additional rows for years other than those specified below.

Table 4(a)I UKR_BR1_v1.0
Net GHG
emissions/removals from
LULUCF categories c
Base year/period or
reference level value d
Contribution from
LULUCF for
reported year
Cumulative
contribution from
LULUCF e
Total LULUCF Land-based approach
A. Forest land Land-based approach
1. Forest land remaining forest land Land-based approach
2. Land converted to forest land Land-based approach
3. Other g Land-based approach
B. Cropland Land-based approach
1. Cropland remaining cropland Land-based approach
2. Land converted to cropland Land-based approach
3. Other g Land-based approach
C. Grassland Land-based approach
1. Grassland remaining grassland Land-based approach
2. Land converted to grassland Land-based approach
3. Other g Land-based approach
D. Wetlands Land-based approach
1. Wetland remaining wetland Land-based approach
2. Land converted to wetland Land-based approach
3. Other g Land-based approach
E. Settlements Land-based approach
1. Settlements remaining settlements Land-based approach
2. Land converted to settlements Land-based approach
3. Other g Land-based approach
F. Other land Land-based approach
1. Other land remaining other land Land-based approach
2. Land converted to other land Land-based approach
3. Other g Land-based approach
Harvested wood products Land-based approach
Harvested wood products Land-based approach
Abbreviations : GHG = greenhouse gas, LULUCF = land use, land-use change and forestry.
Custom Footnotes
g Specify what was used for the category “other”. Explain in this biennial report how each was defined and how it relates to the categories used for reporting under the Convention or its Kyoto
Protocol.
a Reporting by a developed country Party on the information specified in the common tabular format does not prejudge the position of other Parties with regard to the treatment of units from
market-based mechanisms under the Convention or other market-based mechanisms towards achievement of quantified economy-wide emission reduction targets.b
Parties that use the LULUCF approach that is based on table 1 do not need to complete this table, but should indicate the approach in table 2. Parties should fill in a separate table for each year,
namely 2011 and 2012, where 2014 is the reporting year.
c For each category, enter the net emissions or removals reported in the most recent inventory submission for the corresponding inventory year. If a category differs from that used for the
reporting under the Convention or its Kyoto Protocol, explain in the biennial report how the value was derived.d
Enter one reference level or base year/period value for each category. Explain in the biennial report how these values have been calculated.e
If applicable to the accounting approach chosen. Explain in this biennial report to which years or period the cumulative contribution refers to.
Progress in achieving the quantified economy-wide emission reduction targets – further information on mitigation actions relevant to the
contribution of the land use, land-use change and forestry sector in 2011 a,b
Accounting
approach f
(kt CO 2 eq)
f Label each accounting approach and indicate where additional information is provided within this biennial report explaining how it was implemented, including all relevant accounting
parameters (i.e. natural disturbances, caps).

Table 4(a)I UKR_BR1_v1.0
Net GHG
emissions/removals from
LULUCF categories c
Base year/period or
reference level value d
Contribution from
LULUCF for
reported year
Cumulative
contribution from
LULUCF e
Total LULUCF Land-based approach
A. Forest land Land-based approach
1. Forest land remaining forest land Land-based approach
2. Land converted to forest land Land-based approach
3. Other g Land-based approach
B. Cropland Land-based approach
1. Cropland remaining cropland Land-based approach
2. Land converted to cropland Land-based approach
3. Other g Land-based approach
C. Grassland Land-based approach
1. Grassland remaining grassland Land-based approach
2. Land converted to grassland Land-based approach
3. Other g Land-based approach
D. Wetlands Land-based approach
1. Wetland remaining wetland Land-based approach
2. Land converted to wetland Land-based approach
3. Other g Land-based approach
E. Settlements Land-based approach
1. Settlements remaining settlements Land-based approach
2. Land converted to settlements Land-based approach
3. Other g Land-based approach
F. Other land Land-based approach
1. Other land remaining other land Land-based approach
2. Land converted to other land Land-based approach
3. Other g Land-based approach
Harvested wood products Land-based approach
Abbreviations : GHG = greenhouse gas, LULUCF = land use, land-use change and forestry.
Custom Footnotes
Progress in achieving the quantified economy-wide emission reduction targets – further information on mitigation actions relevant to the
contribution of the land use, land-use change and forestry sector in 2012 a, b
d Enter one reference level or base year/period value for each category. Explain in the biennial report how these values have been calculated.
e If applicable to the accounting approach chosen. Explain in this biennial report to which years or period the cumulative contribution refers to.
f Label each accounting approach and indicate where additional information is provided within this biennial report explaining how it was implemented, including all relevant accounting
parameters (i.e. natural disturbances, caps).g
Specify what was used for the category “other”. Explain in this biennial report how each was defined and how it relates to the categories used for reporting under the Convention or its Kyoto
Protocol.
Accounting
approach f
(kt CO 2 eq)
a Reporting by a developed country Party on the information specified in the common tabular format does not prejudge the position of other Parties with regard to the treatment of units from
market-based mechanisms under the Convention or other market-based mechanisms towards achievement of quantified economy-wide emission reduction targets.b
Parties that use the LULUCF approach that is based on table 1 do not need to complete this table, but should indicate the approach in table 2. Parties should fill in a separate table for each year,
namely 2011 and 2012, where 2014 is the reporting year.
c For each category, enter the net emissions or removals reported in the most recent inventory submission for the corresponding inventory year. If a category differs from that used for the
reporting under the Convention or its Kyoto Protocol, explain in the biennial report how the value was derived.

Table 4(a)II UKR_BR1_v1.0
Source: UKR_CRF__ v1.1
2008 2009 2010 2011 Totalg
A. Article 3.3 activities
A.1. Afforestation and Reforestation -2'001.56
A.1.1. Units of land not harvested since the beginning of the commitment periodj -27.58 -27.35 -57.80 -160.32 -273.04 -273.04
A.1.2. Units of land harvested since the beginning of the commitment periodj -1'728.51
A.2. Deforestation 329.14 1.80 0.10 6.40 337.45 337.44596
B. Article 3.4 activities
B.1. Forest Management (if elected) -56,351.81 -58,197.86 -55,816.82 -61,282.08 -231,648.57 -20350
3.3 offsetk 0 0
FM capl 20350 -20350
B.2. Cropland Management (if elected) NA NA NA NA NA NA NA NA
B.3. Grazing Land Management (if elected) NA NA NA NA NA NA NA NA
B.4. Revegetation (if elected) NA NA NA NA NA NA NA NA
Note: 1 kt CO2 eq equals 1 Gg CO2 eq.
Abbreviations : CRF = common reporting format, LULUCF = land use, land-use change and forestry.
Custom Footnotes
Progress in achievement of the quantified economy-wide emission reduction targets – further information on mitigation actions relevant
to the counting of emissions and removals from the land use, land-use change and forestry sector in relation to activities under Article 3,
paragraphs 3 and 4, of the Kyoto Protocola,b, c
GREENHOUSE GAS SOURCE AND SINK ACTIVITIESBase year
d
d Net emissions and removals in the Party’s base year, as established by decision 9/CP.2.
e All values are reported in the information table on accounting for activities under Article 3, paragraphs 3 and 4, of the Kyoto Protocol, of the CRF for the relevant inventory year as reported in the current
submission and are automatically entered in this table.
a Reporting by a developed country Party on the information specified in the common tabular format does not prejudge the position of other Parties with regard to the treatment of units from market-based
mechanisms under the Convention or other market-based mechanisms towards achievement of quantified economy-wide emission reduction targets.
b Developed country Parties with a quantified economy-wide emission reduction target as communicated to the secretariat and contained in document FCCC/SB/2011/INF.1/Rev.1 or any update to that
document, that are Parties to the Kyoto Protocol, may use table 4(a)II for reporting of accounting quantities if LULUCF is contributing to the attainment of that target.
c Parties can include references to the relevant parts of the national inventory report, where accounting methodologies regarding LULUCF are further described in the documentation box or in the biennial
reports.
Net emissions/removalse Accounting
parametersh
Accounting
quantityi
(kt CO2 eq)
Documentation Box:
l In accordance with paragraph 11 of the annex to decision 16/CMP.1, for the first commitment period of the Kyoto Protocol only, additions to and subtractions from the assigned amount of a Party resulting
from Forest management under Article 3, paragraph 4, after the application of paragraph 10 of the annex to decision 16/CMP.1 and resulting from forest management project activities undertaken under
Article 6, shall not exceed the value inscribed in the appendix of the annex to decision 16/CMP.1, times five.
f Additional columns for relevant years should be added, if applicable.
g Cumulative net emissions and removals for all years of the commitment period reported in the current submission.
h The values in the cells “3.3 offset” and “Forest management cap” are absolute values.
i The accounting quantity is the total quantity of units to be added to or subtracted from a Party’s assigned amount for a particular activity in accordance with the provisions of Article 7, paragraph 4, of the
Kyoto Protocol.
j In accordance with paragraph 4 of the annex to decision 16/CMP.1, debits resulting from harvesting during the first commitment period following afforestation and reforestation since 1990 shall not be
greater than the credits accounted for on that unit of land.
k In accordance with paragraph 10 of the annex to decision 16/CMP.1, for the first commitment period a Party included in Annex I that incurs a net source of emissions under the provisions of Article 3
paragraph 3, may account for anthropogenic greenhouse gas emissions by sources and removals by sinks in areas under forest management under Article 3, paragraph 4, up to a level that is equal to the net
source of emissions under the provisions of Article 3, paragraph 3, but not greater than 9.0 megatonnes of carbon times five, if the total anthropogenic greenhouse gas emissions by sources and removals by
sinks in the managed forest since 1990 is equal to, or larger than, the net source of emissions incurred under Article 3, paragraph 3.

Table 4(b) UKR_BR1_v1.0
Reporting on progressa, b, c
2011 2012
(number of units)
(kt CO 2 eq)
(number of units)
(kt CO2 eq)
(number of units)
(kt CO2 eq)
(number of units)
(kt CO2 eq)
(number of units)
(kt CO2 eq)
(number of units)
(kt CO2 eq)
(number of units)
(kt CO 2 eq)
(number of units)
(kt CO 2 eq)
(number of units)
(kt CO 2 eq)
c Parties may include this information, as appropriate and if relevant to their target.
d Units surrendered by that Party for that year that have not been previously surrendered by that or any other Party.
e Additional rows for each market-based mechanism should be added, if applicable.
Custom Footnotes
Total
Note: 2011 is the latest reporting year.
Other units d,e
Units of market based mechanismsYear
Units from market-based mechanisms under the
Convention
Units from other market-based mechanisms
Kyoto
Protocol
unitsd
Kyoto Protocol units
AAUs
ERUs
CERs
tCERs
lCERs
Ukraine did not use flexible mechanisms of KP to reach quantified economy-wide emission reduction targets, as the results were clear in 2008
a priori.
b For each reported year, information reported on progress made towards the emission reduction target shall include, in addition to the
information noted in paragraphs 9(a-c) of the reporting guidelines, on the use of units from market-based mechanisms.
Abbreviations : AAUs = assigned amount units, CERs = certified emission reductions, ERUs = emission reduction units, lCERs = long-term
certified emission reductions, tCERs = temporary certified emission reductions.
a Reporting by a developed country Party on the information specified in the common tabular format does not prejudge the position of other
Parties with regard to the treatment of units from market-based mechanisms under the Convention or other market-based mechanisms towards
achievement of quantified economy-wide emission reduction targets.
Table 5 UKR_BR1_v1.0
Summary of key variables and assumptions used in the projections analysisa
Assumption Unit 1990 1995 2000 2005 2010 2011 2015 2020 2025 2030
a Parties should include key underlying assumptions as appropriate.
b Parties should include historical data used to develop the greenhouse gas projections reported.
Custom Footnotes
Key underlying assumptions Historicalb Projected
Forecasting model does not include priori determination of some key parametrs
on GHG emission assessment in the perspective. Development indicators of
economy sectors, energy consomption level, GDP, GHG emission and others are to be
determined during the forecasting on the base of the multivariate calculations using specialized
modeling software.

Table 6(a) UKR_BR1_v1.0
Information on updated greenhouse gas projections under a ‘with measures’ scenarioa
Base year
(1990)
1990 1995 2000 2005 2010 2011 2020 2030
Sectord,e
Energy 735,556.41 735,556.41 386,146.51 305,878.26 320,170.93 290,857.51 305,225.35 334,086.00 423,377.00
Transport 91,123.59 91,123.59 45,505.58 34,743.27 44,567.87 40,025.41 36,736.88 40,210.00 50,960.00
Industry/industrial processes 79,841.03 79,841.03 35,680.17 42,278.99 52,395.40 46,480.58 48,783.74 71,825.00 67,817.00
Agriculture 103,602.53 103,602.53 66,469.10 37,372.46 33,809.10 34,507.43 36,190.30 43,100.00 43,800.00
Forestry/LULUCF -69,737.11 -69,737.11 -48,757.12 -50,840.12 -38,440.09 37,955.08 -7,289.75 -11,340.00 -11,346.00
Waste management/waste 10,516.80 10,516.80 9,898.41 9,865.17 10,580.85 11,033.86 11,046.12 9,000.00 6,000.00
Other (specify) 376.80 376.80 372.11 354.89 340.38 332.01 330.77 365.00 450.00
Solvents and Other Product Use 376.80 376.80 372.11 354.89 340.38 332.01 330.77 365.00 450.00
Gas
CO2 emissions including net CO2 from LULUCF 649,193.99 649,193.99 311,570.92 242,687.71 282,146.26 251,713.87 298,172.52 322,086.82 389,536.76
CO2 emissions excluding net CO2 from LULUCF 718,951.47 718,951.47 360,356.18 293,541.68 320,602.57 289,707.97 305,463.58 351,865.16 424,743.07
CH4 emissions including CH4 from LULUCF 151,649.21 151,649.21 98,977.61 75,609.26 70,224.71 63,882.49 63,330.77 67,860.58 77,645.61
CH4 emissions excluding CH4 from LULUCF 151,640.82 151,640.82 98,963.32 75,605.82 70,219.46 63,859.24 63,329.94 67,857.21 77,641.62
N2O emissions including N2O from LULUCF 59,110.02 59,110.02 39,107.13 26,498.38 26,104.49 28,968.74 32,057.00 38,659.34 39,043.42
N2O emissions excluding N2O from LULUCF 59,098.04 59,098.04 39,093.28 26,487.96 26,093.52 28,952.98 32,056.52 38,657.37 39,041.08
HFCs NA NA NA 14.12 253.76 658.05 717.42 710.25 532.68
PFCs 203.23 203.23 153.45 99.74 122.66 22.98 NA NA NA
SF6 0.01 0.01 0.07 0.44 4.68 10.18 8.82 14.11 22.58
Other (specify)
Total with LULUCFf 860,156.46 860,156.46 449,809.18 344,909.65 378,856.56 345,256.31 394,286.53 429,331.10 506,781.05
Total without LULUCF 929,893.57 929,893.57 498,566.30 395,749.76 417,296.65 383,211.40 401,576.28 459,104.10 541,981.03
(kt CO2 eq)
GHG emission projections
(kt CO 2 eq)
GHG emissions and removalsb

Table 6(a) UKR_BR1_v1.0
Information on updated greenhouse gas projections under a ‘with measures’ scenarioa
Base year
(1990)
1990 1995 2000 2005 2010 2011 2020 2030
(kt CO2 eq)
GHG emission projections
(kt CO 2 eq)
GHG emissions and removalsb
Abbreviations : GHG = greenhouse gas, LULUCF = land use, land-use change and forestry.
Custom Footnotes
c 20XX is the reporting due-date year (i.e. 2014 for the first biennial report).
d In accordance with paragraph 34 of the “Guidelines for the preparation of national communications by Parties included in Annex I to the Convention, Part II: UNFCCC reporting guidelines on
national communications”, projections shall be presented on a sectoral basis, to the extent possible, using the same sectoral categories used in the policies and measures section. This table should
follow, to the extent possible, the same sectoral categories as those listed in paragraph 17 of those guidelines, namely, to the extent appropriate, the following sectors should be considered: energy,
transport, industry, agriculture, forestry and waste management.
e To the extent possible, the following sectors should be used: energy, transport, industry/industrial processes, agriculture, forestry/LULUCF, waste management/waste, other sectors (i.e. cross-
cutting), as appropriate.
The "with measures" scenario assumes the most possible changes of thechnical and economy in indicators of manufacturing technologies and resource consumption in context of scientific and
technical progress, structural and technological changes in economy of Ukraine, changes of environment on internal and external markets of goods and services. It includes all economically
reasonable activities for GHG emission reductions, as well as neither economically nor ecologically reasonable for Ukrainian conditions development of wind and solar energy.The "without
measures" scenario assumes that GDP target of the basic scenario in 2030 will be achieved with constant margin GHG emissions in all sectors, and its raise will be proportional of emissions'
development to corresponding levels of Gross Added Value, which will provide GDP's necessary level. At the same time in LULUCF sector it is assumed, that raise of GHG emissions from land
f Parties may choose to report total emissions with or without LULUCF, as appropriate.
a In accordance with the “Guidelines for the preparation of national communications by Parties included in Annex I to the Convention, Part II: UNFCCC reporting guidelines on national
communications”, at a minimum Parties shall report a ‘with measures’ scenario, and may report ‘without measures’ and ‘with additional measures’ scenarios. If a Party chooses to report ‘without
measures’ and/or ‘with additional measures’ scenarios they are to use tables 6(b) and/or 6(c), respectively. If a Party does not choose to report ‘without measures’ or ‘with additional measures’
scenarios then it should not include tables 6(b) or 6(c) in the biennial report.
b Emissions and removals reported in these columns should be as reported in the latest GHG inventory and consistent with the emissions and removals reported in the table on GHG emissions and
trends provided in this biennial report. Where the sectoral breakdown differs from that reported in the GHG inventory Parties should explain in their biennial report how the inventory sectors relate
to the sectors reported in this table.

Table 6(b) UKR_BR1_v1.0
Information on updated greenhouse gas projections under a ‘without measures’ scenarioa
Base year
(1990)
1990 1995 2000 2005 2010 2011 2020 2030
Sectord,e
Energy 735,556.41 735,556.41 386,146.51 305,878.26 320,170.93 290,857.51 305,225.35 386,840.00 607,310.00
Transport 91,123.59 91,123.59 45,505.58 34,743.27 44,567.87 40,025.41 36,736.88 53,234.00 83,573.00
Industry/industrial processes 79,841.03 79,841.03 35,680.17 42,278.99 52,395.40 46,480.58 48,783.74 61,819.00 97,051.00
Agriculture 103,602.53 103,602.53 66,469.10 37,372.46 33,809.10 34,507.43 36,190.30 45,895.00 72,052.00
Forestry/LULUCF -69,737.11 -69,737.11 -48,757.12 -50,840.12 -38,440.09 37,955.08 -7,289.75 0.00 0.00
Waste management/waste 10,516.80 10,516.80 9,898.41 9,865.17 10,580.85 11,033.86 11,046.12 11,267.04 11,492.38
Other (specify) 376.80 376.80 372.11 354.89 340.38 332.01 330.77 442.00 693.00
Solvents and Other Product Use 376.80 376.80 372.11 354.89 340.38 332.01 330.77 442.00 693.00
Gas
CO2 emissions including net CO2 from LULUCF 649,193.99 649,193.99 311,570.92 242,687.71 282,146.26 251,713.87 298,172.52 385,312.00 604,910.00
CO2 emissions excluding net CO2 from LULUCF 718,951.47 718,951.47 360,356.18 293,541.68 320,602.57 289,707.97 305,463.58 385,312.00 604,910.00
CH4 emissions including CH4 from LULUCF 151,649.21 151,649.21 98,977.61 75,609.26 70,224.71 63,882.49 63,330.77 84,932.79 133,338.09
CH4 emissions excluding CH4 from LULUCF 151,640.82 151,640.82 98,963.32 75,605.82 70,219.46 63,859.24 63,329.94 84,933.00 133,338.00
N2O emissions including N2O from LULUCF 59,110.02 59,110.02 39,107.13 26,498.38 26,104.49 28,968.74 32,057.00 38,507.00 60,454.00
N2O emissions excluding N2O from LULUCF 59,098.04 59,098.04 39,093.28 26,487.96 26,093.52 28,952.98 32,056.52 38,507.00 60,454.00
HFCs NA NA NA 14.12 253.76 658.05 717.42 875.00 1,374.00
PFCs 203.23 203.23 153.45 99.74 122.66 22.98 NA NA NA
SF6 0.01 0.01 0.07 0.44 4.68 10.18 8.82 14.00 21.00
Other (specify)
Total with LULUCFf 860,156.46 860,156.46 449,809.18 344,909.65 378,856.56 345,256.31 394,286.53 509,640.79 800,097.09
Total without LULUCF 929,893.57 929,893.57 498,566.30 395,749.76 417,296.65 383,211.40 401,576.28 509,641.00 800,097.00
Abbreviations : GHG = greenhouse gas, LULUCF = land use, land-use change and forestry.
a In accordance with the “Guidelines for the preparation of national communications by Parties included in Annex I to the Convention, Part II: UNFCCC reporting guidelines on national
communications”, at a minimum Parties shall report a ‘with measures’ scenario, and may report ‘without measures’ and ‘with additional measures’ scenarios. If a Party chooses to report ‘without
measures’ and/or ‘with additional measures’ scenarios they are to use tables 6(b) and/or 6(c), respectively. If a Party does not choose to report ‘without measures’ or ‘with additional measures’
scenarios then it should not include tables 6(b) or 6(c) in the biennial report.
(kt CO 2 eq)
GHG emissions and removalsb
(kt CO2 eq)
GHG emission projections

Table 6(b) UKR_BR1_v1.0
Information on updated greenhouse gas projections under a ‘without measures’ scenarioa
Base year
(1990)
1990 1995 2000 2005 2010 2011 2020 2030
(kt CO 2 eq)
GHG emissions and removalsb
(kt CO2 eq)
GHG emission projections
b Emissions and removals reported in these columns should be as reported in the latest GHG inventory and consistent with the emissions and removals reported in the table on GHG emissions and
trends provided in this biennial report. Where the sectoral breakdown differs from that reported in the GHG inventory Parties should explain in their biennial report how the inventory sectors relate
to the sectors reported in this table.
c 20XX is the reporting due-date year (i.e. 2014 for the first biennial report).
d In accordance with paragraph 34 of the “Guidelines for the preparation of national communications by Parties included in Annex I to the Convention, Part II: UNFCCC reporting guidelines on
national communications”, projections shall be presented on a sectoral basis, to the extent possible, using the same sectoral categories used in the policies and measures section. This table should
follow, to the extent possible, the same sectoral categories as those listed in paragraph 17 of those guidelines, namely, to the extent appropriate, the following sectors should be considered: energy,
transport, industry, agriculture, forestry and waste management.
e To the extent possible, the following sectors should be used: energy, transport, industry/industrial processes, agriculture, forestry/LULUCF, waste management/waste, other sectors (i.e. cross-
cutting), as appropriate.
f Parties may choose to report total emissions with or without LULUCF, as appropriate.

Table 6(c) UKR_BR1_v1.0
Information on updated greenhouse gas projections under a ‘with additional measures’ scenarioa
Base year
(1990)
1990 1995 2000 2005 2010 2011 2020 2030
Sectord,e
Energy 735,556.41 735,556.41 386,146.51 305,878.26 320,170.93 290,857.51 305,225.35 326,582.70 401,343.10
Transport 91,123.59 91,123.59 45,505.58 34,743.27 44,567.87 40,025.41 36,736.88 38,511.88 45,416.23
Industry/industrial processes 79,841.03 79,841.03 35,680.17 42,278.99 52,395.40 46,480.58 48,783.74 71,825.00 67,817.00
Agriculture 103,602.53 103,602.53 66,469.10 37,372.46 33,809.10 34,507.43 36,190.30 43,100.00 43,800.00
Forestry/LULUCF -69,737.11 -69,737.11 -48,757.12 -50,840.12 -38,440.09 37,955.08 -7,289.75 -11,339.80 -17,189.80
Waste management/waste 10,516.80 10,516.80 9,898.41 9,865.17 10,580.85 11,033.86 11,046.12 9,000.00 6,000.00
Other (specify) 376.80 376.80 372.11 354.89 340.38 332.01 330.77 365.00 450.00
Solvents and Other Product Use 376.80 376.80 372.11 354.89 340.38 332.01 330.77 365.00 450.00
Gas
CO2 emissions including net CO2 from LULUCF 649,193.99 649,193.99 311,570.92 242,687.71 282,146.26 251,713.87 298,172.52 314,763.80 368,026.40
CO2 emissions excluding net CO2 from LULUCF 718,951.47 718,951.47 360,356.18 293,541.68 320,602.57 289,707.97 305,463.58 344,542.10 403,232.70
CH4 emissions including CH4 from LULUCF 151,649.21 151,649.21 98,977.61 75,609.26 70,224.71 63,882.49 63,330.77 67,857.36 77,636.32
CH4 emissions excluding CH4 from LULUCF 151,640.82 151,640.82 98,963.32 75,605.82 70,219.46 63,859.24 63,329.94 67,853.99 77,632.33
N2O emissions including N2O from LULUCF 59,110.02 59,110.02 39,107.13 26,498.38 26,104.49 28,968.74 32,057.00 38,658.96 39,042.32
N2O emissions excluding N2O from LULUCF 59,098.04 59,098.04 39,093.28 26,487.96 26,093.52 28,952.98 32,056.52 38,656.99 39,041.23
HFCs NA NA NA 14.12 253.76 658.05 717.42 710.25 532.68
PFCs 203.23 203.23 153.45 99.74 122.66 22.98 NA NA NA
SF6 0.01 0.01 0.07 0.44 4.68 10.18 8.82 14.11 22.58
Other (specify)
Total with LULUCFf 860,156.46 860,156.46 449,809.18 344,909.65 378,856.56 345,256.31 394,286.53 422,004.48 485,260.30
Total without LULUCF 929,893.57 929,893.57 498,566.30 395,749.76 417,296.65 383,211.40 401,576.28 451,777.44 520,461.52
Abbreviations : GHG = greenhouse gas, LULUCF = land use, land-use change and forestry.
a In accordance with the “Guidelines for the preparation of national communications by Parties included in Annex I to the Convention, Part II: UNFCCC reporting guidelines on national
communications”, at a minimum Parties shall report a ‘with measures’ scenario, and may report ‘without measures’ and ‘with additional measures’ scenarios. If a Party chooses to report ‘without
measures’ and/or ‘with additional measures’ scenarios they are to use tables 6(b) and/or 6(c), respectively. If a Party does not choose to report ‘without measures’ or ‘with additional measures’
scenarios then it should not include tables 6(b) or 6(c) in the biennial report.
(kt CO 2 eq)
GHG emissions and removalsb
(kt CO2 eq)
GHG emission projections
Table 6(c) UKR_BR1_v1.0
Information on updated greenhouse gas projections under a ‘with additional measures’ scenarioa
Base year
(1990)
1990 1995 2000 2005 2010 2011 2020 2030
(kt CO 2 eq)
GHG emissions and removalsb
(kt CO2 eq)
GHG emission projections
f Parties may choose to report total emissions with or without LULUCF, as appropriate.
b Emissions and removals reported in these columns should be as reported in the latest GHG inventory and consistent with the emissions and removals reported in the table on GHG emissions and
trends provided in this biennial report. Where the sectoral breakdown differs from that reported in the GHG inventory Parties should explain in their biennial report how the inventory sectors relate
to the sectors reported in this table.
c 20XX is the reporting due-date year (i.e. 2014 for the first biennial report).
d In accordance with paragraph 34 of the “Guidelines for the preparation of national communications by Parties included in Annex I to the Convention, Part II: UNFCCC reporting guidelines on
national communications”, projections shall be presented on a sectoral basis, to the extent possible, using the same sectoral categories used in the policies and measures section. This table should
follow, to the extent possible, the same sectoral categories as those listed in paragraph 17 of those guidelines, namely, to the extent appropriate, the following sectors should be considered: energy,
transport, industry, agriculture, forestry and waste management.
e To the extent possible, the following sectors should be used: energy, transport, industry/industrial processes, agriculture, forestry/LULUCF, waste management/waste, other sectors (i.e. cross-
cutting), as appropriate.

Table 7 UKR_BR1_v1.0
Provision of public financial support: summary information in 2011a
Mitigation AdaptationCross-
cuttinge Other
f Mitigation AdaptationCross-
cuttinge Other
f
Total contributions through multilateral channels:
Multilateral climate change fundsg
Other multilateral climate change fundsh
Multilateral financial institutions, including regional
development banks
Specialized United Nations bodies
Total contributions through bilateral, regional and other
channels
Total
Abbreviation: USD = United States dollars.
a Parties should fill in a separate table for each year, namely 2011 and 2012, where 2014 is the reporting year.
b Parties should provide an explanation on methodology used for currency exchange for the information provided in table 7, 7(a) and 7(b) in the box below.
c This refers to support to multilateral institutions that Parties cannot specify as climate-specific.
d Parties should explain in their biennial reports how they define funds as being climate-specific.
e This refers to funding for activities which are cross-cutting across mitigation and adaptation.
f Please specify.
g Multilateral climate change funds listed in paragraph 17(a) of the “UNFCCC biennial reporting guidelines for developed country Parties” in decision 2/CP.17.
h Other multilateral climate change funds as referred in paragraph 17(b) of the “UNFCCC biennial reporting guidelines for developed country Parties” in decision 2/CP.17.
Custom Footnotes
Documentation Box:
Each Party shall provide an indication of what new and additional financial resources they have provided, and clarify how they have determined that such resources are new and additional. Please provide
this information in relation to table 7(a) and table 7(b).
Ukrainian hryvnia - UAH
Climate-specificd
USDb
Allocation channels
Year
Climate-specificd
Core/
generalc
Core/
generalc
*Ukraine as a country not included in Annex 2 to the UNFCCC, as a country with economy in transition, has not financial commitments according to the articles 4.3, 4.4 and 4.5 of the UNFCCC.

Table 7 UKR_BR1_v1.0
Provision of public financial support: summary information in 2012a
Mitigation AdaptationCross-
cuttinge Other
f Mitigation AdaptationCross-
cuttinge Other
f
Total contributions through multilateral channels:
Multilateral climate change fundsg
Other multilateral climate change fundsh
Multilateral financial institutions, including regional
development banks
Specialized United Nations bodies
Total contributions through bilateral, regional and other
channels
Total
Abbreviation: USD = United States dollars.
a Parties should fill in a separate table for each year, namely 2011 and 2012, where 2014 is the reporting year.
b Parties should provide an explanation on methodology used for currency exchange for the information provided in table 7, 7(a) and 7(b) in the box below.
c This refers to support to multilateral institutions that Parties cannot specify as climate-specific.
d Parties should explain in their biennial reports how they define funds as being climate-specific.
e This refers to funding for activities which are cross-cutting across mitigation and adaptation.
f Please specify.
g Multilateral climate change funds listed in paragraph 17(a) of the “UNFCCC biennial reporting guidelines for developed country Parties” in decision 2/CP.17.
h Other multilateral climate change funds as referred in paragraph 17(b) of the “UNFCCC biennial reporting guidelines for developed country Parties” in decision 2/CP.17.
Custom Footnotes
Documentation Box:
Each Party shall provide an indication of what new and additional financial resources they have provided, and clarify how they have determined that such resources are new and additional. Please provide
this information in relation to table 7(a) and table 7(b).
Year
Ukrainian hryvnia - UAH USDb
Core/
generalc
Climate-specificd
Core/
generalc
Climate-specificdAllocation channels
*Ukraine as a country not included in Annex 2 to the UNFCCC, as a country with economy in transition, has not financial commitments according to the articles 4.3, 4.4 and 4.5 of the UNFCCC.

Table 7(a) UKR_BR1_v1.0
Provision of public financial support: contribution through multilateral channels in 2011a
Ukrainian hryvnia -
UAHUSD
Ukrainian hryvnia -
UAHUSD
Total contributions through multilateral channels
Multilateral climate change funds g
1. Global Environment Facility
2. Least Developed Countries Fund
3. Special Climate Change Fund
4. Adaptation Fund
5. Green Climate Fund
6. UNFCCC Trust Fund for Supplementary Activities
7. Other multilateral climate change funds
Multilateral financial institutions, including regional development banks
1. World Bank
2. International Finance Corporation
3. African Development Bank
4. Asian Development Bank
5. European Bank for Reconstruction and Development
6. Inter-American Development Bank
7. Other
Specialized United Nations bodies
1. United Nations Development Programme
2. United Nations Environment Programme
3. Other
Custom Footnotes
d This refers to support to multilateral institutions that Parties cannot specify as climate-specific.
e Parties should explain in their biennial reports how they define funds as being climate-specific.
*Ukraine as a country not included in Annex 2 to the UNFCCC, as a country with economy in transition, has not financial commitments according to the articles 4.3, 4.4 and 4.5 of the UNFCCC.
Donor funding Core/generald
c Parties may select several applicable sectors. Parties may report sectoral distribution, as applicable, under “Other”.
Total amount
Climate-specifice
Statusb
Funding sourcef
Financial
instrumentf Type of support
f, gSector
c
Abbreviations: ODA = official development assistance, OOF = other official flows.
a Parties should fill in a separate table for each year, namely 2011 and 2012, where 2014 is the reporting year.
b Parties should explain, in their biennial reports, the methodologies used to specify the funds as provided, committed and/or pledged. Parties will provide the information for as many status categories as appropriate in the following order of priority: provided, committed,
pledged.
f Please specify.
g Cross-cutting type of support refers to funding for activities which are cross-cutting across mitigation and adaptation.

Table 7(a) UKR_BR1_v1.0
Provision of public financial support: contribution through multilateral channels in 2012a
Ukrainian hryvnia -
UAHUSD
Ukrainian hryvnia -
UAHUSD
Total contributions through multilateral channels
Multilateral climate change funds g
1. Global Environment Facility
2. Least Developed Countries Fund
3. Special Climate Change Fund
4. Adaptation Fund
5. Green Climate Fund
6. UNFCCC Trust Fund for Supplementary Activities
7. Other multilateral climate change funds
Multilateral financial institutions, including regional development banks
1. World Bank
2. International Finance Corporation
3. African Development Bank
4. Asian Development Bank
5. European Bank for Reconstruction and Development
6. Inter-American Development Bank
7. Other
Specialized United Nations bodies
1. United Nations Development Programme
2. United Nations Environment Programme
3. Other
Custom Footnotes
g Cross-cutting type of support refers to funding for activities which are cross-cutting across mitigation and adaptation.
e Parties should explain in their biennial reports how they define funds as being climate-specific.
d This refers to support to multilateral institutions that Parties cannot specify as climate-specific.
*Ukraine as a country not included in Annex 2 to the UNFCCC, as a country with economy in transition, has not financial commitments according to the articles 4.3, 4.4 and 4.5 of the UNFCCC.
c Parties may select several applicable sectors. Parties may report sectoral distribution, as applicable, under “Other”.
Donor funding
Total amount
Statusb
Funding sourcef
Financial
instrumentf Type of support
f, gCore/generald
SectorcClimate-specific
e
Abbreviations: ODA = official development assistance, OOF = other official flows.
a Parties should fill in a separate table for each year, namely 2011 and 2012, where 2014 is the reporting year.
b Parties should explain, in their biennial reports, the methodologies used to specify the funds as provided, committed and/or pledged. Parties will provide the information for as many status categories as appropriate in the following order of priority: provided, committed,
pledged.
f Please specify.

Table 7(b) UKR_BR1_v1.0
Provision of public financial support: contribution through bilateral, regional and other channels in 2011a
Ukrainian
hryvnia - USD
Total contributions through bilateral,
regional and other channels
Abbreviations: ODA = official development assistance, OOF = other official flows; USD = United States dollars.
Custom Footnotes
a Parties should fill in a separate table for each year, namely 2011 and 2012, where 2014 is the reporting year.
b Parties should report, to the extent possible, on details contained in this table.
c Parties should explain, in their biennial reports, the methodologies used to specify the funds as provided, committed and/or pledged. Parties will provide the information for as
many status categories as appropriate in the following order of priority: provided, committed, pledged.
Sectord
Additional informatione
Total amount
Recipient country/
region/project/programmeb
Climate-specificf
Statusc
Funding
sourceg
Financial
instrumentg
Type of
supportg, h
*Ukraine as a country not included in Annex 2 to the UNFCCC, as a country with economy in transition, has not financial commitments according to the articles 4.3, 4.4 and 4.5 of
the UNFCCC.
d Parties may select several applicable sectors. Parties may report sectoral distribution, as applicable, under “Other”.
e Parties should report, as appropriate, on project details and the implementing agency.
f Parties should explain in their biennial reports how they define funds as being climate-specific.
g Please specify.
h Cross-cutting type of support refers to funding for activities which are cross-cutting across mitigation and adaptation.

Table 7(b) UKR_BR1_v1.0
Provision of public financial support: contribution through bilateral, regional and other channels in 2012a
Ukrainian
hryvnia - USD
Total contributions through bilateral,
regional and other channels
Abbreviations: ODA = official development assistance, OOF = other official flows; USD = United States dollars.
Custom Footnotes
c Parties should explain, in their biennial reports, the methodologies used to specify the funds as provided, committed and/or pledged. Parties will provide the information for as
many status categories as appropriate in the following order of priority: provided, committed, pledged.
Recipient country/
region/project/programmeb
Total amount
Statusc
Funding
sourceg
Financial
instrumentg
Type of
supportg, h Sector
dAdditional information
eClimate-specificf
a Parties should fill in a separate table for each year, namely 2011 and 2012, where 2014 is the reporting year.
b Parties should report, to the extent possible, on details contained in this table.
*Ukraine as a country not included in Annex 2 to the UNFCCC, as a country with economy in transition, has not financial commitments according to the articles 4.3, 4.4 and 4.5 of
the UNFCCC.
d Parties may select several applicable sectors. Parties may report sectoral distribution, as applicable, under “Other”.
e Parties should report, as appropriate, on project details and the implementing agency.
f Parties should explain in their biennial reports how they define funds as being climate-specific.
g Please specify.
h Cross-cutting type of support refers to funding for activities which are cross-cutting across mitigation and adaptation.
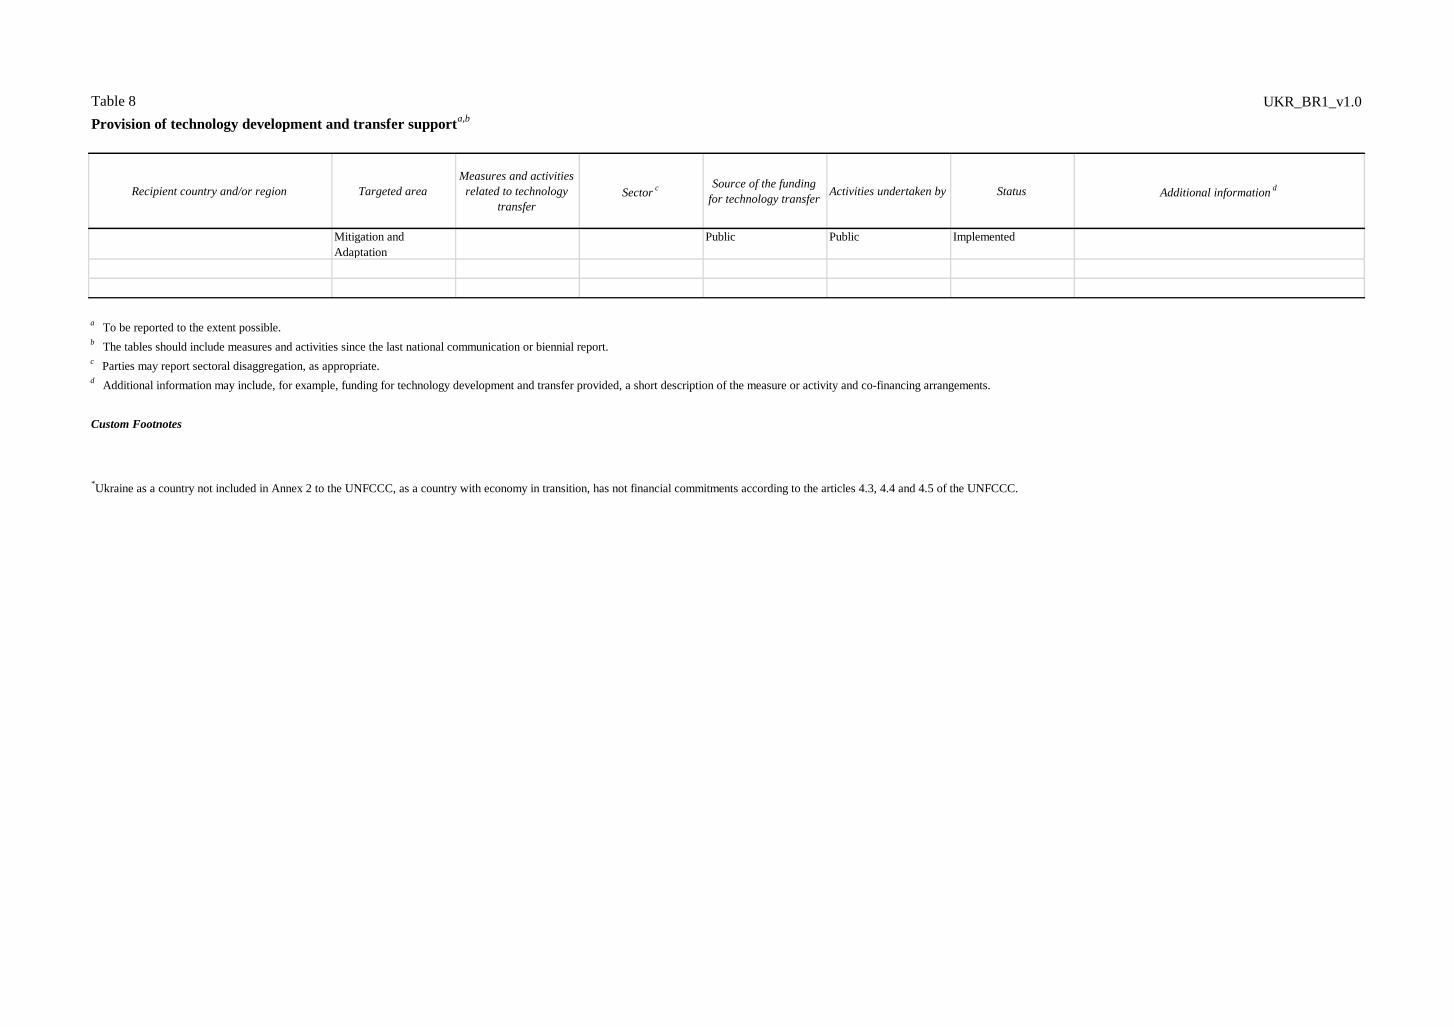
Table 8 UKR_BR1_v1.0
Provision of technology development and transfer supporta,b
Recipient country and/or region Targeted area
Measures and activities
related to technology
transfer
Sectorc Source of the funding
for technology transferActivities undertaken by Status Additional information
d
Mitigation and
Adaptation
Public Public Implemented
a To be reported to the extent possible.
Custom Footnotes
b The tables should include measures and activities since the last national communication or biennial report.
c Parties may report sectoral disaggregation, as appropriate.
d Additional information may include, for example, funding for technology development and transfer provided, a short description of the measure or activity and co-financing arrangements.
*Ukraine as a country not included in Annex 2 to the UNFCCC, as a country with economy in transition, has not financial commitments according to the articles 4.3, 4.4 and 4.5 of the UNFCCC.

Table 9 UKR_BR1_v1.0
Provision of capacity-building supporta
Recipient country/region Targeted area Programme or project title Description of programme or project b,c
a To be reported to the extent possible.
c Additional information may be provided on, for example, the measure or activity and co-financing arrangements.
Custom Footnotes
b Each Party included in Annex II to the Convention shall provide information, to the extent possible, on how it has provided capacity-building support that responds
to the existing and emerging capacity-building needs identified by Parties not included in Annex I to the Convention in the areas of mitigation, adaptation and
technology development and transfer.
*Ukraine as a country not included in Annex 2 to the UNFCCC, as a country with economy in transition, has not financial commitments according to the articles 4.3,
4.4 and 4.5 of the UNFCCC.