Embed Size (px)
Citation preview
Braddock Multi-Strategy Income Fund (Class A: BDKAX) (Class C: BDKCX)
(Institutional Class: BDKNX)
SEMI-ANNUAL REPORT June 30, 2016
Braddock Multi-Strategy Income Fund A series of Investment Managers Series Trust
This report and the financial statements contained herein are provided for the general information of the shareholders of the Braddock Multi-Strategy Income Fund. This report is not authorized for distribution to prospective investors in the Fund unless preceded or accompanied by an effective prospectus.
www.libertystreetfunds.com
Table of Contents
Schedule of Investments ............................................................................................................................... 1
Statement of Assets and Liabilities ............................................................................................................... 8
Statement of Operations ............................................................................................................................ 10
Statements of Changes in Net Assets ......................................................................................................... 11
Financial Highlights ..................................................................................................................................... 12
Notes to Financial Statements .................................................................................................................... 15
Expense Examples ....................................................................................................................................... 22
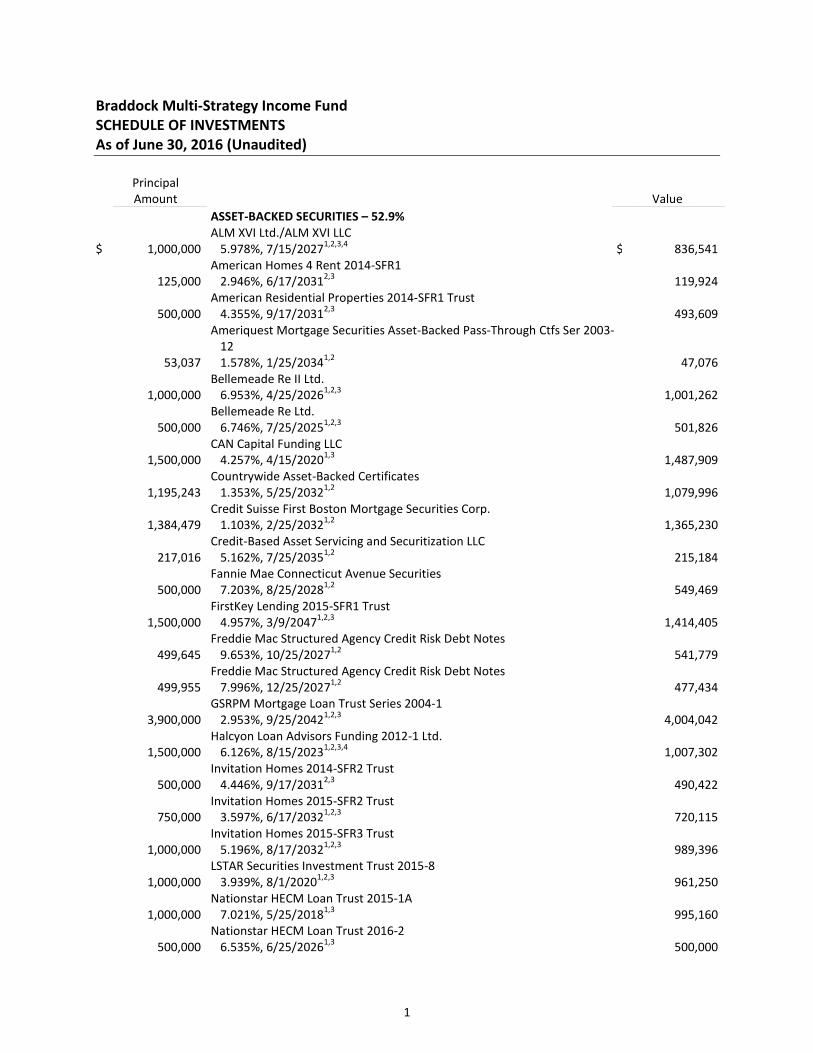
Braddock Multi-Strategy Income Fund SCHEDULE OF INVESTMENTS As of June 30, 2016 (Unaudited)
Principal Amount Value __________ ____________
ASSET-BACKED SECURITIES – 52.9%
$ 1,000,000 ALM XVI Ltd./ALM XVI LLC
5.978%, 7/15/20271,2,3,4 $ 836,541
125,000 American Homes 4 Rent 2014-SFR1
2.946%, 6/17/20312,3 119,924
500,000 American Residential Properties 2014-SFR1 Trust
4.355%, 9/17/20312,3 493,609
53,037
Ameriquest Mortgage Securities Asset-Backed Pass-Through Ctfs Ser 2003-12 1.578%, 1/25/20341,2 47,076
1,000,000 Bellemeade Re II Ltd.
6.953%, 4/25/20261,2,3 1,001,262
500,000 Bellemeade Re Ltd.
6.746%, 7/25/20251,2,3 501,826
1,500,000 CAN Capital Funding LLC
4.257%, 4/15/20201,3 1,487,909
1,195,243 Countrywide Asset-Backed Certificates
1.353%, 5/25/20321,2 1,079,996
1,384,479 Credit Suisse First Boston Mortgage Securities Corp.
1.103%, 2/25/20321,2 1,365,230
217,016 Credit-Based Asset Servicing and Securitization LLC
5.162%, 7/25/20351,2 215,184
500,000 Fannie Mae Connecticut Avenue Securities
7.203%, 8/25/20281,2 549,469
1,500,000 FirstKey Lending 2015-SFR1 Trust
4.957%, 3/9/20471,2,3 1,414,405
499,645 Freddie Mac Structured Agency Credit Risk Debt Notes
9.653%, 10/25/20271,2 541,779
499,955 Freddie Mac Structured Agency Credit Risk Debt Notes
7.996%, 12/25/20271,2 477,434
3,900,000 GSRPM Mortgage Loan Trust Series 2004-1
2.953%, 9/25/20421,2,3 4,004,042
1,500,000 Halcyon Loan Advisors Funding 2012-1 Ltd.
6.126%, 8/15/20231,2,3,4 1,007,302
500,000 Invitation Homes 2014-SFR2 Trust
4.446%, 9/17/20312,3 490,422
750,000 Invitation Homes 2015-SFR2 Trust
3.597%, 6/17/20321,2,3 720,115
1,000,000 Invitation Homes 2015-SFR3 Trust
5.196%, 8/17/20321,2,3 989,396
1,000,000 LSTAR Securities Investment Trust 2015-8
3.939%, 8/1/20201,2,3 961,250
1,000,000 Nationstar HECM Loan Trust 2015-1A
7.021%, 5/25/20181,3 995,160
500,000 Nationstar HECM Loan Trust 2016-2
6.535%, 6/25/20261,3 500,000
1
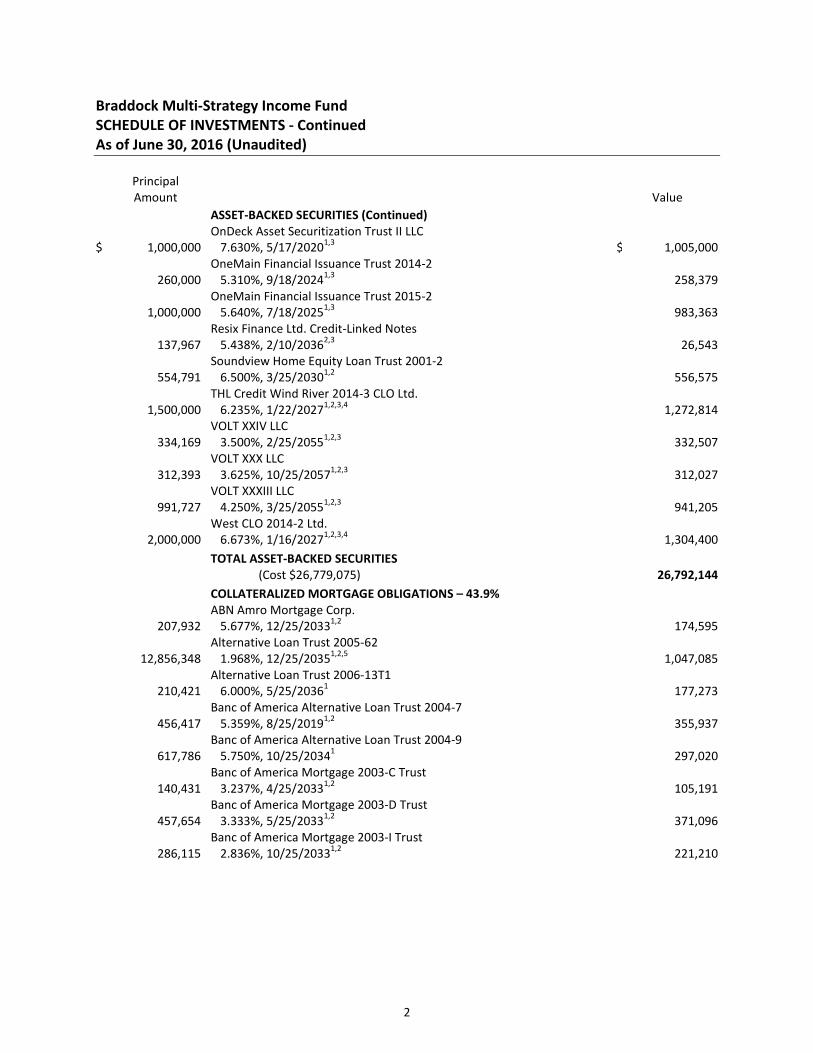
Braddock Multi-Strategy Income Fund SCHEDULE OF INVESTMENTS - Continued As of June 30, 2016 (Unaudited)
Principal Amount Value __________ ____________
ASSET-BACKED SECURITIES (Continued)
$ 1,000,000 OnDeck Asset Securitization Trust II LLC
7.630%, 5/17/20201,3 $ 1,005,000
260,000 OneMain Financial Issuance Trust 2014-2
5.310%, 9/18/20241,3 258,379
1,000,000 OneMain Financial Issuance Trust 2015-2
5.640%, 7/18/20251,3 983,363
137,967 Resix Finance Ltd. Credit-Linked Notes
5.438%, 2/10/20362,3 26,543
554,791 Soundview Home Equity Loan Trust 2001-2
6.500%, 3/25/20301,2 556,575
1,500,000 THL Credit Wind River 2014-3 CLO Ltd.
6.235%, 1/22/20271,2,3,4 1,272,814
334,169 VOLT XXIV LLC
3.500%, 2/25/20551,2,3 332,507
312,393 VOLT XXX LLC
3.625%, 10/25/20571,2,3 312,027
991,727 VOLT XXXIII LLC
4.250%, 3/25/20551,2,3 941,205
2,000,000 West CLO 2014-2 Ltd.
6.673%, 1/16/20271,2,3,4 1,304,400 ____________
TOTAL ASSET-BACKED SECURITIES (Cost $26,779,075) 26,792,144 ____________
COLLATERALIZED MORTGAGE OBLIGATIONS – 43.9%
207,932 ABN Amro Mortgage Corp.
5.677%, 12/25/20331,2 174,595
12,856,348 Alternative Loan Trust 2005-62
1.968%, 12/25/20351,2,5 1,047,085
210,421 Alternative Loan Trust 2006-13T1
6.000%, 5/25/20361 177,273
456,417 Banc of America Alternative Loan Trust 2004-7
5.359%, 8/25/20191,2 355,937
617,786 Banc of America Alternative Loan Trust 2004-9
5.750%, 10/25/20341 297,020
140,431 Banc of America Mortgage 2003-C Trust
3.237%, 4/25/20331,2 105,191
457,654 Banc of America Mortgage 2003-D Trust
3.333%, 5/25/20331,2 371,096
286,115 Banc of America Mortgage 2003-I Trust
2.836%, 10/25/20331,2 221,210
2
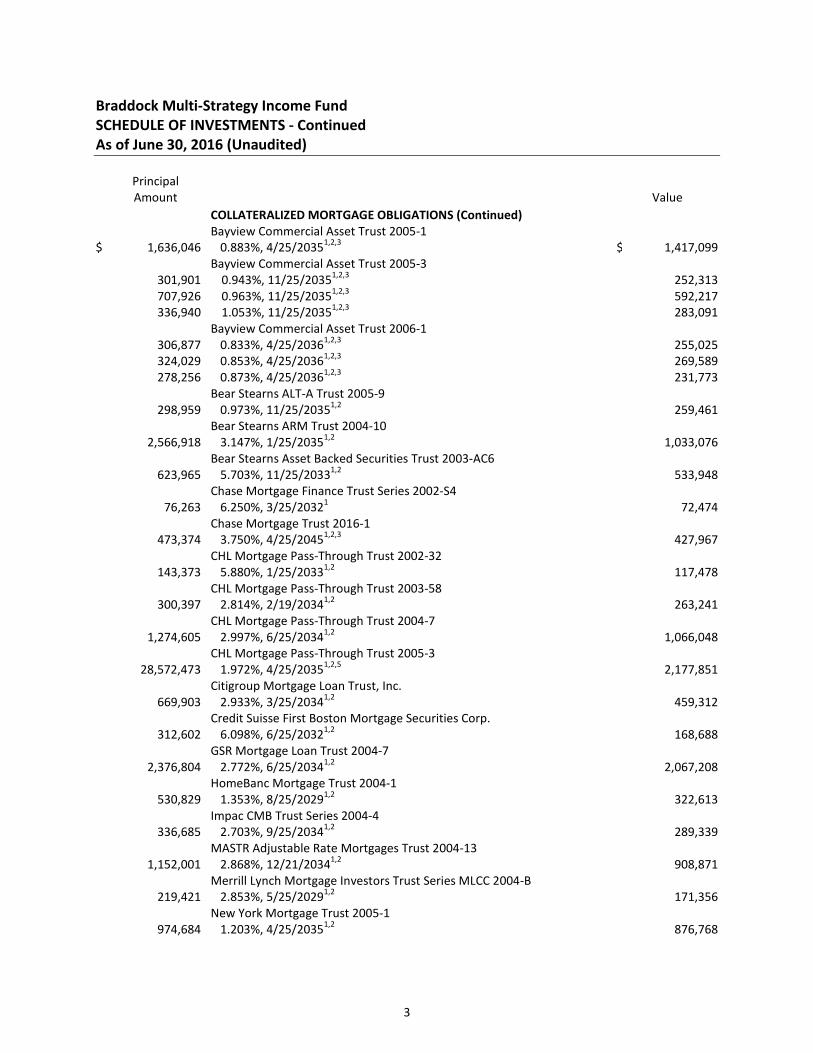
Braddock Multi-Strategy Income Fund SCHEDULE OF INVESTMENTS - Continued As of June 30, 2016 (Unaudited)
Principal Amount Value __________ ____________
COLLATERALIZED MORTGAGE OBLIGATIONS (Continued)
$ 1,636,046 Bayview Commercial Asset Trust 2005-1
0.883%, 4/25/20351,2,3 $ 1,417,099
Bayview Commercial Asset Trust 2005-3 301,901 0.943%, 11/25/20351,2,3 252,313
707,926 0.963%, 11/25/20351,2,3 592,217
336,940 1.053%, 11/25/20351,2,3 283,091
Bayview Commercial Asset Trust 2006-1 306,877 0.833%, 4/25/20361,2,3 255,025
324,029 0.853%, 4/25/20361,2,3 269,589
278,256 0.873%, 4/25/20361,2,3 231,773
298,959 Bear Stearns ALT-A Trust 2005-9
0.973%, 11/25/20351,2 259,461
2,566,918 Bear Stearns ARM Trust 2004-10
3.147%, 1/25/20351,2 1,033,076
623,965 Bear Stearns Asset Backed Securities Trust 2003-AC6
5.703%, 11/25/20331,2 533,948
76,263 Chase Mortgage Finance Trust Series 2002-S4
6.250%, 3/25/20321 72,474
473,374 Chase Mortgage Trust 2016-1
3.750%, 4/25/20451,2,3 427,967
143,373 CHL Mortgage Pass-Through Trust 2002-32
5.880%, 1/25/20331,2 117,478
300,397 CHL Mortgage Pass-Through Trust 2003-58
2.814%, 2/19/20341,2 263,241
1,274,605 CHL Mortgage Pass-Through Trust 2004-7
2.997%, 6/25/20341,2 1,066,048
28,572,473 CHL Mortgage Pass-Through Trust 2005-3
1.972%, 4/25/20351,2,5 2,177,851
669,903 Citigroup Mortgage Loan Trust, Inc.
2.933%, 3/25/20341,2 459,312
312,602 Credit Suisse First Boston Mortgage Securities Corp.
6.098%, 6/25/20321,2 168,688
2,376,804 GSR Mortgage Loan Trust 2004-7
2.772%, 6/25/20341,2 2,067,208
530,829 HomeBanc Mortgage Trust 2004-1
1.353%, 8/25/20291,2 322,613
336,685 Impac CMB Trust Series 2004-4
2.703%, 9/25/20341,2 289,339
1,152,001 MASTR Adjustable Rate Mortgages Trust 2004-13
2.868%, 12/21/20341,2 908,871
219,421 Merrill Lynch Mortgage Investors Trust Series MLCC 2004-B
2.853%, 5/25/20291,2 171,356
974,684 New York Mortgage Trust 2005-1
1.203%, 4/25/20351,2 876,768
3
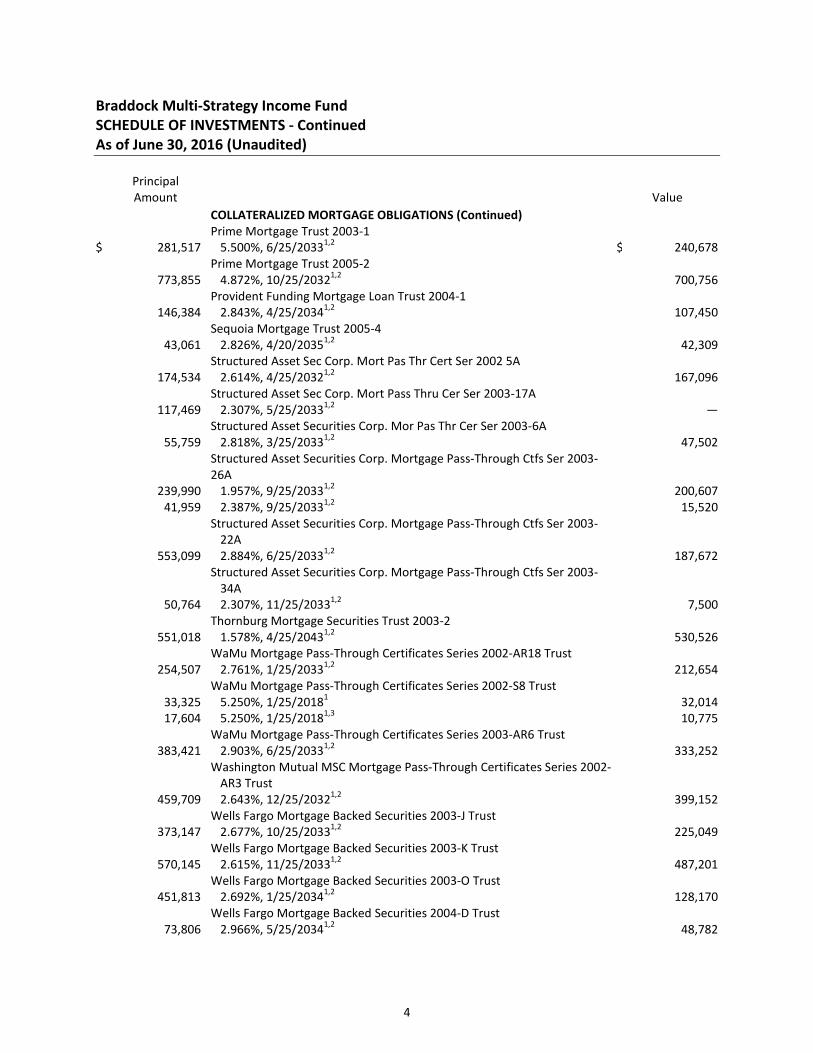
Braddock Multi-Strategy Income Fund SCHEDULE OF INVESTMENTS - Continued As of June 30, 2016 (Unaudited)
Principal Amount Value __________ ____________
COLLATERALIZED MORTGAGE OBLIGATIONS (Continued)
$ 281,517 Prime Mortgage Trust 2003-1
5.500%, 6/25/20331,2 $ 240,678
773,855 Prime Mortgage Trust 2005-2
4.872%, 10/25/20321,2 700,756
146,384 Provident Funding Mortgage Loan Trust 2004-1
2.843%, 4/25/20341,2 107,450
43,061 Sequoia Mortgage Trust 2005-4
2.826%, 4/20/20351,2 42,309
174,534 Structured Asset Sec Corp. Mort Pas Thr Cert Ser 2002 5A
2.614%, 4/25/20321,2 167,096
117,469 Structured Asset Sec Corp. Mort Pass Thru Cer Ser 2003-17A
2.307%, 5/25/20331,2 —
55,759 Structured Asset Securities Corp. Mor Pas Thr Cer Ser 2003-6A
2.818%, 3/25/20331,2 47,502
Structured Asset Securities Corp. Mortgage Pass-Through Ctfs Ser 2003- 26A
239,990 1.957%, 9/25/20331,2 200,607
41,959 2.387%, 9/25/20331,2 15,520
553,099
Structured Asset Securities Corp. Mortgage Pass-Through Ctfs Ser 2003-22A 2.884%, 6/25/20331,2 187,672
50,764
Structured Asset Securities Corp. Mortgage Pass-Through Ctfs Ser 2003-34A 2.307%, 11/25/20331,2 7,500
551,018 Thornburg Mortgage Securities Trust 2003-2
1.578%, 4/25/20431,2 530,526
254,507 WaMu Mortgage Pass-Through Certificates Series 2002-AR18 Trust
2.761%, 1/25/20331,2 212,654
WaMu Mortgage Pass-Through Certificates Series 2002-S8 Trust 33,325 5.250%, 1/25/20181 32,014
17,604 5.250%, 1/25/20181,3 10,775
383,421 WaMu Mortgage Pass-Through Certificates Series 2003-AR6 Trust
2.903%, 6/25/20331,2 333,252
459,709
Washington Mutual MSC Mortgage Pass-Through Certificates Series 2002-AR3 Trust 2.643%, 12/25/20321,2 399,152
373,147 Wells Fargo Mortgage Backed Securities 2003-J Trust
2.677%, 10/25/20331,2 225,049
570,145 Wells Fargo Mortgage Backed Securities 2003-K Trust
2.615%, 11/25/20331,2 487,201
451,813 Wells Fargo Mortgage Backed Securities 2003-O Trust
2.692%, 1/25/20341,2 128,170
73,806 Wells Fargo Mortgage Backed Securities 2004-D Trust
2.966%, 5/25/20341,2 48,782
4
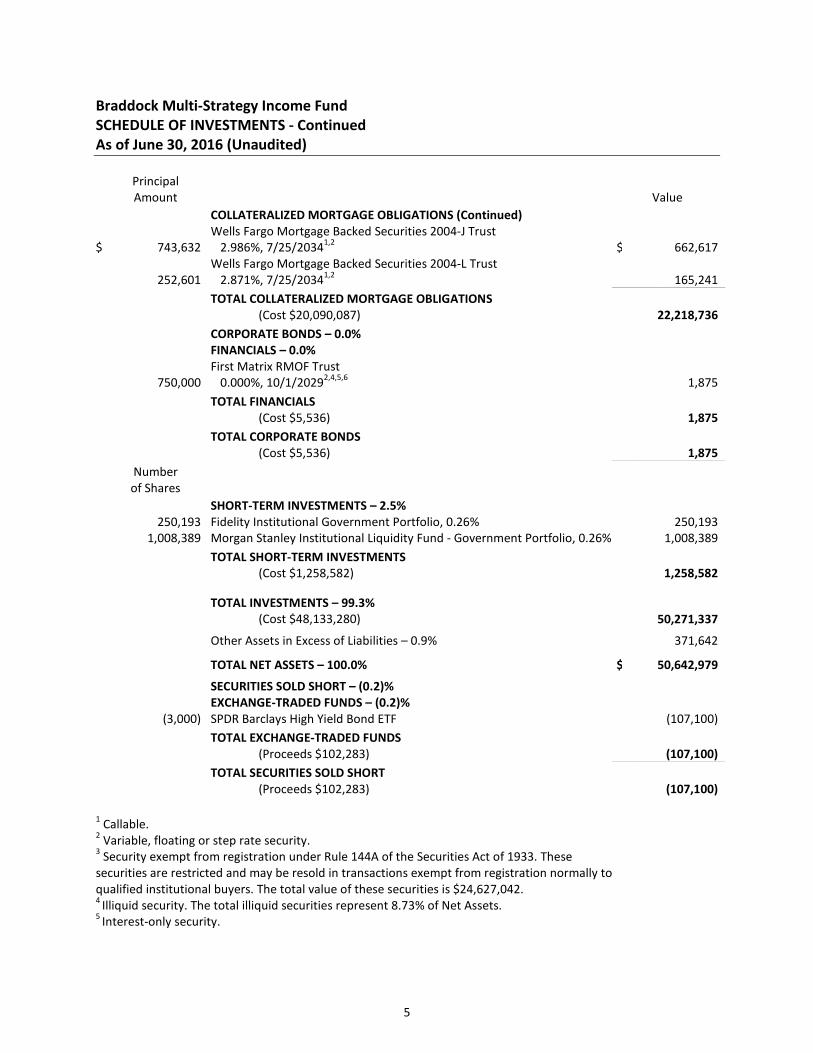
Braddock Multi-Strategy Income Fund SCHEDULE OF INVESTMENTS - Continued As of June 30, 2016 (Unaudited)
Principal Amount Value __________ ____________
COLLATERALIZED MORTGAGE OBLIGATIONS (Continued)
$ 743,632 Wells Fargo Mortgage Backed Securities 2004-J Trust
2.986%, 7/25/20341,2 $ 662,617
252,601 Wells Fargo Mortgage Backed Securities 2004-L Trust
2.871%, 7/25/20341,2 165,241 ____________
TOTAL COLLATERALIZED MORTGAGE OBLIGATIONS (Cost $20,090,087) 22,218,736 ____________
CORPORATE BONDS – 0.0%
FINANCIALS – 0.0%
750,000 First Matrix RMOF Trust
0.000%, 10/1/20292,4,5,6 1,875 ____________
TOTAL FINANCIALS (Cost $5,536) 1,875 ____________
TOTAL CORPORATE BONDS (Cost $5,536) 1,875 ____________
Number of Shares __________
SHORT-TERM INVESTMENTS – 2.5%
250,193 Fidelity Institutional Government Portfolio, 0.26% 250,193
1,008,389 Morgan Stanley Institutional Liquidity Fund - Government Portfolio, 0.26% 1,008,389 ____________
TOTAL SHORT-TERM INVESTMENTS (Cost $1,258,582) 1,258,582 ____________
TOTAL INVESTMENTS – 99.3% (Cost $48,133,280) 50,271,337
Other Assets in Excess of Liabilities – 0.9% 371,642 ____________ TOTAL NET ASSETS – 100.0% $ 50,642,979 ____________ ____________ SECURITIES SOLD SHORT – (0.2)%
EXCHANGE-TRADED FUNDS – (0.2)%
(3,000) SPDR Barclays High Yield Bond ETF (107,100) ____________
TOTAL EXCHANGE-TRADED FUNDS (Proceeds $102,283) (107,100) ____________
TOTAL SECURITIES SOLD SHORT (Proceeds $102,283) (107,100) ____________
1 Callable. 2 Variable, floating or step rate security. 3 Security exempt from registration under Rule 144A of the Securities Act of 1933. These securities are restricted and may be resold in transactions exempt from registration normally to qualified institutional buyers. The total value of these securities is $24,627,042. 4 Illiquid security. The total illiquid securities represent 8.73% of Net Assets. 5
Interest-only security.
5

Braddock Multi-Strategy Income Fund SCHEDULE OF INVESTMENTS - Continued As of June 30, 2016 (Unaudited) 6 Fair valued under procedures established by the Board of Trustees, represents 0.00% of Net Assets. The total value of these securities is $1,875. See accompanying Notes to Financial Statements.
6
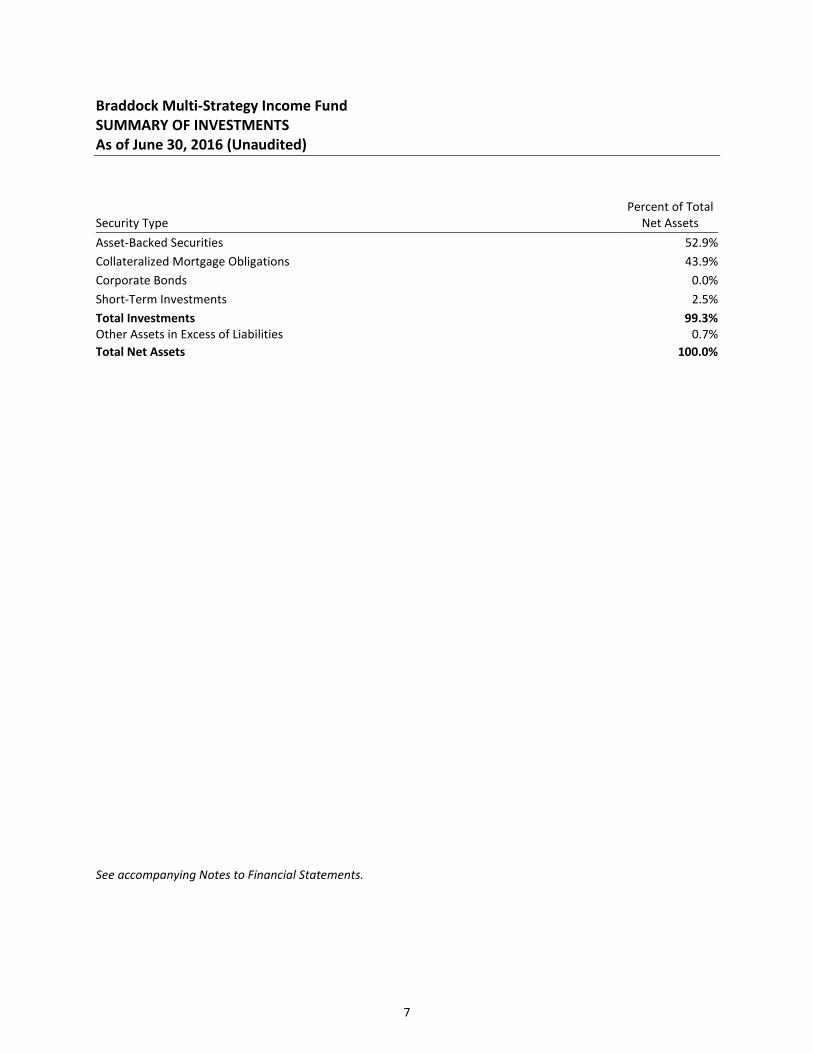
Braddock Multi-Strategy Income Fund SUMMARY OF INVESTMENTS As of June 30, 2016 (Unaudited)
Security Type Percent of Total
Net Assets Asset-Backed Securities 52.9% Collateralized Mortgage Obligations 43.9% Corporate Bonds 0.0% Short-Term Investments 2.5% __________ Total Investments 99.3% Other Assets in Excess of Liabilities 0.7% __________ Total Net Assets 100.0%
See accompanying Notes to Financial Statements.
7
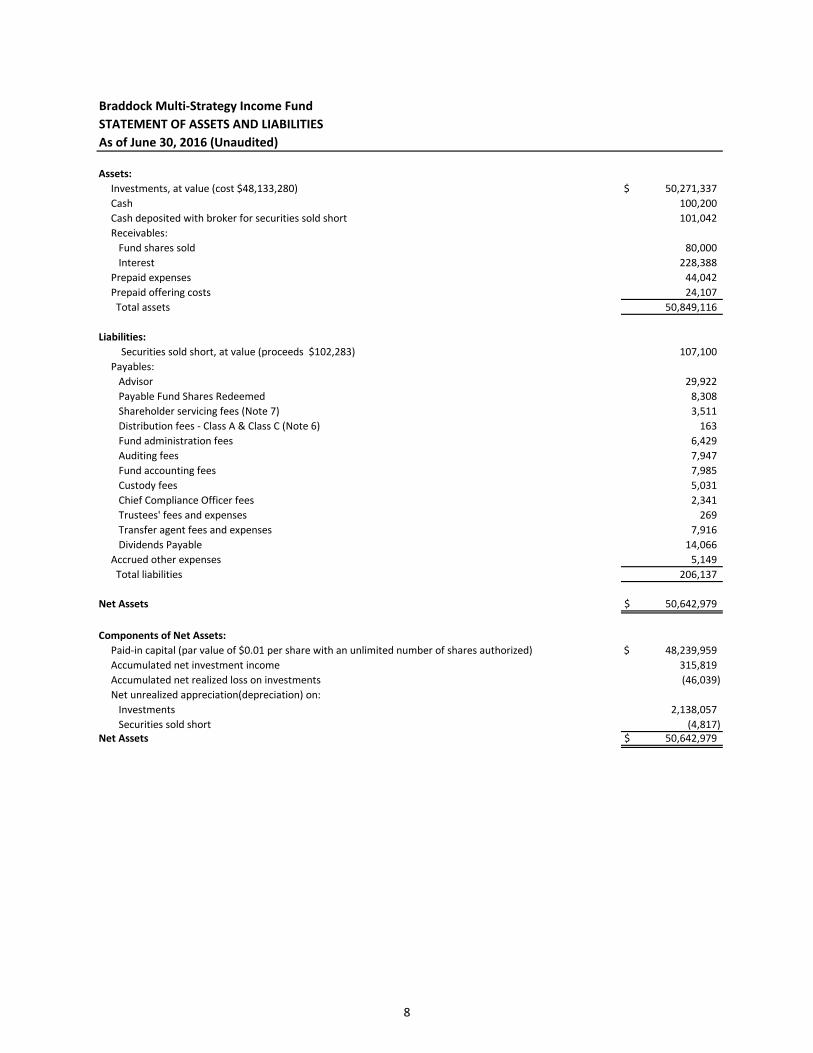
Braddock Multi-Strategy Income Fund
STATEMENT OF ASSETS AND LIABILITIES
Assets:
Investments, at value (cost $48,133,280) $ 50,271,337
Cash 100,200
Cash deposited with broker for securities sold short 101,042
Receivables:
Fund shares sold 80,000
Interest 228,388
Prepaid expenses 44,042
Prepaid offering costs 24,107
Total assets 50,849,116
Liabilities:
Securities sold short, at value (proceeds $102,283) 107,100
Payables:
Advisor 29,922
Payable Fund Shares Redeemed 8,308
Shareholder servicing fees (Note 7) 3,511
Distribution fees - Class A & Class C (Note 6) 163
Fund administration fees 6,429
Auditing fees 7,947
Fund accounting fees 7,985
Custody fees 5,031
Chief Compliance Officer fees 2,341
Trustees' fees and expenses 269
Transfer agent fees and expenses 7,916
Dividends Payable 14,066
Accrued other expenses 5,149
Total liabilities 206,137
Net Assets $ 50,642,979
Components of Net Assets:
Paid-in capital (par value of $0.01 per share with an unlimited number of shares authorized) $ 48,239,959
Accumulated net investment income 315,819
Accumulated net realized loss on investments (46,039)
Net unrealized appreciation(depreciation) on:
Investments 2,138,057
Securities sold short (4,817)Net Assets $ 50,642,979
As of June 30, 2016 (Unaudited)
8
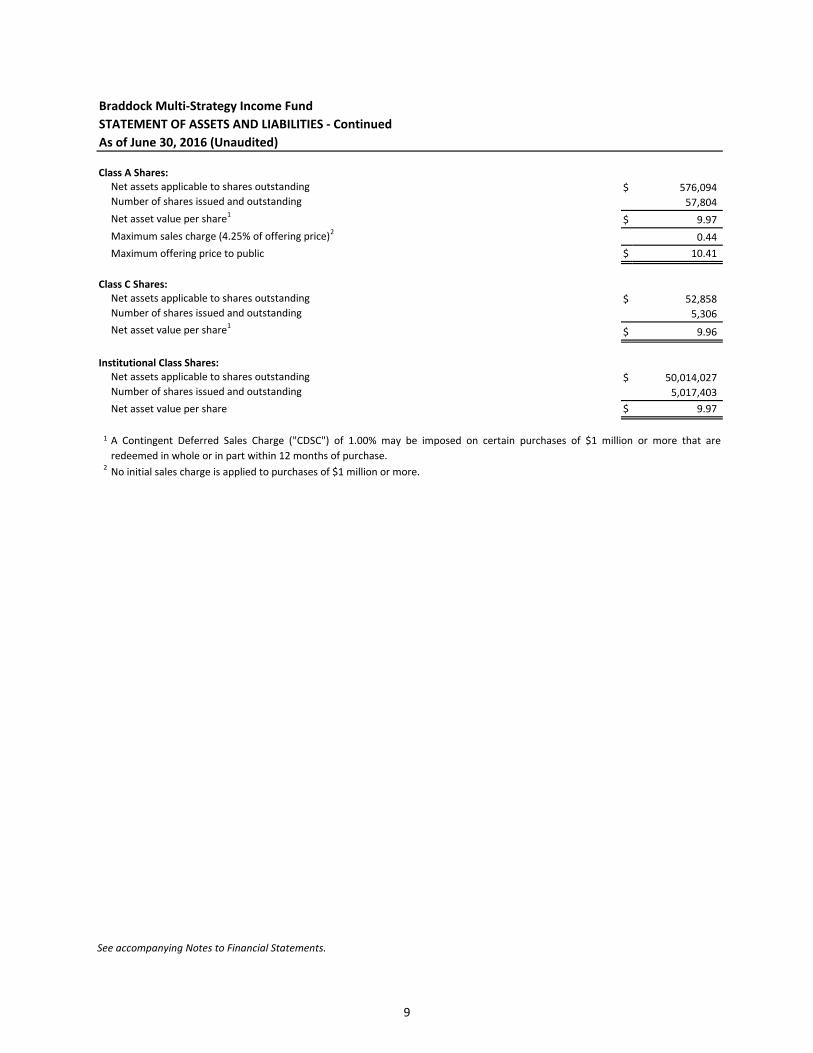
Braddock Multi-Strategy Income Fund
STATEMENT OF ASSETS AND LIABILITIES - Continued
Class A Shares:Net assets applicable to shares outstanding $ 576,094 Number of shares issued and outstanding 57,804
Net asset value per share1$ 9.97
Maximum sales charge (4.25% of offering price)20.44
Maximum offering price to public $ 10.41
Class C Shares:Net assets applicable to shares outstanding $ 52,858 Number of shares issued and outstanding 5,306
Net asset value per share1$ 9.96
Institutional Class Shares:Net assets applicable to shares outstanding $ 50,014,027 Number of shares issued and outstanding 5,017,403
Net asset value per share $ 9.97
1
2 No initial sales charge is applied to purchases of $1 million or more.
As of June 30, 2016 (Unaudited)
A Contingent Deferred Sales Charge ("CDSC") of 1.00% may be imposed on certain purchases of $1 million or more that are
redeemed in whole or in part within 12 months of purchase.
See accompanying Notes to Financial Statements.
9
See accompanying Notes to Financial Statements.
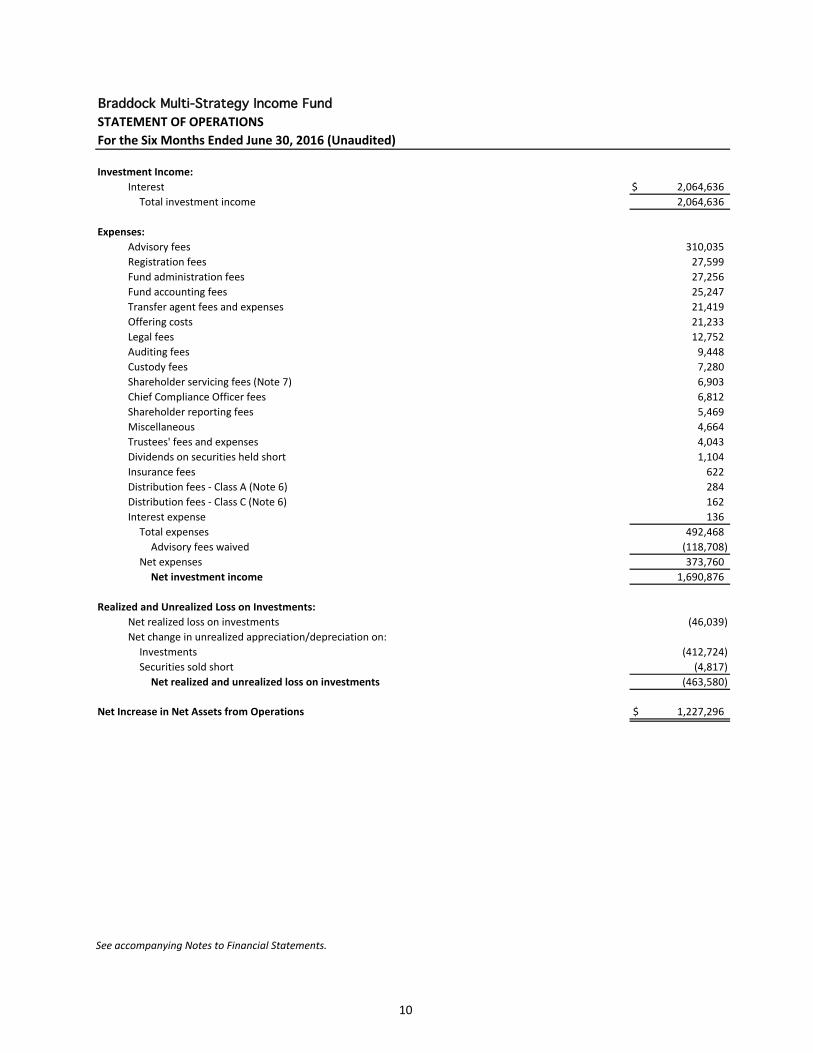
Braddock Multi-Strategy Income FundSTATEMENT OF OPERATIONSFor the Six Months Ended June 30, 2016 (Unaudited)
Investment Income:Interest $ 2,064,636
Total investment income 2,064,636
Expenses:Advisory fees 310,035 Registration fees 27,599 Fund administration fees 27,256 Fund accounting fees 25,247 Transfer agent fees and expenses 21,419 Offering costs 21,233 Legal fees 12,752 Auditing fees 9,448 Custody fees 7,280 Shareholder servicing fees (Note 7) 6,903 Chief Compliance Officer fees 6,812 Shareholder reporting fees 5,469 Miscellaneous 4,664 Trustees' fees and expenses 4,043 Dividends on securities held short 1,104 Insurance fees 622 Distribution fees - Class A (Note 6) 284 Distribution fees - Class C (Note 6) 162 Interest expense 136
Total expenses 492,468 Advisory fees waived (118,708)
Net expenses 373,760 Net investment income 1,690,876
Realized and Unrealized Loss on Investments:Net realized loss on investments (46,039) Net change in unrealized appreciation/depreciation on:
Investments (412,724) Securities sold short (4,817)
Net realized and unrealized loss on investments (463,580)
Net Increase in Net Assets from Operations $ 1,227,296
10
See accompanying Notes to Financial Statements.
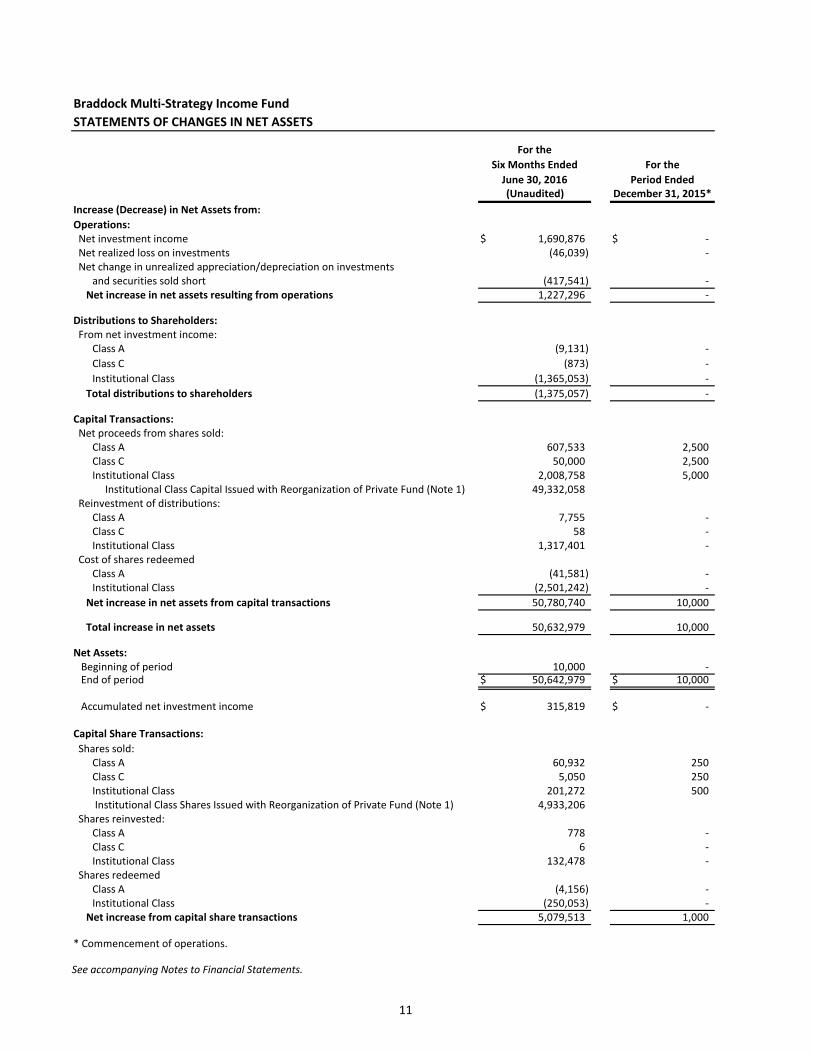
Braddock Multi-Strategy Income FundSTATEMENTS OF CHANGES IN NET ASSETS
Operations:$ 1,690,876 $ -
(46,039) -
and securities sold short (417,541) - 1,227,296 -
From net investment income:Class A (9,131) - Class C (873) - Institutional Class (1,365,053) -
Total distributions to shareholders (1,375,057) -
Class A 607,533 2,500 Class C 50,000 2,500 Institutional Class 2,008,758 5,000 Institutional Class Capital Issued with Reorganization of Private Fund (Note 1) 49,332,058
Class A 7,755 - Class C 58 - Institutional Class 1,317,401 -
Cost of shares redeemedClass A (41,581) - Institutional Class (2,501,242) -
Net increase in net assets from capital transactions 50,780,740 10,000
50,632,979 10,000
10,000 -$ 50,642,979 $ 10,000
$ 315,819 $ -
Capital Share Transactions: Shares sold:
Class A 60,932 250 Class C 5,050 250 Institutional Class 201,272 500 Institutional Class Shares Issued with Reorganization of Private Fund (Note 1) 4,933,206
Shares reinvested:Class A 778 - Class C 6 - Institutional Class 132,478 -
Shares redeemedClass A (4,156) - Institutional Class (250,053) -
Net increase from capital share transactions 5,079,513 1,000
* Commencement of operations.
For thePeriod Ended
December 31, 2015*
End of period
Accumulated net investment income
Beginning of period
Net investment income Net realized loss on investments Net change in unrealized appreciation/depreciation on investments
Net increase in net assets resulting from operations
Distributions to Shareholders:
Capital Transactions: Net proceeds from shares sold:
Reinvestment of distributions:
Total increase in net assets
Net Assets:
For the
Increase (Decrease) in Net Assets from:
Six Months EndedJune 30, 2016(Unaudited)
11
See accompanying Notes to Financial Statements.
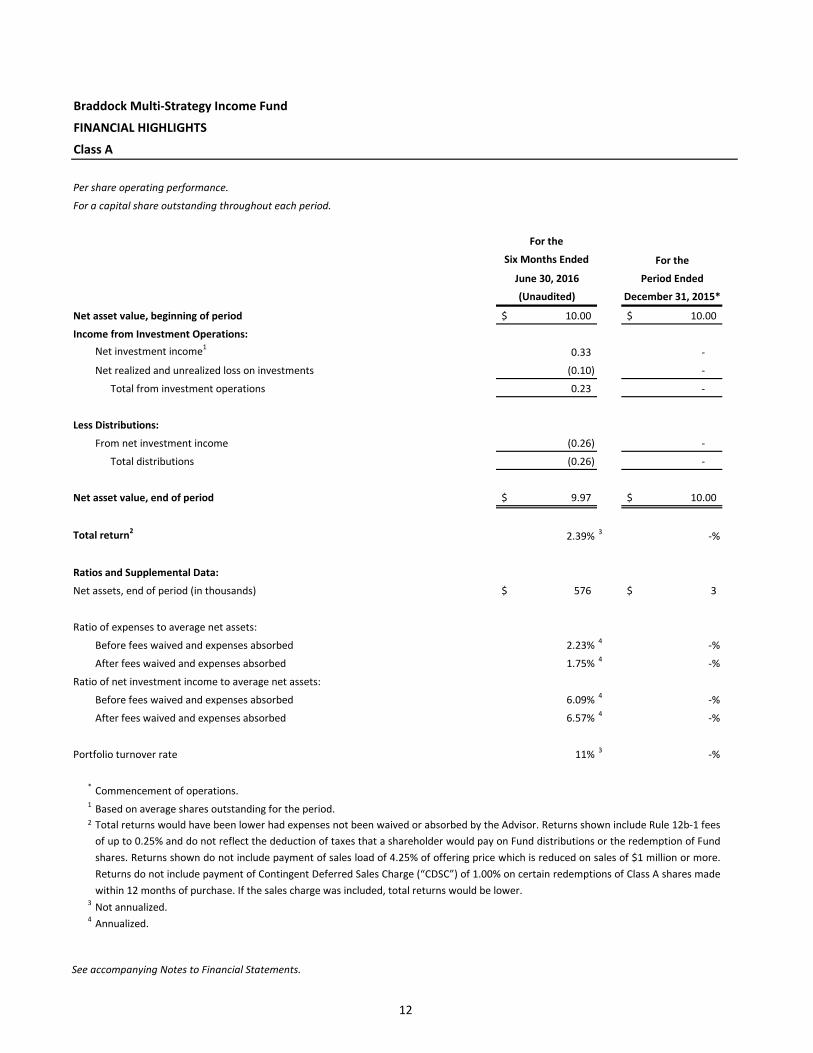
Braddock Multi-Strategy Income Fund
FINANCIAL HIGHLIGHTS
Class A
Per share operating performance.
For a capital share outstanding throughout each period.
For the
Six Months Ended For the
June 30, 2016 Period Ended
(Unaudited) December 31, 2015*
Net asset value, beginning of period 10.00$ 10.00$
Income from Investment Operations:Net investment income1 0.33 -
Net realized and unrealized loss on investments (0.10) -
Total from investment operations 0.23 -
Less Distributions:
From net investment income (0.26) -
Total distributions (0.26) -
Net asset value, end of period 9.97$ 10.00$
Total return2 2.39% 3 -%
Ratios and Supplemental Data:
Net assets, end of period (in thousands) 576$ 3$
Ratio of expenses to average net assets:
Before fees waived and expenses absorbed 2.23% 4 -%
After fees waived and expenses absorbed 1.75% 4 -%
Ratio of net investment income to average net assets:
Before fees waived and expenses absorbed 6.09% 4 -%
After fees waived and expenses absorbed 6.57% 4 -%
Portfolio turnover rate 11% 3 -%
* Commencement of operations.1 Based on average shares outstanding for the period.2
3 Not annualized.4 Annualized.
Total returns would have been lower had expenses not been waived or absorbed by the Advisor. Returns shown include Rule 12b-1 feesof up to 0.25% and do not reflect the deduction of taxes that a shareholder would pay on Fund distributions or the redemption of Fundshares. Returns shown do not include payment of sales load of 4.25% of offering price which is reduced on sales of $1 million or more.Returns do not include payment of Contingent Deferred Sales Charge (“CDSC”) of 1.00% on certain redemptions of Class A shares madewithin 12 months of purchase. If the sales charge was included, total returns would be lower.
12
See accompanying Notes to Financial Statements.
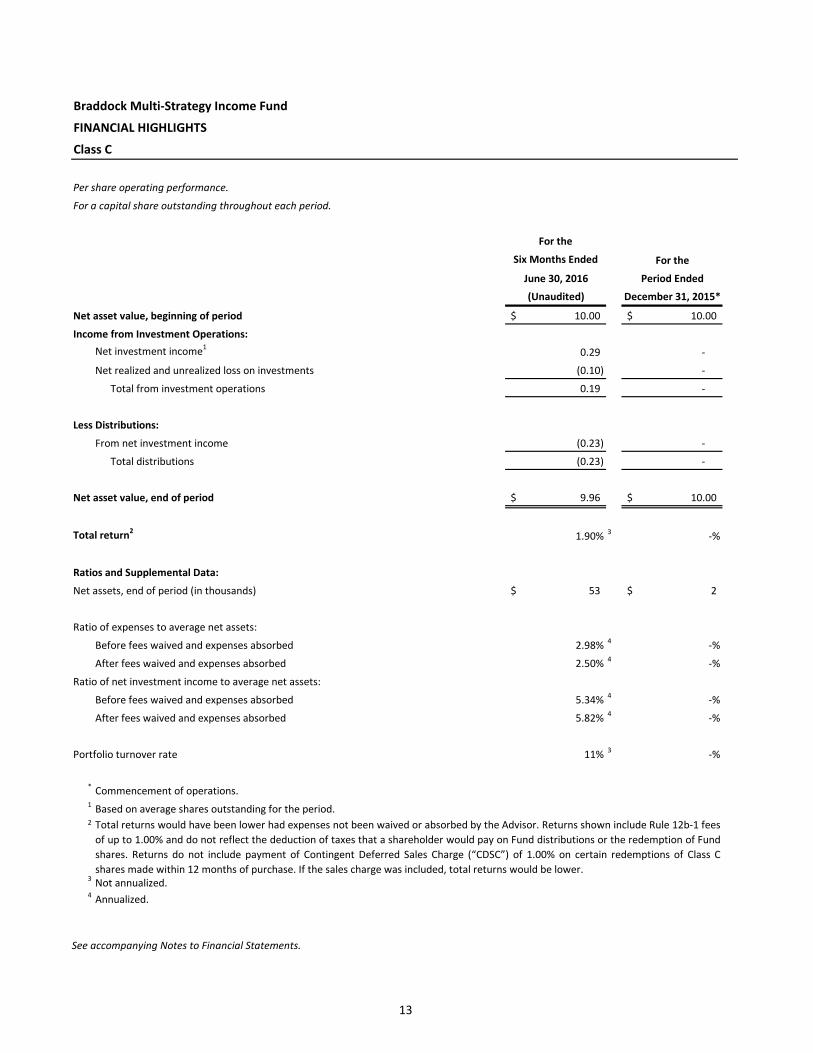
Braddock Multi-Strategy Income Fund
FINANCIAL HIGHLIGHTS
Class C
Per share operating performance.
For a capital share outstanding throughout each period.
For the
Six Months Ended For the
June 30, 2016 Period Ended
(Unaudited) December 31, 2015*
Net asset value, beginning of period 10.00$ 10.00$
Income from Investment Operations:Net investment income1 0.29 -
Net realized and unrealized loss on investments (0.10) -
Total from investment operations 0.19 -
Less Distributions:
From net investment income (0.23) -
Total distributions (0.23) -
Net asset value, end of period 9.96$ 10.00$
Total return2 1.90% 3 -%
Ratios and Supplemental Data:
Net assets, end of period (in thousands) 53$ 2$
Ratio of expenses to average net assets:
Before fees waived and expenses absorbed 2.98% 4 -%
After fees waived and expenses absorbed 2.50% 4 -%
Ratio of net investment income to average net assets:
Before fees waived and expenses absorbed 5.34% 4 -%
After fees waived and expenses absorbed 5.82% 4 -%
Portfolio turnover rate 11% 3 -%
* Commencement of operations.1 Based on average shares outstanding for the period.2
3 Not annualized.4 Annualized.
Total returns would have been lower had expenses not been waived or absorbed by the Advisor. Returns shown include Rule 12b-1 feesof up to 1.00% and do not reflect the deduction of taxes that a shareholder would pay on Fund distributions or the redemption of Fundshares. Returns do not include payment of Contingent Deferred Sales Charge (“CDSC”) of 1.00% on certain redemptions of Class Cshares made within 12 months of purchase. If the sales charge was included, total returns would be lower.
13
See accompanying Notes to Financial Statements.
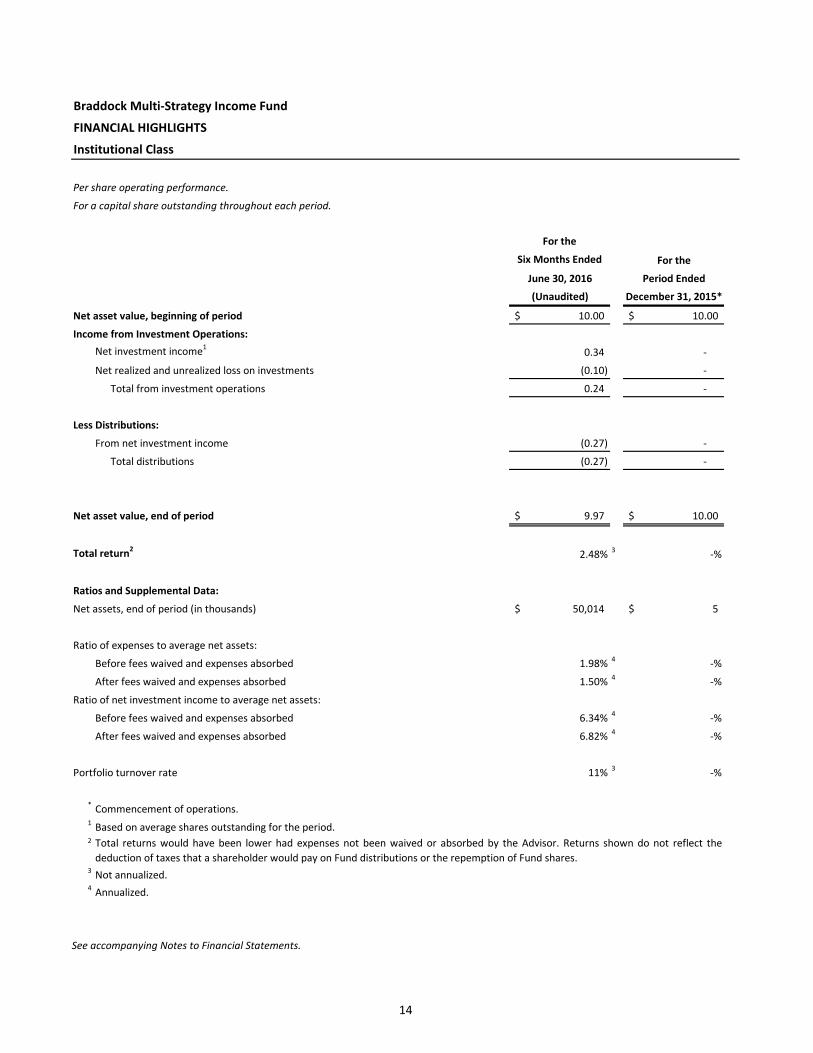
Braddock Multi-Strategy Income Fund
FINANCIAL HIGHLIGHTS
Institutional Class
Per share operating performance.
For a capital share outstanding throughout each period.
For the
Six Months Ended For the
June 30, 2016 Period Ended
(Unaudited) December 31, 2015*
Net asset value, beginning of period 10.00$ 10.00$
Income from Investment Operations:Net investment income1 0.34 -
Net realized and unrealized loss on investments (0.10) -
Total from investment operations 0.24 -
Less Distributions:
From net investment income (0.27) -
Total distributions (0.27) -
Net asset value, end of period 9.97$ 10.00$
Total return2 2.48% 3 -%
Ratios and Supplemental Data:
Net assets, end of period (in thousands) 50,014$ 5$
Ratio of expenses to average net assets:
Before fees waived and expenses absorbed 1.98% 4 -%
After fees waived and expenses absorbed 1.50% 4 -%
Ratio of net investment income to average net assets:
Before fees waived and expenses absorbed 6.34% 4 -%
After fees waived and expenses absorbed 6.82% 4 -%
Portfolio turnover rate 11% 3 -%
* Commencement of operations.1 Based on average shares outstanding for the period.2
3 Not annualized.4 Annualized.
Total returns would have been lower had expenses not been waived or absorbed by the Advisor. Returns shown do not reflect thededuction of taxes that a shareholder would pay on Fund distributions or the repemption of Fund shares.
14
Braddock Multi-Strategy Income Fund NOTES TO FINANCIAL STATEMENTS June 30, 2016 (Unaudited) Note 1 – Organization The Braddock Multi-Strategy Income Fund (the ‘‘Fund’’) was organized as non-diversified series of Investment Managers Series Trust, a Delaware statutory trust (the “Trust”) which is registered as an open-end management investment company under the Investment Company Act of 1940, as amended (the “1940 Act”). The Fund seeks total return with an emphasis on providing current income. The Fund’s Class A, Class C, and Institutional Class shares commenced investment operations on December 31, 2015. The Fund commenced operations on December 31, 2015, with Class A, Class C, and Institutional Class shares, prior to which its only activity was the receipt of a $10,000 investment from principals of the Fund’s advisor and a $49,332,058 transfer of shares of the Fund in exchange for the net assets of the Braddock Structured Opportunities Fund Series A, LP, a Delaware limited partnership (the “Company”). This exchange was nontaxable, whereby the Fund’s Institutional Class issued 4,933,206 shares for the net assets of the Company on December 31, 2015. Assets with a fair market value of $49,332,058 consisting of cash, interest receivable and securities of the Company with a fair value of $46,754,826 (identified costs of investments transferred were $44,204,045) and cash were the primary assets received by the Fund. For financial reporting purposes, assets received and shares issued by the Fund were recorded at fair value; however, the cost basis of the investments received from the Partnership was carried forward to align ongoing reporting of the Fund’s realized and unrealized gains and losses with amount distributable to shareholders for tax purposes. The shares of each class represent an interest in the same portfolio of investments of the Fund and have equal rights as to voting, redemptions, dividends, liquidation, income and expenses, except class specific expenses, subject to the approval of the Trustees. Shareholders of a class that bears distribution and service expenses under the terms of a distribution plan have exclusive voting rights to that distribution plan. The Fund is an investment company and accordingly follows the investment company accounting and reporting guidance of the Financial Accounting Standards Board (FASB) Accounting Standard Codification Topic 946 “Financial Services—Investment Companies.” Note 2 – Accounting Policies The following is a summary of the significant accounting policies consistently followed by the Fund in the preparation of its financial statements. The preparation of financial statements in conformity with accounting principles generally accepted in the United States of America (“GAAP”) requires management to make estimates and assumptions that affect the reported amounts and disclosures in the financial statements. Actual results could differ from these estimates. (a) Valuation of Investments The Fund values equity securities at the last reported sale price on the principal exchange or in the principal over the counter (“OTC”) market in which such securities are traded, as of the close of regular trading on the NYSE on the day the securities are being valued or, if there are no sales, at the mean between the last available bid and asked prices on that day. Securities traded on the NASDAQ are valued at the NASDAQ Official Closing Price (“NOCP”). Debt securities are valued by utilizing a price supplied by independent pricing service providers. The independent pricing service providers may use various valuation methodologies including matrix pricing and other analytical pricing models as well as market transactions and dealer quotations. These models generally consider such factors as yields or prices of bonds of comparable quality, type of issue, coupon, maturity, ratings and general market conditions. If a price is not readily available for a portfolio security, the security will be valued at fair value (the amount which the Fund might reasonably expect to receive for the security upon its current sale) as determined in good faith by the Fund’s advisor, subject to review and approval by the Valuation Committee, pursuant to procedures adopted by the Board of Trustees. The actions of the Valuation Committee are
15
Braddock Multi-Strategy Income Fund NOTES TO FINANCIAL STATEMENTS – Continued June 30, 2016 (Unaudited) subsequently reviewed by the Board at its next regularly scheduled board meeting. The Valuation Committee meets as needed. The Valuation Committee is comprised of all the Trustees, but action may be taken by any one of the Trustees. Trading in securities on many foreign securities exchanges and OTC markets is normally completed before the close of business on each U.S. business day. In addition, securities trading in a particular country or countries may not take place on all U.S. business days or may take place on days which are not U.S. business days. Changes in valuations on certain securities may occur at times or on days on which the Fund’s net asset values (“NAV”) are not calculated and on which the Fund does not affect sales and redemptions of its shares. (b) Short Sales The Fund may sell securities short. Short sales are transactions under which the Fund sells a security it does not own in anticipation of a decline in the value of that security. To complete such a transaction, the Fund must borrow the security to make delivery to the buyer. The Fund then is obligated to replace the security borrowed by purchasing the security at market price at the time of replacement. The price at such time may be more or less than the price at which the security was sold by the Fund. When a security is sold short a decrease in the value of the security will be recognized as a gain and an increase in the value of the security will be recognized as a loss, which is potentially limitless. Until the security is replaced, the Fund is required to pay the lender amounts equal to dividend or interest that accrue during the period of the loan which is recorded as an expense. To borrow the security, the Fund also may be required to pay a premium or an interest fee, which are recorded as interest expense. Cash or securities are segregated for the broker to meet the necessary margin requirements. The Fund is subject to the risk that it may not always be able to close out a short position at a particular time or at an acceptable price. (c) Investment Transactions, Investment Income and Expenses Investment transactions are accounted for on the trade date. Realized gains and losses on investments are determined on the identified cost basis. Dividend income is recorded net of applicable withholding taxes on the ex-dividend date and interest income is recorded on an accrual basis. Withholding taxes on foreign dividends are paid (a portion of which may be reclaimable) or provided for in accordance with the applicable country’s tax rules and rates and are disclosed in the Statement of Operations. Withholding tax reclaims are filed in certain countries to recover a portion of the amounts previously withheld. The Fund records a reclaim receivable based on a number of factors, including a jurisdiction’s legal obligation to pay reclaims as well as payment history and market convention. Discounts or premiums on debt securities are accreted or amortized to interest income over the lives of the respective securities using the effective interest method. Expenses incurred by the Trust with respect to more than one Fund are allocated in proportion to the net assets of each Fund except where allocation of direct expenses to each Fund or an alternative allocation method can be more appropriately made. The Fund incurred offering costs of approximately $45,340, which are being amortized over a one-year period from December 31, 2015 (commencement of operations). (d) Federal Income Taxes The Fund intends to comply with the requirements of Subchapter M of the Internal Revenue Code applicable to regulated investment companies and to distribute substantially all of its net investment income and any net realized gains to its shareholders. Therefore, no provision is made for federal income or excise taxes. Due to the timing of dividend distributions and the differences in accounting for income and realized gains and losses for financial statement and federal income tax purposes, the fiscal year in which amounts are distributed may differ from the year in which the income and realized gains and losses are recorded by the Fund.
16
Braddock Multi-Strategy Income Fund NOTES TO FINANCIAL STATEMENTS – Continued June 30, 2016 (Unaudited) Accounting for Uncertainty in Income Taxes (the “Income Tax Statement”) requires an evaluation of tax positions taken (or expected to be taken) in the course of preparing a Fund’s tax returns to determine whether these positions meet a “more-likely-than-not” standard that, based on the technical merits, have a more than fifty percent likelihood of being sustained by a taxing authority upon examination. A tax position that meets the “more-likely-than-not” recognition threshold is measured to determine the amount of benefit to recognize in the financial statements. The Fund recognizes interest and penalties, if any, related to unrecognized tax benefits as income tax expense in the Statement of Operations. The Income Tax Statement requires management of the Fund to analyze tax positions taken in the prior three open tax years, if any, and tax positions expected to be taken in the Fund’s current tax year, as defined by the IRS statute of limitations for all major jurisdictions, including federal tax authorities and certain state tax authorities. For the six months ended June 30, 2016, the Fund did not have a liability for any unrecognized tax benefits. The Fund has no examination in progress and not aware of any tax positions for which it is reasonably possible that the total amounts of unrecognized tax benefits will significantly change in the next twelve months. (e) Distributions to Shareholders The Fund will make dividend distributions of net investment income, if any, monthly and net capital gains distributions, if any, at least annually, typically in December. The Fund may make an additional payment of dividends or distributions if it deems it desirable at any other time during the year. Distributions to shareholders are recorded on the ex-dividend date. The amount and timing of distributions are determined in accordance with federal income tax regulations, which may differ from GAAP. The character of distributions made during the year from net investment income or net realized gains may differ from the characterization for federal income tax purposes due to differences in the recognition of income, expense and gain (loss) items for financial statement and tax purposes. (f) Use of Estimates The presentation of financial statements in conformity with GAAP requires management to make estimates and assumptions that affect the reported amounts of assets and liabilities at the date of the financial statements and the reported amounts of income and expenses during the reporting period. Actual results could differ from those estimates. Note 3 – Investment Advisory and Other Agreements The Trust, on behalf of the Fund, entered into an Investment Advisory Agreement (the “Agreement”) with Liberty Street Advisors, Inc. (the “Advisor”). Under the terms of the Agreement, the Fund pays a monthly investment advisory fee to the Advisor at the annual rate of 1.25% of the Fund’s average daily net assets. The Advisor engages Braddock Financial, LLC (the “Sub-Advisor”) to manage the Fund and pays the Sub-Advisor from its advisory fees. The Advisor has contractually agreed to waive its fees and/or pay for operating expenses of the Fund to ensure that total annual fund operating expenses (excluding, as applicable, taxes, leverage interest, brokerage commissions, acquired fund fees and expenses (as determined in accordance with Form N-1A), expenses incurred in connection with any merger or reorganization and extraordinary expenses such as litigation expenses) do not exceed 1.75%, 2.50% and 1.50% of the Fund's average daily net assets for Class A, Class C, and Institutional Class shares, respectively. This agreement is in effect until April 30, 2017, and it may be terminated before that date only by the Trust’s Board of Trustees. For the six months ended June 30, 2016, the Advisor waived a portion of its advisory fees totaling $118,708. The Advisor may recover from the Fund fees and/or expenses previously waived and/or absorbed, if the Fund’s expense ratio, including the recovered expenses, falls below the expense limit at which they were waived. The Advisor is permitted to seek reimbursement from the Fund for a period ending three full fiscal years following the
17
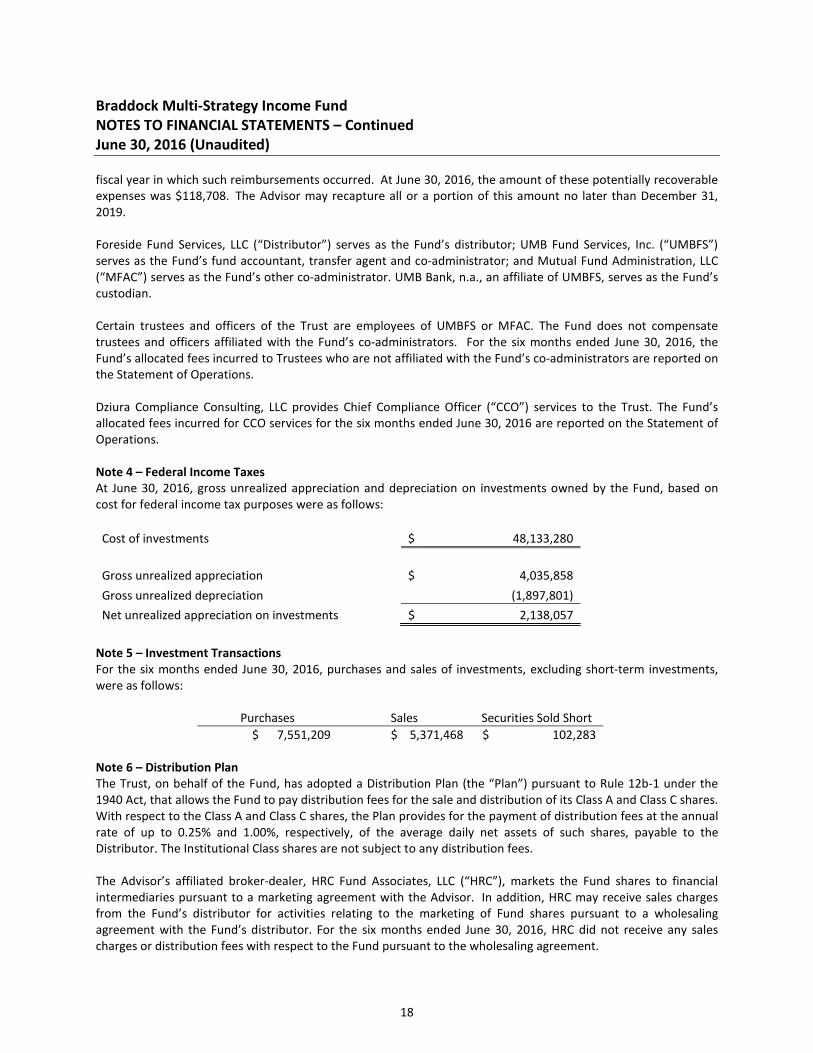
Braddock Multi-Strategy Income Fund NOTES TO FINANCIAL STATEMENTS – Continued June 30, 2016 (Unaudited) fiscal year in which such reimbursements occurred. At June 30, 2016, the amount of these potentially recoverable expenses was $118,708. The Advisor may recapture all or a portion of this amount no later than December 31, 2019. Foreside Fund Services, LLC (“Distributor”) serves as the Fund’s distributor; UMB Fund Services, Inc. (“UMBFS”) serves as the Fund’s fund accountant, transfer agent and co-administrator; and Mutual Fund Administration, LLC (“MFAC”) serves as the Fund’s other co-administrator. UMB Bank, n.a., an affiliate of UMBFS, serves as the Fund’s custodian. Certain trustees and officers of the Trust are employees of UMBFS or MFAC. The Fund does not compensate trustees and officers affiliated with the Fund’s co-administrators. For the six months ended June 30, 2016, the Fund’s allocated fees incurred to Trustees who are not affiliated with the Fund’s co-administrators are reported on the Statement of Operations. Dziura Compliance Consulting, LLC provides Chief Compliance Officer (“CCO”) services to the Trust. The Fund’s allocated fees incurred for CCO services for the six months ended June 30, 2016 are reported on the Statement of Operations. Note 4 – Federal Income Taxes At June 30, 2016, gross unrealized appreciation and depreciation on investments owned by the Fund, based on cost for federal income tax purposes were as follows:
Cost of investments $ 48,133,280 Gross unrealized appreciation $ 4,035,858 Gross unrealized depreciation (1,897,801) Net unrealized appreciation on investments $ 2,138,057
Note 5 – Investment Transactions For the six months ended June 30, 2016, purchases and sales of investments, excluding short-term investments, were as follows:
Purchases Sales Securities Sold Short $ 7,551,209 $ 5,371,468 $ 102,283
Note 6 – Distribution Plan The Trust, on behalf of the Fund, has adopted a Distribution Plan (the “Plan”) pursuant to Rule 12b-1 under the 1940 Act, that allows the Fund to pay distribution fees for the sale and distribution of its Class A and Class C shares. With respect to the Class A and Class C shares, the Plan provides for the payment of distribution fees at the annual rate of up to 0.25% and 1.00%, respectively, of the average daily net assets of such shares, payable to the Distributor. The Institutional Class shares are not subject to any distribution fees. The Advisor’s affiliated broker-dealer, HRC Fund Associates, LLC (“HRC”), markets the Fund shares to financial intermediaries pursuant to a marketing agreement with the Advisor. In addition, HRC may receive sales charges from the Fund’s distributor for activities relating to the marketing of Fund shares pursuant to a wholesaling agreement with the Fund’s distributor. For the six months ended June 30, 2016, HRC did not receive any sales charges or distribution fees with respect to the Fund pursuant to the wholesaling agreement.
18
Braddock Multi-Strategy Income Fund NOTES TO FINANCIAL STATEMENTS – Continued June 30, 2016 (Unaudited) For the six months ended June 30, 2016, distribution fees incurred are disclosed on the Statement of Operations. Note 7 – Shareholder Servicing Plan The Trust, on behalf of the Fund, has adopted a Shareholder Servicing Plan to pay a fee at an annual rate of up to 0.15% of the Fund’s average daily net assets of its shares serviced by shareholder servicing agents who provide administrative and support services to their customers. For the six months ended June 30, 2016, shareholder servicing fees incurred are disclosed on the Statement of Operations. Note 8 – Indemnifications In the normal course of business, the Fund enters into contracts that contain a variety of representations which provide general indemnifications. The Fund’s maximum exposure under these arrangements is unknown, as this would involve future claims that may be made against the Fund’s that have not yet occurred. However, the Fund expects the risk of loss to be remote. Note 9 – Fair Value Measurements and Disclosure Fair Value Measurements and Disclosures defines fair value, establishes a framework for measuring fair value in accordance with GAAP, and expands disclosure about fair value measurements. It also provides guidance on determining when there has been a significant decrease in the volume and level of activity for an asset or a liability, when a transaction is not orderly, and how that information must be incorporated into a fair value measurement. Under Fair Value Measurements and Disclosures, various inputs are used in determining the value of the Fund’s investments. These inputs are summarized into three broad Levels as described below:
• Level 1 – Unadjusted quoted prices in active markets for identical assets or liabilities that the Fund has the ability to access.
• Level 2 – Observable inputs other than quoted prices included in Level 1 that are observable for the asset or liability, either directly or indirectly. These inputs may include quoted prices for the identical instrument on an inactive market, prices for similar instruments, interest rates, prepayment speeds, credit risk, yield curves, default rates and similar data.
• Level 3 – Unobservable inputs for the asset or liability, to the extent relevant observable inputs are not available, representing the Fund’s own assumptions about the assumptions a market participant would use in valuing the asset or liability, and would be based on the best information available.
The availability of observable inputs can vary from security to security and is affected by a wide variety of factors, including for example, the type of security, whether the security is new and not yet established in the marketplace, the liquidity of markets, and other characteristics particular to the security. To the extent that valuation is based on models or inputs that are less observable or unobservable in the market, the determination of fair value requires more judgment. Accordingly the degree of judgment exercised in determining fair value is greatest for instruments categorized in Level 3. The inputs to measure fair value may fall into different Levels of the fair value hierarchy. In such cases, for disclosure purposes, the Level in the fair value hierarchy within which the fair value measurement falls in its
19
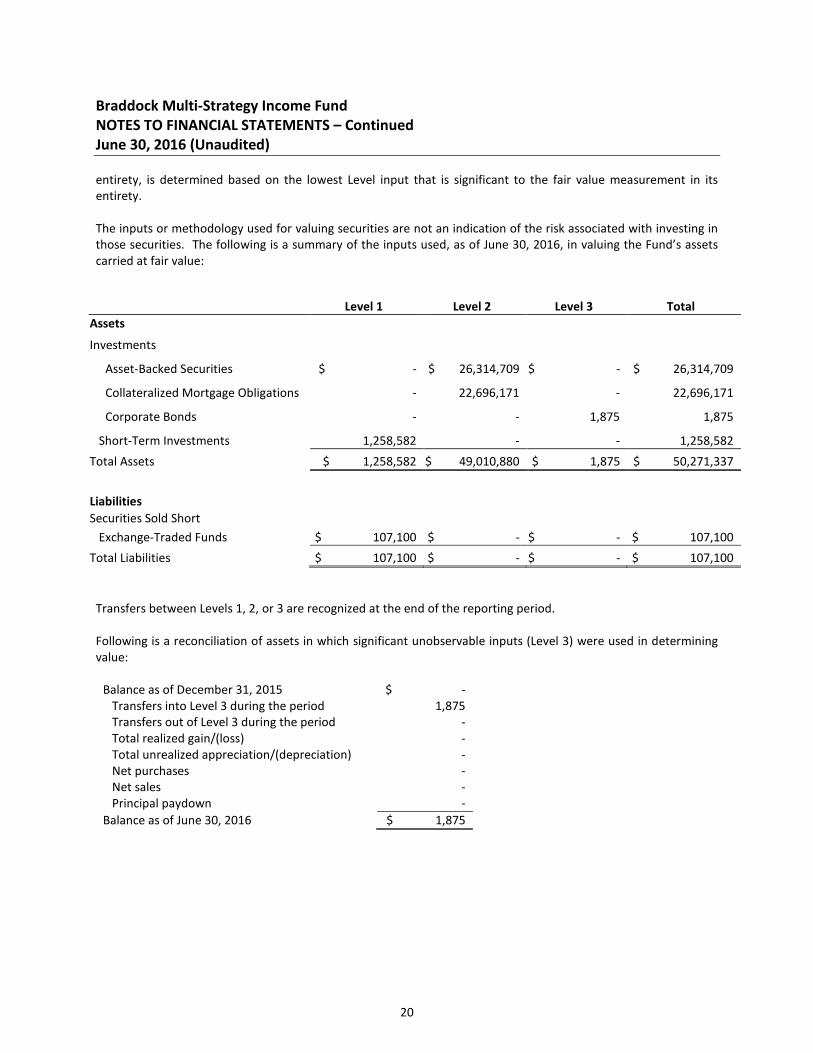
Braddock Multi-Strategy Income Fund NOTES TO FINANCIAL STATEMENTS – Continued June 30, 2016 (Unaudited) entirety, is determined based on the lowest Level input that is significant to the fair value measurement in its entirety. The inputs or methodology used for valuing securities are not an indication of the risk associated with investing in those securities. The following is a summary of the inputs used, as of June 30, 2016, in valuing the Fund’s assets carried at fair value:
Transfers between Levels 1, 2, or 3 are recognized at the end of the reporting period. Following is a reconciliation of assets in which significant unobservable inputs (Level 3) were used in determining value:
Balance as of December 31, 2015 $ - Transfers into Level 3 during the period 1,875 Transfers out of Level 3 during the period - Total realized gain/(loss) - Total unrealized appreciation/(depreciation) - Net purchases - Net sales - Principal paydown - Balance as of June 30, 2016 $ 1,875
Level 1 Level 2 Level 3 Total Assets
Investments Asset-Backed Securities $ - $ 26,314,709 $ - $ 26,314,709
Collateralized Mortgage Obligations - 22,696,171 - 22,696,171
Corporate Bonds - - 1,875 1,875
Short-Term Investments 1,258,582 - - 1,258,582 Total Assets $ 1,258,582 $ 49,010,880 $ 1,875 $ 50,271,337
Liabilities Securities Sold Short
Exchange-Traded Funds $ 107,100 $ - $ - $ 107,100 Total Liabilities $ 107,100 $ - $ - $ 107,100
20
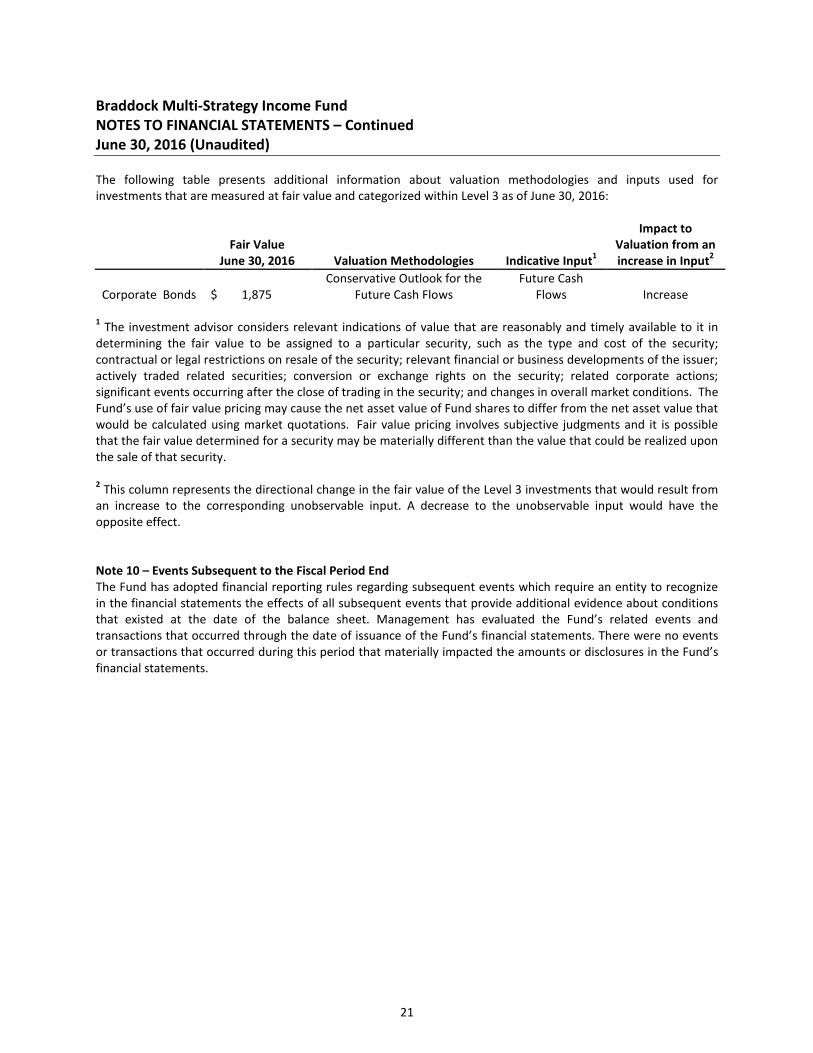
Braddock Multi-Strategy Income Fund NOTES TO FINANCIAL STATEMENTS – Continued June 30, 2016 (Unaudited) The following table presents additional information about valuation methodologies and inputs used for investments that are measured at fair value and categorized within Level 3 as of June 30, 2016:
Fair Value June 30, 2016 Valuation Methodologies Indicative Input1
Impact to Valuation from an increase in Input2
Corporate Bonds $ 1,875 Conservative Outlook for the
Future Cash Flows Future Cash
Flows Increase
1 The investment advisor considers relevant indications of value that are reasonably and timely available to it in determining the fair value to be assigned to a particular security, such as the type and cost of the security; contractual or legal restrictions on resale of the security; relevant financial or business developments of the issuer; actively traded related securities; conversion or exchange rights on the security; related corporate actions; significant events occurring after the close of trading in the security; and changes in overall market conditions. The Fund’s use of fair value pricing may cause the net asset value of Fund shares to differ from the net asset value that would be calculated using market quotations. Fair value pricing involves subjective judgments and it is possible that the fair value determined for a security may be materially different than the value that could be realized upon the sale of that security. 2 This column represents the directional change in the fair value of the Level 3 investments that would result from an increase to the corresponding unobservable input. A decrease to the unobservable input would have the opposite effect. Note 10 – Events Subsequent to the Fiscal Period End The Fund has adopted financial reporting rules regarding subsequent events which require an entity to recognize in the financial statements the effects of all subsequent events that provide additional evidence about conditions that existed at the date of the balance sheet. Management has evaluated the Fund’s related events and transactions that occurred through the date of issuance of the Fund’s financial statements. There were no events or transactions that occurred during this period that materially impacted the amounts or disclosures in the Fund’s financial statements.
21
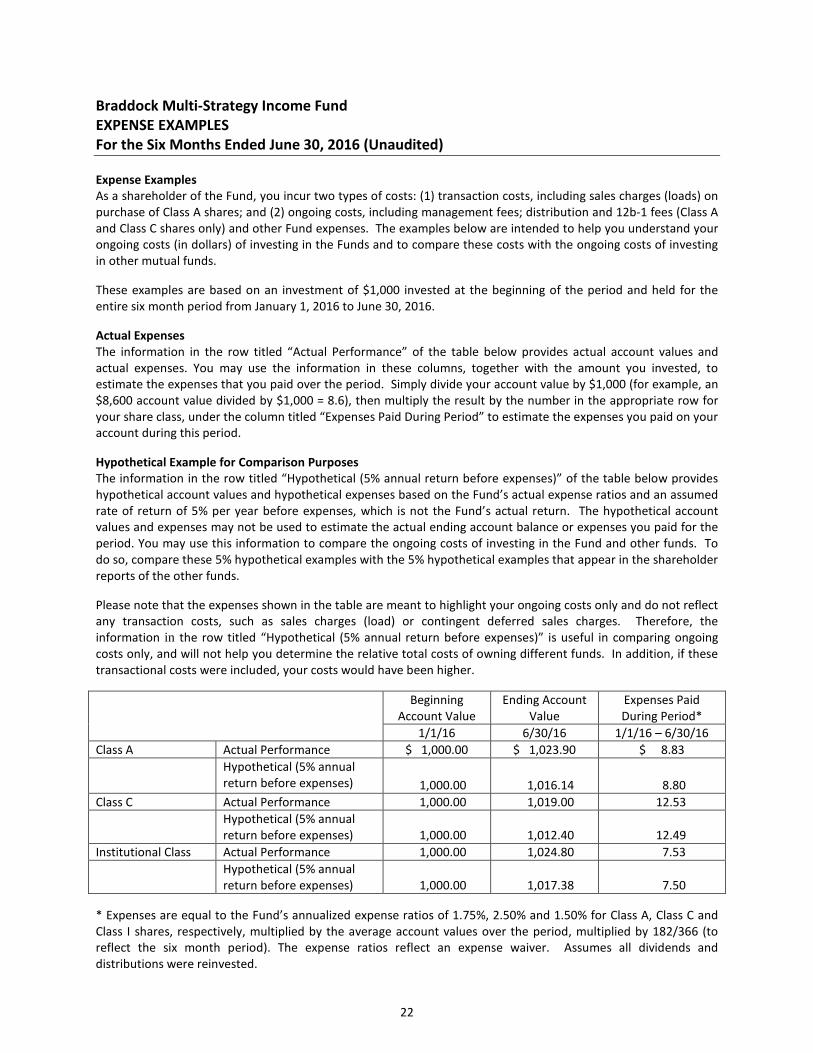
Braddock Multi-Strategy Income Fund EXPENSE EXAMPLES For the Six Months Ended June 30, 2016 (Unaudited) Expense Examples As a shareholder of the Fund, you incur two types of costs: (1) transaction costs, including sales charges (loads) on purchase of Class A shares; and (2) ongoing costs, including management fees; distribution and 12b-1 fees (Class A and Class C shares only) and other Fund expenses. The examples below are intended to help you understand your ongoing costs (in dollars) of investing in the Funds and to compare these costs with the ongoing costs of investing in other mutual funds. These examples are based on an investment of $1,000 invested at the beginning of the period and held for the entire six month period from January 1, 2016 to June 30, 2016. Actual Expenses The information in the row titled “Actual Performance” of the table below provides actual account values and actual expenses. You may use the information in these columns, together with the amount you invested, to estimate the expenses that you paid over the period. Simply divide your account value by $1,000 (for example, an $8,600 account value divided by $1,000 = 8.6), then multiply the result by the number in the appropriate row for your share class, under the column titled “Expenses Paid During Period” to estimate the expenses you paid on your account during this period. Hypothetical Example for Comparison Purposes The information in the row titled “Hypothetical (5% annual return before expenses)” of the table below provides hypothetical account values and hypothetical expenses based on the Fund’s actual expense ratios and an assumed rate of return of 5% per year before expenses, which is not the Fund’s actual return. The hypothetical account values and expenses may not be used to estimate the actual ending account balance or expenses you paid for the period. You may use this information to compare the ongoing costs of investing in the Fund and other funds. To do so, compare these 5% hypothetical examples with the 5% hypothetical examples that appear in the shareholder reports of the other funds. Please note that the expenses shown in the table are meant to highlight your ongoing costs only and do not reflect any transaction costs, such as sales charges (load) or contingent deferred sales charges. Therefore, the information in the row titled “Hypothetical (5% annual return before expenses)” is useful in comparing ongoing costs only, and will not help you determine the relative total costs of owning different funds. In addition, if these transactional costs were included, your costs would have been higher. Beginning
Account Value Ending Account
Value Expenses Paid During Period*
1/1/16 6/30/16 1/1/16 – 6/30/16 Class A Actual Performance $ 1,000.00 $ 1,023.90 $ 8.83 Hypothetical (5% annual
return before expenses) 1,000.00 1,016.14 8.80 Class C Actual Performance 1,000.00 1,019.00 12.53 Hypothetical (5% annual
return before expenses) 1,000.00 1,012.40 12.49 Institutional Class Actual Performance 1,000.00 1,024.80 7.53 Hypothetical (5% annual
return before expenses) 1,000.00 1,017.38 7.50 * Expenses are equal to the Fund’s annualized expense ratios of 1.75%, 2.50% and 1.50% for Class A, Class C and Class I shares, respectively, multiplied by the average account values over the period, multiplied by 182/366 (to reflect the six month period). The expense ratios reflect an expense waiver. Assumes all dividends and distributions were reinvested.
22

This page is intentionally left blank

This page is intentionally left blank
Braddock Multi-Strategy Income Fund
A series of Investment Managers Series Trust
Investment Advisor
Liberty Street Advisors, Inc. 100 Wall Street, 20th Floor New York, New York 10005
Sub-Advisor Braddock Financial, LLC
1125 17th Street, Suite 1510 Denver, Colorado 80202
Custodian UMB Bank, n.a.
928 Grand Boulevard, 5th Floor Kansas City, Missouri 64106
Fund Co-Administrator Mutual Fund Administration, LLC
2220 E. Route 66, Suite 226 Glendora, California 91740
Fund Co-Administrator, Transfer Agent and Fund Accountant UMB Fund Services, Inc.
235 W. Galena Street Milwaukee, Wisconsin 53212
Distributor Foreside Fund Services, LLC Three Canal Plaza, Suite 100
Portland, Maine 04101 www.foreside.com
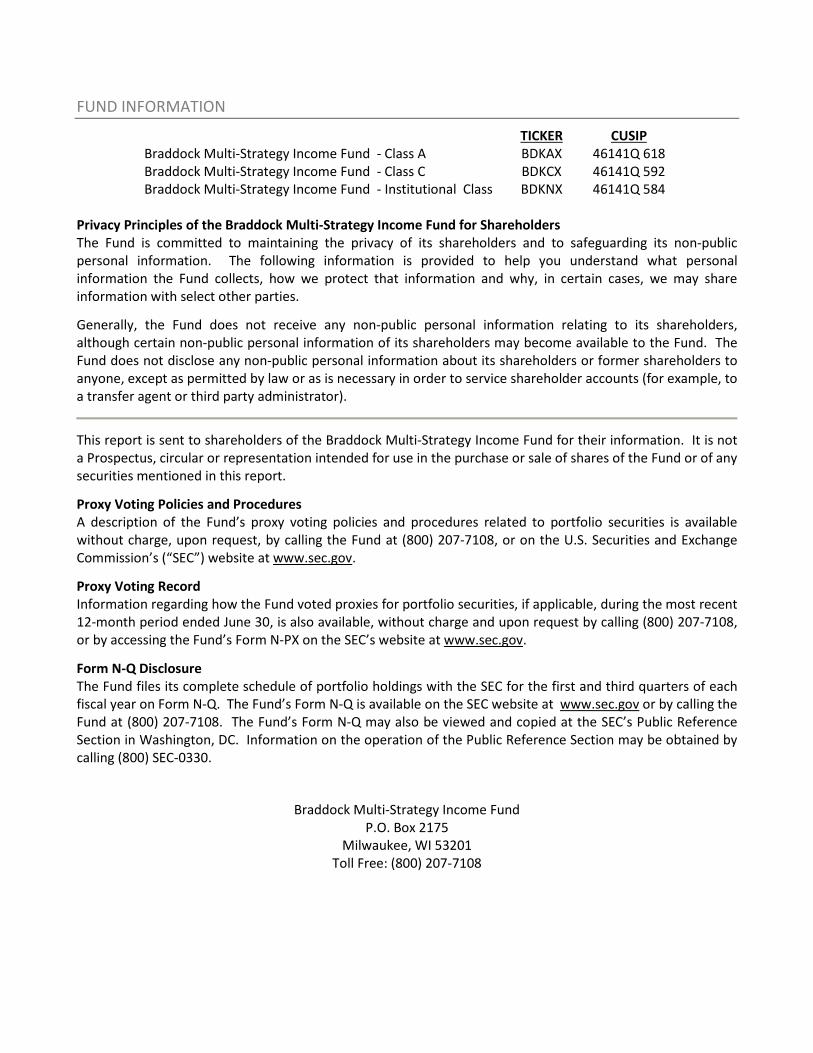
FUND INFORMATION
TICKER CUSIP Braddock Multi-Strategy Income Fund - Class A BDKAX 46141Q 618 Braddock Multi-Strategy Income Fund - Class C BDKCX 46141Q 592 Braddock Multi-Strategy Income Fund - Institutional Class BDKNX 46141Q 584
Privacy Principles of the Braddock Multi-Strategy Income Fund for Shareholders The Fund is committed to maintaining the privacy of its shareholders and to safeguarding its non-public personal information. The following information is provided to help you understand what personal information the Fund collects, how we protect that information and why, in certain cases, we may share information with select other parties.
Generally, the Fund does not receive any non-public personal information relating to its shareholders, although certain non-public personal information of its shareholders may become available to the Fund. The Fund does not disclose any non-public personal information about its shareholders or former shareholders to anyone, except as permitted by law or as is necessary in order to service shareholder accounts (for example, to a transfer agent or third party administrator).
This report is sent to shareholders of the Braddock Multi-Strategy Income Fund for their information. It is not a Prospectus, circular or representation intended for use in the purchase or sale of shares of the Fund or of any securities mentioned in this report.
Proxy Voting Policies and Procedures A description of the Fund’s proxy voting policies and procedures related to portfolio securities is available without charge, upon request, by calling the Fund at (800) 207-7108, or on the U.S. Securities and Exchange Commission’s (“SEC”) website at www.sec.gov.
Proxy Voting Record Information regarding how the Fund voted proxies for portfolio securities, if applicable, during the most recent 12-month period ended June 30, is also available, without charge and upon request by calling (800) 207-7108, or by accessing the Fund’s Form N-PX on the SEC’s website at www.sec.gov.
Form N-Q Disclosure The Fund files its complete schedule of portfolio holdings with the SEC for the first and third quarters of each fiscal year on Form N-Q. The Fund’s Form N-Q is available on the SEC website at www.sec.gov or by calling the Fund at (800) 207-7108. The Fund’s Form N-Q may also be viewed and copied at the SEC’s Public Reference Section in Washington, DC. Information on the operation of the Public Reference Section may be obtained by calling (800) SEC-0330.
Braddock Multi-Strategy Income Fund P.O. Box 2175
Milwaukee, WI 53201 Toll Free: (800) 207-7108