Embed Size (px)
Citation preview

Brain Changes Following Four Weeks ofUnimanual Motor Training: Evidence From
Behavior, Neural Stimulation, Cortical Thickness,and Functional MRI
Martin V. Sale,1,2† Lee B. Reid ,3,4† Luca Cocchi,1,5 Alex M. Pagnozzi,3,4
Stephen E. Rose,3* and Jason B. Mattingley1,6
1The Queensland Brain Institute, The University of Queensland, St Lucia, Queensland 4072,Australia
2School of Health and Rehabilitation Sciences, The University of Queensland, St Lucia,Queensland 4072, Australia
3Royal Brisbane and Women’s Hospital, The Australian e-Health Research Centre, CSIRO,Herston, Queensland 4029, Australia
4School of Medicine, The University of Queensland, St Lucia, Brisbane, Australia5QIMR Berghofer Medical Research Institute, Queensland 4006, Australia
6School of Psychology, The University of Queensland, St Lucia, Queensland 4072, Australia
r r
Abstract: Although different aspects of neuroplasticity can be quantified with behavioral probes, brainstimulation, and brain imaging assessments, no study to date has combined all these approaches intoone comprehensive assessment of brain plasticity. Here, 24 healthy right-handed participants practiceda sequence of finger-thumb opposition movements for 10 min each day with their left hand. After4 weeks, performance for the practiced sequence improved significantly (P< 0.05 FWE) relative to amatched control sequence, with both the left (mean increase: 53.0% practiced, 6.5% control) and right(21.0%; 15.8%) hands. Training also induced significant (cluster p-FWE< 0.001) reductions in functionalMRI activation for execution of the trained sequence, relative to the control sequence. These changeswere observed as clusters in the premotor and supplementary motor cortices (right hemisphere, 301voxel cluster; left hemisphere 700 voxel cluster), and sensorimotor cortices and superior parietallobules (right hemisphere 864 voxel cluster; left hemisphere, 1947 voxel cluster). Transcranial magneticstimulation over the right (“trained”) primary motor cortex yielded a 58.6% mean increase in a mea-sure of motor evoked potential amplitude, as recorded at the left abductor pollicis brevis muscle. Cor-tical thickness analyses based on structural MRI suggested changes in the right precentral gyrus, rightpost central gyrus, right dorsolateral prefrontal cortex, and potentially the right supplementary motorarea. Such findings are consistent with LTP-like neuroplastic changes in areas that were already
Additional Supporting Information may be found in the onlineversion of this article.
Contract grant sponsor: National Health and Medical ResearchCouncil of Australia; Contract grant number: APP1012153; Con-tract grant sponsor: Australian Research Council Laureate Fellow-ship; Contract grant number: FL110100103
Lee B. Reid and Martin V. Sale are the joint first authors.*Correspondence to: Prof. Stephen Rose; The Australian e-HealthResearch Centre, CSIRO, Royal Brisbane and Women’s Hospital,
Herston, Queensland 4029, Australia. E-mail: [email protected]
Received for publication 9 June 2017; Accepted 19 June 2017.
DOI: 10.1002/hbm.23710Published online 5 July 2017 in Wiley Online Library (wileyonli-nelibrary.com).
r Human Brain Mapping 38:4773–4787 (2017) r
VC 2017 Wiley Periodicals, Inc.
responsible for finger sequence execution, rather than improved recruitment of previously nonutilizedtissue. Hum Brain Mapp 38:4773–4787, 2017. VC 2017 Wiley Periodicals, Inc.
Key words: neuroplasticity; cortical thickness; functional magnetic resonance imaging; magnetic reso-nance imaging; transcranial magnetic stimulation; motor; motor cortex
r r
INTRODUCTION
The brain is capable of remarkable structural and func-tional change to allow it to optimize performance. Suchchanges, collectively referred to as plasticity, are key tounderstanding a variety of real-life phenomena, such asthe learning of new skills [Sanes and Donoghue, 2000], thestoring of memories [Xu et al., 2009], and recovering neu-rological function after brain injury [Nudo et al., 1996].
By definition, plasticity results in functional and/orstructural change [Pascual-Leone et al., 2005]. At themicroscopic level, plasticity in the central nervous systemcan manifest in several different ways. Sprouting of newconnections, unmasking of hidden or inhibited synapticconnections, and withdrawal of inhibition are some exam-ples of these changes [Barron et al., 2016; Hoy et al., 1985;Kong et al., 2016]. Another form of plasticity is referred toas long-term potentiation (LTP), which reflects an increasein synaptic efficacy [Bliss and Collingridge, 1993; Matsu-zaki et al., 2004]. Behaviorally, neuroplastic changes typi-cally manifest as altered task performance, such asimproved speed of movement. Measuring performance oftasks before and after training provides a means of assess-ing the functional impact of training. Although such anapproach can allow for an investigation of the effects ofvarious factors on plasticity (e.g., aging, attention, and hor-mones), a purely behavioral approach is unable to shedlight on the location and type of brain changes that occurafter training. To probe the biological changes subservingplasticity, brain stimulation and brain imaging techniquesare required, each with their own relative advantages anddisadvantages [Reid et al., 2016].
In the area of motor-skill acquisition, almost all studiesinvestigating neuroplasticity have, so far, relied on animalmodels, cross-sectional data, or functional measures ofbrain change [Chang, 2014]. In rodents, motor trainingappears to upregulate synaptic plasticity in the primary ofmotor cortex [Rioult-Pedotti et al., 2000], and may also beassociated with altered neural recruitment in this area[Costa et al., 2004]. In humans, early work using structuralmagnetic resonance imaging (MRI) suggested that differ-ences in morphology of the primary motor cortex mayexist between expert musicians and the general population[Amunts et al., 1997]. Since then, functional MRI (fMRI)studies have reported altered activity in motor planning inprofessional sports people [Milton et al., 2007], and trans-cranial magnetic stimulation (TMS) studies have similarlyreported that skilled racquet players have a larger cortical
representation of the hand than the general population[Pearce et al., 2000]. Functional MRI work has also sug-gested that the supplementary motor area (SMA), dorsolat-eral prefrontal cortex (dlPFC), and caudate nuclei mayplay integrated roles in error correction and learning ofmotor sequences [Chevrier et al., 2007; K€ubler et al., 2006].
Longitudinal studies are particularly useful for studyingneuroplasticity as they eliminate the possibility that neuraldifferences are the cause, rather than result, of participantsdeciding to learn a skill. Several reports exist of changes inbrain function in response to motor training [e.g., Chang,2014; Orban et al., 2010], including in the pre- and post-central gyri, dlPFC, and basal ganglia [Floyer-Lea andMatthews, 2005]. Many extensive reviews of such workare available, including Chang et al. [2014], Dayan andCohen [2011], Doyon et al. [2009], and others. In brief,trained tasks in such studies have been somewhat hetero-geneous, and both increases [Karni et al., 1995] and rela-tive decreases in fMRI activation have been reported, oftenwithin the same study [Floyer-Lea and Matthews, 2005;Ma et al., 2010; Xiong et al., 2009]. The direction of changeappears to depend on the duration of training [Dayan andCohen, 2011; Floyer-Lea and Matthews, 2005; Xiong et al.,2009], potentially due to increases in baseline cerebralblood flow [Xiong et al., 2009], though what constitutes“short-term” or “long-term” training appears to be taskdependent [Dayan and Cohen, 2011]. A small number ofreports have also detailed minute structural changes ingrey matter in response to visuo-motor tasks, particularlyin the sensorimotor cortex [Bezzola et al., 2011], visual cor-tex, and superior parietal lobule [Draganski et al., 2004;Scholz et al., 2009], all areas associated with visuo-motorskills.
So far, research in this area has predominantly relied onsingle data collection modalities, such as TMS, or fMRI.Unfortunately, the differences in study design, contrasts,time-period, and imaging modalities of these studies canmake it difficult to achieve a deeper understanding of thecritical experimental parameters that yield reliable brainchanges, whether such changes are typically concurrent orindependent, and so on. In addition, each modality has itsown limitations regarding reliability or interpretability,which can hamper insight into biological processes whenonly a single modality is acquired. For example, due to itsindirect method of measuring brain activity, it is difficultto unambiguously interpret changes in fMRI in terms ofbiology without independent concurrent information, par-ticularly given that controlling for task equivalency across
r Sale et al. r
r 4774 r

scans can be difficult to achieve [Reid et al., 2016]. Collect-ing multiple modalities can also alleviate concerns thatresults in one modality simply reflect statistical anomalies,rather than subtle brain changes. For these reasons, thelongitudinal study of motor training presented here con-currently acquired data on four different measures of neu-roplasticity—behavior, TMS, fMRI, and cortical thickness.Findings from a fifth measure, diffusion MRI, appear in asecond, companion study [Reid et al., 2017]. Each of thesemodalities helps to build a global picture of the changesthat occur with motor training, by reporting on a slightlydifferent aspect of the neuroplastic response.
TMS can evoke a clearly discernible and quantifiablemotor response when motor cortical neurons are stimu-lated at sufficient intensity [Hallett, 2000]. This TMS-evoked response, referred to as a motor evoked potential(MEP), reflects the excitability of underlying cortical neu-rons. Measuring the amplitude of the MEP before andafter a training paradigm provides objective measurementof changes attributed to cortical motor plasticity [Stefanet al., 2000]. This is different from other, nonmotor regions,where brain stimulation-evoked responses are more diffi-cult to quantify (e.g., prefrontal brain regions), yet whichalso undergo changes via the same, ubiquitous, mecha-nisms. Although TMS is ideally suited to quantifytraining-related change arising in the motor cortex, thereare several limitations to the technique. In particular, TMScan only penetrate superficial grey matter structures [Rothet al., 2007], and can only probe the activity of one area ofcortex at a time. Therefore, TMS is unable to provide infor-mation on whole-brain changes arising from training.
Whole-brain assessment of plastic change arising withtraining can be investigated with both functional andstructural MRI. Functional MRI of local blood oxygenationlevel-dependent (BOLD) signals provides informationabout changes in brain activity during tasks with high sen-sitivity and excellent spatial resolution. However, fMRIcannot readily distinguish whether any measured changesfollowing training reflect excitatory or inhibitory activity[Logothetis, 2008], something that TMS can do. Changes inBOLD signals are also more straightforward to interpret,in terms of biological change, when in the context of infor-mation from other modalities, such as TMS [Reid et al.,2016]. By contrast, if conducted carefully, structural MRIcan measure changes in cortical thickness that are moredirectly interpretable in terms of biology but, withoutaccompanying functional measures, are difficult to link toany changes in brain activity.
With these points in mind, the aim of this study was touse a multimodal approach to investigate plasticity in thehuman cortex. We measured behavior, TMS-evoked MEPs,BOLD changes using fMRI, and cortical thickness, beforeand after 4 weeks of motor training. To make interpreta-tion of the results more straightforward, we opted fortraining that did not have any visual component. OurTMS analyses were conducted on the trained hemisphere
and tested for increased MEP amplitude which couldreflect altered connectivity induced by an LTP-like processunderlying motor training. For our fMRI analysis, wetested for both task-induced increases and decreases inactivation within sensorimotor cortices, SMAs, and supe-rior parietal lobes. These phenomena may reflect alteredprocessing in the “trained” hemisphere, and potentially analtered balance of interhemispheric inhibition. AlthoughfMRI changes in higher areas, such as the dlPFC, werepossible, we did not test for these explicitly. Finally, wetested for increased cortical thickness in motor areas of thetrained hemisphere, given reports of subtle changes invisuomotor areas associated with visuomotor learning[Bezzola et al., 2011; Draganski et al., 2004; Scholz et al.,2009]. In combination with our parallel analysis of whitematter and network changes [Reid et al., 2017], this workprovides a comprehensive assessment of the functionaland structural brain changes associated with motor train-ing in humans.
MATERIALS AND METHODS
Overview
Twenty-four participants were recruited (14 female;aged 28.8 6 1.5 years; range 18–40 years). Participants wereall right handed (laterality quotient 0.92 6 0.03; range0.58–1.0) as assessed by the Edinburgh Handedness ques-tionnaire. Participants trained daily on a finger-thumbopposition task [Karni et al., 1995] for 4 weeks. Behavioral,MRI, and TMS measures were obtained before and imme-diately after the training period to quantify training-related changes. Participants were instructed to refrainfrom the consumption of known neuroactive substances(including caffeine and alcohol) before and during thetraining and quantification sessions. No participantsreported any adverse effects. The study was approved bythe University of Queensland Human Research EthicsCommittee and all participants gave written informedconsent.
Motor Training Task
The training task has been used in a previous indepen-dent study, in which it was reported to induce robustbehavioral and functional changes [Karni et al., 1995]. Thetask involved participants performing a sequence offinger-thumb opposition movements with their non-dominant (left) hand (Fig. 1). Participants were pseudoran-domly assigned one of two sequences that were mirror-reverse copies of each other. Participants were instructedto perform their assigned sequence as quickly and as accu-rately as possible for 10 min each day for 4 weeks, andnot to look at their hand during training. To help remem-ber the correct sequence, participants were given a printedcopy of their allotted sequence (red or blue; see Fig. 1). To
r Widespread Training-Induced Changes in the Human Brain r
r 4775 r

minimize any circadian effects on motor training [Saleet al., 2008], each participant was randomized to practicingeither during the morning or evening, and conductedtraining at the same time each day. Participants kept alog-book to record their training, and were instructed tobe honest when training sessions were missed, or wereperformed outside of the specified training time.
Behavioral Measure
Participants’ performance on the finger-thumb opposi-tion tasks was assessed as the number of correct sequencescompleted in 30 s. Performance was documented onlinewith a hand-held video camera, and quantified offline.Participants performed both red and blue (Fig. 1) sequen-ces with both their left and their right hands. This was toinvestigate whether training induced any spill-over ofeffects to a nontrained sequence and/or the contralateralhemisphere. The order of the sequences performed wasrandomized for each participant. To minimize errors, andto assist in performance, a print-out of the sequence to beperformed was placed in front of the participant for theduration of that task. Furthermore, prior to the quantifica-tion of baseline performance of the sequences (beforetraining), participants were given a brief period of time(�5–10 sequences) to practice the two sequences.
Performance on the finger-thumb opposition sequenceswas analyzed using a three-way repeated measuresANOVA with within-participant factors of training (base-line, post), hand (left, right), and sequence (trained, control).Where appropriate, post hoc analyses were performedusing Holm–Bonferroni corrected paired t tests.
Functional MRI
Functional MRI images were acquired in the same ses-sion as structural MRI images. We acquired 41 axial slices(slice thickness, 3.3 mm) using a gradient EPI sequence(TR 2.67 s; TE, 28 ms; flip angle, 908; field of view, 210 3
210 mm; voxel size, 3.3 3 3.3 3 3.3 mm). A liquid crystaldisplay projector back-projected the stimuli onto a screenpositioned at the head-end of the scanner bore. Partici-pants lay supine within the bore of the magnet andviewed the stimuli via a mirror that reflected the imagesdisplayed on the screen. Participant head movement wasminimized by packing foam padding around the head.
Prior to entering the scanner, participants familiarizedthemselves with the two movement sequences—“trained”and “control”—they were going to perform within thescanner. The sequences are shown in Figure 1. Within thescanner, participants performed these finger-thumb oppo-sition movements with their left hand in blocks of 16 s,each followed by 16 s of rest. During rest blocks, a visualdisplay showed a “Rest” command. At the start of eachmovement block a visual cue—displaying either the red orblue hand and corresponding movement sequence—noti-fied participants whether they would be performing thetrained or the control sequence. This was displayed for2 s, and then removed. Participants then performed therequired sequence at a rate of two movements (of thesequence) per second. As a cue to aid in this timing, a fix-ation cross flashed at 2 Hz on the screen. A tone alsosounded at 2 Hz intervals throughout the acquisition. Thelast two tones in each movement block were at progres-sively lower pitches to notify participants that a rest blockwas imminent. Immediately following completion of eachmovement block (i.e., following the last fixation cross), a“Stop” command was presented for 1 s, which was thenreplaced with the “Rest” command, Four consecutive“runs” were performed. Each run consisted of fourtrained-sequence blocks, four control-sequence blocks, andseven rest blocks. The order of the trained/controlsequence blocks was randomized but kept consistentbetween participants. Correct performance of the sequencewas verified by recording the movements with a videocamera, which were later reviewed for accuracy.
Image processing and statistical analyses were per-formed using SPM12 (Wellcome Department of ImagingNeuroscience, UCL, London, UK). Functional data vol-umes were slice-time corrected and realigned to the firstvolume. The mean image of the resultant time series wasco-registered with the participant’s temporally-unbiasedT1 template (see Methods: Cortical Thickness). The timeseries was then normalized into MNI space, an MNI brainmask was applied, and the result smoothed with an 8 mmFWHM isotropic Gaussian kernel. For first-level statisticalanalyses, contrasts were conducted for (a) movement> rest(b) trained> rest, and (c) control> trained sequence blocks.All six motion parameters for each run were included asnuisance regressors. The second level analysis looked at
Figure 1.
Participants were randomized to practicing one of two finger-to-
thumb opposition sequences. For the “blue” sequence (left), the
order of fingers required to make contact with the thumb were
little, index, ring, middle. For the “red” sequence (right), the
order was little, middle, ring, index. These sequences were mir-
ror images of one another. [Color figure can be viewed at
wileyonlinelibrary.com]
r Sale et al. r
r 4776 r

the interaction between sequence and time point (i.e., base-line [control> trained] vs post [control> trained]). Thiswas designed to test whether motor training altered thebrain’s response to performance of the trained sequence,taking into account any changes that were unrelated totraining, or pre-existing differences between responses tothe control and trained sequences (although no baselinedifferences were expected). It was possible that the trainedor control sequence would show greater BOLD responsesafter training, and so we treated this as a two-tailed test.To account for this, we set a more conservative cluster sig-nificance level of P< 0.025 FWE with minimum clustersize of 200 voxels, after voxel-wise thresholding atP< 0.0005 uncorrected.
TMS Mapping
Mapping of motor cortical excitability with TMS wasperformed in a separate laboratory, after MRI acquisition.Surface electromyographic recordings were obtained fromthe left abductor pollicis brevis (APB) muscle. Recordingswere made using silver/silver-chloride surface electrodeswith the active electrode placed over the muscle belly, andthe reference electrode placed over the adjacent metacar-pophalangeal joint. Signals were amplified (10003) andband-pass filtered (20–1000 Hz) using a NeuroLog system(Digitimer), then digitized (2000 Hz) with a data acquisi-tion interface (BNC-2110; National Instruments) and cus-tom MATLAB software (MathWorks). Signals weremonitored online for movement-related activity usinghigh-gain electromyography and a digital oscilloscope.
Mapping of motor cortical excitability before and aftertraining involved applying TMS to the right hemisphere ina grid like pattern (described below). The TMS was deliv-ered using a Magstim 2002 stimulator (Magstim, UK) anda figure-of-eight coil (70 mm diameter). The coil was posi-tioned with the handle pointing backwards at a 458 angleto the sagittal plane to preferentially induce current in aposterior-to-anterior direction in the cortex. The optimalscalp position for evoking electromyographic responses inthe APB was established as the position that consistentlyevoked the largest MEP amplitude in this muscle with aslightly suprathreshold intensity. Resting motor threshold(RMT) was determined and defined as the minimum stim-ulus intensity which evoked an MEP of at least 50 mV in atleast 5 out of 10 successive stimuli. The TMS intensityused for the mapping procedure was set at 120% of RMT.This stimulus intensity was established for both pre- andpost-training sessions.
Prior to participants’ first TMS mapping session, theirindividual T1 MRI scan was processed with the neuro-navigation software ASA-Lab (ANT, The Netherlands).Markers were placed on the scalp surface of the structuralscan in a grid-like pattern spanning the entire right hemi-sphere. The grid commenced at the vertex, and markerswere placed every 1 cm anteriorly and posteriorly from
the vertex, and then extended out laterally (to the right) in1 cm increments. Marker sites were targeted with TMSusing a Polaris-based infrared frameless stereotaxic systemand Visor software (ANT, The Netherlands). Five TMSpulses were applied to these markers every 5 s. Themarkers were stimulated systematically, moving in amedial-to-lateral direction. Stimulation of the marker sitescontinued until the average MEP amplitude from a markersite fell below 50 mV. Those sites where average MEPs metor exceeded this amplitude were referred to as active.Once a row of markers had been assessed, stimulationwas moved either 1 cm anteriorly or posteriorly (chosenrandomly), until all active marker sites had been stimu-lated and identified. The MEP volume [Schabrun et al.,2009] was also calculated before and after training. Thiswas calculated by summing the mean MEP amplitude ofall the active sites.
Training-related increases in the number of active sites andMEP volume were investigated using separate one-tailed,paired t tests to compare pretraining measurements withthose acquired after training. Significance was set as P< 0.05after Holm–Bonferroni multiple comparisons correction.
Cortical Thickness
We examined cortical thickness changes arising inresponse to motor training. We acquired MPRAGE T1images (0.9 mm isotropic) immediately before (“baseline”)and after (“post”) the 4 week training period using a 3 TMR system (Magnetom Trio, Siemens) and a standard 32-channel head coil. Images were processed with AdvancedNormalization Tools (ANTs; v2.1.0, source pulled 9th Feb2016). An overview of the processing pipeline is shown inFigure 2.
Single participant analyses
In longitudinal analyses, it is important to utilize tem-plates that are invariant to either time point, to boost sta-tistical power and avoid false-positives induced byregistration bias [Thomas et al., 2009]. Although ANTsprovides a longitudinal cortical thickness script, we foundthat the templates produced by this script on our systemwere commonly biased toward one time point. Therefore,we constructed templates for each participants by rigid-registering the baseline and poststructural images togetherusing ANTS SyN (symmetric) transform [Avants et al.,2008] after skull-stripping, N4 bias-field correction andintensity normalization. Time points were transformed byhalf of the resulting matrices then averaged, producing anapproximate template that was unbiased with respect totime point. This initial template was converted into asharper, segmented, template using the antsMultivariate-TemplateConstruction script, followed by the antsCorticalTh-ickness script using the ANTs NKI template. Each axial,coronal, and sagittal slice was then carefully visuallyinspected. In instances where dura or skull were classified
r Widespread Training-Induced Changes in the Human Brain r
r 4777 r

as grey matter, or the brain undersegmented, edits weremade to the brain mask using ITK Snap v3.4.0 [Yushke-vich et al., 2006], and the script was rerun with theupdated brain mask. For this study, particular emphasiswas placed on achieving highly precise segmentations ofthe parietal and frontal lobes (Supporting Information, Fig.1) due to their known association with, or proximity to,areas involved in motor training and/or learning. The pro-cess was repeated until we were satisfied with the finalsegmentations. Examples of acceptable and unacceptable
segmentations are provided in Supporting Information,Figure 2. Posterior tissue probabilities were then convertedinto priors in a manner consistent with ANTs antsCook-TemplatePriorsCommand script.
The antsCorticalThickness script was applied to structuralimages from both time points, utilizing the single subjecttemplate, producing a cortical thickness map in single-subject-template space. Subtraction of the pretraining frompost-training cortical thickness images produced a corticalthickness difference image.
Figure 2.
Cortical thickness pipeline. Steps are indicated with numbers.
(1) Structural volumes from the baseline (left column) and post
(right column) were preprocessed, skull-stripped, and registered
using a symmetrical registration. The resulting half transforms
were applied to non-skull-stripped images to achieve an interme-
diate image (top, middle column), which was processed into a
sharp single subject template. (2) The single-subject template
was then skull-stripped and segmented. The result was carefully
visually inspected. (3) If the segmentation was considered inaccu-
rate, the brain mask was manually edited and Step 2 was rerun.
(4) If the segmentation was successful, each time point was then
re-skull-stripped and segmented using the single subject template
(middle row of left and right columns), and cortical thickness
calculated (bottom row of left and right columns). (5) Cortical
thickness at each time point was moved into single-subject tem-
plate space, subtracted, and this difference transformed into
MNI space for statistical analysis using the known transform
between the single-subject template and MNI space. Statistical
analyses were then performed across all subjects, resulting in
statistical maps (bottom row, middle column). Images here are
purely illustrative; orientation differences have been exaggerated
to convey concepts clearly. [Color figure can be viewed at
wileyonlinelibrary.com]
r Sale et al. r
r 4778 r

Statistical analysis
We hypothesized that any region of change would likelybe substantially smaller than atlas ROIs, and so opted forvoxel-based morphometry. Single-subject template T1s wereregistered to FSL’s 1 mm isotropic MNI152 atlas (Fig. 2)using ANTs SyN, and the resultant transforms applied tocortical thickness difference images. Voxels where the whitematter was the most probable tissue, as defined by the meanof all single-subject tissue priors, were excluded. Imageswere then smoothed with a 5 mm FWHM kernel and placedinto a factorial model in SPM 12 (http://www.fil.ion.ucl.ac.uk/spm/software/spm12/). This model regressed changein cortical thickness against time point. This model includedsex as a factor to account for its previously reported effectson cortical thickness [Luders et al., 2006], and includedANCOVA normalization for nuisance effects to account forany remaining global differences. In the interests of accuracyand statistical power, we restricted our analysis to the parie-tal and frontal lobes—the areas which received particularfocus during segmentation correction (Supporting Informa-tion, Fig. 1). We set our significance criteria as P< 0.05 FWEcorrected, or a cluster comprising more than 20 voxelsexpressing values P< 0.001 uncorrected.
TMS and MRI Overlay
To interpret TMS, fMRI, and cortical thickness resultstogether, it was important to show reasonable anatomicalcorrespondence between the methods. To achieve this,TMS MEP responses were projected into MNI 152 space.This was achieved by converting each active site fromTalairach to MNI coordinates, using the Lancaster trans-form [Lancaster et al., 2007], then connecting neighboringmeasurement nodes to form a mesh. An edge of zero-value nodes was added to the outside of this mesh, basedon the position of neighboring nodes. A duplicate of thismesh was projected 20 mm toward the midline of the baseof the brain (x 5 0, y 5 0), reflecting the approximate pene-tration of the TMS pulse. Values on the grid were normal-ized between 0 and 1 on a per-participant basis. For eachparticipant, a volume was generated by linearly interpolat-ing all voxels in MNI space between the inner and outersurfaces of the grid by the nearest surrounding 8 nodes.All participants’ volumes were averaged to produce amean image. This overlay was used for visual comparisonof the modalities only; it was not used for quantification ofTMS MEPs.
RESULTS
Behavioral Performance
There was no difference in behavioral performance forthe morning and evening training groups, and thereforethe data for the two groups were pooled for subsequentanalyses. Prior to training, participants were equally profi-cient at performing the trained and control sequences with
their left and right hands. Following training, there was asignificant improvement in the number of sequences par-ticipants could complete in the 30 s period (Fig. 3; effect oftime P< 0.001, partial g2 5 0.16; side 3 sequence 3 timeinteraction P< 0.01, partial g2 5 0.026). Using the left(trained) hand, the number of correct sequences completedon the trained sequence increased by 53%, from 24.0 6 1.2(mean 6 SEM) to 36.7 6 2.1 (Holm–Bonferroni adjustedP 5 2.73 3 1029). There were also smaller, but significantimprovements in performance of the control sequencewith the left hand (24.48 6 0.94 to 25.65 6 0.79 [mean 6
SEM]; 6.5% increase; P 5 0.025 [Holm–Bonferroniadjusted]), the trained sequence with the right hand(22.22 6 1.11 to 26.48 6 1.22; 21.0% increase; P 5 7.53 3
1026), and the control sequence with the right hand(21.82 6 1.4 to 24.74 6 1.15; 15.8% increase; P 5 9.85 3
1026). Although participants improved to a greater degreeon the trained sequence than the control sequence (bothhands P< 0.05 FWE), this difference between sequenceswas substantially greater for the left than the right hand(P< 0.05 FWE)
fMRI Analysis
Of the 23 participants included in the fMRI analysis,none exhibited excessive (>2 mm or 28) head movementduring any session. Prior to training (Fig. 4), the trainedsequence versus rest contrast revealed four significant(P< 0.05 FWE) clusters that were located across a variety
Figure 3.
Increase in performance of motor training tasks following
4 weeks of training. Group data (n 5 24) showing number of
correct sequences performed prior to (blue bars) and following
(red bars) 4 weeks of training of a finger-thumb opposition
movement sequence (trained sequence). Participants performed
the trained and control sequence with their left hand (trained)
and right hand (not trained). Training improved execution speed
for all four hand-sequence combinations assessed (each P< 0.05
FWE). Data represent mean 6 SEM. [Color figure can be viewed
at wileyonlinelibrary.com]
r Widespread Training-Induced Changes in the Human Brain r
r 4779 r
of motor areas, predominantly in a bilateral manner,including the precentral gyri, postcentral gyri, SMAs, andsuperior parietal lobule. At this time, the activation of thetrained and control sequences were, as expected, equiva-lent (i.e., there were no significant clusters when con-trasted). Following training, however, the control sequence
evoked greater activation than the trained sequence in anumber of sensorimotor areas (Fig. 4), despite slightreductions in control-sequence activation in these areasafter training (Supporting Information, Fig. 3). To formallycompare these differences, we calculated the interactionbetween training type and time point (baseline [control>trained] versus post [control> trained]). For this contrast,positive t values indicated locations in which the trainedsequence showed reduced signal after training, relative tothe control sequence. In the left hemisphere, a significantcluster overlapped the postcentral gyrus and superior pari-etal lobule (1947 voxels, cluster p-FWE< 0.001; Table I). Inthe right hemisphere, a similar cluster overlapped the pre-central gyrus, postcentral gyrus, and superior parietal lob-ule (864 voxels, cluster p-FWE< 0.001; Fig. 5). Bothhemispheres also each demonstrated a significant clustercrossing the premotor cortex and SMA (left hemisphere,700 voxels; right hemisphere, 301 voxels; each clusterp-FWE< 0.001). Reversal of this contrast, highlightingareas of increased relative activation of the trainedsequence, revealed no significant clusters.
TMS Mapping
There was no significant change in RMT following train-ing (40.8% vs 41.6% maximum stimulator output; P> 0.05).By contrast, training induced an increase in the volume ofMEP amplitudes evoked at the targeted sites by an averageof 58.6% (P 5 0.015; Fig. 6). That is, with the same relativeTMS intensity (120% of RMT), MEPs evoked by TMS at theactive sites were significantly larger following training.There was no significant increase in the number of activesites evoked with TMS (P 5 0.09). A cortical heat-map froma representative participant is shown in Figure 6, togetherwith group-wise changes. A normalized group-wise heatmap (see Methods) is also shown in Figure 4.
Figure 4.
Mean of participants’ normalized TMS responses (Top; normalized
mV), positive BOLD activation during the trained task (middle; t
values for task vs rest), and positive t value map contrasting BOLD
for control sequence> trained sequence (bottom), overlaid on an
MNI 152 T1 image. The left and right columns show measures
before and after the training period, respectively. Crosshairs show
equivalent anatomical positions (MNI 152 coordinate: 37, 216,
57) to aid viewing. TMS and BOLD signals show a large degree of
overlap in the primary motor cortex. The TMS responses were
centered more anteriorly (motor 1 premotor), particularly after
training, than the BOLD responses (predominantly motor1 sen-
sorimotor). Details of TMS projection into MNI space is contained
in the text. [Color figure can be viewed at wileyonlinelibrary.com]
TABLE I. Locations of significant cluster fMRI peaks for
the time point–sequence interaction (baseline
[control > trained] > post [control > trained])
Cluster size Peak coordinates Anatomical locations
1947 226, 254, 54 L SPL244, 234, 36 L PoG232, 244, 52 L SPL
864 18, 256, 60 R SPL40, 230, 42 R PrG/PoG20, 248, 62 R SPL/PoG
700 212, 26, 64 L SMA224, 6, 40 L premotor/SMA224, 10, 42 L premotor
301 24, 28, 54 R premotor/SMA24, 22, 64 R premotor/SMA28, 210, 62 R premotor
Cluster size is in voxels. Peaks are in MNI 152 standard space.Abbreviations: L, left; PrG, precentral gyrus; R, right; SMA, sup-plementary motor area; SPL, superior parietal lobule.
r Sale et al. r
r 4780 r
Cortical Thickness
One participant’s dataset was lost during transfer to theserver, and so was excluded from both cortical thicknessand fMRI analyses. A second participant displayed slightMRI artefacts on the T1 images in the right sensorimotorcortex, and so was excluded from cortical thickness analy-ses. For a third dataset, we were unable to achieve high-quality tissue segmentation and so we excluded this data-set from cortical thickness analyses, leaving 21 participantsin total for these analyses. Unthresholded t-value imagesare provided in Supporting Information, Figures 4 and 5.At an uncorrected threshold of P< 0.001, training resultedin an increase in cortical thickness in the right precentralgyrus (81 voxel cluster), right post central gyrus (34 voxelcluster) and right dlPFC at approximately Brodmann’sarea 9 (22 voxels; Fig. 7). The right SMA also containedtwo nearby clusters, 11 and 13 voxels in size, whose indi-vidual volumes did not cross our prespecified threshold,but whose sum did. Although these five clusters did notsurvive multiple comparisons correction (P< 0.05 FWE) allchanges were observed in regions that are likely to beinvolved with motor tasks, and all were in the right(“trained”) hemisphere. Notably, clusters at the pre- andpostcentral gyri were consistent with the expected location
of sensory and motor finger representations [Penfield andBoldrey, 1937; Wahnoun et al., 2015], and close to peaks inthe (post time point) TMS and fMRI maps. All clusterswere within the group-wise region of successful TMS exci-tation, and all but the prefrontal cluster were consistentwith regions of group-wise fMRI activation. To test therobustness of these findings, we removed data from thetwo participants who displayed the strongest performanceimprovements. In this reanalysis, the previously foundclusters in the precentral gyrus, postcentral gyrus, andprefrontal cortex were still apparent (data not shown).
DISCUSSION
The neural changes that accompany a period of motortraining contribute to the increase in performance. Under-standing how these neural changes manifest themselves isimportant in both guiding rehabilitation strategies [Reidet al., 2015], and understanding normal brain function.Such neural changes can be quantified in several ways,each with their respective advantages and limitations.Here, we show how utilizing several different methods toconcurrently quantify plasticity—behavioral, brain stimula-tion, functional brain imaging, and structural brain
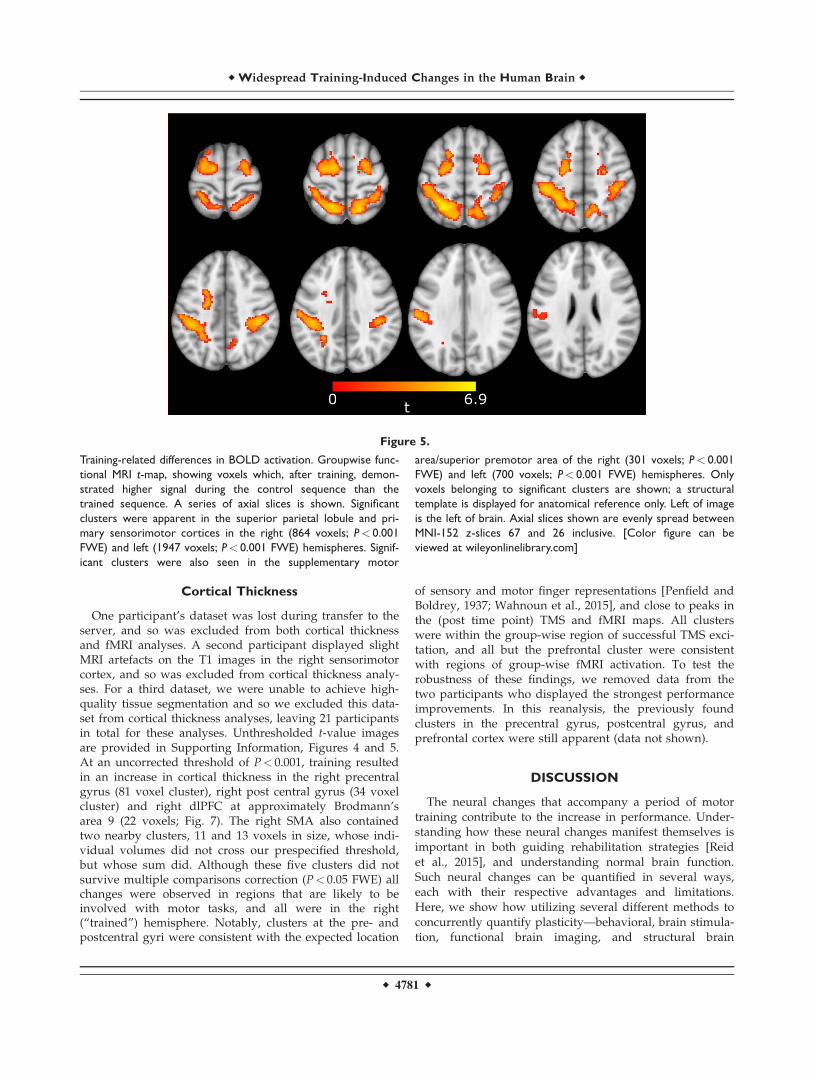
Figure 5.
Training-related differences in BOLD activation. Groupwise func-
tional MRI t-map, showing voxels which, after training, demon-
strated higher signal during the control sequence than the
trained sequence. A series of axial slices is shown. Significant
clusters were apparent in the superior parietal lobule and pri-
mary sensorimotor cortices in the right (864 voxels; P< 0.001
FWE) and left (1947 voxels; P< 0.001 FWE) hemispheres. Signif-
icant clusters were also seen in the supplementary motor
area/superior premotor area of the right (301 voxels; P< 0.001
FWE) and left (700 voxels; P< 0.001 FWE) hemispheres. Only
voxels belonging to significant clusters are shown; a structural
template is displayed for anatomical reference only. Left of image
is the left of brain. Axial slices shown are evenly spread between
MNI-152 z-slices 67 and 26 inclusive. [Color figure can be
viewed at wileyonlinelibrary.com]
r Widespread Training-Induced Changes in the Human Brain r
r 4781 r

imaging—can offer broad insight into the plastic changesthat arise following training. To our knowledge, thesemultimodal data from healthy adults provide the mostcomprehensive assessment of the functional and structuralchanges that occur following training to date. Multimodalassessments are particularly important in this context asthe measurement of minute brain changes is difficult. Posi-tive results from single modalities, then, are often inter-preted with caution (e.g., perception of potentialpublication bias). By contrast, coherent results from multi-ple, concurrently acquired and independently analyzedmodalities—as reported in this study, and its companionpaper [Reid et al., 2017]—lowers the probability of anoverall false positive.
Four weeks of training of a sequence of finger-thumbopposition movements resulted in a substantial improve-ment in performance. This was particularly true of thetrained sequence performed with the trained hand, forwhich correct sequence completions improved by 53% (Fig.
3). This was similar (albeit slightly lower) than reported intwo similar, yet smaller, studies [Karni et al., 1995; Xionget al., 2009]. To further investigate the brain changes arisingfrom training, we incorporated several other probes of corti-cal structure and function. Although transfer of skill didoccur, both between sequences and between hands, ourfMRI and TMS analyses were not explicitly designed toinvestigate such effects. Diffusion MRI analyses detailed ina companion paper [Reid et al., 2017] explored transfereffects in the same participant group in more detail.
Functional MRI
Our fMRI analyses revealed that, only after training, thetrained sequence evoked lower cortical activation bilater-ally than the control sequence (Fig. 5), predominantly inthe sensorimotor cortices and superior parietal lobe(Table I). The apparent relative reduction in functionalactivation reported here is at odds with an earlier smaller
Figure 6.
Training-related changes in motor cortical excitability. Top: A
heat-map representation of the cortical representation of the
abductor pollicis brevis before (left) and after (right) training in
one representative participant. Coordinates are referenced to
the vertex (0, 0). The average MEP amplitude evoked at each
site is indicated by the color scale (mV). Bottom: Mean number
of active sites (left) and MEP map volume (right) before (blue)
and after (red) training across all participants. There was no
increase in active sites following training, but MEP volume
increased significantly. [Color figure can be viewed at wileyonli-
nelibrary.com]
r Sale et al. r
r 4782 r

(n 5 6) study that used a very similar training and scan-ning approach [Karni et al., 1995]. A subsequent replica-tion of this work showed that fMRI activation decreasedduring the third and fourth weeks of training, and PETdata suggested that this was, at least in part, due to anincrease in baseline blood flow rather than a decrease inactual brain activity [Xiong et al., 2009]. This study pro-vides an interesting insight into these works: our contrastfocused on the interaction between time point and task,which means that, although changes in resting blood flow
may have occurred, such changes cannot explain ourresults. Specifically, as both the control and trained tasksevoked the same patterns of activation at baseline (Fig. 4),changes in resting cerebral blood flow would be expectedto affect both equally, and so cannot explain the statisticalinteraction reported here. An alternative, nonmutuallyexclusive, explanation is that local changes, such as LTP,allowed local grey matter that was responsible for per-forming the trained task prior to training to perform thetrained sequence more efficiently, reducing the need forrecruitment of surrounding areas. Further, because wecontrolled for execution speed during scanning, the parie-tal changes we report (i.e., increased activation in the con-trol vs trained sequence) might reflect a reduction inattentional resources required to perform the trainedsequence compared to the control sequence. This findingis consistent with the idea of more efficient processing.Future research using fMRI could be useful in investigat-ing such attentional network-related changes followingmotor training.
Previous research has highlighted that motor training issupported by changes in the allegiance of specializedregions to a given brain system, or module [Bassett et al.,2011]. For example, the analysis of fMRI data acquiredduring the performance of a motor sequence task over sixweeks revealed that increased automaticity in task perfor-mance is supported by a reduction in the functional inte-gration between motor and visual areas composing twodistinct brain modules [Bassett et al., 2011]. Moreover, thegained automaticity was related to the disengagement ofcognitive control hub regions comprising fronto-parietaland cingulo-opercular systems [Bassett et al., 2011]. Thesefindings echo recent results showing that a focal reductionof baseline activity in the primary motor cortex causes asignificant reorganization of functional connectivity pat-terns within the sensorimotor module and between thismodule and the rest of the brain [Cocchi et al., 2015]. Spe-cifically, a reduction in motor cortex excitability was paral-leled by enhanced functional connectivity within thesensorimotor module and reduced connectivity with othermodules of the brain. In this study, we did not directlyassess changes in connectivity as a function of trainingbut, previous findings suggest that the observed changesin local neural activity occur in the context of broaderchanges in brain network dynamics. Future work willneed to clarify the functional interplay between training-induced local changes in neural activity and global modu-lation of brain network dynamics.
Although motor training paradigms, similar to the oneemployed in this study, have been shown to induce LTP-like changes in cortical activity [Ziemann et al., 2004], itwould be fair to consider this hypothesis speculative ifbased on fMRI alone. A novel aspect of the present work,however, is providing evidence in support of this hypothe-sis from two additional lines of enquiry in the same partic-ipants: changes in TMS-evoked responses and changes incortical thickness.
Figure 7.
Areas of increase in cortical thickness overlaid on the FSL MNI
152 template. Light blue indicates voxels with significant (cluster
size> 20 voxels at P< 0.001 unc) increases in cortical thickness
estimation. Increases were seen in the right prefrontal cortex
(top row), and approximate hand areas of the right precentral
(middle row) and postcentral (bottom row) gyri. Red–yellow
indicates mean normalized TMS response, where yellow indi-
cates a strong response (mean� 30% normalized peak motor
evoked potential) and red indicates a weaker response (mean-
� 1% of normalized peak motor evoked potential); see text for
details. Left of coronal and axial images indicates left of brain.
Axial slices (top-to-bottom) show MNI y coordinates 30, 23,
and 218. Sagittal slices show MNI x coordinates 44, 58, and 61.
[Color figure can be viewed at wileyonlinelibrary.com]
r Widespread Training-Induced Changes in the Human Brain r
r 4783 r

Transcranial Magnetic Stimulation
TMS provides an indirect way to assess LTP-likechanges in cortical excitability. Since TMS activates motorcortical output neurons trans-synaptically, if synaptic effi-cacy is increased, this should lead to an increase in theamplitude of the MEP at a given stimulus intensity [DiLazzaro and Ziemann, 2013]. Here, we showed that MEPamplitudes were larger following training (Fig. 6). Nota-bly, there was no significant change in the area that couldevoke an MEP in the APB. This suggests that the changesindexed by TMS were predominantly driven by changesin neural networks that already played a role in contrac-tion of the APB.
To consider TMS and MRI evidence together, it isimportant that these are viewed with respect to oneanother, to ascertain that regions of measurement (or sig-nal change) for these modalities have reasonable anatomi-cal overlap. In this study, the areas of cortex that wereactivated by the trained sequence (in the trained hemi-sphere) during fMRI scans were very similar, though notidentical, to areas eliciting MEPs during TMS mapping(Fig. 4). TMS and fMRI map markedly different aspects ofmotor control, and so perfect overlap between themshould not be expected: fMRI here contrasted BOLDresponses to sequential movement of the fingers andthumb versus rest, while TMS targeted neurons function-ally relevant to activating the APB muscle.
Keeping in mind that there was no increase in the RMT,the TMS findings suggest that at least one of three pro-cesses have taken place: enhanced trans-synaptic transmis-sion (e.g., through LTP), increased neurite density, and/orimproved conduction of the corticospinal tract. Both thefirst and second of these possibilities support our earlierhypothesis introduced in the context of the fMRI results.The third possibility, regarding changes in white matter, isinvestigated in detail in our follow-up publication [Reidet al., 2017].
Cortical Thickness
Increased cortical thickness was observed after motortraining within the right SMA, right middle-frontal gyrus,and right precentral gyrus and right postcentral gyrus.Although cortical thickness changes did not reach ourstricter FWE-corrected threshold, the clusters of significantvoxels seen were sizeable (22–81 voxels @ P< 0.001) andstriking in their location. As previously mentioned, onemotivation for the present study was to index motor train-ing related brain changes across a variety of modalities tobetter understand to what degree, if any, these are concur-rent, and to build a more global picture of the processesthat allow behavioral improvement. Toward this aim, it isthen interesting that these changes in cortical thicknesswere substantially less strong than TMS, fMRI, behavior,and the diffusion measures reported in the accompanyingpaper [Reid et al., 2017]. Although these findings are not
definitive in themselves, they are interesting in the contextof our other findings. Specifically, the location of clustersin the pre- and post-central gyri were relatively consistentwith our fMRI maps, our TMS maps (Fig. 7), and withareas responsible for sensorimotor representation of thefingers elucidated through electrocorticographic and brainstimulation techniques [Penfield and Boldrey, 1937; Wah-noun et al., 2015]. The neighboring clusters seen in theright SMA were also within the TMS and fMRI maps fromour study, and consistent with previous findings that thisarea plays a role in motor training [Taubert et al., 2010].That cortical thickness changes were very subtle, whiletask performance was strongly improved, and other brain-change measures relatively clear cut, may be indicativethat the processes driving relatively short-term skill acqui-sition are not those that drive strong increases in corticalthickness. That these changes appeared near the peaks offMRI and TMS maps adds further credibility to the sug-gestion that changes in fMRI and TMS patterns were areflection of altered neurite organization, density, and/orconnection strength in regions that, at baseline, werealready predominantly responsible for execution of the(to-be) trained sequence, rather than altered responsibilityof surrounding areas.
The final location in which we saw changes in corticalthickness was the dlPFC, which is known to play animportant role in error-correction of motor output (alongwith the caudate nucleus) [Chevrier et al., 2007; K€ubleret al., 2006]. Structural changes in the dlPFC were towardthe edge of the TMS response map, and not in an area offMRI change. The role of the dlPFC is to modulate motorresponses, not generate them directly, and so it should notbe surprising that only small TMS responses wererecorded. Furthermore, we do not consider cortical thick-ness change here to be at odds with fMRI findings becausethe fMRI analysis was optimized for detection of motoroutput and conducted at around half the speed partici-pants were capable of at baseline; it did not contrast very-challenging-versus-relaxed motor performance, as wouldbe optimal to highlight an area that plays a role in errordetection. In fact, we believe this apparent discrepancyhighlights the usefulness of multimodality imaging inmeasuring neuroplasticity to provide a more accurateoverview of changes that take place during training [Reidet al., 2016]. The dlPFC and related areas were furtherinvestigated with diffusion imaging; these analyses aredescribed in a separate publication [Reid et al., 2017].
Biological Interpretation
MRI is not an optimal tool for the interpretation of bio-logical changes in terms of cellular physiology. Neverthe-less, it provides an excellent means of localizing brainchanges and, particularly when applied in a multimodalmanner, can suggest which family of processes mayunderlie changes. The behavioral, fMRI, TMS, and cortical
r Sale et al. r
r 4784 r

thickness changes presented here are consistent with anLTP-like change in the grey matter. Functional MRIshowed a task-specific reduction in BOLD signal, consis-tent with more efficient processing in the grey matter.TMS findings suggested that enhanced trans-synaptictransmission and/or improved corticospinal tract conduc-tion took place. Cortical thickness findings suggested sub-tle structural changes in the same regions. The fact thatcortical thickness findings were not strong suggests thatgross morphological changes to the grey matter were not aprimary driving force toward behavioral change. This ismore consistent with more subtle (dendritic or synaptic)changes rather than larger scale changes, such as glial cellproliferation or angiogenesis. The precise combination ofprocesses is not currently something that can be deter-mined with MRI alone. However, the locus of thesechanges—regions already involved in performing the non-trained task at baseline—indicates that improved functionis at least partially driven by more efficient grey matterprocessing in regions that, at baseline, were already pre-dominantly involved with the execution of the trainedsequence, rather than altered activation of surroundingareas.
Generalization to the Untrained Hand
We report improvements in task performance for bothsequences in both hands, despite only one sequence withthe nondominant hand being trained. Such cross-hemisphere generalization is at odds with one smallerstudy (n 5 6) that employed a similar training task [Karniet al., 1995], but is consistent with findings from severalother motor studies that utilized other tasks [Hicks et al.,1983; Teixeira, 2000]. Our fMRI analyses revealed that,after training, execution of the trained sequence with theleft-hand elicited reduced activation relative to the controlsequence, bilaterally. However, the present results andthose of our companion paper [Reid et al., 2017] revealedno changes in the left hemisphere as measured with struc-tural or diffusion MRI. This discrepancy suggests thataltered fMRI and behavioral measures of the “untrained”side may reflect changes in grey matter, such as LTP oraltered neurite density, that were too subtle to be detectedby structural MRI. Techniques such as neurite orientationdispersion and density imaging [Zhang et al., 2012], orbilateral TMS, EEG, or fMRI tasks targeting the oppositehand, might allow future studies to shed further light onthis issue.
Limitations
This study was designed to maximize the amount ofconcurrently acquired information. Practical consider-ations, however, meant that the depth of investigationswith each modality had to be limited, leaving some openquestions for future studies. For example, more
challenging rates of task execution were not assessed usingfMRI. Including such a manipulation might have helpedus interpret the changes in dlPFC and related structures,as reported both here and in our diffusion MRI work[Reid et al., 2017]. Similarly, TMS was not acquired for the“untrained” hemisphere. Including such a condition mighthelp to understand processes responsible for skill transferbetween hemispheres. Future work could also further illu-minate these processes by including an additional timepoint, several days or weeks following the cessation oftraining. Another possibility would be to include dailybehavioral assessments, to assess whether training-relatedbrain changes reflect continuous skill acquisition, orinstead track ongoing learning processes themselves andsubside once skill level reaches a plateau. In a multiple-time point study of this nature, collecting behavioral errorrates, in addition to successful-sequence completion rates,would also be advantageous.
CONCLUSION
We have shown that 4 weeks of motor training caninvoke robust changes in behavior, cortical thickness, fMRIactivation, and TMS-evoked motor maps in motor regionsof the brain. Taken together with our diffusion MRI find-ings [Reid et al., 2017], the work presented here providesthe most cohesive and comprehensive longitudinal studyof motor plasticity in healthy adult humans to date. Allthree brain measures suggested that motor training wasdriven by LTP-like plasticity that was relatively wide-spread across the sensorimotor system—even when a par-ticipant is trained on a simple task solely on the basis ofproprioceptive feedback.
CONFLICT OF INTEREST
The authors declare that they have no conflicts ofinterest.
ACKNOWLEDGMENTS
The funders had no role in study design, data collectionand analysis, decision to publish or preparation of themanuscript. The content is solely the responsibility of theauthors and does not necessarily represent the officialviews of the funding bodies. The authors declare no com-peting financial interests. The authors would like to thankDr Amanda Robinson, Dr David Lloyd, and Dr DanielStjepanovic for technical assistance.
REFERENCES
Amunts K, Schlaug G, J€ancke L, Steinmetz H, Schleicher A,
Dabringhaus A, Zilles K (1997): Motor cortex and hand motor
skills: Structural compliance in the human brain. Hum Brain
Mapp 5:206–215.
r Widespread Training-Induced Changes in the Human Brain r
r 4785 r

Avants BB, Epstein CL, Grossman M, Gee JC (2008): Symmetric
diffeomorphic image registration with cross-correlation: Evalu-
ating automated labeling of elderly and neurodegenerative
brain. Med Image Anal 12:26–41.Barron HC, Vogels TP, Emir UE, Makin TR, O’Shea J, Clare S,
Jbabdi S, Dolan RJ, Behrens TEJ (2016): Unmasking latent
inhibitory connections in human cortex to reveal dormant cor-
tical memories. Neuron 90:191–203.Bassett DS, Wymbs NF, Porter MA, Mucha PJ, Carlson JM,
Grafton ST (2011): Dynamic reconfiguration of human brain
networks during learning. Proc Natl Acad Sci U S A 108:
7641–7646.Bezzola L, M�erillat S, Gaser C, J€ancke L (2011): Training-induced
neural plasticity in golf novices. J Neurosci 31:12444–12448.Bliss TV, Collingridge GL (1993): A synaptic model of memory:
Long-term potentiation in the hippocampus. Nature 361:31–39.Chang Y (2014): Reorganization and plastic changes of the human
brain associated with skill learning and expertise. Front Hum
Neurosci 8:35.Chevrier AD, Noseworthy MD, Schachar R (2007): Dissociation of
response inhibition and performance monitoring in the stop
signal task using event-related fMRI. Hum Brain Mapp 28:
1347–1358.Cocchi L, Sale MV, Lord A, Zalesky A, Breakspear M, Mattingley
JB (2015): Dissociable effects of local inhibitory and excitatory
theta-burst stimulation on large-scale brain dynamics.
J Neurophysiol 113:3375–3385.Costa RM, Cohen D, Nicolelis MAL (2004): Differential cortico-
striatal plasticity during fast and slow motor skill learning in
mice. Curr Biol 14:1124–1134.Dayan E, Cohen LG (2011): Neuroplasticity subserving motor skill
learning. Neuron 72:443–454.Doyon J, Bellec P, Amsel R, Penhune V, Monchi O, Carrier J,
Leh�ericy S, Benali H (2009): Contributions of the basal ganglia
and functionally related brain structures to motor learning.
Behav Brain Res 199:61–75.Draganski B, Gaser C, Busch V, Schuierer G, Bogdahn U, May A
(2004): Neuroplasticity: Changes in grey matter induced by
training. Nature 427:311–312.Floyer-Lea a, Matthews PM (2005): Distinguishable brain activa-
tion networks for short- and long-term motor skill learning.
J Neurophysiol 94:512–518.Hallett M (2000): Transcranial magnetic stimulation and the
human brain. Nature 406:147–150.Hicks RE, Gualtieri CT, Schroeder SR (1983): Cognitive and motor
components of bilateral transfer. Am J Psychol 96:223.Hoy RR, Nolen TG, Casaday GC (1985): Dendritic sprouting and
compensatory synaptogenesis in an identified interneuron fol-
low auditory deprivation in a cricket. Proc Natl Acad Sci U S
A 82:7772–7776.Karni A, Meyer G, Jezzard P, Adams MM, Turner R, Ungerleider
LG (1995): Functional MRI evidence for adult motor cortex
plasticity during motor skill learning. Nature 377:155–158.Kong NW, Gibb WR, Tate MC (2016): Neuroplasticity: Insights
from patients harboring gliomas. Neural Plast 2016: (2365063).K€ubler A, Dixon V, Garavan H (2006): Automaticity and reestab-
lishment of executive control-an fMRI study. J Cogn Neurosci
18:1331–1342.Lancaster JL, Tordesillas-Guti�errez D, Martinez M, Salinas F,
Evans A, Zilles K, Mazziotta JC, Fox PT (2007): Bias between
MNI and Talairach coordinates analyzed using the ICBM-152
brain template. Hum Brain Mapp 28:1194–1205.
Di Lazzaro V, Ziemann U (2013): The contribution of transcranialmagnetic stimulation in the functional evaluation of microcir-cuits in human motor cortex. Front Neural Circuits 7:18.
Logothetis NK (2008): What we can do and what we cannot dowith fMRI. Nature 453:869–878.
Luders E, Narr KL, Thompson PM, Rex DE, Woods RP, DeLuca H,Jancke L, Toga AW (2006): Gender effects on cortical thicknessand the influence of scaling. Hum Brain Mapp 27:314–324.
Ma L, Wang B, Narayana S, Hazeltine E, Chen X, Robin DA, FoxPT, Xiong J (2010): Changes in regional activity are accompa-nied with changes in inter-regional connectivity during 4weeks motor learning. Brain Res 1318:64–76.
Matsuzaki M, Honkura N, Ellis-Davies GCR, Kasai H (2004):Structural basis of long-term potentiation in single dendriticspines. Nature 429:761–766.
Milton J, Solodkin A, Hlust�ık P, Small SL (2007): The mind ofexpert motor performance is cool and focused. Neuroimage 35:804–813.
Nudo RJ, Wise BM, SiFuentes F, Milliken GW (1996): Neural sub-strates for the effects of rehabilitative training on motor recov-ery after ischemic infarct. Science 272:1791–1794.
Orban P, Peigneux P, Lungu O, Albouy G, Breton E, Laberenne F,Benali H, Maquet P, Doyon J (2010): The multifaceted natureof the relationship between performance and brain activity inmotor sequence learning. Neuroimage 49:694–702.
Pascual-Leone A, Amedi A, Fregni F, Merabet LB (2005): The plas-tic human brain cortex. Annu Rev Neurosci 28:377–401.
Pearce a. J, Thickbroom GW, Byrnes ML, Mastaglia FL (2000):Functional reorganisation of the corticomotor projection tothe hand in skilled racquet players. Exp Brain Res 130:238–243.
Penfield W, Boldrey E (1937): Somatic motor and sensory repre-sentation in the cerebral cortex of man as studies by electricalstimulation. Brain 60:389–443.
Reid LB, Boyd RN, Cunnington R, Rose SE (2016): Interpretingintervention induced neuroplasticity with fMRI: The case formultimodal imaging strategies. Neural Plast 2016:2643491.
Reid LB, Rose SE, Boyd RN (2015): Rehabilitation and neuroplas-ticity in children with unilateral cerebral palsy. Nat Rev Neu-rol 11:390–400.
Reid LB, Sale MV, Cunnington R, Mattingley JB, Rose SE (2017):Brain changes following four weeks of unimanual motor train-ing: Evidence from fMRI-guided diffusion MRI tractography.Hum Brain Mapp 38:4302–4312.
Rioult-Pedotti M-SS, Friedman D, Donoghue JP (2000): Learning-induced LTP in neocortex. Science (80-) 290:533–536.
Roth Y, Amir A, Levkovitz Y, Zangen A (2007): Three-dimen-sional distribution of the electric field induced in the brain bytranscranial magnetic stimulation using figure-8 and deep H-coils. J Clin Neurophysiol 24:31–38.
Sale MV, Ridding MC, Nordstrom MA (2008): Cortisol inhibitsneuroplasticity induction in human motor cortex. J Neurosci28:8285–8293.
Sanes JN, Donoghue JP (2000): Plasticity and primary motor cor-tex. Annu Rev Neurosci 23:393–415.
Schabrun SM, Stinear CM, Byblow WD, Ridding MC (2009): Nor-malizing motor cortex representations in focal hand dystonia.Cereb Cortex 19:1968–1977.
Scholz J, Klein MC, Behrens TEJ, Johansen-Berg H (2009): Traininginduces changes in white-matter architecture. Nat Neurosci 12:1370–1371.
Stefan K, Kunesch E, Cohen LG, Benecke R, Classen J (2000):Induction of plasticity in the human motor cortex by pairedassociative stimulation. Brain 123: 572–584.
r Sale et al. r
r 4786 r

Taubert M, Draganski B, Anwander A, M€uller K, Horstmann A,Villringer A, Ragert P (2010): Dynamic properties ofhuman brain structure: Learning-related changes in corticalareas and associated fiber connections. J Neurosci 30:11670–11677.
Teixeira L. a (2000): Timing and force components in bilateraltransfer of learning. Brain Cogn 44:455–469.
Thomas AG, Marrett S, Saad ZS, Ruff DA, Martin A, BandettiniPA (2009): Functional but not structural changes associatedwith learning: An exploration of longitudinal Voxel-BasedMorphometry (VBM). Neuroimage 48:117–125.
Wahnoun R, Benson M, Helms-Tillery S, Adelson PD (2015):Delineation of somatosensory finger areas using vibrotactilestimulation, an ECoG study. Brain Behav 5:e00369.
Xiong J, Ma L, Wang B, Narayana S, Duff EP, Egan GF, Fox PT(2009): Long-term motor training induced changes in regional
cerebral blood flow in both task and resting states. Neuro-image 45:75–82.
Xu T, Yu X, Perlik AJ, Tobin WF, Zweig J. a, Tennant K, Jones T,Zuo Y (2009): Rapid formation and selective stabilization ofsynapses for enduring motor memories. Nature 462:915–919.
Yushkevich P. a, Piven J, Hazlett HC, Smith RG, Ho S, Gee JC,Gerig G (2006): User-guided 3D active contour segmentation ofanatomical structures: Significantly improved efficiency andreliability. Neuroimage 31:1116–1128.
Zhang H, Schneider T, Wheeler-Kingshott C. a, Alexander DC (2012):NODDI: Practical in vivo neurite orientation dispersion and den-sity imaging of the human brain. Neuroimage 61:1000–1016.
Ziemann U, Ilic TV, Pauli C, Meintzschel F, Ruge D (2004): Learn-ing modifies subsequent induction of long-term potentiation-like and long-term depression-like plasticity in human motorcortex. J Neurosci 24:1666–1672.
r Widespread Training-Induced Changes in the Human Brain r
r 4787 r