Embed Size (px)
Citation preview
Brand Loyalty, Advertising and Demand for
Personal Computer Processors:
The Intel InsideR© E�ect∗
Hugo Salgado†
First Draft, May 2008
Abstract
In this paper I estimate the e�ect of the Intel brand and advertising
expenditures on the demand for Personal Computer Central Process-
ing Units (PC CPU). Two �rms, INTEL and AMD, capture almost
the entire market in this industry. Intel has followed a brand posi-
tioning strategy based on strong advertising and marketing activities,
while AMD has centered its marketing strategy on lower prices. Even
though the two companies o�er products of similar quality, Intel has
a dominant position in the industry, capturing more than 75% of the
market share. I estimate random coe�cient demand models, using
∗This paper is a draft of the �rst chapter of my dissertation. In the second chapterI use the demand results to estimate a dynamic conduct parameter and in the thirdpaper I estimate a dynamic cost function with learning-by-doing under a Markov PerfectEquilibrium. Please do not cite nor circulate. All comments are welcome.†PhD. Candidate, Department of Agricultural and Resource Economics, University of
California at Berkeley. e-mail: [email protected]
1

brand and advertising to explain the large observed di�erences in mar-
ket share between AMD and INTEL. After controlling for quality and
other unobserved product characteristics, I �nd that consumers are
willing to pay a big premium for the Intel brand. Counterfactual ex-
periments shows that in absence of advertising di�erences between the
two �rms, Intel's market share would have been between 35% and
70%, suggesting that strong advertising campaigns have allowed Intel
to maintain a dominant position in the market. The results also sug-
gest that advertising in the industry has increased the total sales of
personal computers in about 25% and that advertising is combative
working as a tool to redistribute market shares between �rms.
2
1 Introduction
In the personal computer central processing unit (PC CPU1) market, two
�rms -Advanced Micro Devices (AMD) and Intel Corporation (INTEL)- cap-
ture more than 95% of the market, with INTEL capturing more than 75%
of the market. Over the years many �rms have tried to enter the market but
AMD is the only that has become an important competitor to Intel. During
the 1990s, AMD used a lower pricing strategy than Intel, and also created
and introduced several new products that performed in a similar or better
manner than those manufactured by Intel. Nevertheless, AMD products -
even those similar in quality to Intel products- have not been successful in
capturing a signi�cantly higher market share.
Several arguments have been put forth to explain the inability of AMD
to increase its market shares. Perhaps, the most important is that Intel
has created a strong brand reputation among consumers. The Intel Inside R©
advertising campaign is one of the most important advertising e�orts in the
PC industry; it represented the �rst time than a PC component manufacturer
directed advertising at �nal consumers. As a result of its advertising e�orts,
Intel has ranked �fth among the most important global brands since 2001,
with an estimated brand value of over $30 billion in 2007.2 In contrast, AMD
does not place importance on brand positioning and advertising; rather, it
concentrates its marketing strategy in low-prices, which has been shown to
have a negative e�ect on brand reputation (Jedidi, Mela and Gupta, 1999).
1The CPU is the brain of personal computers that performs all the information pro-cessing tasks required for computing.
2The Best Global Brands 2007, Interbrand and Business Week,http://www.interbrand.com.
3
The Intel Inside program was launched in 1991, at a time when AMD
was successfully producing and marketing clones of Intel 286 and 386 CPUs.
To di�erentiate its products, Intel developed the Intel Inside R© logo. It also
developed a cooperative marketing program with PC manufacturers, under
which it would provide a rebate to the manufacturer of up to 50% of PC
manufacturer marketing expenditures if it included the Intel logo in its ad-
vertising. By the end of 1991, more than 300 PC manufacturers had joined
the program. In 1994 Intel started its own TV advertising campaign and de-
veloped musical jingles to support the Intel Inside slogan. Since then, Intel
has conducted strong advertising and brand loyalty campaigns, directed at
both PC manufacturers and �nal consumers, in order to keep its brand rep-
utation. By the end of the decade, more than 2,700 PC manufacturers were
participating in the program, and more than $7 billion had been invested in
advertising under the Intel Inside campaign. Just in 2001, more than 150
million Intel stickers were printed and Intel spent more than $1.5 billion on
advertising under the cooperative program (Moon, 2005).
The marketing literature has recognized the e�ects of advertising on
building brand preferences (Jedidi, Mela and Gupta, 1999), and the use
of discrete choice models to measure the e�ects of advertising on demand
is common (see for example Sriram, Chintagunta and Neelamegham, 2006).
Bagwell (2007) presents a complete survey of the economic theory and empir-
ical studies of advertising. The author divides the literature into the three
di�erent theories of the e�ects of advertising on demand: the persuasive
view, the informative view and the complementary view. In the �rst view
advertising induces consumers to buy the good and acts as a combative tool
4
against competitors. From this point of view, advertising creates brand loy-
alty and results in greater market power for established �rms; it might have a
negative e�ect on welfare, and might be potentially excessive because it can
only redistribute consumers among brands. The second view contends that
advertising provides valuable information to consumers; therefore, it can be
bene�cial to consumers and facilitate entry of new �rms into the market.
From the second point of view, advertising is considered a cost associated
with providing information to consumers and it could be under or over pro-
vided in the market. The third view posits that consumers see advertising
as a complementary good to the product being advertised, and argues that
the two goods can only be bought as a bundle. This could be the case when,
for example, advertising provide �social prestige� to the product being con-
sumed. From this third point of view, advertising might be undersupplied
because of market incompleteness.
The empirical analysis of advertising is also diverse. Bagwell (2007) rec-
ognizes that there is no consensus on the e�ects of advertising; most e�ects
are industry-speci�c and vary on a case-by-case basis. Two important as-
pects in empirical analysis are (1) considering the endogeneity of prices and
advertising and (2) analyzing dynamic e�ects of advertising on consumer
preferences. Villas-Boas and Winer (1999) discuss the e�ects of price endo-
geneity and the use of marketing variables in discrete choice models. Some
authors �nd that advertising has long-lasting reputational e�ects over con-
sumer demand, while other �nd that the e�ects of advertising on sales are
largely depreciated within a year (Braithwaite 1928, Jastram 1955, Lambin
1976, Ashley, Granger and Schmalensee 1980, Boyd and Seldon 1990, Kwoka
5
1993, Leone 1995, among others). In terms of brand loyalty, Bagwell (20007)
concludes that existing studies do not provide strong evidence that advertis-
ing increases brand loyalty or stabilizes market shares. In the PC industry,
Goeree (2008) has analyzed the e�ects of advertising on the demand for PCs,
and �nds that advertising by PC manufacturers is an important component
in explaining the high markups in the PC industry because it focuses the
attention of uninformed consumers over a subset of the available products.
I am not aware of any published paper that have analyzed the e�ect of the
Intel brand on the demand for CPUs.
In this paper I estimate random coe�cient demand models with aggre-
gate data (following Berry 1994, Berry, Levinsohn and Pakes 1995, Nevo
2000). I incorporate brand and advertising e�ects to explain the high mar-
ket shares of Intel products in the industry. I use a proprietary dataset
containing quarterly sales and price data for 29 products manufactured by
AMD and Intel from 1993 to 2004. After controlling for price, quality and
other unobservable product characteristics of the products, I �nd that both
the Intel brand and the advertising expenditures allow to explain consumer
behavior and that consumers are willing to pay a high premium for Intel
products -between 30% and 50% of Intel average selling price- and that
if Intel had not employed strong advertising campaigns, its market shares
would be signi�cantly lower.
The rest of the paper is organized as follows. Section 2 presents the
demand model and the estimation algorithm; Section 3 discusses the main
characteristics of the market, the dataset and how advertising and brand
e�ects are incorporated in the demand model; Section 4 presents the results
6
and counterfactual simulations; Section 5 concludes and discusses the e�ects
of the assumptions on the modeling results.
2 The Model of Demand and the Estimation Algo-
rithm
This section presents the details of the random coe�cient demand model
and the estimation algorithm. Readers that are already familiar with the
model and are interested largely in the application can proceed to the next
section without missing anything fundamental.
Discrete choice models (DCM) of demand have a long tradition in the
study of demand for di�erentiated products. DCM assume that consumers
obtain welfare from product characteristics, including a random component
unobserved by the researcher, and that based on those characteristics, con-
sumers choose, from among the available products, the one that gives them
the highest expected utility. The use of this framework to estimate demand
for di�erentiated products is appealing because it focuses the analysis on
the underlying utility function that determines the system of demand for
the products, instead of trying to estimate demand for each alternative us-
ing a system of equations. The DCM structure greatly reduces the data
requirements and the number of parameters that must be estimated, which
makes it feasible to estimate a coherent system of demand for a large number
of products and for markets with a di�erent number of available products,
as is the case in the PC CPU industry.
The study of demand for di�erentiated products allows us to estimate
7
DCM employing either individual purchases or aggregated, market level data.
Several of these methods are analyzed in Berry (1994). Berry, Levinsohn and
Pakes (1995) develop a method to estimate, through simulations, random
coe�cient DCM employing aggregated data and taking into consideration
the endogeneity of prices in the demand system. This model of demand
allows for heterogeneous preferences and permits the estimation of more
reasonable substitution patterns among products, compared to other discrete
choice models of demand. Nevo (2000) and Train (2008) present a deep
treatment of this topic and of the algorithms required in estimation. Other
well known applications of this method of demand include Petrin (2002),
Goolsbee and Petrin (2004), Chintagunta, Dube and Goh (2005) and Train
and Winston (2007) among many others.
Demand
Following Nevo (2001) I present the main components of a random coe�-
cient demand model for market data. We observe the market in t = 1...T
time periods3, and in each period the market has L consumers. We observe
aggregate quantities, prices and a vector containing observable product char-
acteristics (Xit) for each one of the It products available in each period. The
indirect utility by consumer l from choosing product i at time t is given by
ulit = αl(yl − pit) + βlXit + ξit + εlit
l = 1 . . . L, i = 1 . . . It, t = 1 . . . T(1)
3Alternative, these could be T di�erent spatial markets in a given time period or acombination of both spatial markets and time periods.
8
where yl is the income of consumer l, pit is the price of product i at time t, Xit
are observable product characteristics, ξit represents product characteristics
observed by the consumers but not by the researcher, εlit is a random term
with a Type I extreme value distribution, αl is consumer l's marginal utility
of income, and βl is the vector of consumer l's marginal utility from various
product characteristics. To account for heterogeneous preferences, (αl, βl)
are assumed to have a probability distribution F (αl, βl; θ) over consumers
whose parameters θ must be estimated. For example, as it will be assumed
in this paper, these parameters could be independently distributed as normal
or log-normal random variables, where θ denotes the mean and the variance
of the related normal distributions.
The speci�cation of the demand model also includes an outside good
which capture the preferences of those consumers who decide not to buy
any of the available products in the dataset. The indirect utility from this
outside good, which is normalized to be zero, is:
ul0t = αlyl + ξ0t + εl0t = 0 (2)
The de�nition of the indirect utility function in (1) can also be written
as:
ulit = αlyl + δit(pit, Xit, ξit) + µlit(pit, Xit) + εlit (3)
δit = f(Xit, pit) + ξit (4)
In this reformulation µlit captures the portion of the utility from product
9
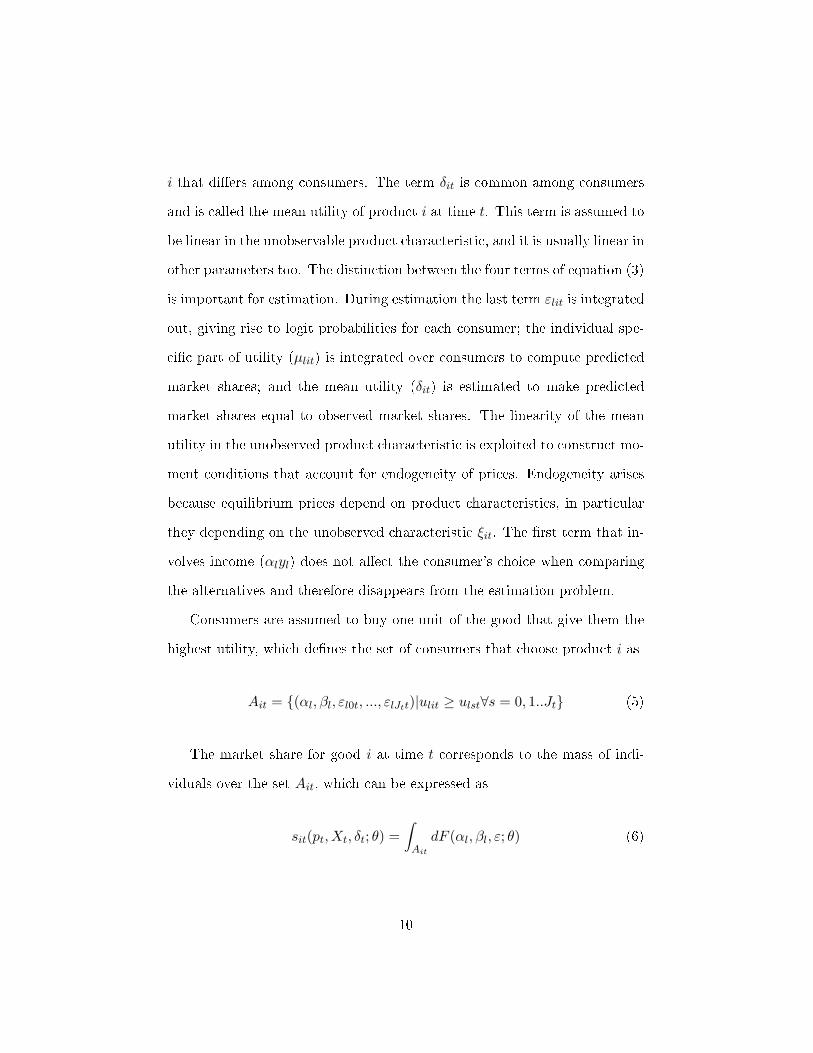
i that di�ers among consumers. The term δit is common among consumers
and is called the mean utility of product i at time t. This term is assumed to
be linear in the unobservable product characteristic, and it is usually linear in
other parameters too. The distinction between the four terms of equation (3)
is important for estimation. During estimation the last term εlit is integrated
out, giving rise to logit probabilities for each consumer; the individual spe-
ci�c part of utility (µlit) is integrated over consumers to compute predicted
market shares; and the mean utility (δit) is estimated to make predicted
market shares equal to observed market shares. The linearity of the mean
utility in the unobserved product characteristic is exploited to construct mo-
ment conditions that account for endogeneity of prices. Endogeneity arises
because equilibrium prices depend on product characteristics, in particular
they depending on the unobserved characteristic ξit. The �rst term that in-
volves income (αlyl) does not a�ect the consumer's choice when comparing
the alternatives and therefore disappears from the estimation problem.
Consumers are assumed to buy one unit of the good that give them the
highest utility, which de�nes the set of consumers that choose product i as
Ait = {(αl, βl, εl0t, ..., εlJtt)|ulit ≥ ulst∀s = 0, 1..Jt} (5)
The market share for good i at time t corresponds to the mass of indi-
viduals over the set Ait, which can be expressed as
sit(pt, Xt, δt; θ) =∫Ait
dF (αl, βl, ε; θ) (6)
10
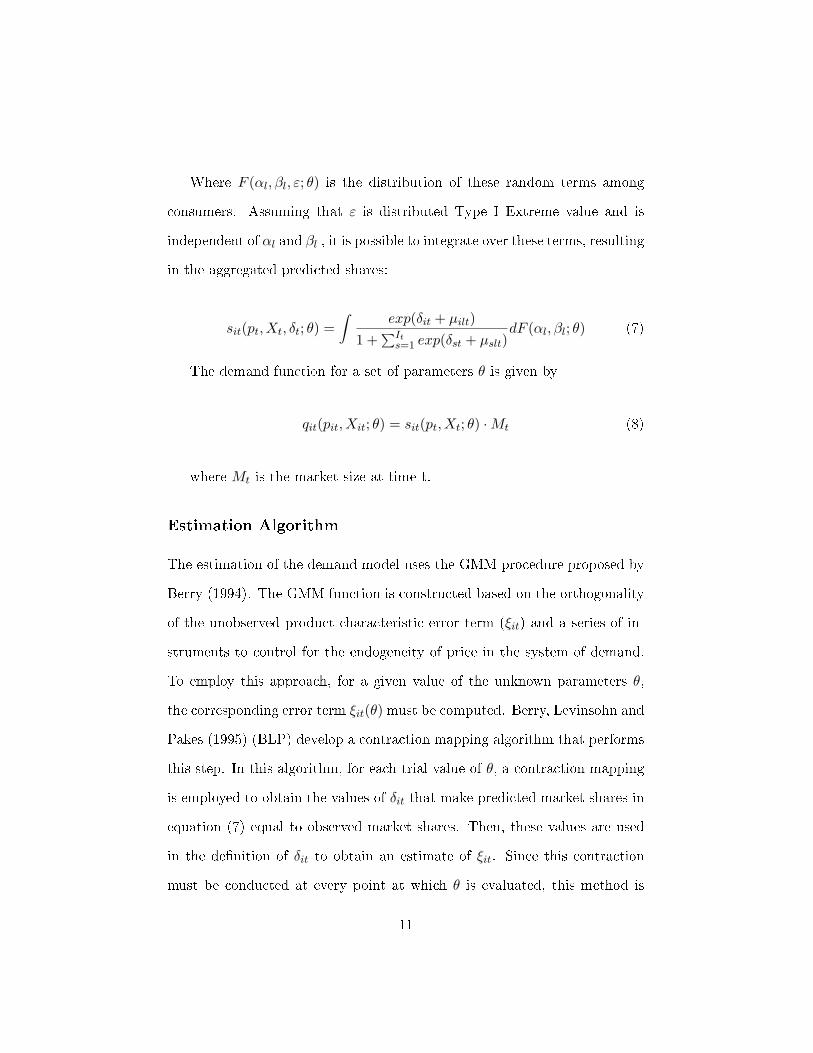
Where F (αl, βl, ε; θ) is the distribution of these random terms among
consumers. Assuming that ε is distributed Type I Extreme value and is
independent of αl and βl , it is possible to integrate over these terms, resulting
in the aggregated predicted shares:
sit(pt, Xt, δt; θ) =∫
exp(δit + µilt)1 +
∑Its=1 exp(δst + µslt)
dF (αl, βl; θ) (7)
The demand function for a set of parameters θ is given by
qit(pit, Xit; θ) = sit(pt, Xt; θ) ·Mt (8)
where Mt is the market size at time t.
Estimation Algorithm
The estimation of the demand model uses the GMM procedure proposed by
Berry (1994). The GMM function is constructed based on the orthogonality
of the unobserved product characteristic error term (ξit) and a series of in-
struments to control for the endogeneity of price in the system of demand.
To employ this approach, for a given value of the unknown parameters θ,
the corresponding error term ξit(θ) must be computed. Berry, Levinsohn and
Pakes (1995) (BLP) develop a contraction mapping algorithm that performs
this step. In this algorithm, for each trial value of θ, a contraction mapping
is employed to obtain the values of δit that make predicted market shares in
equation (7) equal to observed market shares. Then, these values are used
in the de�nition of δit to obtain an estimate of ξit. Since this contraction
must be conducted at every point at which θ is evaluated, this method is
11
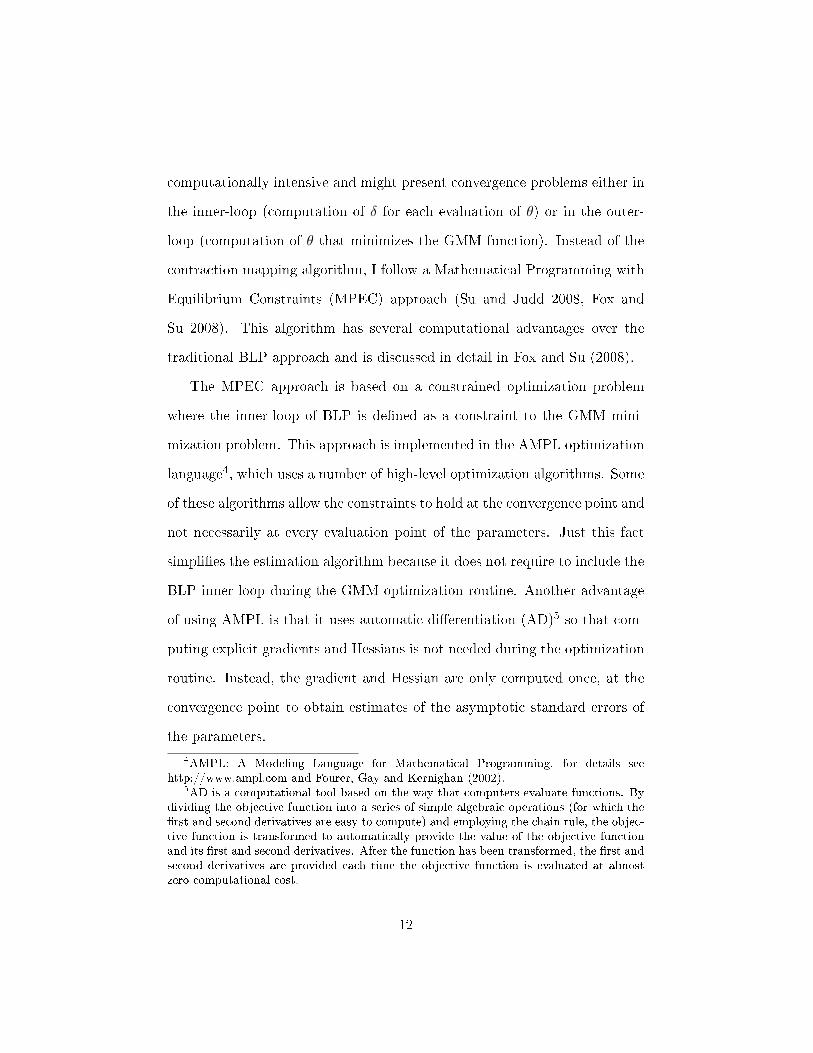
computationally intensive and might present convergence problems either in
the inner-loop (computation of δ for each evaluation of θ) or in the outer-
loop (computation of θ that minimizes the GMM function). Instead of the
contraction mapping algorithm, I follow a Mathematical Programming with
Equilibrium Constraints (MPEC) approach (Su and Judd 2008, Fox and
Su 2008). This algorithm has several computational advantages over the
traditional BLP approach and is discussed in detail in Fox and Su (2008).
The MPEC approach is based on a constrained optimization problem
where the inner-loop of BLP is de�ned as a constraint to the GMM mini-
mization problem. This approach is implemented in the AMPL optimization
language4, which uses a number of high-level optimization algorithms. Some
of these algorithms allow the constraints to hold at the convergence point and
not necessarily at every evaluation point of the parameters. Just this fact
simpli�es the estimation algorithm because it does not require to include the
BLP inner-loop during the GMM optimization routine. Another advantage
of using AMPL is that it uses automatic di�erentiation (AD)5 so that com-
puting explicit gradients and Hessians is not needed during the optimization
routine. Instead, the gradient and Hessian are only computed once, at the
convergence point to obtain estimates of the asymptotic standard errors of
the parameters.
4AMPL: A Modeling Language for Mathematical Programming, for details seehttp://www.ampl.com and Fourer, Gay and Kernighan (2002).
5AD is a computational tool based on the way that computers evaluate functions. Bydividing the objective function into a series of simple algebraic operations (for which the�rst and second derivatives are easy to compute) and employing the chain rule, the objec-tive function is transformed to automatically provide the value of the objective functionand its �rst and second derivatives. After the function has been transformed, the �rst andsecond derivatives are provided each time the objective function is evaluated at almostzero computational cost.
12
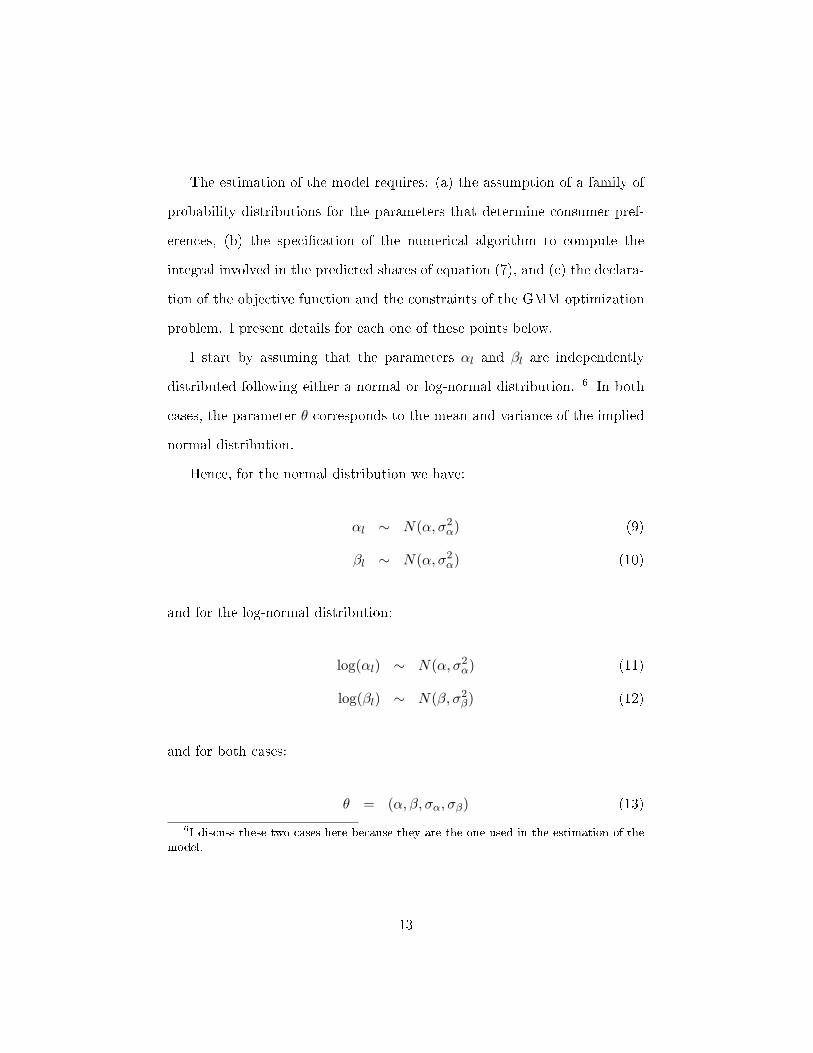
The estimation of the model requires: (a) the assumption of a family of
probability distributions for the parameters that determine consumer pref-
erences, (b) the speci�cation of the numerical algorithm to compute the
integral involved in the predicted shares of equation (7), and (c) the declara-
tion of the objective function and the constraints of the GMM optimization
problem. I present details for each one of these points below.
I start by assuming that the parameters αl and βl are independently
distributed following either a normal or log-normal distribution. 6 In both
cases, the parameter θ corresponds to the mean and variance of the implied
normal distribution.
Hence, for the normal distribution we have:
αl ∼ N(α, σ2α) (9)
βl ∼ N(α, σ2α) (10)
and for the log-normal distribution:
log(αl) ∼ N(α, σ2α) (11)
log(βl) ∼ N(β, σ2β) (12)
and for both cases:
θ = (α, β, σα, σβ) (13)
6I discuss these two cases here because they are the one used in the estimation of themodel.
13

To simulate the multidimensional integral in equation (7), I take draws
from a standard normal distribution and given a set of parameters θ, I trans-
form the individual parameters as:
For the normal distribution:
αl = α+ σα · v
βl = β + σβ · v (14)
v ∼ N(0, 1)
and for the log-normal distribution:
αl = exp(α+ σα · v)
βl = exp(β + σβ · v) (15)
v ∼ N(0, 1)
Given L draws (one for each consumer) from the preference parameters
{vpilt, vpilt}Ll=1, I de�ne δit and µilt as follows.
For the normal distribution:
δit = −αpit+ βXit + ξit (16)
µilt = −σαvpiltpit+ σβXitvXilt
and for the log-normal distribution:
δit = ξit (17)
14
µilt = −exp(α+ σαvpilt)pit+ exp(β + σβv
Xilt)Xit
Notice that when the normal distribution is assumed, the parameters α and
β enter just in δit and not in µilt, but if the log-Normal distribution is
used all the parameters enter the individual speci�c part of the utility, µilt.
Given that just the parameters that enter the individual speci�c part of the
utility are involved in the non-linear inner-loop of the BLP approach, the
log-Normal distribution has an important computational cost for the BLP
approach but not for the MPEC approach.
Finally, using the draws over the consumer preferences density, we can
compute an approximation to the integral involved in equation (7) to com-
pute the predicted shares as:
sit(pt, Xt; θ) =L∑l=1
exp(δit(θ) + µilt(θ))1 +
∑Its=1 exp(δst(θ) + µslt(θ))
(18)
The GMM objective function is constructed using a quadratic form of
the orthogonality condition between the vector of error terms (ξ) and a ma-
trix of instruments (Z), weighted by the inverse of the square of the matrix
of instruments, as presented below. In the MPEC approach the objective
function is minimized with respect to three set of variables: the unknown
parameters, the constants δit and the error terms εit. The GMM problem
considers two set of constraints. The �rst set of constraints refers to the def-
inition of δit that relates the error term ξit to the product-speci�c constants.
The second set of constraints imposes equality between observed market
shares and predicted shares evaluated at a given vector (δit, θ). Hence, the
15
MPEC GMM optimization problem is:
Minθ,δ,ξ
GMM(θ) = ξ′Z(Z ′Z)−1Z ′ξ (19)
s.t. ξit = f(δit, θ) (20)
Sit = sit(δ, θ) (21)
Notice that the objective function just involves the variables ξ and the instru-
ments, which are related to the other variables through the constraints. The
constraint in equation (20) relates the variable ξit to the variable δit, given
the set of parameters θ, which corresponds to the solution to the system of
equations (16) or (17). The constraint in equation (21) correspond to the
inner-loop in the traditional BLP procedure and imposes the requirement
that at the convergence point, the predicted shares sit equal the observed
market shares Sit, given the set of δ and the parameter vector θ.
3 Application to the Personal Computer CPU In-
dustry
The Industry and the dataset
The history of the CPU market dates back to 1974. At this time, CPUs were
invented to be used in electronic calculators. By 1978 Intel had introduced
its �rst generation of a 16 bit CPU, the 8086, which was the basis for the
x86 architecture currently used in personal computers. Since then, seven
generations of CPUs have been introduced into the market, each one with a
signi�cant increase in performance and possibilities, expanding the potential
16
use of computers from being simple calculators to machines that perform
complex mathematical operations, manage enormous databases, and process
digital sounds, images and movies.
The dominance of the CPUmarket by Intel and AMD began in 1982 when
IBM chose Intel to provide the 286 processors for its new line of personal
computers, the IBM PC/AT. IBM's policies required a secondary producer
of the chips, and Intel had to sign an agreement with AMD in order to sell its
chips to IBM. Some years later Compaq developed the �rst IBM PC clone,
thus establishing a competitive market for IBM-compatible PCs. With this
new source of demand, Intel tried to break its ties to AMD. Intel canceled
the production agreement with AMD and refused to hand over technical
speci�cations for its new chips. AMD challenged Intel's decision, and a long
legal dispute ensued. In 1991, AMD was given the right to produce the
Intel chips but in December 1994, the Carlifornia's Supreme Court denied
AMD the right to use Intel codes. Later, AMD and Intel signed a cooperative
agreement to share technological innovation, which allowed AMD to produce
and sell CPUs based on the Intel 286, 386 and 486 technologies. Since then,
AMD has developed its own chips architecture and has introduced the K5,
K6 and K7 (Athlon) chips.
The most important characteristic of a CPU, and perhaps the only one
that should matter to �nal consumers, is its capacity to perform a number
of computing tasks in a short period of time. The performance of a CPU
is usually associated with the clock speed of the processor, but this mea-
sure is not the only determinant of how quickly a CPU can perform. The
clock speed only measures the number of cycles of instruction that are pro-
17
cessed by the CPU in one second. There are several other characteristics
that a�ects performance: for example, the amount of internal memory, the
existence of a mathematical coprocessor, the front side bus speed (the speed
at which the CPU communicates with other components) and other speci�c
characteristics of the CPU design. Several benchmarks of performance that
summarize the e�ects of these characteristics on product performance exist.
One of the most widely used is the quality benchmark maintained by CPU
Scorecard, which is the one I use in this paper to measure quality of the
products.
The main data set used in this research was obtained from In-Stat, a
research company that specializes in the CPU market7. It includes esti-
mates of quarterly sales for CPUs, aggregated on 29 products for the period
1993-2004. Since there exist entry of new products and retirement of ob-
solete products, there is a total of 291 observations in the dataset8. The
dataset also contains information on prices9. In-Stat obtains �gures on list
prices of Intel products and adjusts these prices for volume discounts o�ered
to their major customers. Their main sources of information are Financial
Statements reports and World Semiconductor Trade Statistics elaborated by
the Semiconductor Industry Association (SIA). In-Stat uses this information
to estimate unit shipments for each product by Intel and AMD, based on
engineering relationships and capacity production of each fabrication plant
7This dataset is proprietary material belonging to In-Stat.8A unit of observation is an individual product observed in a particular quarter9Prices for AMD products are only available from 1999 to 2004, so the dataset was
complemented with information from several other sources, including printed publicationsand on-line historical databases. The dataset contains 9 AMD products and 20 Intelproducts during the sample period.
18
(Aizcorbe, et.al. 2003). The In-Stat data set is complemented by data from
two other sources. The �rst is �rm-level advertising expenditures for each
company; these data were obtained from the 10K and 10Q �nancial state-
ments. The second extra source consists of information about CPU perfor-
mance; it was obtained from The CPU Scorecard, a company that measures
the performance of CPU products. The In-Stat database has been previously
used by Song (2006, 2007) to estimate demand for di�erentiated products
as well as to analyze welfare implications from investment in research and
development in the CPU market. It has also been used by Gordon (2008) to
estimate a demand model for durable goods.
Table 1 shows a summary of the dataset, including yearly quantities,
average prices, average performance, and advertising expenditures from 1993
to 2004. The data show that Intel sales are more than three times AMD sales,
and that Intel captures 83.49% of the total sales during this period. During
most of this period, Intel's average prices were much higher than AMD's
average prices, except in 2003 and 2004 where AMD prices are in�uenced by
the sales of the more expensive Athlon 64 (the �rst 64-bit CPU). In terms
of performance, Intel was a clear technological leader during the �rst part
of the 1990's. Starting in 1999, with the introduction of the AMD Athlon,
AMD closed the gap between its products and Intel's and in some years
took the performance leadership with its products. The advertising data
show the strong e�ort that Intel put on building brand reputation. In each
year, Intel's advertising expenditures are between 4 and 8 times higher than
AMD's advertising expenditures.
19
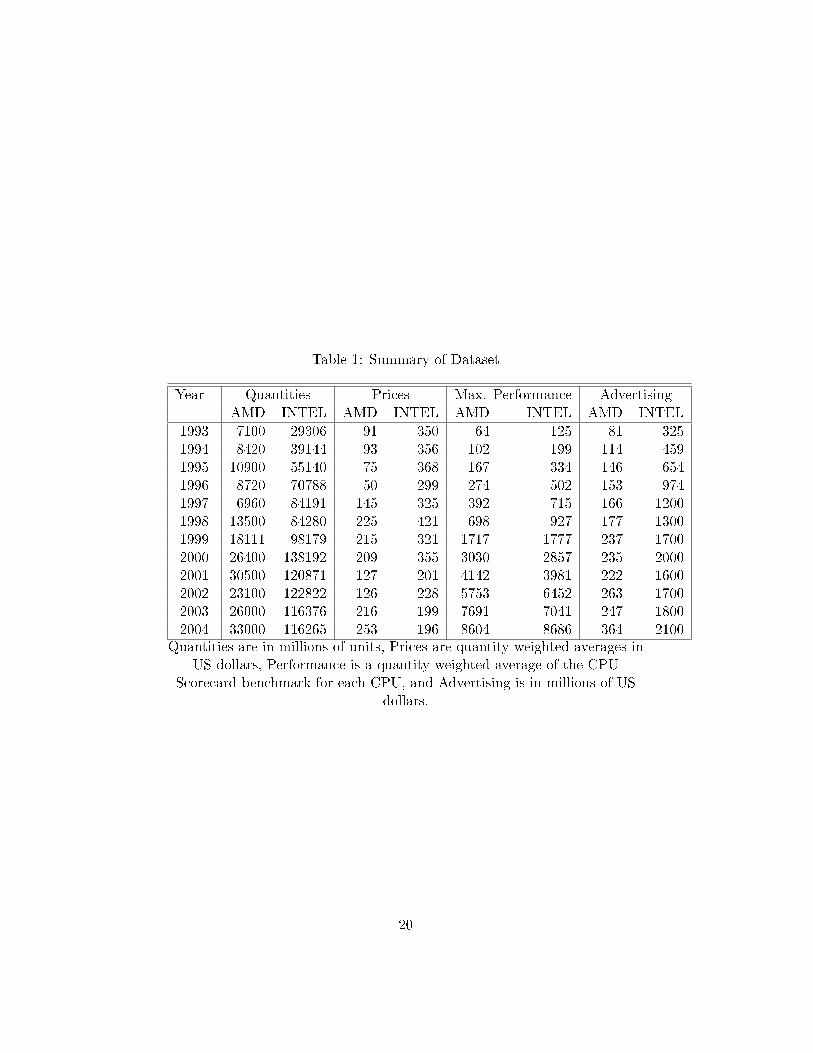
Table 1: Summary of Dataset
Year Quantities Prices Max. Performance AdvertisingAMD INTEL AMD INTEL AMD INTEL AMD INTEL
1993 7100 29306 91 350 64 125 81 3251994 8420 39144 93 356 102 199 114 4591995 10900 55140 75 368 167 334 146 6541996 8720 70788 50 299 274 502 153 9741997 6960 84191 145 325 392 715 166 12001998 13500 84280 225 421 698 927 177 13001999 18111 98179 215 321 1717 1777 237 17002000 26400 138192 209 355 3030 2857 235 20002001 30500 120871 127 201 4142 3981 222 16002002 23100 122822 126 228 5753 6452 263 17002003 26000 116376 216 199 7691 7041 247 18002004 33000 116265 253 196 8604 8686 364 2100
Quantities are in millions of units, Prices are quantity-weighted averages inUS dollars, Performance is a quantity-weighted average of the CPU
Scorecard benchmark for each CPU, and Advertising is in millions of USdollars.
20
Incorporating brand and advertising in the model of demand
I use the relative quality of each product, with respect to the maximum
quality observed in the market each period, as the observable product char-
acteristic. This de�nes the quality of the product as the distance of each
CPU from what is considered to be the technological frontier in each period.
To measure the e�ects of the Intel brand and advertising expenditures on
demand, I construct versions of static dynamic models of advertising. The
static models of advertising consider that only current period advertising
a�ect demand. For the dynamic models of advertising, I assume that demand
is a�ected by accumulated advertising, which depreciate at a constant rate
over time, de�ned as:
Gjt = Ajt +T∑τ=1
βτAjt−τ (22)
Where Gjt is the �rms' goodwill that enters consumers demand, Ajt is
�rms' j advertising expenditure at time t and β is the goodwill depreciation
factor.
4 Results
I present the estimation results for seven models of demand. The �rst �ve
models consider static models of advertising assuming either a normal or a
log-Normal preferences over price and quality, including a dummy for Intel
brand or advertising expenditures. In the �rst two models I only include a
dummy variable for Intel's products. This allows me to measure directly the
21
premium that consumers are willing to pay for an Intel product, controlling
for its quality. In the third and fourth model, I only use current advertising
expenditures to test whether they can explain why consumers are willing to
pay a premium for Intel products. I use the results of these models to conduct
experiments about the e�ects of advertising on the two �rms' market shares.
In a �fth model, I explore the inclusion of both the dummy and the �rms'
advertising expenditures assuming a normal distribution of preferences10.
The last two models explore the dynamic models of advertising using
a normal distribution of preferences. In the sixth model, I estimate the
dynamic advertising model without including a brand dummy and in the
�fth model I include the dummy for Intel brand.
To control for endoeneity of prices in the system of demand, cost deter-
minants are employed as instruments in the GMM estimation. The set of
instruments consider product characteristics that a�ect costs as the num-
ber of transistors in a chip, the die size (size of the CPU) and production
experience, which a�ect costs trough learning-by-doing.
Table 2 present the estimated coe�cients and the corresponding asymp-
totic standard errors in parenthesis. In Models 1 through 4, all the coe�-
cients are statistically signi�cant at a 5% con�dence level. The estimated
normal distributions of the random coe�cients indicate that an important
proportion of consumers have a positive valuation of price (6.93% in Model
1 and 8.93% in Model 3) or dislike higher quality products (23.27% in Model
1 and 32.86% in Model 3). These results are not consistent with consumer
10Given that the results for models 5 to 7 are similar using either a normal or log-normaldistribution and that they are not used in the conterfactual experiments, the results ofthe log-normal distribution are not reported.
22

theory but they are a consequence of the normal distribution having support
over all the real line. The use of a log-normal distribution (Models 2 and
4) avoid these contra-intuitive results while maintaining the high dispersion
in consumer valuations. Model 5 estimates the demand model using both
an Intel dummy and current advertising level. We can observe that when
both variables are included in the estimation most of the parameters are
statistically insigni�cant. Model 6 estimates a dynamic model of advertising
without including the Intel dummy and Model 7 add the Intel dummy to the
estimation. In Models 6 and 7 the coe�cient on advertising goodwill is not
statistically signi�cant and the depreciation rate of advertising is 0.02% per
quarter, which seems very low. In what follows, I concentrate the analysis
on the �rst four models.
In terms of valuing of the Intel brand, Model 1 implies that an average
consumer is willing to pay $170.78 more for an Intel product with the same
performance as an AMD product. This correspond to 49.89% of the average
Intel price in the sample. Model 2, which assumes a log-normal distribution,
implies that the Intel premium is $109.65 or 32.03% of the average Intel
price.11
The estimated average own-price elasticities for the 29 products are pre-
sented in Table 3. The most important di�erence between the four models is
that Model 3 predicts price elasticities that are lower than one (in absolute
value) for 3 of the 29 products. This is not consistent with pro�t maximiza-
11To compute the Intel brand premium I divide the coe�cient on Brand by the mean ofthe distribution on price coe�cients. This is βI
βpfor the normal distribution and βI
exp(βp+σ2p2 )
for the log-normal distribution.
23
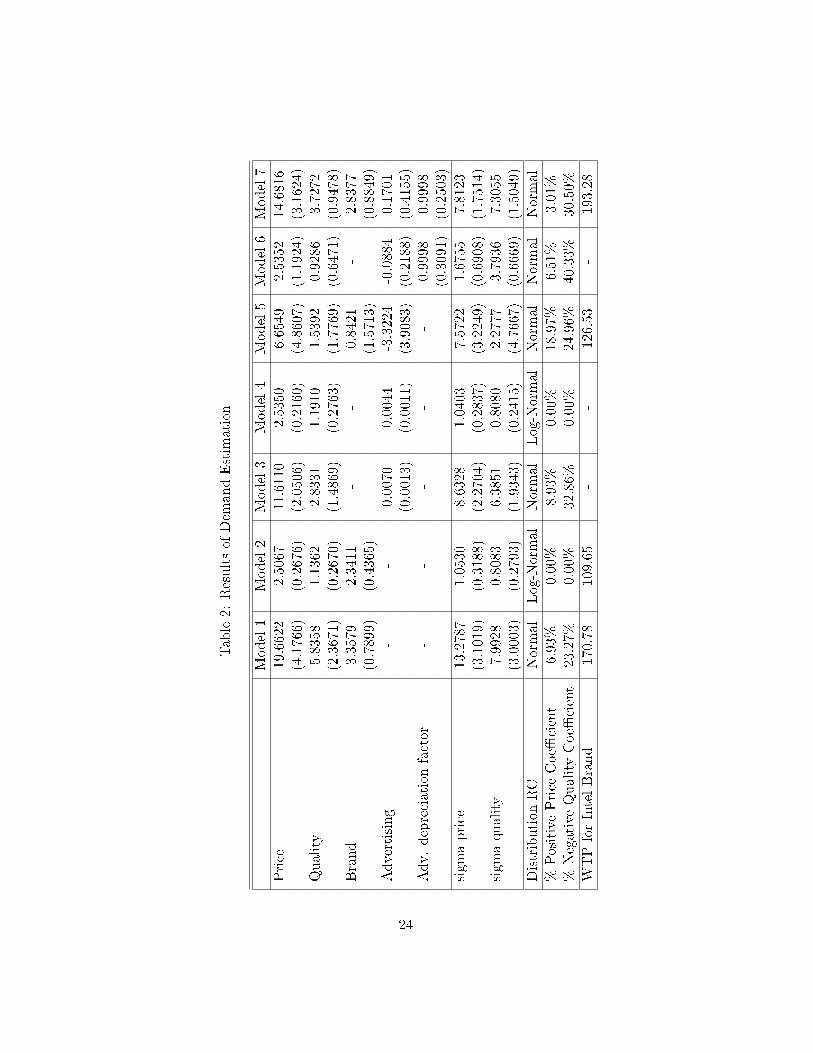
Table2:
Resultsof
Dem
andEstim
ation
Model1
Model2
Model3
Model4
Model5
Model6
Model7
Price
19.6622
2.5067
11.6110
2.5350
6.6549
2.5352
14.6816
(4.1766)
(0.2676)
(2.0506)
(0.2160)
(4.8607)
(1.1924)
(3.1624)
Quality
5.8358
1.1362
2.8331
1.1910
1.5392
0.9286
3.7272
(2.3671)
(0.2670)
(1.4869)
(0.2763)
(1.7769)
(0.6471)
(0.9478)
Brand
3.3579
2.3411
--
0.8421
-2.8377
(0.7899)
(0.4365)
(1.5713)
(0.8849)
Advertising
--
0.0070
0.0044
-3.3224
-0.0884
0.1701
(0.0013)
(0.0011)
(3.9083)
(0.2188)
(0.4155)
Adv.depreciationfactor
--
--
-0.9998
0.9998
(0.3091)
(0.2503)
sigm
aprice
13.2787
1.0530
8.6328
1.0403
7.5722
1.6755
7.8123
(3.1019)
(0.3188)
(2.2704)
(0.2837)
(3.2249)
(0.6908)
(1.7514)
sigm
aquality
7.9928
0.8083
6.3851
0.8080
2.2777
3.7936
7.3055
(3.0003)
(0.2793)
(1.9343)
(0.2415)
(4.7667)
(0.6669)
(1.5049)
Distribution
RC
Normal
Log-Normal
Normal
Log-Normal
Normal
Normal
Normal
%PositivePrice
Coe�
cient
6.93%
0.00%
8.93%
0.00%
18.97%
6.51%
3.01%
%NegativeQualityCoe�
cient
23.27%
0.00%
32.86%
0.00%
24.96%
40.33%
30.50%
WTPforIntelBrand
170.78
109.65
--
126.53
-193.28
24
tion, because �rms could increase price, generating a less-than-proportional
reduction in demand, thereby increasing revenue. The �rm will reduce their
costs due to lower production, while at the same time increasing the sales
of other products by the same �rm. The combination of these e�ects will
increase the �rm's pro�ts. 12 In all the other cases the �rms price elasticities
are higher than one in absolute value and seem reasonable.
To evaluate the e�ect of Intel advertising on demand, I conduct four ex-
periments in which I change �rms' advertising expenditures and simulate the
resulting products demand. In the �rst experiment neither �rm advertises;
in the second experiment both �rms advertise at the observed AMD levels;
in the third experiment both �rms advertise at the observed Intel advertising
levels; and in the fourth experiment Intel advertising levels are increased by
10% while keeping AMD advertising levels unchanged. The results for the
three �rst cases are similar in terms of relative market shares between �rms.
The results di�er in the level of the outside share, with higher advertising
increasing overall demand and reducing the outside product market share.
Figure 1 presents the shares of Intel sales as a proportion of both �rms'
total sales by quarter, for the four experiments using the results of Models 3
and 4. The change in Intel share is dramatic when both �rms advertise in a
similar way in the �rst three experiments (No Advertising, AMD Advertising
level; and Intel Advertising level). In the �rst period, before 1999, a change
in Intel advertising reduces Intel shares from around 90% to around 70%.
12One possible explanation to this is that due to the existence of learning-by-doing anincrease in today prices reduces current period demand, reducing experience and increasingfuture periods production costs, which reduces future �rm pro�ts. A deeper analysis ofthis fact requires to analyze a dynamic model of �rms behavior.
25
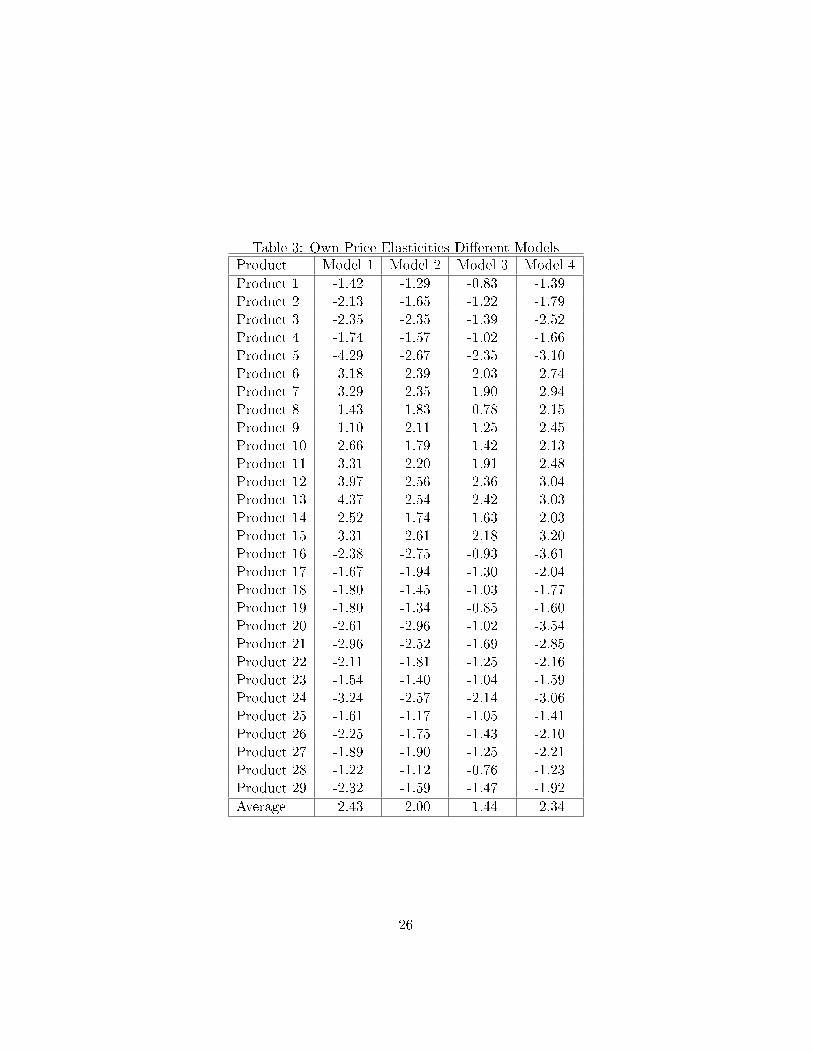
Table 3: Own Price Elasticities Di�erent ModelsProduct Model 1 Model 2 Model 3 Model 4
Product 1 -1.42 -1.29 -0.83 -1.39Product 2 -2.13 -1.65 -1.22 -1.79Product 3 -2.35 -2.35 -1.39 -2.52Product 4 -1.74 -1.57 -1.02 -1.66Product 5 -4.29 -2.67 -2.35 -3.10Product 6 -3.18 -2.39 -2.03 -2.74Product 7 -3.29 -2.35 -1.90 -2.94Product 8 -1.43 -1.83 -0.78 -2.15Product 9 -1.10 -2.11 -1.25 -2.45Product 10 -2.66 -1.79 -1.42 -2.13Product 11 -3.31 -2.20 -1.91 -2.48Product 12 -3.97 -2.56 -2.36 -3.04Product 13 -4.37 -2.54 -2.42 -3.03Product 14 -2.52 -1.74 -1.63 -2.03Product 15 -3.31 -2.61 -2.18 -3.20Product 16 -2.38 -2.75 -0.93 -3.61Product 17 -1.67 -1.94 -1.30 -2.04Product 18 -1.80 -1.45 -1.03 -1.77Product 19 -1.80 -1.34 -0.85 -1.60Product 20 -2.61 -2.96 -1.02 -3.54Product 21 -2.96 -2.52 -1.69 -2.85Product 22 -2.11 -1.81 -1.25 -2.16Product 23 -1.54 -1.40 -1.04 -1.59Product 24 -3.24 -2.57 -2.14 -3.06Product 25 -1.61 -1.17 -1.05 -1.41Product 26 -2.25 -1.75 -1.43 -2.10Product 27 -1.89 -1.90 -1.25 -2.21Product 28 -1.22 -1.12 -0.76 -1.23Product 29 -2.32 -1.59 -1.47 -1.92
Average -2.43 -2.00 -1.44 -2.34
26
After 1999, when Intel and AMD are closer in terms of product quality, the
shares of Intel are reduced to levels around 40% in Model 3 and around 50%
in Model 4. The relative shares between the two �rms are almost the same
if they advertise in a similar ammount, independent of the advertising level.
Figure 2 presents the e�ect of advertising on total market demand, showing
the inside goods' market share (one minus the outside good's market share).
In the baseline case I assume that the observed market sales represent 80% of
the market. We can observe that the e�ect of advertising in market demand
is also very important. Advertising has an important impact on total sales,
increasing the total demand for CPUs from levels around 70%, when no
advertising is used, to over 85% of the potential market, when both �rms
use Intel's advertising levels. In the scenario in which Intel advertising is
increased by 10%, the total demand increases by 1% on average, and Intel's
relative share increases by more than 3%, thus reducing the demand for
AMD products. These results suggest that advertising by Intel and AMD
has succesfully increased the market size for PC and has allowed Intel to
maintain a dominant position in the market.
These results assume that �rms do not modify their pricing behavior,
which could be unrealistic. Had Intel not been successful at creating a strong
brand reputation, it could not have obtained a large premium for its prod-
ucts. These experiments intend to measure the impact of advertising on the
demand for Intel, while controlling for prices, quality and other unobserved
product characteristics. Analyzing the optimal pricing responses of Intel and
AMD to a change in the other �rms advertising level would require a model
of the supply side of the market, which is outside the scope of this paper.
27
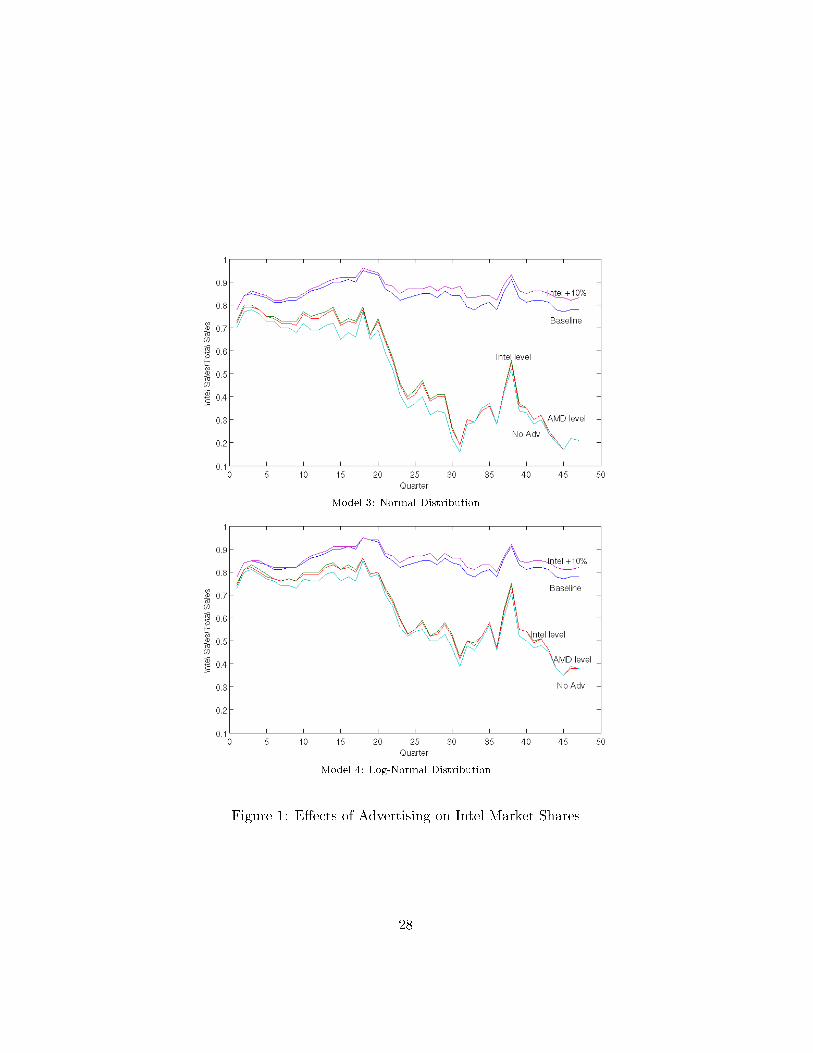
Model 3: Normal Distribution
Model 4: Log-Normal Distribution
Figure 1: E�ects of Advertising on Intel Market Shares
28
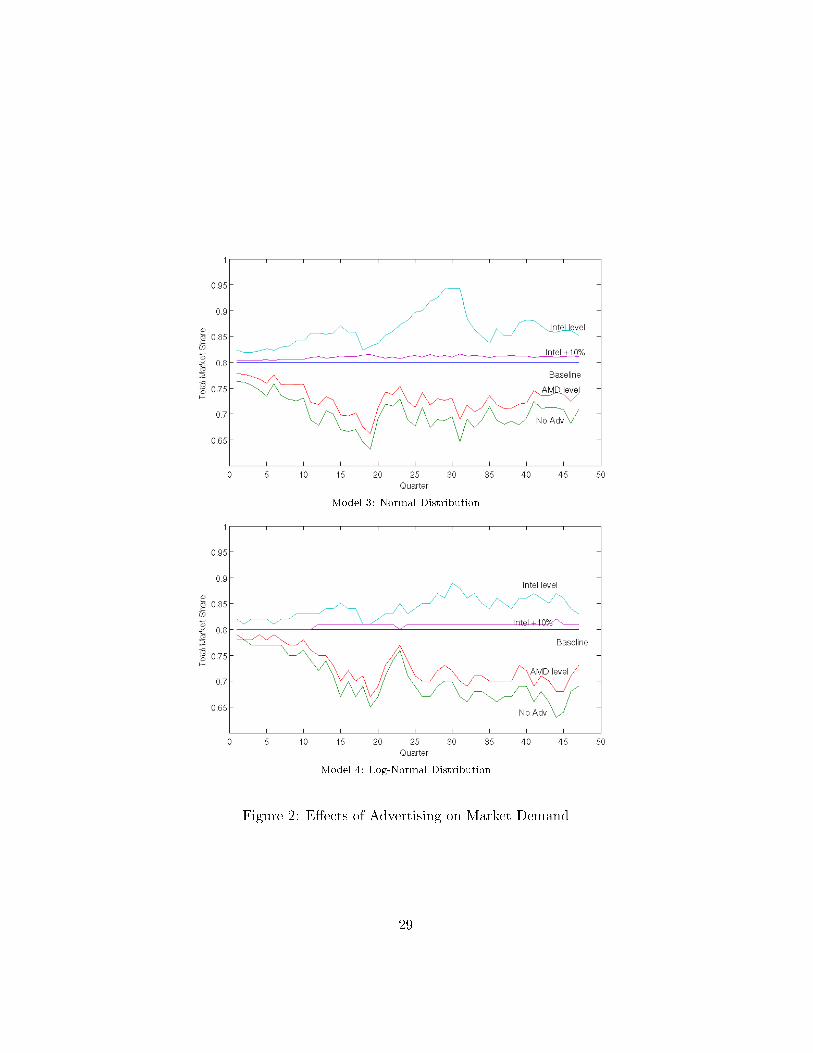
Model 3: Normal Distribution
Model 4: Log-Normal Distribution
Figure 2: E�ects of Advertising on Market Demand
29
5 Discussion
In this paper I have applied a discrete choice model with random coe�cients
to the PC CPU Industry. The model uses an Intel brand dummy and adver-
tising expenditures to capture the e�ect of the Intel brand on market share.
The results suggest that consumers pay a high premium for the Intel brand;
had Intel not invested in brand positioning, its market shares would have
been much lower. An interesting question is why AMD does not make use
of advertising and brand positioning as a marketing tool. In their �nancial
reports, AMD usually claims that it has not been able to develop a �nancial
basis to support extensive advertising campaigns. Also, some media inter-
views make it clear that AMD intends to let Intel take the leadership in
advertising to �nal consumers trusting that the consequent increase in mar-
ket size would bene�t them13. Nevertheless, the results suggest that while
advertising increases market size, it also helps intel to gain relative share
over AMD.
The application of a discrete choice model of demand to the CPU market
requires a number of assumptions. As in Song (2007), I assume that the
behavior of direct buyers of CPUs, PC manufacturers, represent consumer
preferences over products characteristics. I also assume that the valuation
of the CPU in the demand for computers is separable from other computer
components. These assumptions are reasonable because there is a one-to-
one ratio of PCs to CPUs in the demand for computers, and the CPU is
13In a recent interview Stephen DiFranco, Vice President of Worldwide Sales and Mar-keting at AMD, said "I beg them publicly [refering to Intel], please advertise more. Createmore demand. Some weeks in the United States there are more AMD desktops and note-books sold than Intel.�
30

the main determinant of a PC system performance. The other components
of the computer, like the size of the hard drive and other peripherals, are
highly customizable. Additionally, there is anecdotal evidence that computer
manufacturers represent consumer preferences; this has been cited as the
reason that explain Intel decision of focus its advertising directly on �nal
consumers (Moon, 2005).
In this paper I control for the endogeneity of prices using cost determi-
nants. I assume that advertising expenditures, even when related to prices,
are uncorrelated with unobserved product characteristics. This assumption
is justi�ed by the fact that advertising has been mainly directed at brand
positioning in the market, rather than as a means of promoting particular
products.
I do not study the supply side in this paper because I believe that sup-
ply is determined by dynamic considerations. There exists evidence that
learning-by-doing is an important factor in this industry, which creates a
dynamic game between the two �rms. Today's pricing decisions a�ect all
product sales, having an impact on production experience and on future
unitary production costs. 14 In two additional papers, I evaluate market
power in this industry with a dynamic conduct parameter (Salgado 2008a),
and I estimate a dynamic cost function involving learning-by-doing (Salgado
2008b).
There are other characteristics of this market that I have ignored. One
of them is that PC are durable goods; therefore, their demand might present
14This evidence is also sustained in the results. If I assume that �rms behave in a staticmanner, the implicit marginal costs resulting from assuming this behavior are negative,which is consistent with learning-by-doing.
31
consumers with a dynamic decision. Gordon (2008) analyzes this case, but
in order to solve the dynamic problem involving both sides of the market,
supply and demand, he has to assume that only four products (two by �rm)
exist, instead of allowing for all the 29 products in the In-Stat database.
Therefore, the realism gain by allowing a model that accounts for product
durability is o�set by the disadvantage of product aggregation, which also
reduces the already small number of observations. I prefer to ignore these
considerations in order to use a more disaggregated data and to be able
to use the demand estimates to analyze (in separate papers) the dynamic
supply side with learning-by-doing.
Another aspect of this market that I have ignored is �rm's decisions to
introduce or retire products, and to invest in research and development; a
model of these decisions could be used to explain the interesting technology
race among �rms as well as to estimate �rms' optimal decision of marketing
expenditures.
References
[1] Aizcorbe, A. (2006). �Why did Semiconductor Price Indexes Fall so Fast
in the 1990s? A Decomposition�, Ecnomic Inquiry, Vol. 44 (3), pp. 485-
496.
[2] Ashley, R. Granger, C. and Schmalensee, R. (1980). �Advertising and
Aggregate Consumption: An Analysis of Causality� Econometrica 48,
pp. 1149-1168.
32
[3] Bagwell, K. (2007) �The Economic Analysis of Advertising� in Mark Arm-
strong and Robert Porter (Eds.), Handbook of Industrial Organization,
Vol. 3, North-Holland: Amsterdam, pp. 1701-1844.
[4] Berry, S. (1994) �Estimating Discrete-Choice Models of Product Di�er-
entiation�, RAND Journal of Economics Vol. 25 (2), pp. 242-262.
[5] Berry, S., J. Levinsohn and A. Pakes (1995) �Automobile Prices in Market
Equilibrium�, Econometrica, 63, 841-890.
[6] Boyd, R. and Seldon, B. (1990), �The Fleeting E�ect of Advertising:
Empirical Evidence from a Case Study�. Economic Letters 34, pp. 375-
379.
[7] Braithwaite, D. (1928( �The Economic E�ects of Advertisement�, Eco-
nomic Journal 38, 16-37.
[8] Chintagunta, P., J. Dube and K. Goh (2005) �Beyond the endogeneity
bias: The e�ect of unmeasured brand characteristics on household-level
brand choice models�, Management Science Vol. 52, pp. 832-849.
[9] Fox, J., and C. Su (2008), �Improving the Numerical Performance of
BLP Structural Demand Estimations� Unpublished working paper, CMS-
EMS, Kellog School of Management, Northwestern University.
[10] Fourer, R., D. Gay and B. Kernighan (2002) �AMPL: A Modeling Lan-
guage for Mathematical Programming�, Duxbury Press, 2nd Edition.
[11] Goeree, M. (2008) �Limited Information and Advertising in the US Per-
sonal Computer Industry�, Forthcoming in Econometrica.
33
[12] Gordon, Brett. (2008). �A Dynamic Model of Consumer Replace-
ment Cycles in the PC Processor Industry� Unpublished working paper,
Columbia Business School, January 2008.
[13] Jastram, R. (1955). �A Treatment of Distributed LAgs in the Theory of
Advertising Expenditures� Journal of Marketing 20, pp. 36-46.
[14] Jedidi, K., C. Mela and S. Gupta (1999) �Managing Advertising and
Promotion for Long-run Pro�tability� Marketing Science 18 (1), pp. 1-
22.
[15] Kwoka, J. (1993) �The sales and competitive e�ects of styling and ad-
vertising practices in the U.S. auto industry�. The Review of Economics
and Statistics 75, pp. 649-656.
[16] Lambin, J. (1976) �Advertising, Competition and Market Conduct in
Oligopoly over Time�. North-Holland, Amsterdam.
[17] Leone, R. (1995) �Generalizing what is known about temporal aggrega-
tion adn advertising carryover�, Marketing Science 14, 141-150.
[18] Moon, Y. (2005) �Inside Intel Inside� HBS California Research Center,
Harvard Business School Publishing, Harvard University. Document 9-
502-083.
[19] Nevo, A. (2000), �A Practitioner's Guide to Estimation of Random-
Coe�cients Logit Models of Demand�, Journal of Economics and Man-
agement Strategy, Vol. 9, No.4, 513-548.
34
[20] Petrin, A. (2002), �Quantifying the Bene�ts of New Products: The Case
of the Minivan� Journal of Political Economy Vol. 110 (4), pp. 705-729.
[21] Salgado, H. (2008a) �Dynamic Firms Conduct and Market Power: The
Computer Processors Industry under Learning-by-Doing� Working Pa-
per, University of California at Berkeley.
[22] Salgado, H. (2008b) �Estimating Learning-by-doing in the Personal
Computer Processors Industry� Working Paper, University of California
at Berkeley.
[23] Song, M. (2006) �A Dynamic Analysis of Cooperative Research in the
Semiconductor Industry�, Unpublished working paper, School of Eco-
nomics, Georgia Institute of Technology.
[24] Song, M. (2007) �Measuring Consumer Welfare in the CPU Market: An
Application of the Pure Characteristics Demand Model� RAND Journal
of Economics, Vol. 38, pp. 429-446.
[25] Sriram, S., P. Chintagunta and R. Neelamegham (2006) �E�ects of
Brand Preference, Product Attributes, and Marketing Mix Variables in
Technology Product Markets�,Marketing Science Vol. 25 (5) pp. 440-456.
[26] Su, C. and K. Judd (2008), �Constrained Optimization Approaches
to Estimation of Structural Models� Working paper presented in the
Chicago-Argonne Institute of Computational Economics, July 2007.
35
[27] Train, K. and C. Winston (2007), �Vehicle Choice Behavior and the
Declining Market Share of U.S. Automakers�, International Economic
Review Vol. 48, pp. 1469-1496.
[28] Train, K. (2008), �Discrete Choice Models with Simulation�, Second
Edition (Forthcoming), Cambridge University Press. (First edition (2003)
available on-line at http://elsa.berkeley.edu/books/choice2.html)
[29] Villas-Boas, M. and R. Winer (1999), �Endogeneity in Brand Choice
Models�, Management Science Vol. 45, No.10, pp. 1324-1338.
36


![EveryoneCounts: Data-Driven Digital Advertising with ...dz220/paper/EveryCounts.pdfDigital advertising systems [1] in metro networks obtain ... one hour) passenger demand is predictable](https://img.pdfslide.net/doc/110x75/5f3ed2d6eaa03f4dee0be300/everyonecounts-data-driven-digital-advertising-with-dz220papereverycountspdf.jpg)