Embed Size (px)
Citation preview
©AB
B G
roup
-1
-22
-Oct
-07
Brazil-China-India meeting on HVDC and Hybrid Systems, planning and EngineeringIssues
Rio de Janerio, BrazilJuly 16th-18th, 2006
HVDC Systems PlanningConsiderations
Rajendra IyerProject Manager- HVDC Projects
©AB
B G
roup
-2
-22
-Oct
-07
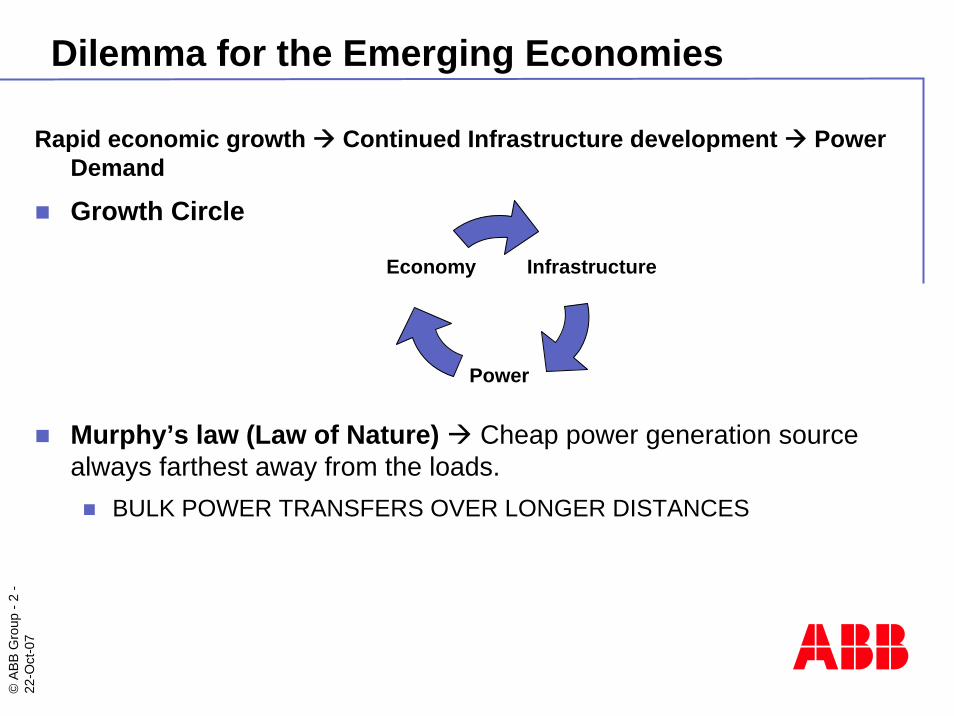
Dilemma for the Emerging Economies
Rapid economic growth Continued Infrastructure development Power Demand
Growth Circle
Murphy’s law (Law of Nature) Cheap power generation sourcealways farthest away from the loads.
BULK POWER TRANSFERS OVER LONGER DISTANCES
Infrastructure
Power
Economy
©AB
B G
roup
-3
-22
-Oct
-07
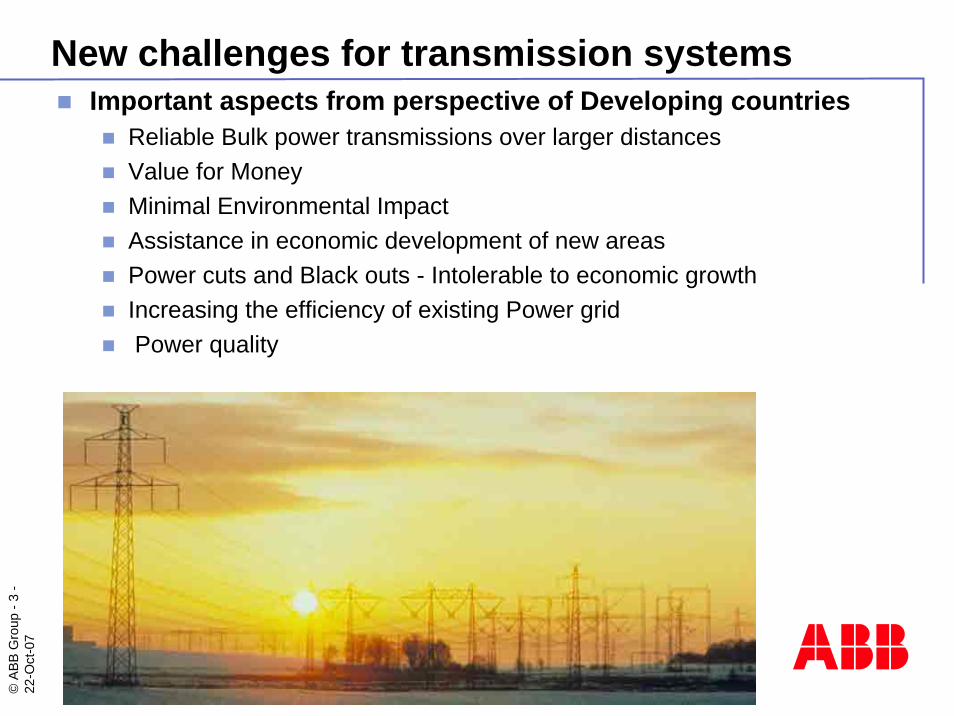
New challenges for transmission systemsImportant aspects from perspective of Developing countries
Reliable Bulk power transmissions over larger distancesValue for MoneyMinimal Environmental Impact Assistance in economic development of new areasPower cuts and Black outs - Intolerable to economic growthIncreasing the efficiency of existing Power gridPower quality
©AB
B G
roup
-4
-22
-Oct
-07
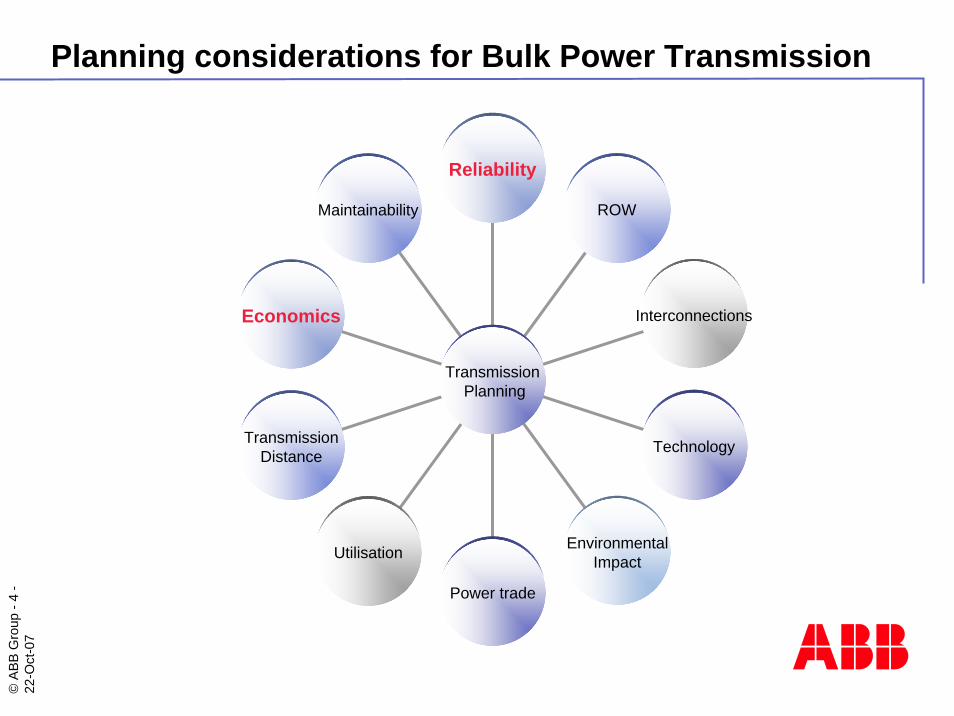
Planning considerations for Bulk Power Transmission
Maintainability
Economics
TransmissionDistance
Utilisation
Power trade
EnvironmentalImpact
Technology
Interconnections
ROW
Reliability
TransmissionPlanning
©AB
B G
roup
-5
-22
-Oct
-07
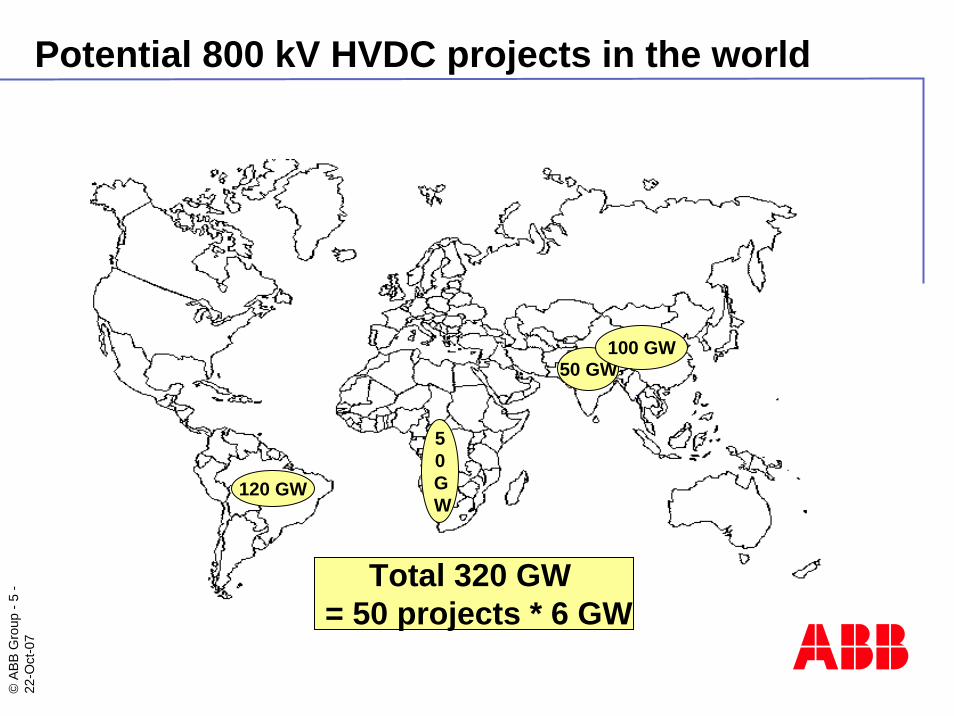
Potential 800 kV HVDC projects in the world
120 GW
50 GW
50 GW100 GW
Total 320 GW = 50 projects * 6 GW
©AB
B G
roup
-6
-22
-Oct
-07
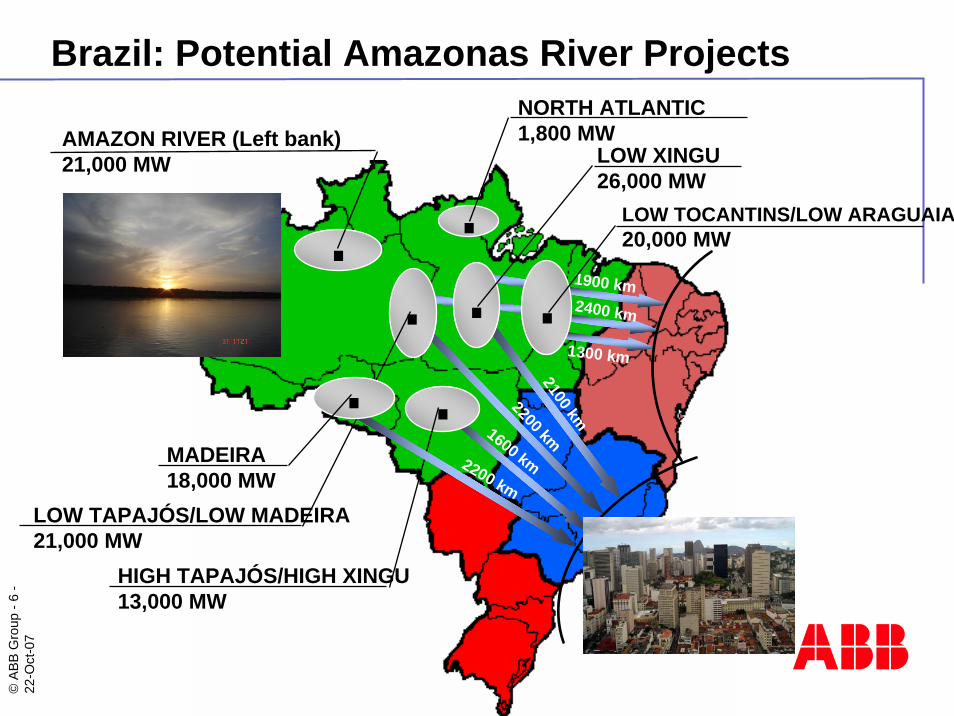
AMAZON RIVER (Left bank)21,000 MW
NORTH ATLANTIC1,800 MW
LOW XINGU26,000 MW
LOW TOCANTINS/LOW ARAGUAIA20,000 MW
MADEIRA18,000 MW
LOW TAPAJÓS/LOW MADEIRA21,000 MW
HIGH TAPAJÓS/HIGH XINGU13,000 MW
1900 km2400 km
1300 km
2100 km
2200 km1600 km2200 km
. .
... .
.
Brazil: Potential Amazonas River Projects
©AB
B G
roup
-7
-22
-Oct
-07
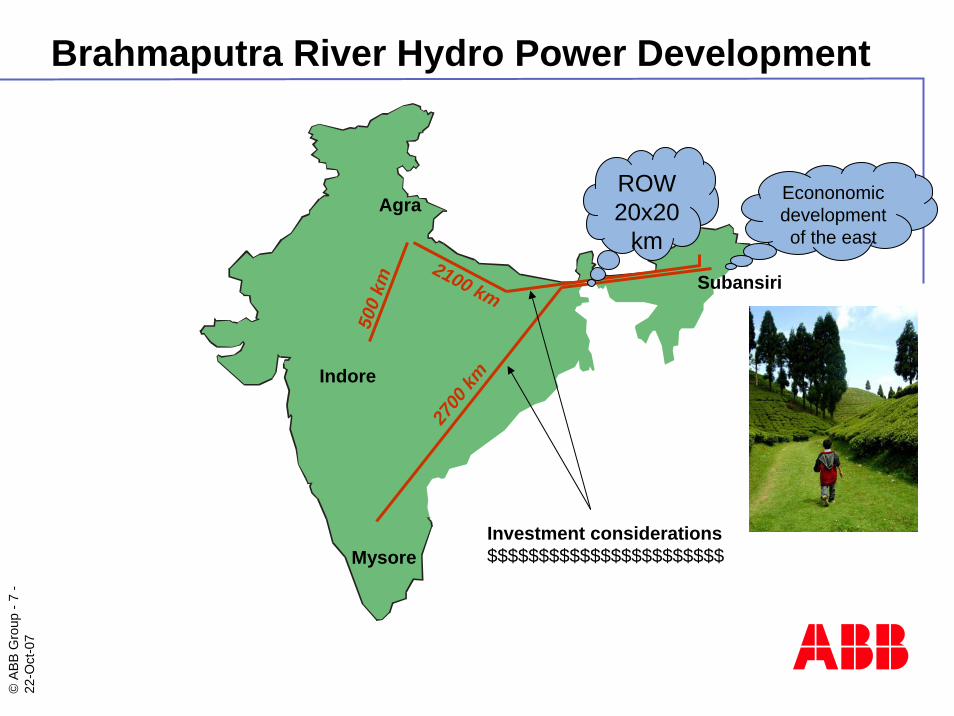
Brahmaputra River Hydro Power Development
Agra
Mysore
Indore
Subansiri
500
km
2100 km
2700
km
ROW20x20
km
Econonomicdevelopmentof the east
Investment considerations$$$$$$$$$$$$$$$$$$$$$$$
©AB
B G
roup
-8
-22
-Oct
-07
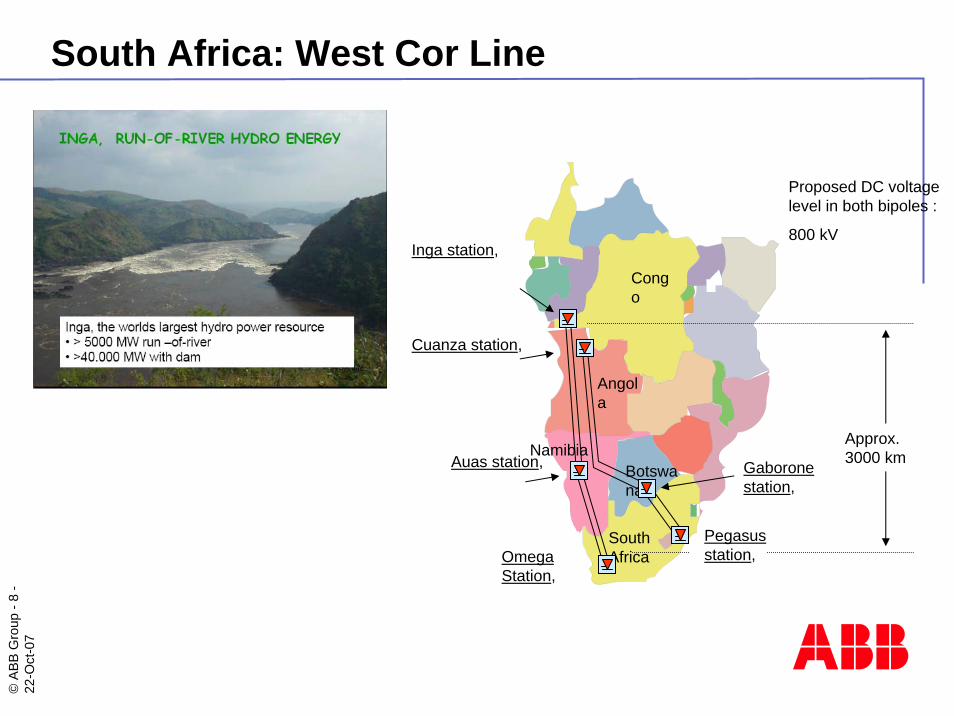
South Africa: West Cor Line
Congo
Angola
Botswana
Namibia
South Africa
Pegasus station, Omega
Station,
Gaborone station,
Auas station,
Cuanza station,
Approx. 3000 km
Proposed DC voltage level in both bipoles :
800 kVInga station,
©AB
B G
roup
-9
-22
-Oct
-07
Guangdong
Fujian
Taiwan
Sichuan & Chongqing
Hubei
Hunan
Jiangxi
Heilongjiang
Inner Mongolia
Hebei
Henan Jiangsu
Shandong
Anhui
Guangxi Guizhou
Beijing Tianjin
Shanghai
Jilin
Gansu
Shaanxi
Shanxi
Qinghai
Xinjiang
Xizang
Ningxia
Liaoning
Zhejiang
Yunnan
Hainan
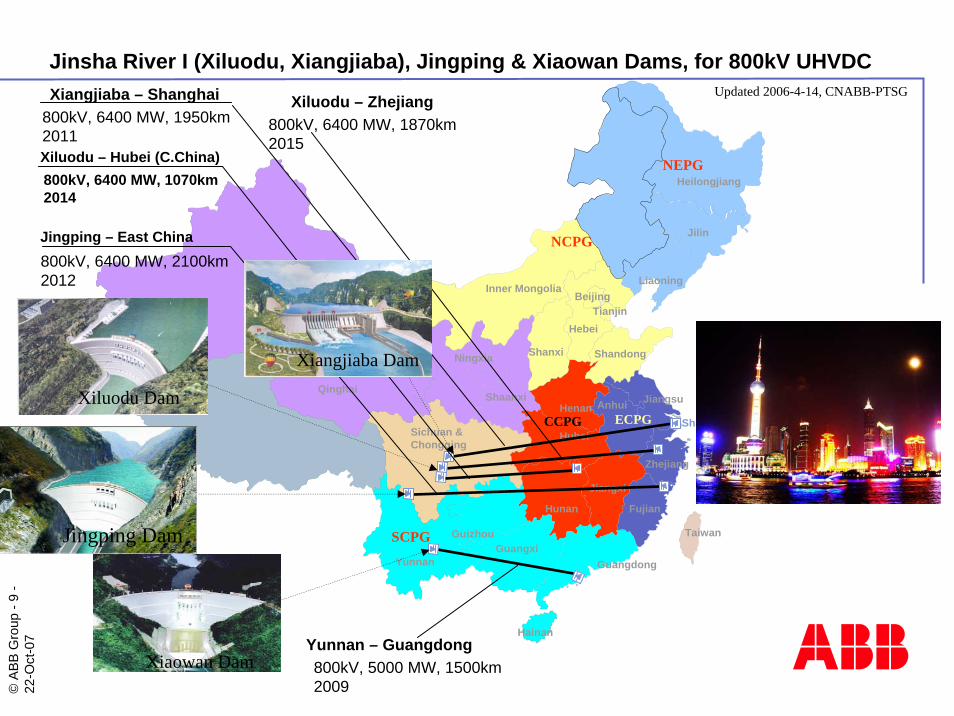
Jinsha River I (Xiluodu, Xiangjiaba), Jingping & Xiaowan Dams, for 800kV UHVDC
NWPG
NCPG
CCPG ECPG
SCPG
Xiangjiaba – Shanghai 800kV, 6400 MW, 1950km 2011Xiluodu – Hubei (C.China)800kV, 6400 MW, 1070km2014
Updated 2006-4-14, CNABB-PTSG
Jingping – East China800kV, 6400 MW, 2100km2012
Xiluodu Dam
Xiluodu – Zhejiang 800kV, 6400 MW, 1870km 2015
Jingping Dam
Xiaowan DamYunnan – Guangdong 800kV, 5000 MW, 1500km 2009
Xiangjiaba Dam
NEPG
©AB
B G
roup
-10
-22
-Oct
-07
Guangdong
Fujian
Taiwan
Sichuan & Chongqing
Hubei
Hunan
Jiangxi
Heilongjiang
Inner Mongolia
Hebei
Henan Jiangsu
Shandong
Anhui
Guangxi Guizhou
Beijing Tianjin
Shanghai
Jilin
Gansu
Shaanxi
Shanxi
Qinghai
Xinjiang
Xizang
Ningxia
Liaoning
Zhejiang
Yunnan
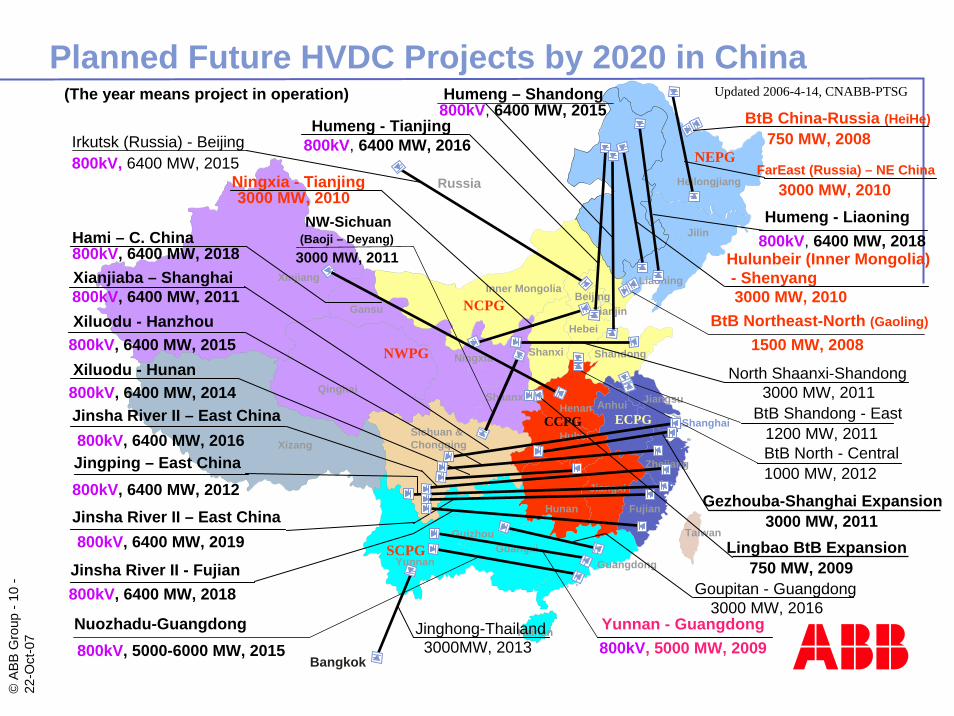
Hainan Nuozhadu-Guangdong800kV, 5000-6000 MW, 2015
Bangkok
NW-Sichuan(Baoji – Deyang)
3000 MW, 2011
BtB North - Central1000 MW, 2012
BtB Shandong - East 1200 MW, 2011
Planned Future HVDC Projects by 2020 in China
Irkutsk (Russia) - Beijing800kV, 6400 MW, 2015
BtB Northeast-North (Gaoling)
1500 MW, 2008
Goupitan - Guangdong3000 MW, 2016
Russia
Jinghong-Thailand3000MW, 2013
Ningxia - Tianjing3000 MW, 2010
NWPG
NCPG
NEPG
CCPG ECPG
North Shaanxi-Shandong3000 MW, 2011
Yunnan - Guangdong800kV, 5000 MW, 2009
SCPG
Hulunbeir (Inner Mongolia)- Shenyang 3000 MW, 2010
Xianjiaba – Shanghai 800kV, 6400 MW, 2011Xiluodu - Hanzhou
800kV, 6400 MW, 2015Xiluodu - Hunan
800kV, 6400 MW, 2014
Updated 2006-4-14, CNABB-PTSG(The year means project in operation)
Hami – C. China800kV, 6400 MW, 2018
Humeng – Shandong
Humeng - Tianjing800kV, 6400 MW, 2016
Humeng - Liaoning800kV, 6400 MW, 2018
Jinsha River II – East China800kV, 6400 MW, 2016
Jinsha River II - Fujian800kV, 6400 MW, 2018
Jinsha River II – East China800kV, 6400 MW, 2019
Jingping – East China800kV, 6400 MW, 2012
Lingbao BtB Expansion750 MW, 2009
Gezhouba-Shanghai Expansion3000 MW, 2011
BtB China-Russia (HeiHe)800kV, 6400 MW, 2015
750 MW, 2008
FarEast (Russia) – NE China3000 MW, 2010
©AB
B G
roup
-11
-22
-Oct
-07
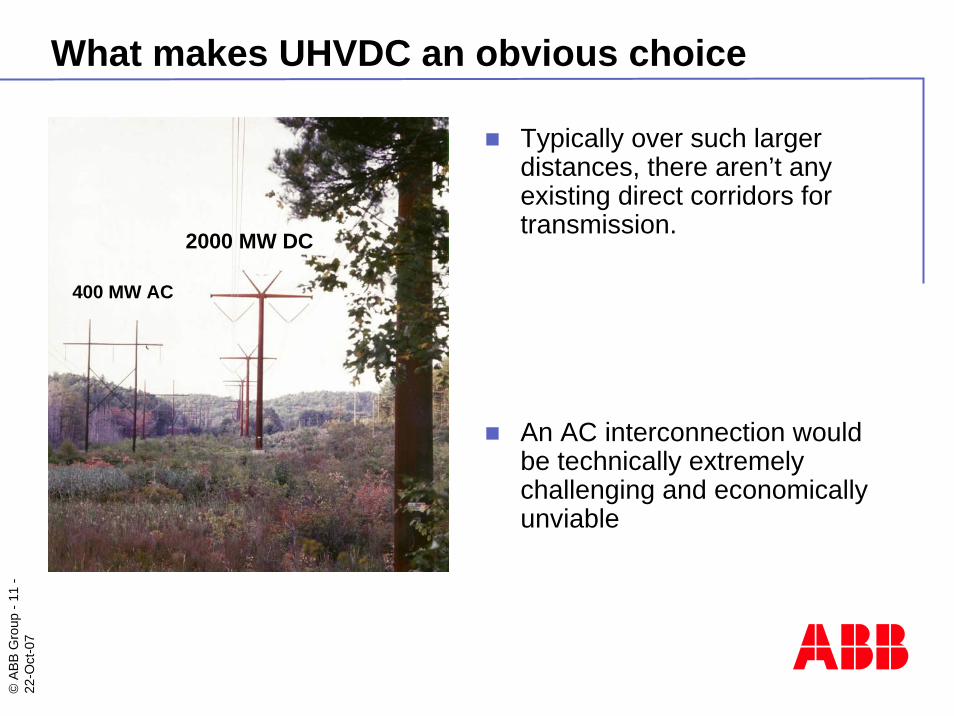
What makes UHVDC an obvious choice
Typically over such largerdistances, there aren’t anyexisting direct corridors for transmission.
An AC interconnection wouldbe technically extremelychallenging and economicallyunviable
400 MW AC
2000 MW DC
©AB
B G
roup
-12
-22
-Oct
-07
Economics
©AB
B G
roup
-13
-22
-Oct
-07
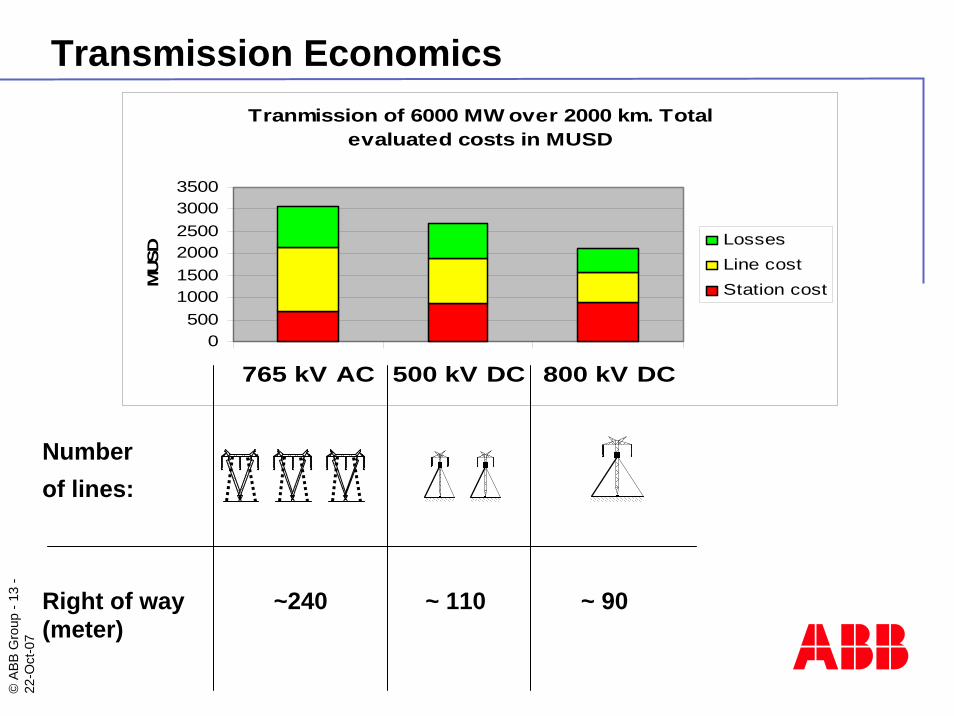
Numberof lines:
Right of way ~240 ~ 110 ~ 90(meter)
Tranmission of 6000 MW over 2000 km. Total evaluated costs in MUSD
0500
100015002000250030003500
765 kV AC 500 kV DC 800 kV DC
MUS
D LossesLine costStation cost
Transmission Economics
©AB
B G
roup
-14
-22
-Oct
-07
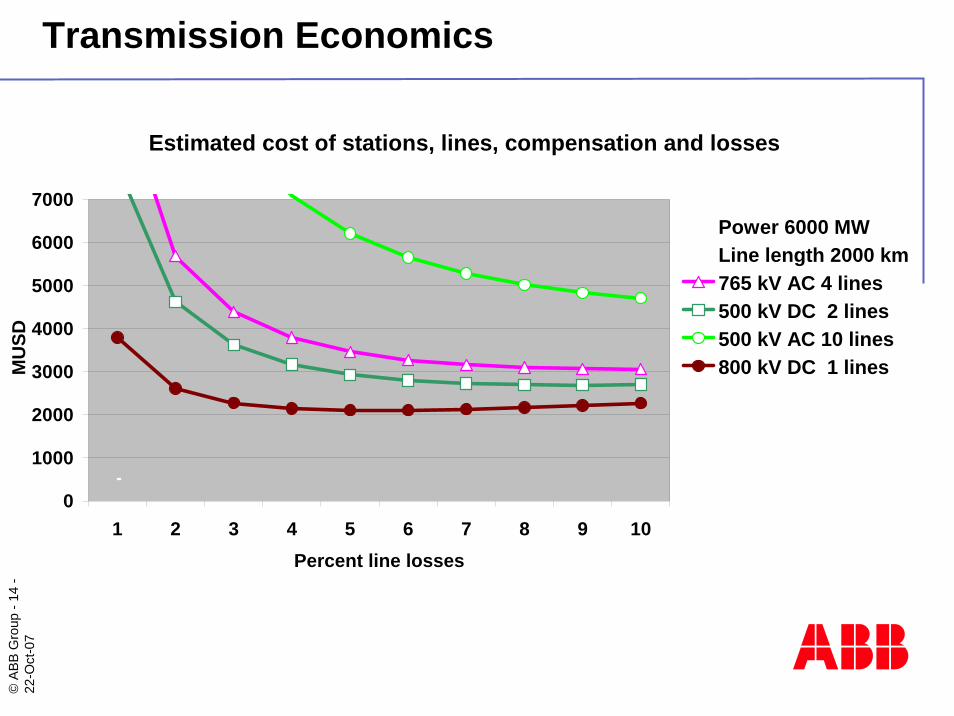
Transmission Economics
Estimated cost of stations, lines, compensation and losses
0
1000
2000
3000
4000
5000
6000
7000
1 2 3 4 5 6 7 8 9 10Percent line losses
MU
SD
Power 6000 MWLine length 2000 km765 kV AC 4 lines500 kV DC 2 lines500 kV AC 10 lines800 kV DC 1 lines
©AB
B G
roup
-15
-22
-Oct
-07
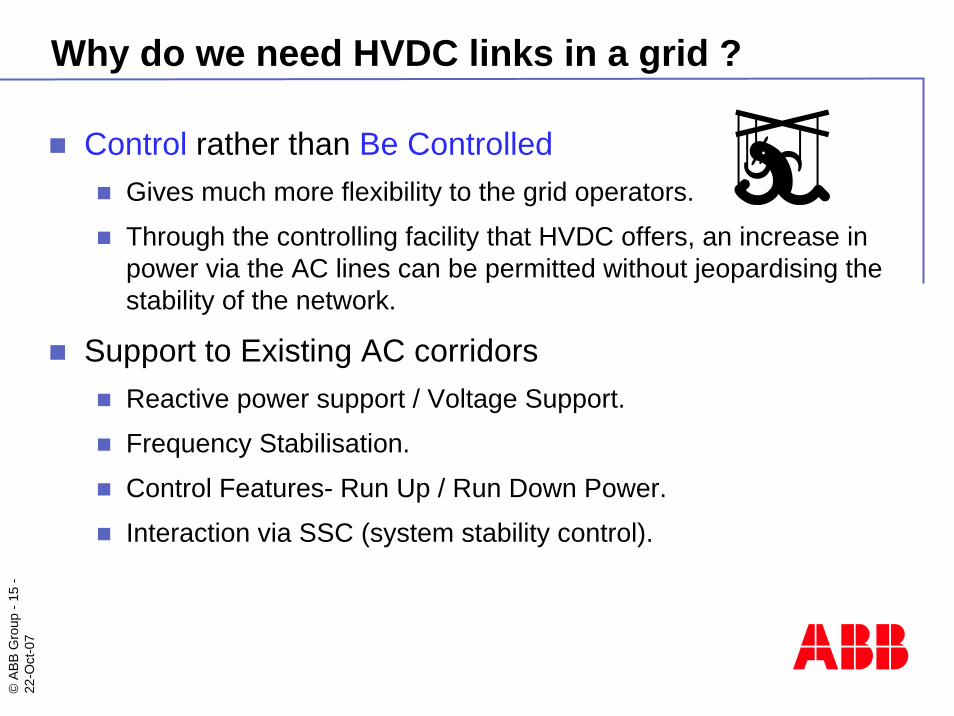
Why do we need HVDC links in a grid ?
Control rather than Be ControlledGives much more flexibility to the grid operators.
Through the controlling facility that HVDC offers, an increase in power via the AC lines can be permitted without jeopardising the stability of the network.
Support to Existing AC corridorsReactive power support / Voltage Support.
Frequency Stabilisation.
Control Features- Run Up / Run Down Power.
Interaction via SSC (system stability control).
©AB
B G
roup
-16
-22
-Oct
-07
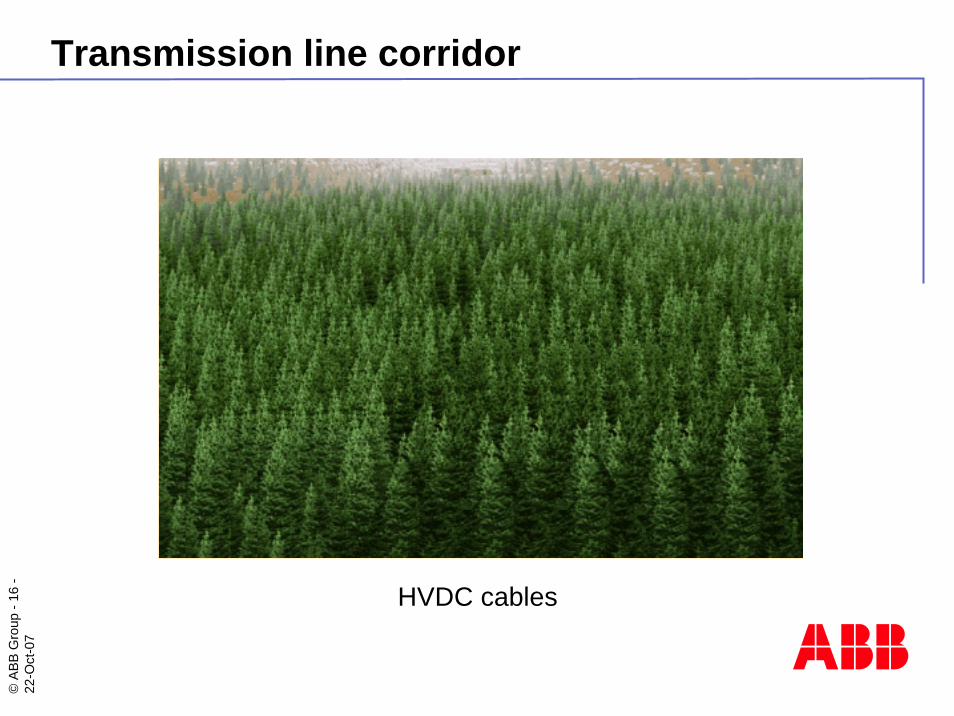
AC transmission line require large corridorsDC line transmitting as much power requires fewer towers
HVDC conserves forests and saves land
Transmission line corridor
HVDC cables
©AB
B G
roup
-17
-22
-Oct
-07
Suggested Configurations
©AB
B G
roup
-18
-22
-Oct
-07
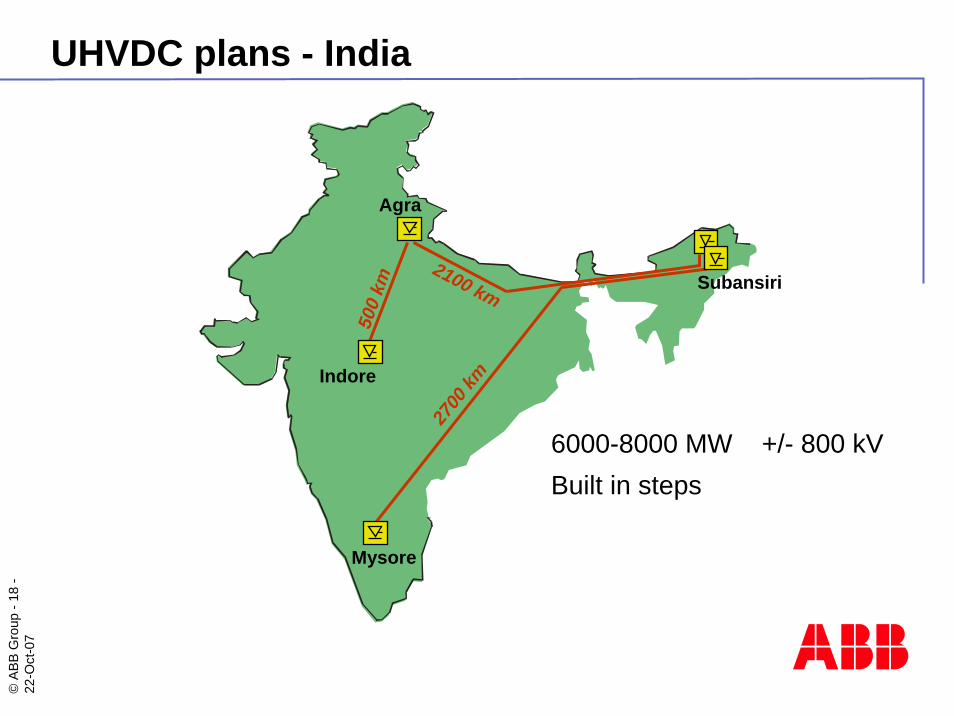
UHVDC plans - India
Agra
Mysore
Indore
Subansiri
500
km
2100 km
2700
km6000-8000 MW +/- 800 kVBuilt in steps
©AB
B G
roup
-19
-22
-Oct
-07
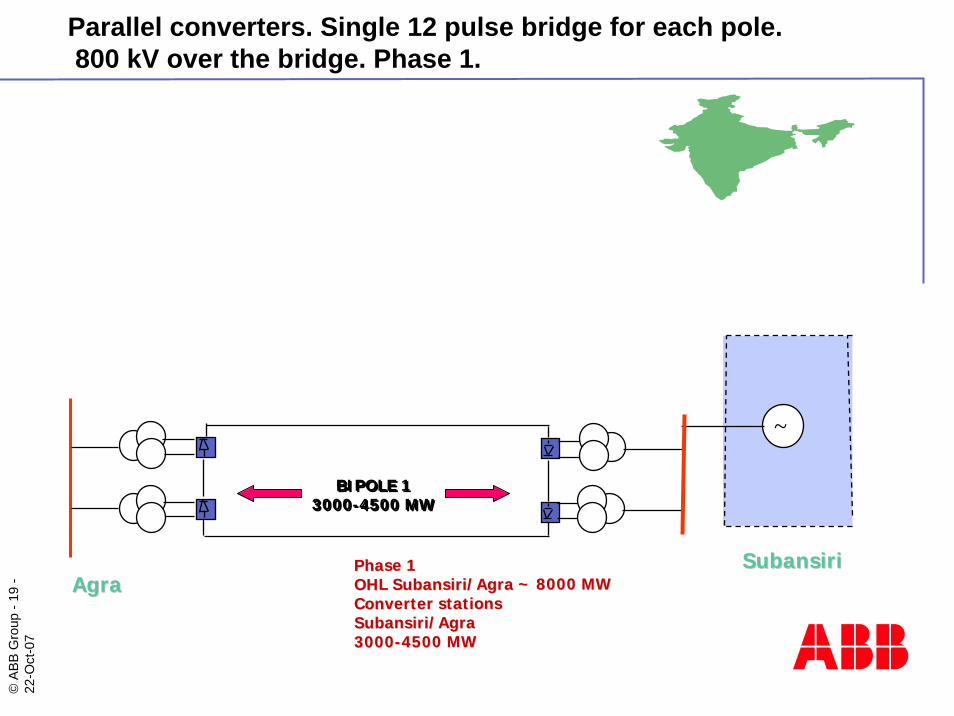
~.
BIPOLE 13000-4500 MW
BIPOLE 13000-4500 MW
Phase 1Phase 1OHL Subansiri/Agra OHL Subansiri/Agra ~ 8000 MW~ 8000 MWConverter stationsConverter stationsSubansiri/AgraSubansiri/Agra30003000--4500 MW4500 MW
SubansiriSubansiriAgraAgra
Parallel converters. Single 12 pulse bridge for each pole.800 kV over the bridge. Phase 1.
©AB
B G
roup
-20
-22
-Oct
-07
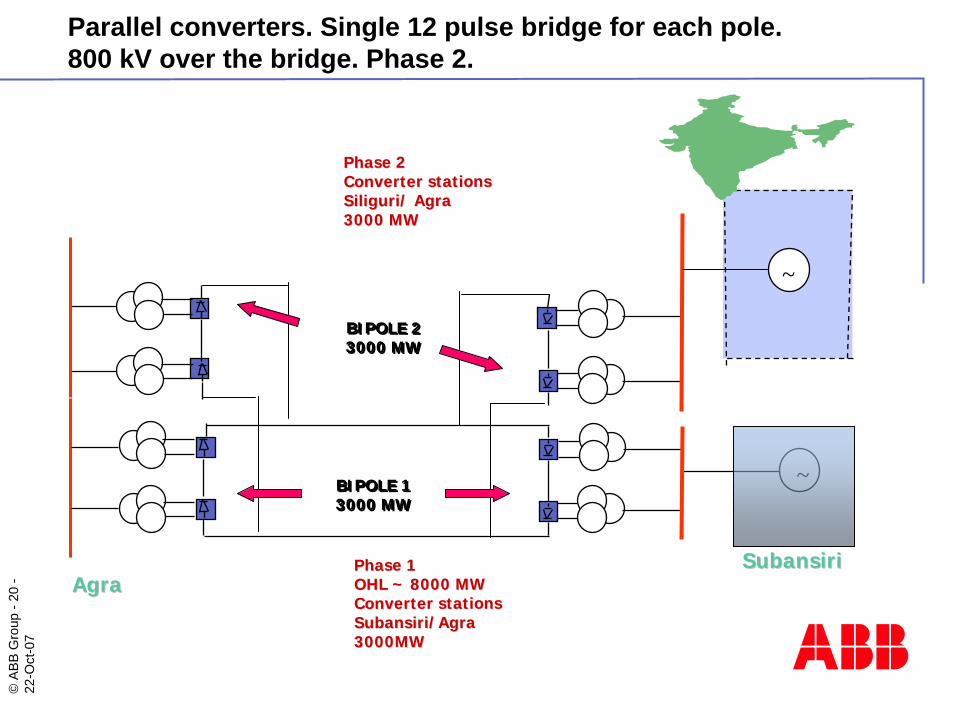
~.
BIPOLE 13000 MWBIPOLE 13000 MW
~.
Phase 1Phase 1OHL OHL ~ 8000 MW~ 8000 MWConverter stationsConverter stationsSubansiri/AgraSubansiri/Agra3000MW3000MW
BIPOLE 23000 MWBIPOLE 23000 MW
Phase 2Phase 2Converter stationsConverter stationsSiliguri/ AgraSiliguri/ Agra3000 MW3000 MW
AgraAgraSubansiriSubansiri
Parallel converters. Single 12 pulse bridge for each pole. 800 kV over the bridge. Phase 2.
©AB
B G
roup
-21
-22
-Oct
-07
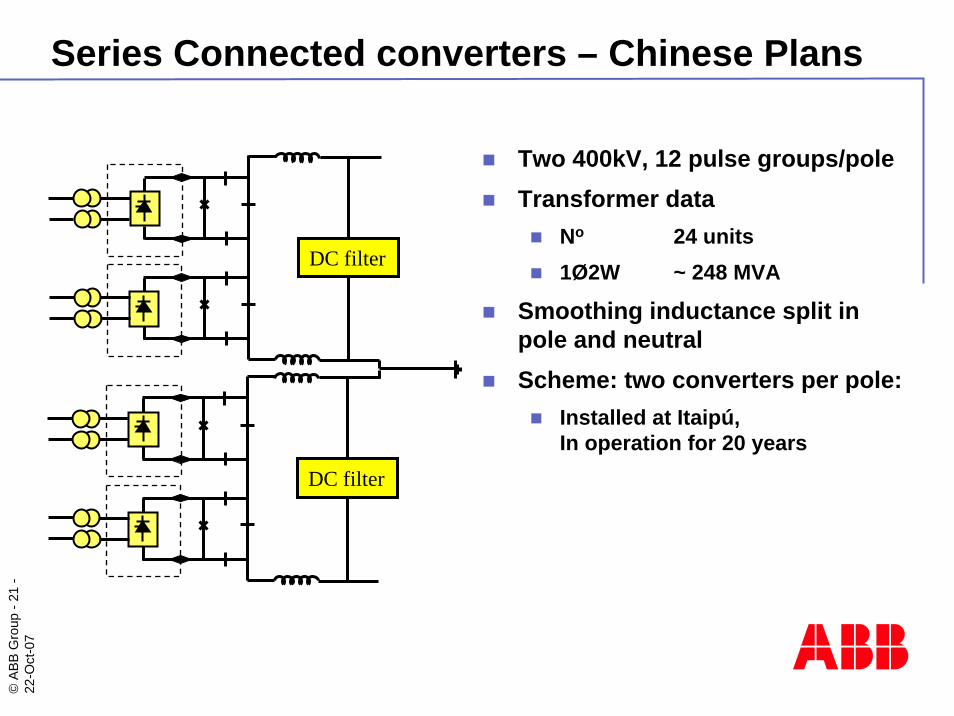
Series Connected converters – Chinese Plans
Two 400kV, 12 pulse groups/poleTransformer data
No 24 units1Ø2W ~ 248 MVA
Smoothing inductance split in pole and neutralScheme: two converters per pole:
Installed at Itaipú,In operation for 20 years
DC filter
DC filter
©AB
B G
roup
-22
-22
-Oct
-07
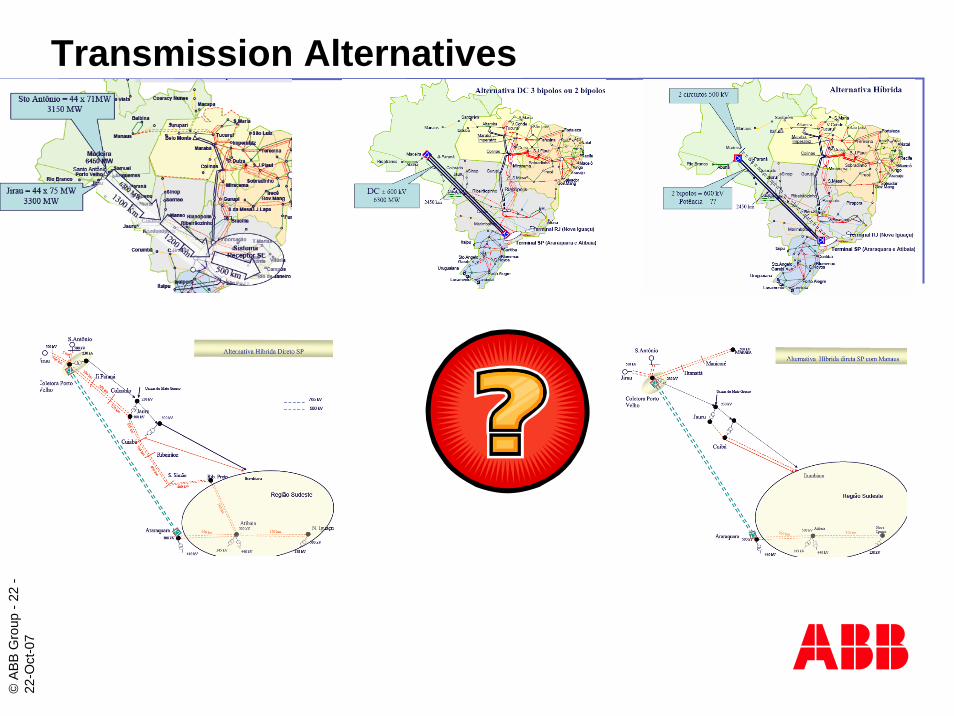
Transmission Alternatives

©AB
B G
roup
-23
-22
-Oct
-07
Transmission alternatives – Hybrid with UHVDC and HVDC Light®
~ ~ ~ ~ ~ ~ ~ ~
~.
~.
~2500 -3000 km
800 kV DCL1
L2
©AB
B G
roup
-24
-22
-Oct
-07
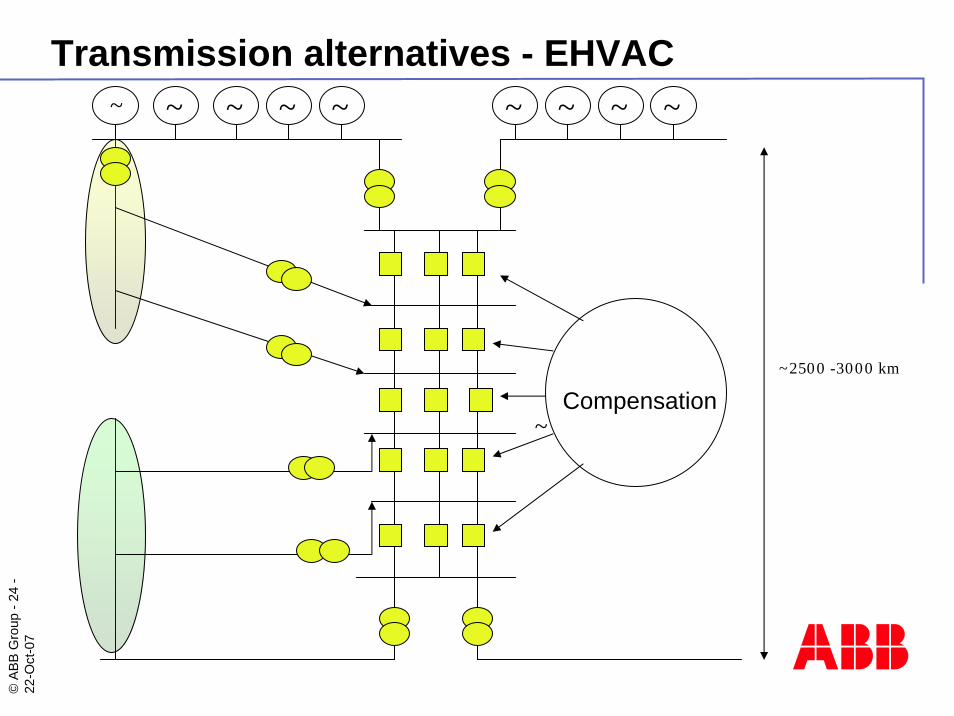
Transmission alternatives - EHVAC~ ~ ~ ~ ~ ~ ~ ~
~.
~.
~2500 -3000 km
Compensation
©AB
B G
roup
-25
-22
-Oct
-07
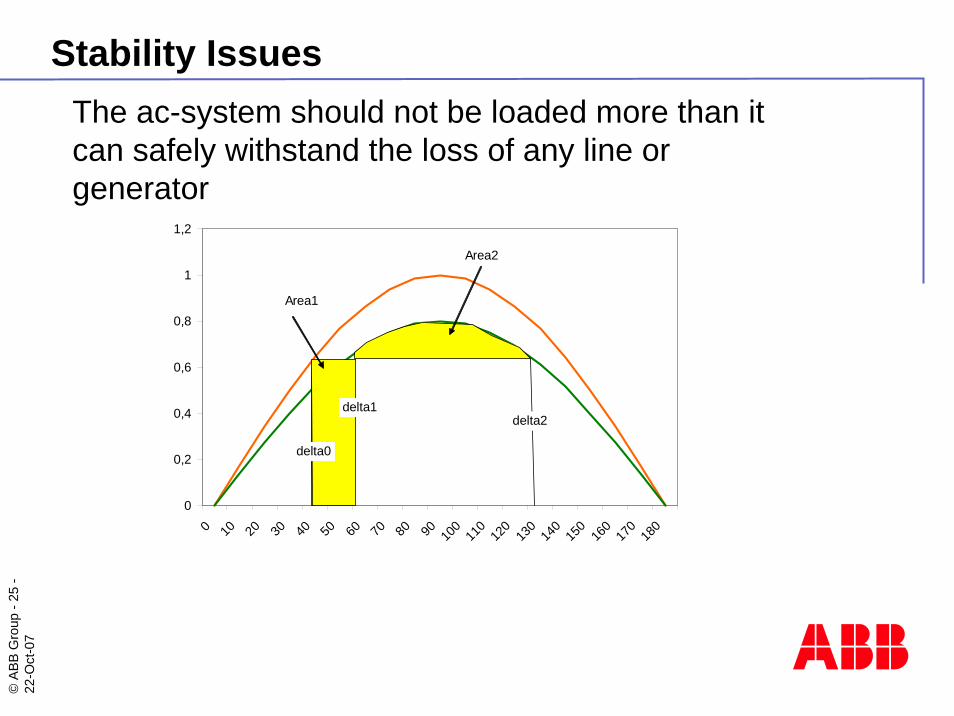
Stability Issues The ac-system should not be loaded more than it can safely withstand the loss of any line or generator
0
0,2
0,4
0,6
0,8
1
1,2
0 10 20 30 40 50 60 70 80 90 100
110
120
130
140
150
160
170
180
Area1
Area2
delta0
delta1delta2
©AB
B G
roup
-26
-22
-Oct
-07
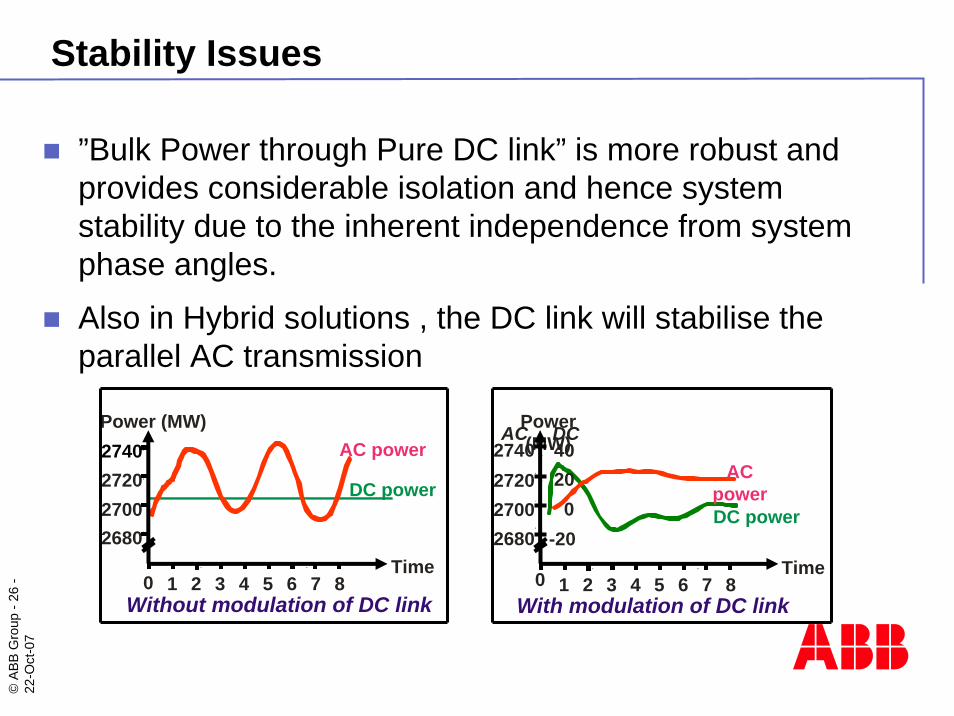
Stability Issues
”Bulk Power through Pure DC link” is more robust and provides considerable isolation and hence system stability due to the inherent independence from system phase angles.
Also in Hybrid solutions , the DC link will stabilise the parallel AC transmission
AC power
DC power
Power (MW)2740272027002680
1Time
Without modulation of DC link0 2 3 4 5 6 7 8
40200
-20
2740272027002680
AC DC
AC powerDC power
Power (MW)
With modulation of DC link1
Time0 2 3 4 5 6 7 8
©AB
B G
roup
-27
-22
-Oct
-07
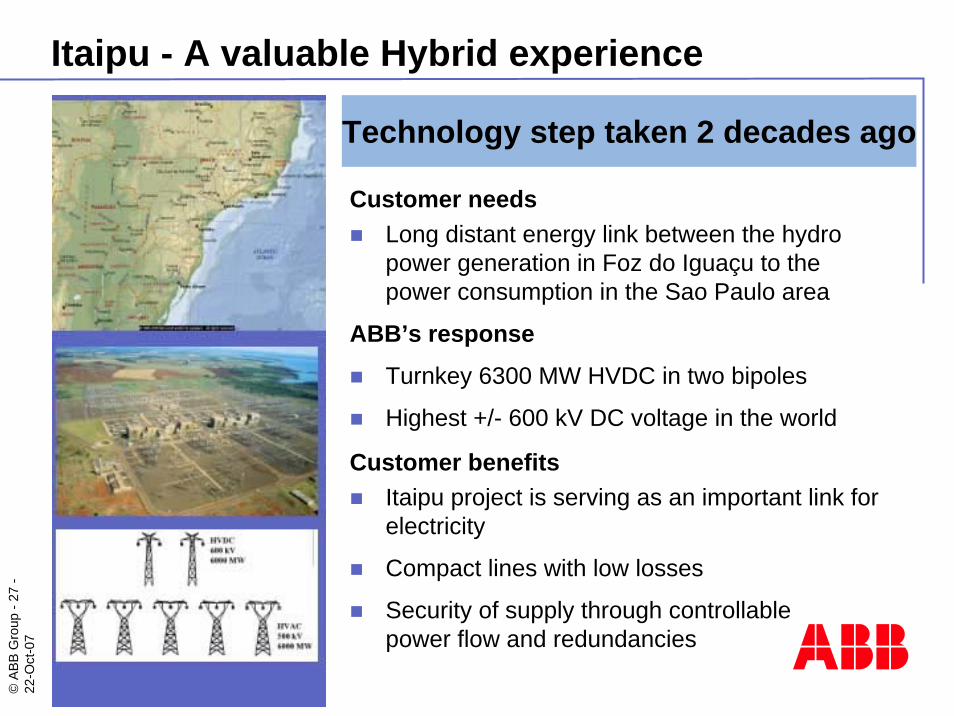
Itaipu - A valuable Hybrid experience
Customer needsLong distant energy link between the hydro power generation in Foz do Iguaçu to the power consumption in the Sao Paulo area
ABB’s response
Turnkey 6300 MW HVDC in two bipoles
Highest +/- 600 kV DC voltage in the world
Customer benefitsItaipu project is serving as an important link for electricity
Compact lines with low losses
Security of supply through controllablepower flow and redundancies
Technology step taken 2 decades ago
©AB
B G
roup
-28
-22
-Oct
-07
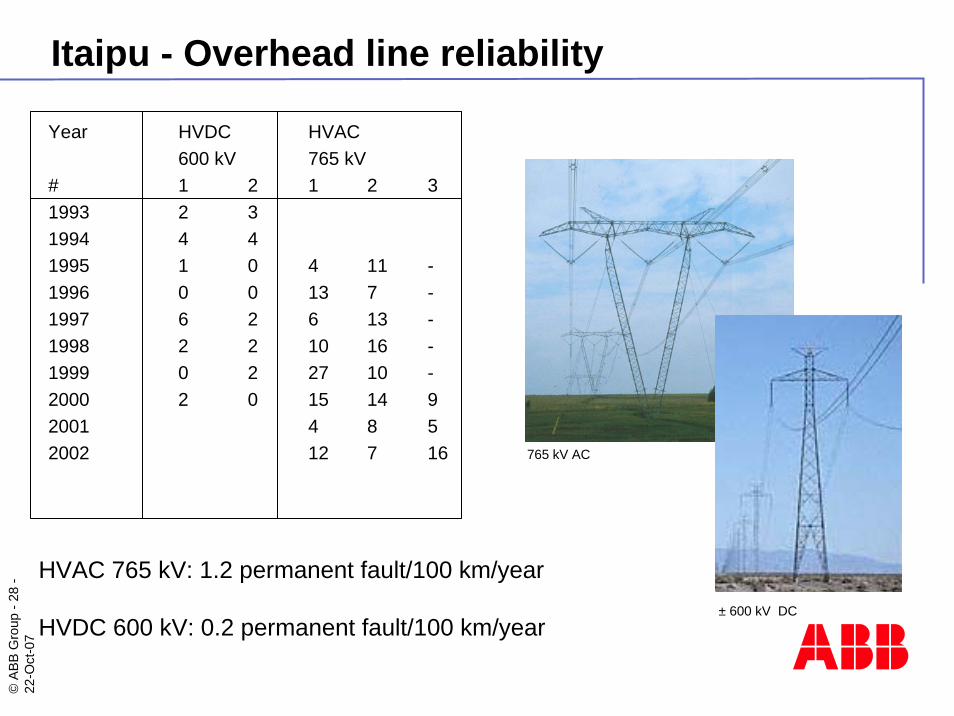
Itaipu - Overhead line reliability
Year HVDC HVAC600 kV 765 kV
# 1 2 1 2 31993 2 31994 4 41995 1 0 4 11 -1996 0 0 13 7 -1997 6 2 6 13 -1998 2 2 10 16 -1999 0 2 27 10 -2000 2 0 15 14 92001 4 8 52002 12 7 16 765 kV AC
± 600 kV DC
HVAC 765 kV: 1.2 permanent fault/100 km/year
HVDC 600 kV: 0.2 permanent fault/100 km/year
©AB
B G
roup
-29
-22
-Oct
-07
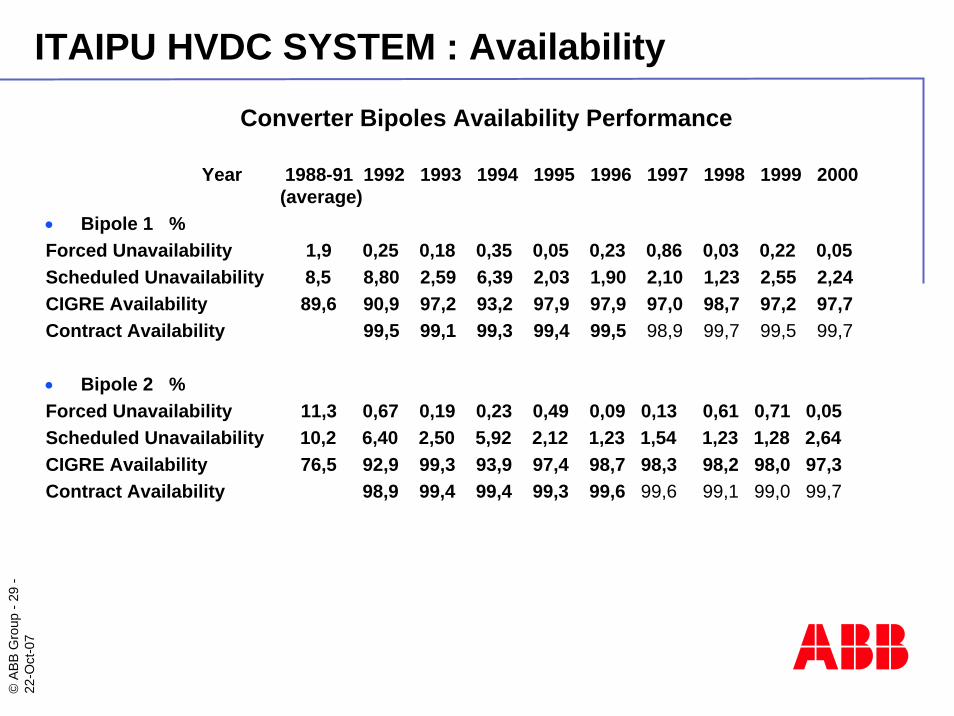
Converter Bipoles Availability Performance
Year 1988-91 1992 1993 1994 1995 1996 1997 1998 1999 2000(average)
• Bipole 1 %Forced Unavailability 1,9 0,25 0,18 0,35 0,05 0,23 0,86 0,03 0,22 0,05Scheduled Unavailability 8,5 8,80 2,59 6,39 2,03 1,90 2,10 1,23 2,55 2,24CIGRE Availability 89,6 90,9 97,2 93,2 97,9 97,9 97,0 98,7 97,2 97,7Contract Availability 99,5 99,1 99,3 99,4 99,5 98,9 99,7 99,5 99,7
• Bipole 2 %Forced Unavailability 11,3 0,67 0,19 0,23 0,49 0,09 0,13 0,61 0,71 0,05Scheduled Unavailability 10,2 6,40 2,50 5,92 2,12 1,23 1,54 1,23 1,28 2,64CIGRE Availability 76,5 92,9 99,3 93,9 97,4 98,7 98,3 98,2 98,0 97,3Contract Availability 98,9 99,4 99,4 99,3 99,6 99,6 99,1 99,0 99,7
ITAIPU HVDC SYSTEM : Availability
©AB
B G
roup
-30
-22
-Oct
-07
Summary
Necessity to have a technically viable and economicalmeans to transmit Bulk Power over large distances wasthe driving force for R and D of 800 kV UHVDC technology.
It’s now clear that UHVDC technology is far superior for Point to Point Bulk Power transfers over long distances.
UHVDC technology is READY FOR COMMERCIAL USE !
©AB
B G
roup
-31
-22
-Oct
-07
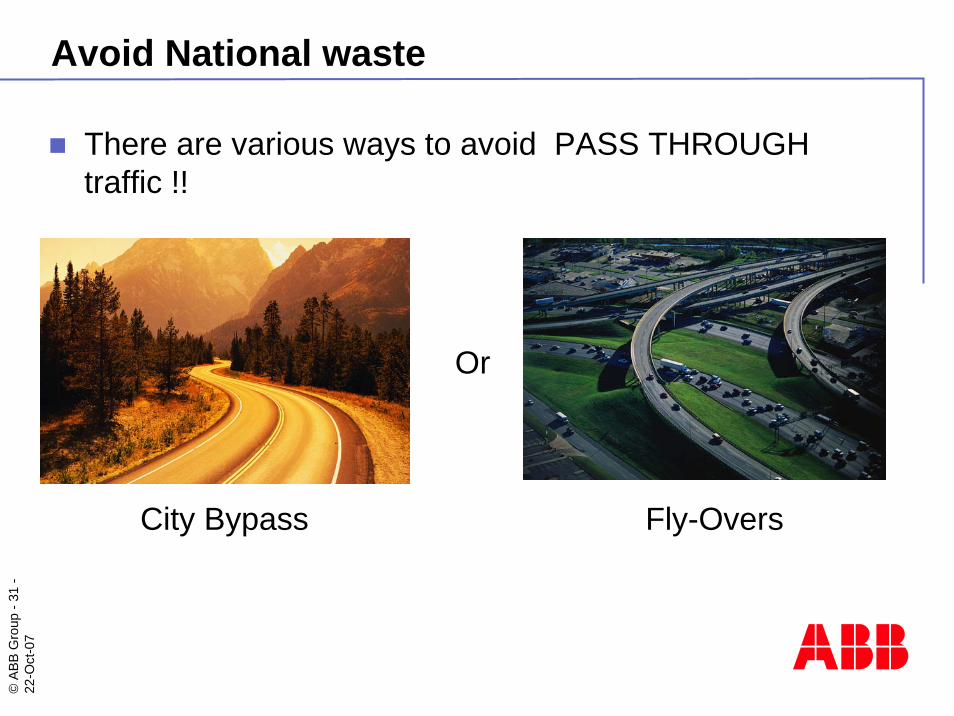
Avoid National waste
There are various ways to avoid PASS THROUGH traffic !!
Or
City Bypass Fly-Overs