Embed Size (px)
Citation preview
Overview of Brazilian Soybean 2014 Transportation. Strategic transportation infrastructure improvements, weaker currency, and lower farm prices and ocean rates facilitated the 2014 Brazilian record-high soybean exports. Trade from the Southern ports of Santos, Rio Grande, and Paranaguá was diverted to the North and Northeastern ports to expedite soybean exports. These 3 ports kept their leadership position but lost 5 percent of their traditional share of Brazilian exports, accounting for 62 percent of the total, compared with 67 percent in 2013 (Secretariat of Foreign Trade (SECEX), MDIC). Soybean exports increased significantly in the ports of São Francisco do Sul (SC), Vitória (ES), Salvador (BA), Manaus (AM), Barcarena (PA), Imbituba (SC), and Ilheus (BA). The Northern ports of Manaus, Barcarena, and Santarém represented 7.5 percent of total 2014 Brazilian soybean exports, compared with 5.3 percent a year earlier (Secretariat of Foreign Trade (SECEX), MDIC).
Brazil Soybean Transportationa quarterly publication of the Agricultural Marketing Service
www.ams.usda.gov/AgTransportation
January 28, 2015
Contents
Brazil Soybean Transportation Indicators
Brazil Soybean Transportation Guide: 2013 (PDF)
Contact Information
Data Sets
Subscription Information
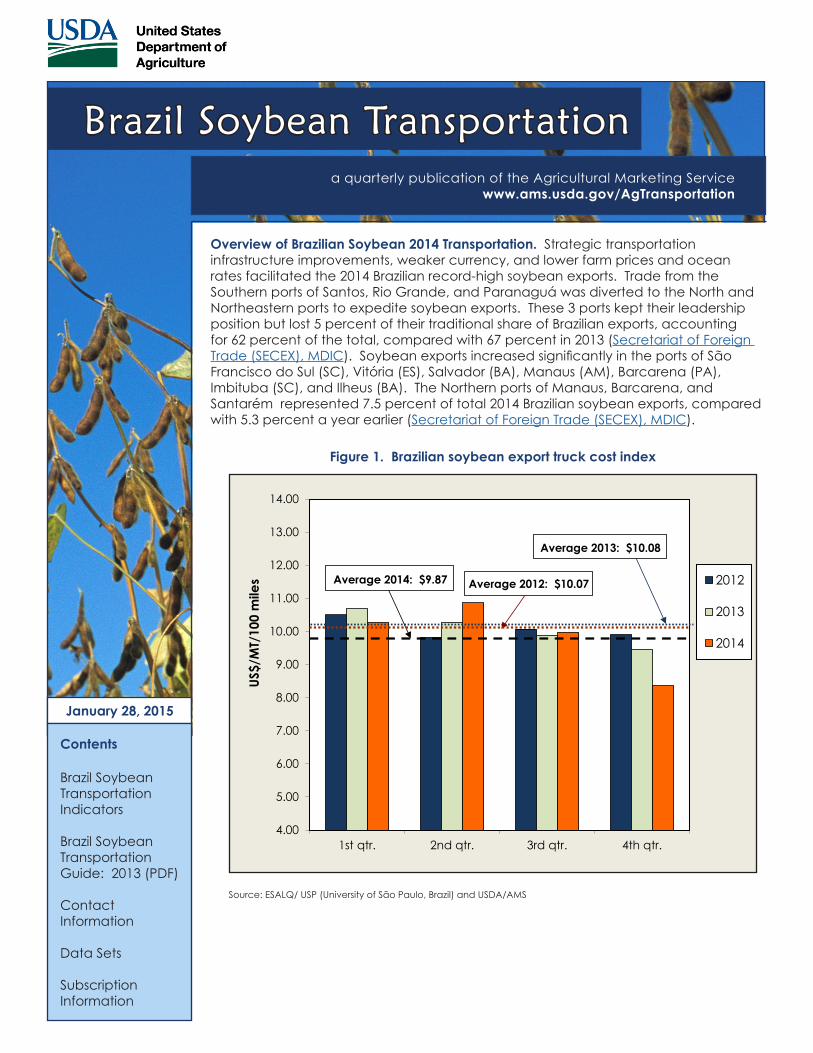
Figure 1. Brazilian soybean export truck cost index
4.00
5.00
6.00
7.00
8.00
9.00
10.00
11.00
12.00
13.00
14.00
1st qtr. 2nd qtr. 3rd qtr. 4th qtr.
US$/
MT/
100
mile
s 2012
2013
2014
Average 2014: $9.87 Average 2012: $10.07
Average 2013: $10.08
Source: ESALQ/ USP (University of São Paulo, Brazil) and USDA/AMS

Brazil Soybean Transportation 2 January 28, 2015
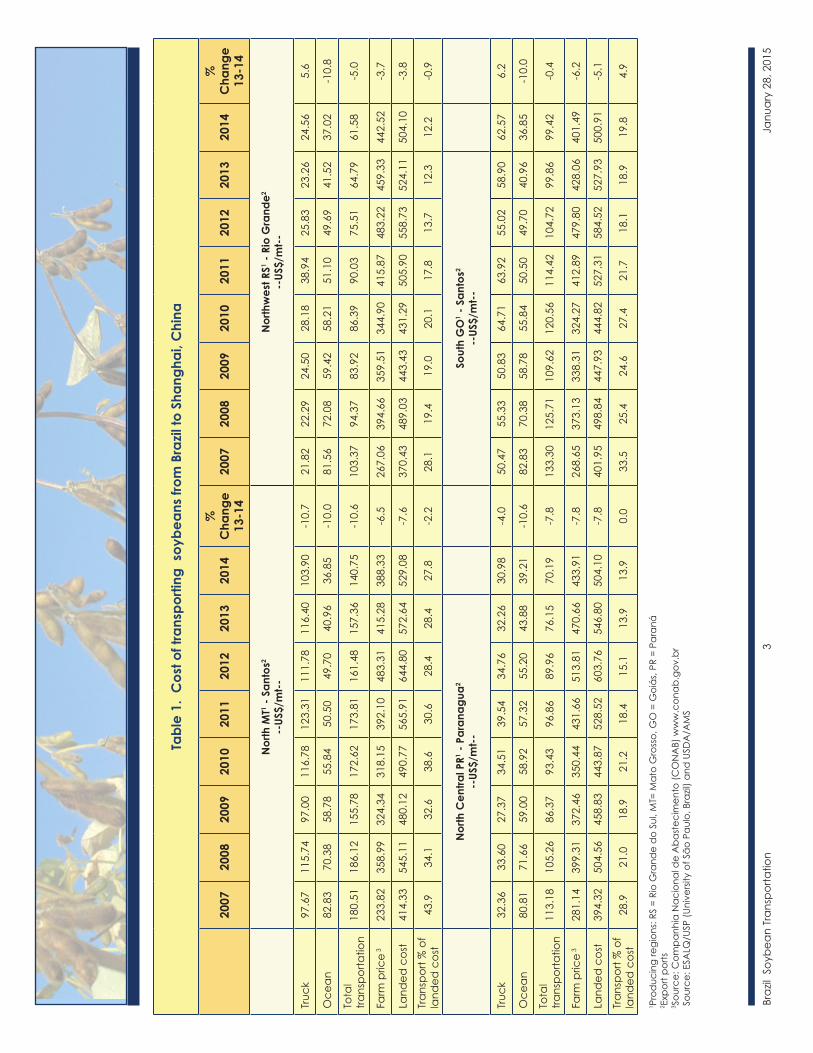
The cost of shipping a metric ton (mt) of soybeans 100 miles by truck decreased slightly, from $10.08 in 2013 to $9.87 in 2014 (figure 1 and table 6). In 2014, Brazilian soybean transportation costs to Shanghai, China, from the routes of North Mato Grosso (MG) and Northwest Rio Grande do Sul−Rio Grande decreased 1―2 percent as a percentage of total landed costs because of lower transportation costs, compared with 2013 (table 1). However, costs increased up to 5 percent from South Goiás to Santos because of higher truck rates. In Sorriso, North MT (the largest Brazilian soybean-producing state) transportation costs represented nearly 28 percent of the total landed costs of shipping soybeans to Shanghai through Santos compared with 34 percent in 2008 and 45 percent in 2006.
The volume of Brazilian soybean exports increased 6 percent from 2013, from 42.9 million to 45.7 million metric tons (mt) (Secretariat of Foreign Trade (SECEX), MDIC). The value of exports increased 2 percent to US$23.2 billion from US$22.8 billion in 2013. Average soybean export prices decreased to $512/mt from $533/mt. in 2013. The Brazilian Real (R$) weakened to 8.3 percent against the U.S. dollar. This partially offset the nearly 6-percent drop in soybean farm prices—down to $416.56/mt from $440.95/mt in 2013—because soybeans are priced in U.S. dollars but paid in Reais. 2014 average farm prices in the Brazilian Real (R$) increased 3 percent, to R$976.81 from R$964.53/mt (Brazil Central Bank and CONAB).
China is Brazil’s major soybean buyer, accounting for 71 percent of total export, followed by Spain, Netherlands, Thailand, and the United States (Secretariat of Foreign Trade (SECEX, MDIC)). China bought 32.6 million mt of Brazilian soybeans in 2014, valued at US$16.6 billion. The United States jumped from the 11th largest Brazilian soybean export destination in 2013 to the 5th in 2014, accounting for 2 percent of Brazilian total exports, equivalent to 1.06 million mt, valued at $538.1 million. Mato Grosso, largest Brazilian exporting state, accounted for 64 and 39 percent of total Brazilian soybean exports to China and the United States, respectively.
According to the Brazilian Institute of Geography and Statistics (IBGE) and The International Monetary Fund, in 2014 the Brazilian economy slowed to an annual growth rate of 0.1 percent, from 2.5 percent in 2013. The actual inflation rate increased to 6.41 percent from to 5.91 percent last year. The Brazilian economy is expected to grow 0.3 percent in 2015. For more information contact Delmy L. Salin at [email protected].
Braz
il So
ybea
n Tr
ansp
orta
tion
3
Ja
nuar
y 28
, 201
5
Tabl
e 1.
Cos
t of t
rans
porti
ng s
oybe
ans
from
Bra
zil to
Sha
ngha
i, C
hina
2007
2008
2009
2010
2011
2012
2013
2014
%
Cha
nge
13-1
420
0720
0820
0920
1020
1120
1220
1320
14%
C
hang
e 13
-14
Nor
th M
T1 - S
anto
s2
--US
$/m
t--
Nor
thw
est R
S1 - R
io G
rand
e2 --
US$/
mt-
-
Truc
k97
.67
115.
7497
.00
116.
7812
3.31
111.
7811
6.40
103.
90-1
0.7
21.8
222
.29
24.5
028
.18
38.9
425
.83
23.2
624
.56
5.6
Oce
an82
.83
70.3
858
.78
55.8
450
.50
49.7
040
.96
36.8
5-1
0.0
81.5
672
.08
59.4
258
.21
51.1
049
.69
41.5
237
.02
-10.
8
Tota
l tra
nspo
rtatio
n18
0.51
186.
1215
5.78
172.
6217
3.81
161.
4815
7.36
140.
75-1
0.6
103.
3794
.37
83.9
286
.39
90.0
375
.51
64.7
961
.58
-5.0
Farm
pric
e 323
3.82
358.
9932
4.34
318.
1539
2.10
483.
3141
5.28
388.
33-6
.526
7.06
394.
6635
9.51
344.
9041
5.87
483.
2245
9.33
442.
52-3
.7
Land
ed c
ost
414.
3354
5.11
480.
1249
0.77
565.
9164
4.80
572.
6452
9.08
-7.6
370.
4348
9.03
443.
4343
1.29
505.
9055
8.73
524.
1150
4.10
-3.8
Tran
spor
t % o
f la
nded
cos
t43
.934
.132
.638
.630
.628
.428
.427
.8-2
.228
.119
.419
.020
.117
.813
.712
.312
.2-0
.9
Nor
th C
entra
l PR1 -
Par
anag
ua2
--US
$/m
t--
Sout
h G
O1 -
San
tos2
--
US$/
mt-
-
Truc
k32
.36
33.6
027
.37
34.5
139
.54
34.7
632
.26
30.9
8-4
.050
.47
55.3
350
.83
64.7
163
.92
55.0
258
.90
62.5
76.
2
Oce
an80
.81
71.6
659
.00
58.9
257
.32
55.2
043
.88
39.2
1-1
0.6
82.8
370
.38
58.7
855
.84
50.5
049
.70
40.9
636
.85
-10.
0
Tota
l tra
nspo
rtatio
n11
3.18
105.
2686
.37
93.4
396
.86
89.9
676
.15
70.1
9-7
.813
3.30
125.
7110
9.62
120.
5611
4.42
104.
7299
.86
99.4
2-0
.4
Farm
pric
e 328
1.14
399.
3137
2.46
350.
4443
1.66
513.
8147
0.66
433.
91-7
.826
8.65
373.
1333
8.31
324.
2741
2.89
479.
8042
8.06
401.
49-6
.2
Land
ed c
ost
394.
3250
4.56
458.
8344
3.87
528.
5260
3.76
546.
8050
4.10
-7.8
401.
9549
8.84
447.
9344
4.82
527.
3158
4.52
527.
9350
0.91
-5.1
Tran
spor
t % o
f la
nded
cos
t28
.921
.018
.921
.218
.415
.113
.913
.90.
033
.525
.424
.627
.421
.718
.118
.919
.84.
9 1 P
rod
ucin
g re
gion
s: RS
= R
io G
rand
e d
o Su
l, M
T= M
ato
Gro
sso,
GO
= G
oiás
, PR
= Pa
raná
2 E
xpor
t por
ts3 S
ourc
e: C
ompa
nhia
Nac
iona
l de
Aba
stec
imen
to (C
ON
AB)
ww
w.c
onab
.gov
.br
Sou
rce:
ESA
LQ/U
SP (U
nive
rsity
of S
ão P
aulo
, Bra
zil) a
nd U
SDA
/AM
S

Braz
il So
ybea
n Tr
ansp
orta
tion
4
Ja
nuar
y 28
, 201
5
Tabl
e 2.
Cos
t of t
rans
porti
ng s
oybe
ans
from
Bra
zil to
Ham
burg
, Ger
man
y
2007
2008
2009
2010
2011
2012
2013
2014
%
Cha
nge
13-1
420
0720
0820
0920
1020
1120
1220
1320
14%
C
hang
e 13
-14
Nor
th M
T1 - S
anto
s2
--US
$/m
t--
Nor
thw
est R
S1 - R
io G
rand
e2
--
US$/
mt-
-
Truc
k97
.67
115.
7497
.00
116.
7812
3.31
111.
7811
6.40
103.
90-1
0.7
21.8
222
.29
24.5
028
.18
37.5
425
.83
23.2
624
.56
5.6
Oce
an73
.01
52.3
632
.48
33.6
334
.65
31.7
529
.50
27.7
5-5
.971
.73
54.3
033
.79
36.0
336
.12
33.1
529
.50
27.0
0-8
.5
Tota
l tra
nspo
rtatio
n17
0.68
168.
1012
9.48
150.
4015
7.96
143.
5314
5.90
131.
65-9
.893
.55
76.6
058
.30
64.2
173
.65
58.9
752
.76
51.5
6-2
.3
Farm
pric
e 323
3.82
358.
9932
4.34
318.
1539
2.10
483.
3141
5.28
388.
33-6
.526
7.06
394.
6635
9.51
344.
9041
5.87
483.
2245
9.33
442.
52-3
.7
Land
ed c
ost
404.
5052
7.09
453.
8246
8.55
550.
0662
6.84
561.
1851
9.98
-7.3
360.
6147
1.26
417.
8040
9.11
489.
5254
2.19
512.
0949
4.08
-3.5
Tran
spor
t % o
f la
nded
cos
t42
.531
.628
.732
.628
.723
.326
.025
.3-2
.826
.116
.114
.015
.815
.011
.010
.310
.51.
5
Nor
th C
entra
l PR1 -
Par
anag
ua2
--US
$/m
t--
Sout
h G
O1 -
San
tos2
--
US$/
mt-
-
Truc
k32
.36
33.6
027
.37
34.5
139
.54
34.7
632
.26
30.9
8-4
.050
.47
80.6
150
.83
64.7
163
.92
55.0
258
.90
62.5
76.
2
Oce
an71
.05
53.8
133
.34
35.0
834
.95
33.8
029
.50
28.7
5-2
.573
.01
52.3
632
.48
33.6
334
.65
31.7
529
.50
27.7
5-5
.9
Tota
l tra
nspo
rtatio
n10
3.42
87.4
160
.71
69.5
974
.48
68.5
661
.76
59.7
3-3
.312
3.48
132.
9783
.32
98.3
498
.57
86.7
788
.40
90.3
22.
2
Farm
pric
e 328
1.14
399.
3037
2.46
350.
4443
1.66
513.
8147
0.66
433.
91-7
.826
8.65
358.
9933
8.31
324.
2741
2.89
479.
8042
8.06
401.
49-6
.2
Land
ed c
ost
384.
5648
6.71
433.
1742
0.03
506.
1558
2.36
532.
4249
3.64
-7.3
392.
1249
1.97
421.
6342
2.61
511.
4656
6.57
516.
4749
1.81
-4.8
Tran
spor
t % o
f la
nded
cos
t27
.017
.914
.116
.814
.711
.911
.612
.14.
231
.826
.919
.823
.619
.315
.617
.118
.37.
1 1 P
rod
ucin
g re
gion
s: RS
= R
io G
rand
e d
o Su
l, M
T= M
ato
Gro
sso,
GO
= G
oiás
, PR
= Pa
raná
2 E
xpor
t por
ts3 S
ourc
e: C
ompa
nhia
Nac
iona
l de
Aba
stec
imen
to (C
ON
AB)
ww
w.c
onab
.gov
.br
Sou
rce:
ESA
LQ/U
SP (U
nive
rsity
of S
ão P
aulo
, Bra
zil) a
nd U
SDA
/AM
S
Brazil Soybean Transportation 5 January 28, 2015
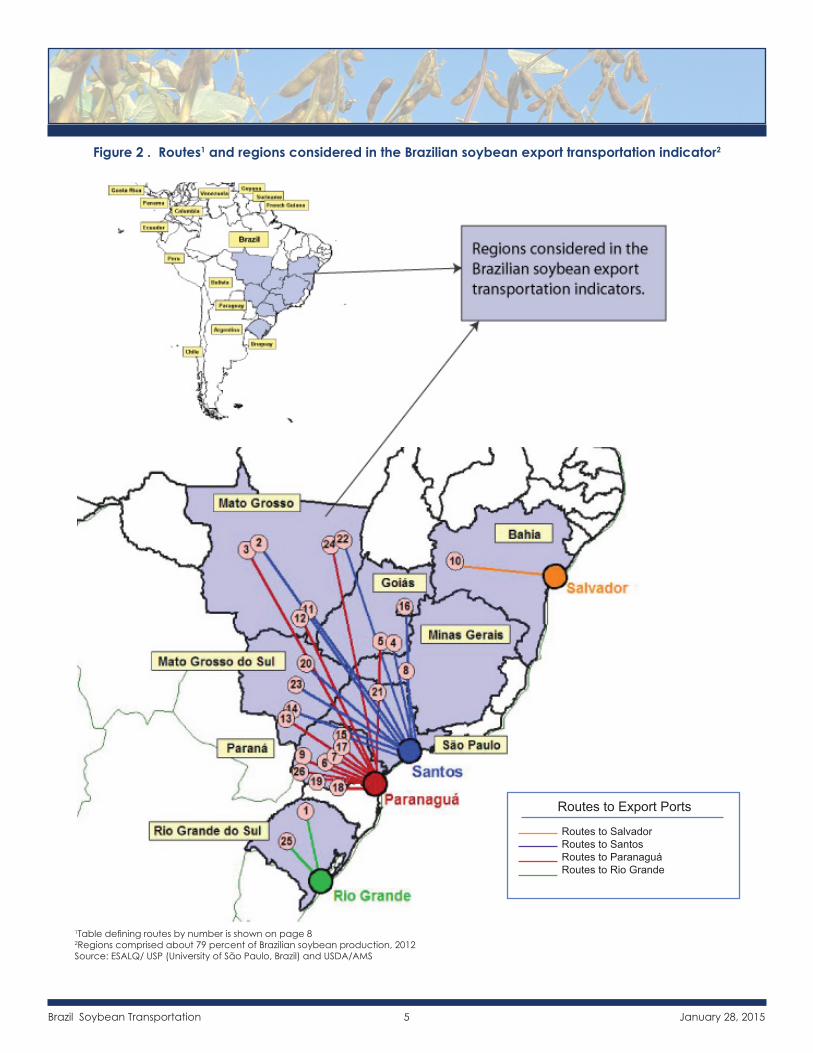
Figure 2 . Routes1 and regions considered in the Brazilian soybean export transportation indicator2
Routes to Export Ports
Routes to Salvador Routes to Santos Routes to Paranaguá Routes to Rio Grande
1Table defining routes by number is shown on page 82Regions comprised about 79 percent of Brazilian soybean production, 2012Source: ESALQ/ USP (University of São Paulo, Brazil) and USDA/AMS

Brazil Soybean Transportation 6 January 28, 2015
Table 3. Quarterly costs of transporting Brazilian soybeans to Shanghai, China-----------------------------------------------2014-----------------------------------------------
1st qtr 2nd qtr 3rd qtr 4th qtr Avg 1st qtr 2nd qtr 3rd qtr 4th qtr Avg
North MT1 - Santos2
--US$/mt-- North MT1 - Paranaguá2
--US$/mt--
Truck 113.35 108.54 102.78 90.94 103.90 110.50 104.20 98.67 90.20 100.89
Ocean 44.83 38.07 34.00 30.50 36.85 47.22 41.13 36.00 32.50 39.21
Total transportation 158.18 146.61 136.78 121.44 140.75 157.72 145.33 134.67 122.70 140.11
Farm price 3 375.58 417.02 398.98 361.74 388.33 375.58 417.02 398.98 361.74 388.33
Landed cost 533.76 563.63 535.76 483.18 529.08 533.30 562.36 533.65 484.44 528.44
Transport % of landed cost 29.6 26.0 25.5 25.1 27.8 29.6 25.8 25.2 25.3 26.5
Southeast MT1 - Santos2
--US$/mt-- North Central PR1 - Paranaguá2
--US$/mt--
Truck 84.36 84.39 80.56 66.68 79.00 31.59 35.53 31.64 25.15 30.98
Ocean 44.83 38.07 34.00 30.50 36.85 47.22 41.13 36.00 32.50 39.21
Total transportation 129.19 122.46 114.56 97.18 115.85 78.81 76.66 67.64 57.65 70.19
Farm price 3 375.58 417.02 398.98 361.74 388.33 463.81 471.00 416.92 383.90 433.91
Landed cost 504.77 539.48 513.54 458.92 504.18 542.63 547.66 484.56 441.55 504.10
Transport % of landed cost 25.6 22.7 22.3 21.2 22.9 14.5 14.0 14.0 13.1 13.9
South GO1 - Santos2
--US$/mt-- Northwest RS1 - Rio Grande2
--US$/mt--
Truck 71.06 69.10 59.02 51.13 62.57 21.57 28.91 25.21 22.54 24.56
Ocean 44.83 38.07 34.00 30.50 36.85 44.83 38.75 34.00 30.50 37.02
Total transportation 115.89 107.17 93.02 81.63 99.42 66.40 67.66 59.21 53.04 61.58
Farm price 3 420.52 441.74 394.07 349.62 401.49 482.75 464.19 455.08 368.05 442.52
Landed cost 536.40 548.91 487.09 431.24 500.91 549.15 531.86 514.29 421.09 504.10
Transport % of landed cost 21.6 19.5 19.1 18.9 19.8 12.1 12.7 11.5 12.6 12.2
1Producing regions: RS = Rio Grande do Sul, MT= Mato Grosso, GO = Goiás, PR = Paraná 2Export ports3Source: Companhia Nacional de Abastecimento (CONAB) www.conab.gov.br; na: not available Source: ESALQ/ USP (University of São Paulo, Brazil) and USDA/AMS

Brazil Soybean Transportation 7 January 28, 2015
Table 4. Quarterly costs of transporting Brazilian soybeans to Hamburg, Germany-----------------------------------------------2014-----------------------------------------------
1st qtr 2nd qtr 3rd qtr 4th qtr Avg 1st qtr 2nd qtr 3rd qtr 4th qtr Avg
North MT1 - Santos2
--US$/mt-- North MT1 - Paranaguá2
--US$/mt--
Truck 113.35 108.54 102.78 90.94 103.90 110.50 104.20 98.67 90.20 100.89
Ocean 31.00 30.00 26.00 24.00 27.75 31.00 30.00 28.00 26.00 28.75
Total transportation 144.35 138.54 128.78 114.94 131.65 141.50 134.20 126.67 116.20 129.64
Farm price 3 375.58 417.02 398.98 361.74 388.33 375.58 417.02 398.98 361.74 388.33
Landed cost 519.93 555.56 527.76 476.68 519.98 517.08 551.23 525.65 477.94 517.98
Transport % of landed cost 27.8 24.9 24.4 24.1 25.3 27.4 24.3 24.1 24.3 25.0
Southeast MT1 - Santos2
--US$/mt-- North Central PR1 - Paranaguá2
--US$/mt--
Truck 84.36 84.39 80.56 66.68 79.00 31.59 35.53 31.64 25.15 30.98
Ocean 31.00 30.00 26.00 24.00 27.75 31.00 30.00 28.00 26.00 28.75
Total transportation 115.36 114.39 106.56 90.68 106.75 62.59 65.53 59.64 51.15 59.73
Farm price 3 375.58 417.02 398.98 361.74 388.33 463.81 471.00 416.92 383.90 433.91
Landed cost 490.94 531.41 505.54 452.42 495.08 526.41 536.53 476.56 435.05 493.64
Transport % of landed cost 23.5 21.5 21.1 20.0 21.5 11.9 12.2 12.5 11.8 12.1
South GO1 - Santos2
--US$/mt-- Northwest RS1 - Rio Grande2
--US$/mt--
Truck 71.06 69.10 59.02 51.13 62.57 21.57 28.91 25.21 22.54 24.56
Ocean 31.00 30.00 26.00 24.00 27.75 31.00 30.00 24.50 22.50 27.00
Total transportation 102.06 99.10 85.02 75.13 90.32 52.57 58.91 49.71 45.04 51.56
Farm price 3 420.52 441.74 394.07 349.62 401.49 482.75 464.19 455.08 368.05 442.52
Landed cost 522.57 540.84 479.09 424.74 491.81 535.32 523.11 504.79 413.09 494.08
Transport % of landed cost 19.5 18.3 17.7 17.7 18.3 9.8 11.3 9.8 10.9 10.5
1Producing regions: RS = Rio Grande do Sul, MT= Mato Grosso, GO = Goiás, PR = Paraná 2Export ports3Source: Companhia Nacional de Abastecimento (CONAB) www.conab.gov.br; na: not available Source: ESALQ/ USP (University of São Paulo, Brazil) and USDA/AMS
Brazil Soybean Transportation 8 January 28, 2015
Brazil Soybean Transportation Indicators
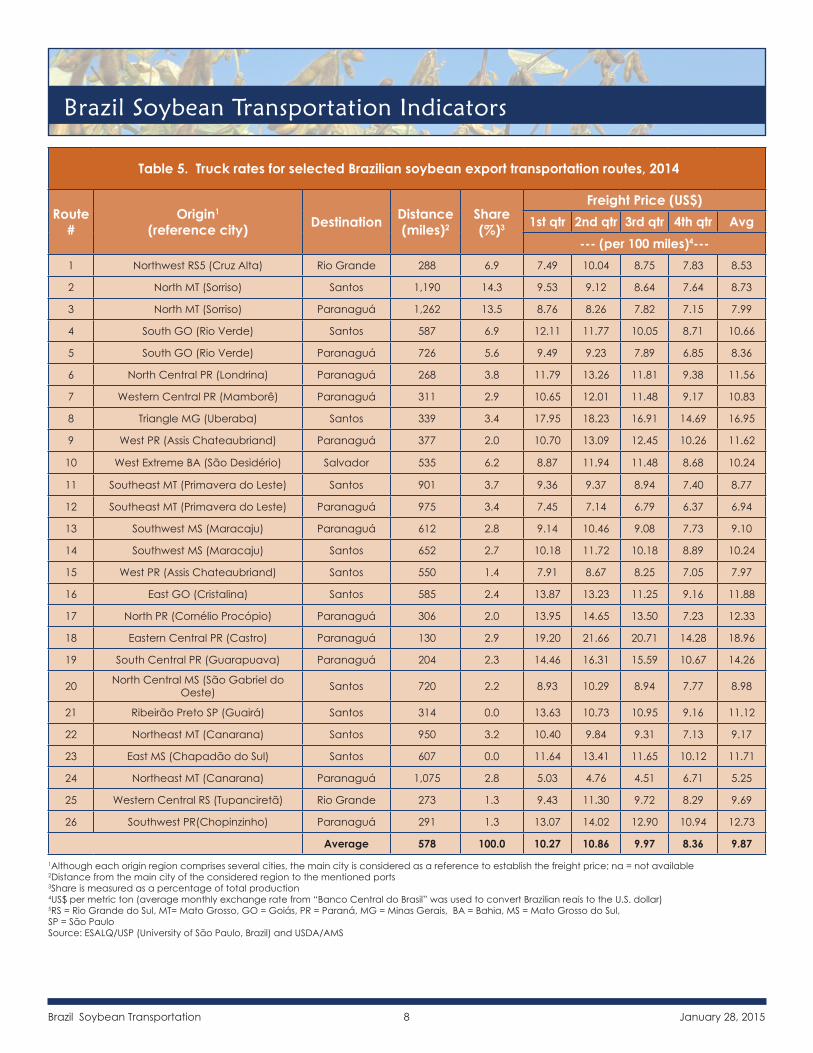
Table 5. Truck rates for selected Brazilian soybean export transportation routes, 2014
Route #
Origin1 (reference city) Destination Distance
(miles)2Share (%)3
Freight Price (US$)1st qtr 2nd qtr 3rd qtr 4th qtr Avg
--- (per 100 miles)4---1 Northwest RS5 (Cruz Alta) Rio Grande 288 6.9 7.49 10.04 8.75 7.83 8.53
2 North MT (Sorriso) Santos 1,190 14.3 9.53 9.12 8.64 7.64 8.73
3 North MT (Sorriso) Paranaguá 1,262 13.5 8.76 8.26 7.82 7.15 7.99
4 South GO (Rio Verde) Santos 587 6.9 12.11 11.77 10.05 8.71 10.66
5 South GO (Rio Verde) Paranaguá 726 5.6 9.49 9.23 7.89 6.85 8.36
6 North Central PR (Londrina) Paranaguá 268 3.8 11.79 13.26 11.81 9.38 11.56
7 Western Central PR (Mamborê) Paranaguá 311 2.9 10.65 12.01 11.48 9.17 10.83
8 Triangle MG (Uberaba) Santos 339 3.4 17.95 18.23 16.91 14.69 16.95
9 West PR (Assis Chateaubriand) Paranaguá 377 2.0 10.70 13.09 12.45 10.26 11.62
10 West Extreme BA (São Desidério) Salvador 535 6.2 8.87 11.94 11.48 8.68 10.24
11 Southeast MT (Primavera do Leste) Santos 901 3.7 9.36 9.37 8.94 7.40 8.77
12 Southeast MT (Primavera do Leste) Paranaguá 975 3.4 7.45 7.14 6.79 6.37 6.94
13 Southwest MS (Maracaju) Paranaguá 612 2.8 9.14 10.46 9.08 7.73 9.10
14 Southwest MS (Maracaju) Santos 652 2.7 10.18 11.72 10.18 8.89 10.24
15 West PR (Assis Chateaubriand) Santos 550 1.4 7.91 8.67 8.25 7.05 7.97
16 East GO (Cristalina) Santos 585 2.4 13.87 13.23 11.25 9.16 11.88
17 North PR (Cornélio Procópio) Paranaguá 306 2.0 13.95 14.65 13.50 7.23 12.33
18 Eastern Central PR (Castro) Paranaguá 130 2.9 19.20 21.66 20.71 14.28 18.96
19 South Central PR (Guarapuava) Paranaguá 204 2.3 14.46 16.31 15.59 10.67 14.26
20 North Central MS (São Gabriel do Oeste) Santos 720 2.2 8.93 10.29 8.94 7.77 8.98
21 Ribeirão Preto SP (Guairá) Santos 314 0.0 13.63 10.73 10.95 9.16 11.12
22 Northeast MT (Canarana) Santos 950 3.2 10.40 9.84 9.31 7.13 9.17
23 East MS (Chapadão do Sul) Santos 607 0.0 11.64 13.41 11.65 10.12 11.71
24 Northeast MT (Canarana) Paranaguá 1,075 2.8 5.03 4.76 4.51 6.71 5.25
25 Western Central RS (Tupanciretã) Rio Grande 273 1.3 9.43 11.30 9.72 8.29 9.69
26 Southwest PR(Chopinzinho) Paranaguá 291 1.3 13.07 14.02 12.90 10.94 12.73
Average 578 100.0 10.27 10.86 9.97 8.36 9.87
1Although each origin region comprises several cities, the main city is considered as a reference to establish the freight price; na = not available2Distance from the main city of the considered region to the mentioned ports3Share is measured as a percentage of total production4US$ per metric ton (average monthly exchange rate from “Banco Central do Brasil” was used to convert Brazilian reais to the U.S. dollar)5RS = Rio Grande do Sul, MT= Mato Grosso, GO = Goiás, PR = Paraná, MG = Minas Gerais, BA = Bahia, MS = Mato Grosso do Sul, SP = São PauloSource: ESALQ/USP (University of São Paulo, Brazil) and USDA/AMS
Brazil Soybean Transportation 9 January 28, 2015
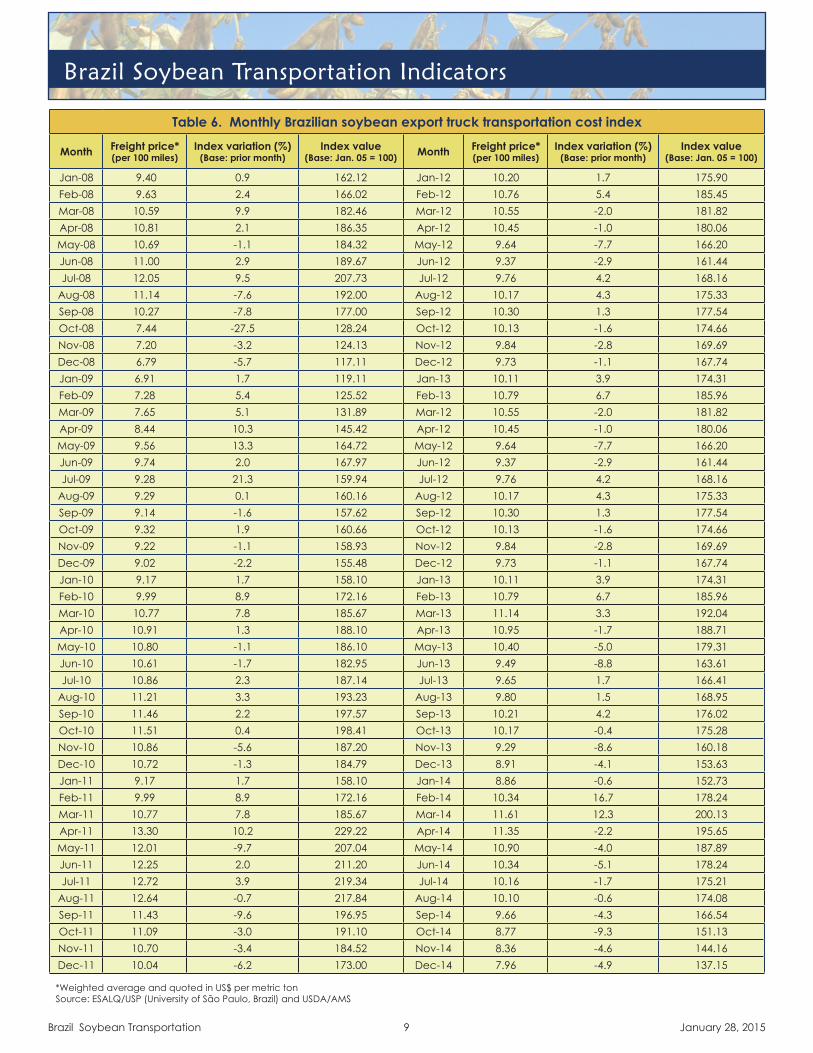
Table 6. Monthly Brazilian soybean export truck transportation cost index
Month Freight price* (per 100 miles)
Index variation (%) (Base: prior month)
Index value (Base: Jan. 05 = 100) Month Freight price*
(per 100 miles)Index variation (%)
(Base: prior month)Index value
(Base: Jan. 05 = 100)
Jan-08 9.40 0.9 162.12 Jan-12 10.20 1.7 175.90Feb-08 9.63 2.4 166.02 Feb-12 10.76 5.4 185.45Mar-08 10.59 9.9 182.46 Mar-12 10.55 -2.0 181.82Apr-08 10.81 2.1 186.35 Apr-12 10.45 -1.0 180.06May-08 10.69 -1.1 184.32 May-12 9.64 -7.7 166.20Jun-08 11.00 2.9 189.67 Jun-12 9.37 -2.9 161.44Jul-08 12.05 9.5 207.73 Jul-12 9.76 4.2 168.16
Aug-08 11.14 -7.6 192.00 Aug-12 10.17 4.3 175.33Sep-08 10.27 -7.8 177.00 Sep-12 10.30 1.3 177.54Oct-08 7.44 -27.5 128.24 Oct-12 10.13 -1.6 174.66Nov-08 7.20 -3.2 124.13 Nov-12 9.84 -2.8 169.69Dec-08 6.79 -5.7 117.11 Dec-12 9.73 -1.1 167.74Jan-09 6.91 1.7 119.11 Jan-13 10.11 3.9 174.31Feb-09 7.28 5.4 125.52 Feb-13 10.79 6.7 185.96Mar-09 7.65 5.1 131.89 Mar-12 10.55 -2.0 181.82Apr-09 8.44 10.3 145.42 Apr-12 10.45 -1.0 180.06May-09 9.56 13.3 164.72 May-12 9.64 -7.7 166.20Jun-09 9.74 2.0 167.97 Jun-12 9.37 -2.9 161.44Jul-09 9.28 21.3 159.94 Jul-12 9.76 4.2 168.16
Aug-09 9.29 0.1 160.16 Aug-12 10.17 4.3 175.33Sep-09 9.14 -1.6 157.62 Sep-12 10.30 1.3 177.54Oct-09 9.32 1.9 160.66 Oct-12 10.13 -1.6 174.66Nov-09 9.22 -1.1 158.93 Nov-12 9.84 -2.8 169.69Dec-09 9.02 -2.2 155.48 Dec-12 9.73 -1.1 167.74Jan-10 9.17 1.7 158.10 Jan-13 10.11 3.9 174.31Feb-10 9.99 8.9 172.16 Feb-13 10.79 6.7 185.96Mar-10 10.77 7.8 185.67 Mar-13 11.14 3.3 192.04Apr-10 10.91 1.3 188.10 Apr-13 10.95 -1.7 188.71May-10 10.80 -1.1 186.10 May-13 10.40 -5.0 179.31Jun-10 10.61 -1.7 182.95 Jun-13 9.49 -8.8 163.61Jul-10 10.86 2.3 187.14 Jul-13 9.65 1.7 166.41
Aug-10 11.21 3.3 193.23 Aug-13 9.80 1.5 168.95Sep-10 11.46 2.2 197.57 Sep-13 10.21 4.2 176.02Oct-10 11.51 0.4 198.41 Oct-13 10.17 -0.4 175.28Nov-10 10.86 -5.6 187.20 Nov-13 9.29 -8.6 160.18Dec-10 10.72 -1.3 184.79 Dec-13 8.91 -4.1 153.63Jan-11 9.17 1.7 158.10 Jan-14 8.86 -0.6 152.73Feb-11 9.99 8.9 172.16 Feb-14 10.34 16.7 178.24Mar-11 10.77 7.8 185.67 Mar-14 11.61 12.3 200.13Apr-11 13.30 10.2 229.22 Apr-14 11.35 -2.2 195.65May-11 12.01 -9.7 207.04 May-14 10.90 -4.0 187.89Jun-11 12.25 2.0 211.20 Jun-14 10.34 -5.1 178.24Jul-11 12.72 3.9 219.34 Jul-14 10.16 -1.7 175.21
Aug-11 12.64 -0.7 217.84 Aug-14 10.10 -0.6 174.08Sep-11 11.43 -9.6 196.95 Sep-14 9.66 -4.3 166.54Oct-11 11.09 -3.0 191.10 Oct-14 8.77 -9.3 151.13Nov-11 10.70 -3.4 184.52 Nov-14 8.36 -4.6 144.16Dec-11 10.04 -6.2 173.00 Dec-14 7.96 -4.9 137.15 *Weighted average and quoted in US$ per metric ton Source: ESALQ/USP (University of São Paulo, Brazil) and USDA/AMS
Brazil Soybean Transportation Indicators
Brazil Soybean Transportation 10 January 28, 2015
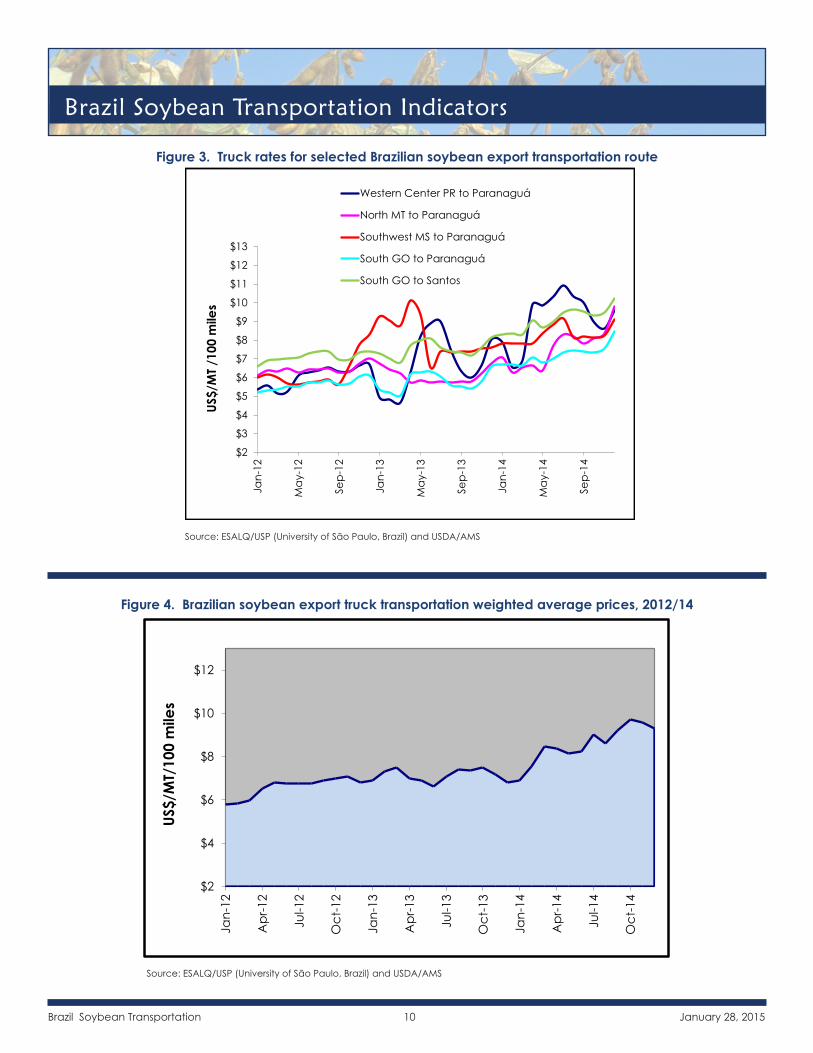
Figure 4. Brazilian soybean export truck transportation weighted average prices, 2012/14
Figure 3. Truck rates for selected Brazilian soybean export transportation route
Source: ESALQ/USP (University of São Paulo, Brazil) and USDA/AMS
Source: ESALQ/USP (University of São Paulo, Brazil) and USDA/AMS
Brazil Soybean Transportation Indicators
$2
$3
$4
$5
$6
$7
$8
$9
$10
$11
$12
$13Ja
n-12
May
-12
Sep-
12
Jan-
13
May
-13
Sep-
13
Jan-
14
May
-14
Sep-
14
US$/
MT /
100
mile
sWestern Center PR to Paranaguá
North MT to Paranaguá
Southwest MS to Paranaguá
South GO to Paranaguá
South GO to Santos
$2
$4
$6
$8
$10
$12
Jan-
12
Apr
-12
Jul-1
2
Oct
-12
Jan-
13
Apr
-13
Jul-1
3
Oct
-13
Jan-
14
Apr
-14
Jul-1
4
Oct
-14
US$/
MT/
100
mile
s
Brazil Soybean Transportation 11 January 28, 2015
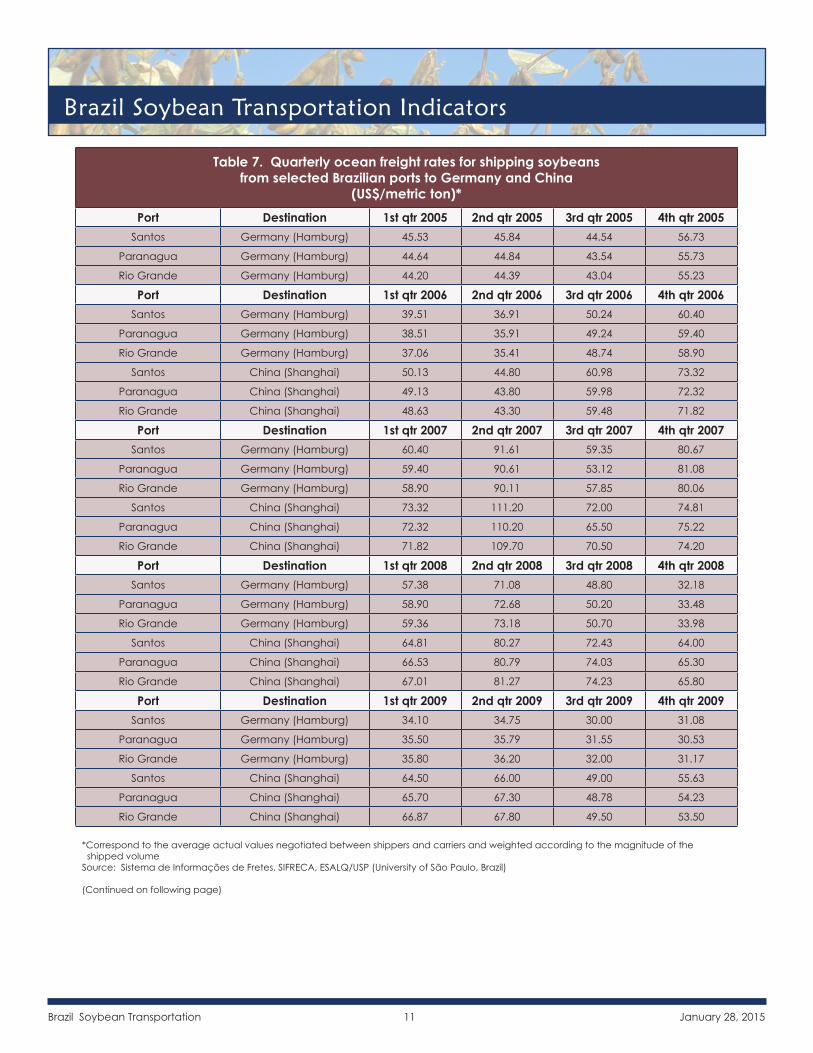
Table 7. Quarterly ocean freight rates for shipping soybeans from selected Brazilian ports to Germany and China
(US$/metric ton)*Port Destination 1st qtr 2005 2nd qtr 2005 3rd qtr 2005 4th qtr 2005
Santos Germany (Hamburg) 45.53 45.84 44.54 56.73
Paranagua Germany (Hamburg) 44.64 44.84 43.54 55.73
Rio Grande Germany (Hamburg) 44.20 44.39 43.04 55.23
Port Destination 1st qtr 2006 2nd qtr 2006 3rd qtr 2006 4th qtr 2006Santos Germany (Hamburg) 39.51 36.91 50.24 60.40
Paranagua Germany (Hamburg) 38.51 35.91 49.24 59.40
Rio Grande Germany (Hamburg) 37.06 35.41 48.74 58.90
Santos China (Shanghai) 50.13 44.80 60.98 73.32
Paranagua China (Shanghai) 49.13 43.80 59.98 72.32
Rio Grande China (Shanghai) 48.63 43.30 59.48 71.82
Port Destination 1st qtr 2007 2nd qtr 2007 3rd qtr 2007 4th qtr 2007Santos Germany (Hamburg) 60.40 91.61 59.35 80.67
Paranagua Germany (Hamburg) 59.40 90.61 53.12 81.08
Rio Grande Germany (Hamburg) 58.90 90.11 57.85 80.06
Santos China (Shanghai) 73.32 111.20 72.00 74.81
Paranagua China (Shanghai) 72.32 110.20 65.50 75.22
Rio Grande China (Shanghai) 71.82 109.70 70.50 74.20
Port Destination 1st qtr 2008 2nd qtr 2008 3rd qtr 2008 4th qtr 2008Santos Germany (Hamburg) 57.38 71.08 48.80 32.18
Paranagua Germany (Hamburg) 58.90 72.68 50.20 33.48
Rio Grande Germany (Hamburg) 59.36 73.18 50.70 33.98
Santos China (Shanghai) 64.81 80.27 72.43 64.00
Paranagua China (Shanghai) 66.53 80.79 74.03 65.30
Rio Grande China (Shanghai) 67.01 81.27 74.23 65.80
Port Destination 1st qtr 2009 2nd qtr 2009 3rd qtr 2009 4th qtr 2009Santos Germany (Hamburg) 34.10 34.75 30.00 31.08
Paranagua Germany (Hamburg) 35.50 35.79 31.55 30.53
Rio Grande Germany (Hamburg) 35.80 36.20 32.00 31.17
Santos China (Shanghai) 64.50 66.00 49.00 55.63
Paranagua China (Shanghai) 65.70 67.30 48.78 54.23
Rio Grande China (Shanghai) 66.87 67.80 49.50 53.50
*Correspond to the average actual values negotiated between shippers and carriers and weighted according to the magnitude of the shipped volumeSource: Sistema de Informações de Fretes, SIFRECA, ESALQ/USP (University of São Paulo, Brazil) (Continued on following page)
Brazil Soybean Transportation Indicators
Brazil Soybean Transportation 12 January 28, 2015
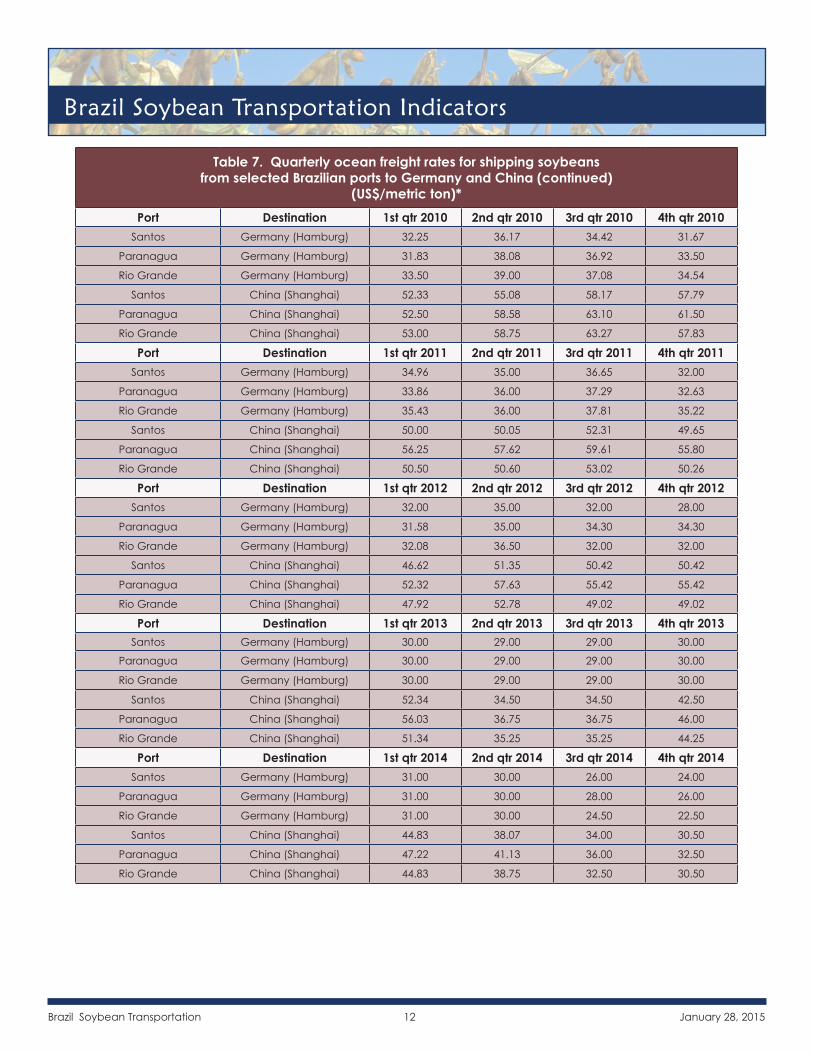
Table 7. Quarterly ocean freight rates for shipping soybeans from selected Brazilian ports to Germany and China (continued)
(US$/metric ton)*Port Destination 1st qtr 2010 2nd qtr 2010 3rd qtr 2010 4th qtr 2010
Santos Germany (Hamburg) 32.25 36.17 34.42 31.67
Paranagua Germany (Hamburg) 31.83 38.08 36.92 33.50
Rio Grande Germany (Hamburg) 33.50 39.00 37.08 34.54
Santos China (Shanghai) 52.33 55.08 58.17 57.79
Paranagua China (Shanghai) 52.50 58.58 63.10 61.50
Rio Grande China (Shanghai) 53.00 58.75 63.27 57.83
Port Destination 1st qtr 2011 2nd qtr 2011 3rd qtr 2011 4th qtr 2011Santos Germany (Hamburg) 34.96 35.00 36.65 32.00
Paranagua Germany (Hamburg) 33.86 36.00 37.29 32.63
Rio Grande Germany (Hamburg) 35.43 36.00 37.81 35.22
Santos China (Shanghai) 50.00 50.05 52.31 49.65
Paranagua China (Shanghai) 56.25 57.62 59.61 55.80
Rio Grande China (Shanghai) 50.50 50.60 53.02 50.26
Port Destination 1st qtr 2012 2nd qtr 2012 3rd qtr 2012 4th qtr 2012Santos Germany (Hamburg) 32.00 35.00 32.00 28.00
Paranagua Germany (Hamburg) 31.58 35.00 34.30 34.30
Rio Grande Germany (Hamburg) 32.08 36.50 32.00 32.00
Santos China (Shanghai) 46.62 51.35 50.42 50.42
Paranagua China (Shanghai) 52.32 57.63 55.42 55.42
Rio Grande China (Shanghai) 47.92 52.78 49.02 49.02
Port Destination 1st qtr 2013 2nd qtr 2013 3rd qtr 2013 4th qtr 2013Santos Germany (Hamburg) 30.00 29.00 29.00 30.00
Paranagua Germany (Hamburg) 30.00 29.00 29.00 30.00
Rio Grande Germany (Hamburg) 30.00 29.00 29.00 30.00
Santos China (Shanghai) 52.34 34.50 34.50 42.50
Paranagua China (Shanghai) 56.03 36.75 36.75 46.00
Rio Grande China (Shanghai) 51.34 35.25 35.25 44.25
Port Destination 1st qtr 2014 2nd qtr 2014 3rd qtr 2014 4th qtr 2014Santos Germany (Hamburg) 31.00 30.00 26.00 24.00
Paranagua Germany (Hamburg) 31.00 30.00 28.00 26.00
Rio Grande Germany (Hamburg) 31.00 30.00 24.50 22.50
Santos China (Shanghai) 44.83 38.07 34.00 30.50
Paranagua China (Shanghai) 47.22 41.13 36.00 32.50
Rio Grande China (Shanghai) 44.83 38.75 32.50 30.50
Brazil Soybean Transportation Indicators

Brazil Soybean Transportation 13 January 28, 2015
Contact Information:
Delmy L. SalinSenior Economist, Project Manager [email protected] (202) 720-0833
Jessica E. LaddGraphic Analyst [email protected] (202) 720-6494
Data Sets:
♦ Figure 1: Brazilian soybean export truck cost index
♦ Figure 3: Truck rates for select Brazilian soybean export transportation route (XLS)
♦ Figure 4: Brazilian soybean export truck transportation weighted average prices, 2012/14 (XLS)
♦ Table 1: Cost of transporting soybeans from Brazil to Shanghai, China (XLS)
♦ Table 2: Cost of transporting soybeans from Brazil to Hamburg, Germany (XLS)
♦ Table 3: Quarterly costs of transporting Brazilian soybeans to Shanghai, China (XLS)
♦ Table 4: Quarterly costs of transporting Brazilian soybeans to Hamburg, Germany (XLS)
♦ Table 5: Truck rates for selected Brazilian soybean export transportation routes, 2014 (XLS)
♦ Table 6: Monthly Brazilian soybean export truck transportation cost index (XLS)
♦ Table 7: Quarterly ocean freight rates for shipping soybeans from selected (XLS)
Subscription Information: Send relevant information to [email protected] for an electronic copy.
Related Websites:
♦ Soybean Transportation Guide: Brazil 2013 (PDF)
♦ Prior Articles: Brazil Soybean Transportation, November 19, 2014 (PDF)
♦ Related Articles: Grain Transportation Report, December 4, 2014 (PDF)
♦ U.S. Corn, Soybean, and Wheat Quarterly Transportation Cost Indicator Reports
Preferred CitationSalin, Delmy. Brazil Soybean Transportation Indicator Reports. January 2015. U.S. Department of Agriculture, Agricultural Marketing Service. Web. <http://dx.doi.org/10.9752/TS052.01-2015>
The U.S. Department of Agriculture (USDA) prohibits discrimination in all its programs and activities on the basis of race, color, national origin, age, disability, and where applicable, sex, marital status, familial status, parental status, religion, sexual orientation, genetic information, political beliefs, reprisal, or because all or part of an individual’s income is derived from any public assistance program (Not all prohibited bases apply to all programs.) Persons with disabilities who require alternative means for communication of program information (Braille, large print, audiotape, etc.) should contact USDA’s TARGET Center at (202) 720-2600 (voice and TDD). To file a complaint of discrimination, write to USDA, Director, Office of Civil Rights, 1400 Independence Avenue, S.W., Washington, D.C. 20250-9410, or call (800) 795-3272 (voice) or (202) 720-6382 (TDD). USDA is an equal opportunity provider and employer.