Embed Size (px)
Citation preview

Brian Bell and John Van Reenen Bankers and their bonuses Article (Published version) (Refereed) Original citation: Bell, Brian and Van Reenen, John (2014) Bankers and their bonuses. The Economic Journal, 124 (574). F1-F21. ISSN 0013-0133 DOI: 10.1111/ecoj.12101 © 2013 The Authors, published by John Wiley & Sons Ltd on behalf of Royal Economic Society This is an open access article under the terms of the Creative Commons Attribution License 3.0, which permits use, distribution and reproduction in any medium, provided the original work is properly cited. This version available at: http://eprints.lse.ac.uk/56057/ Available in LSE Research Online: August 2014 LSE has developed LSE Research Online so that users may access research output of the School. Copyright © and Moral Rights for the papers on this site are retained by the individual authors and/or other copyright owners. Users may download and/or print one copy of any article(s) in LSE Research Online to facilitate their private study or for non-commercial research. You may not engage in further distribution of the material or use it for any profit-making activities or any commercial gain. You may freely distribute the URL (http://eprints.lse.ac.uk) of the LSE Research Online website.
BANKERS AND THEIR BONUSES*
Brian Bell and John Van Reenen
We analyse the role of financial sector workers in the huge rise of the share of earnings going to thoseat the very top of the pay distribution in the UK. Rising bankers’ bonuses accounted for two-thirds ofthe increase in the share of the top 1% after 1999. Surprisingly, bankers’ share of earnings showed nodecline between the peak of the financial boom in 2007 and 2011, three years after the global crisisbegan. Nor did bankers’ relative employment position deteriorate over this period. We discussproposed policy responses such as transparency, bonus ‘clawbacks’, numerical bonus targets and tax.
The financial crisis that began in the summer of 2007 focused public attention on thehigh pay levels of employees in the financial intermediation sector (henceforth,‘bankers’.1) Even as some financial institutions collapsed and others were bailed out orgiven wide-ranging taxpayer guarantees,2 bankers seemed to be reaping enormousrewards and suffering very little of the downside costs. This is an area where there ismuch heat from moral outrage and insufficient attention to facts, so the main aim ofthis study is to provide some objective evidence on the pay of bankers.
We begin by providing a historical context within which to view the recent evolutionof income and wage inequality. The comprehensive work of Atkinson et al. (2011)shows how the share of income going to those at the top of the distribution hasaccelerated, especially for the English-speaking nations, and reached levels last seen inthe interwar period. For the UK, in the decade preceding 2007, the top percentileincreased their share of total income by 3.4 percentage points to reach just over 15% oftotal income. Over half of this gain went to the top 0.1% of tax payers.
We document how changes at the top have been heavily skewed towards bankers byusing non-top coded wage and income data from several sources that allow us to
*Corresponding author: Brian Bell, Department of Economics, University of Oxford, Manor RoadBuilding, Manor Road, Oxford OX1 3UQ, UK. Email: [email protected].
This is a revised version of the unpublished working paper by Bell and Van Reenen (2010). We are gratefulto the Editor, an anonymous referee, Tony Atkinson, Tim Besley, Luis Garicano, Sam Harrington and SteveMachin for many helpful comments. This work contains statistical data from ONS which is Crown copyrightand reproduced with the permission of the Controller of HMSO and Queen’s Printer for Scotland. The useof the ONS statistical data in this work does not imply the endorsement of the ONS in relation to theinterpretation or analysis of the statistical data. This work uses research data sets which may not exactlyreproduce National Statistics aggregates. This research was funded by the Economic and Social ResearchCouncil at the Centre for Economic Performance.
This is an open access article under the terms of the Creative Commons Attribution License, which permitsuse, distribution and reproduction in any medium, provided the original work is properly cited.
Correction Note: This article was first published online on the 29th of October 2013, under a subscriptionpublication licence. The article has since been made OnlineOpen, and the copyright line and licencestatement was therefore updated in June 2014.
1 Strictly speaking, other than bankers this also includes workers in the fund management and insurancebusinesses. Obviously this includes many workers who are not in either retail or investment banking and workoutside of the City of London. We discuss this in more detail later in the study.
2 Haldane (2010) suggests that the cost of the UK and US bailouts is around 1% of GDP (£20 billion in theBritish case).
[ F1 ]
TheEconomic Journal, 124 (February), F1–F21.Doi: 10.1111/ecoj.12101©2013TheAuthors. TheEconomic Journalpublishedby JohnWiley&SonsLtd onbehalf
of Royal Economic Society. Published by John Wiley & Sons, 9600 Garsington Road, Oxford OX4 2DQ, UK and 350 Main Street, Malden, MA 02148, USA.

explore the sectoral distribution of gains across the entire distribution. Since 1999,somewhere between two-thirds and three-quarters of the total income gain for those inthe top 1% has gone to bankers, even though they account for only one-third of thetop percentile of workers. Furthermore, annual salaries have hardly changed for thosein the top percentile over this period: their entire gain is due to increased bonuses.3
Even more remarkably, while the crisis years have seen a fall in the share of incomegoing to the top percentile, top bankers’ pay had fully recovered by 2011 to the point atwhich they were taking slightly more of total income than they were before the crisisbegan. In spite of the turmoil, we show that the probability that workers in the financialsector remained in employment was the same as for workers in other sectors, althoughthey were less likely to be working for the same firm. This is true for financial workersgenerally, not just those at the top of the wage distribution. If anything, we suspect weare now substantially underestimating the share of income at the top going to bankers.Examining pay disclosures on senior employees in banks that are now required toprovide more extensive remuneration information suggests that a significant fractionof such pay is in forms that standard data sets would not capture (e.g. long-term equityincentive plans).4
In terms of policy, we begin by considering whether there is really any ‘problem’ tobe addressed. If bankers are paid in a competitive labour market and simply rewardedfor their talent, there seems little reason for government intervention, at least onefficiency grounds. However, there seems to be substantial evidence of rents within thesector – a result of imperfect competition or arising from the implicit and explicitguarantees and subsidies that the sector receives from the government due to the ‘too-big-to-fail’ problem. We discuss various policy options that seek to either remove thebasis for these rents or to tax them ex post. Finally, we note that on equity grounds,policy may seek to reduce the post-tax income taken by those in the upper echelons ofthe income distribution – which implicitly targets bankers given their prominenceamong high-earning workers. This has primarily taken the form of higher marginal taxrates.
While we document a strong rise in bankers’ pay over the last decade and argue thatat least some of this increased pay represents rents, there is a broader question as towhether other factors have contributed to a rising wage premium in finance. While afull discussion of such forces is outside the scope of this study, we highlight two factorsthat are likely to be important. First, there has been a substantial rise in the capitalavailable to bankers, which has then been magnified by increased leverage. Forexample, improved information technology, globalisation and increased firm size havemeant that the assets under management of a trader are far larger than 20 years ago.To the extent that such increases in capital can be managed with no additionalworkers, the model of Gabaix and Landier (2008) predicts a ‘scaling’ effect that wouldincrease wages. Second, Philippon and Reshef (2012) argue that the wave of
3 In the Annual Survey of Hours and Earnings (ASHE) data that we use in Section 1, bonuses are definedas all payments made in cash during the year including profit sharing, productivity performance and otherbonus or incentive pay, piecework and commission. It does not include share-based bonuses – see Section 2for a discussion.
4 See Bell and Van Reenen (2012, 2013) for an analysis of the importance of these plans for CEOs.
© 2013 The Authors.The Economic Journal published by John Wiley & Sons Ltd on behalf of Royal Economic Society.
F2 T H E E CONOM I C J O U RN A L [ F E B R U A R Y
deregulation that occurred in finance since the start of the 1980s enabled skilledworkers in finance to operate freely and introduce new and complex financial products– which were profitable to the bank if not necessarily to society.
Finally, it is worth noting that both Kaplan and Rauh (2010) and Philippon andReshef (2012) highlight that not all workers in the US financial sector witnessedsubstantial rises in pay. The gains have been primarily focused within investmentbanking, securities trading, hedge funds, private equity etc. Credit intermediation andinsurance have not seen the same kind of trends. Our results for the UK are consistentwith this finding, as the vast majority of bankers in the top percentile in our data are inthe former type of firms.
The structure of this article is as follows. In Section 1 we describe changes in the paystructure, in Section 2 we remark on recent public disclosure of bankers pay, inSection 3 we discuss policy and Section 4 concludes.
1. Extreme Wage Inequality and Bankers
1.1. Long-run Income Inequality
It is well known that the UK distribution of income has widened considerably over thecourse of the last three decades. For example, in 1979, a man at the 90th percentileearned 2.5 times more than a man at the 10th percentile but in 2009 he earned 3.7times more (Machin and Van Reenen, 2010). More recently, focus has switched torising inequality driven by those at the very top of the income distribution. Standardanalysis of wage inequality tends to focus on measures such as the 90th–10th percentilegap, which explicitly ignores the extremes of the income distribution. But as a series ofrecent studies have shown, much of the action over the last few decades has actuallyoccurred within the top decile of income earners (Atkinson and Piketty, 2010).
To illustrate this, we use the data from Atkinson et al. (2011).5 Figure 1 plots theshare of total income (including investment income) going to the top 1% and top0.1% of income earners in the UK and US. A broadly similar pattern emerges for bothcountries. The rich took a large share of income in the years between the First WorldWar and the Great Depression. There then followed a sharp decline, which continueduntil the end of the 1970s when the well known sustained rise in inequality began. Thiswas only interrupted by the recent financial crisis. For example, in the UK, the share ofthe top 1% fell from 19.6% in 1919 to 5.7% in 1978 before rising to 15.4% in 2007.According to Figure 1, the shares of the rich were broadly similar in the UK and USuntil the mid-1950s, after which the share of American rich flattened out, whereas theirshare in the UK continued to fall. One key difference between the top percentile in theinterwar period and today is that the rich used to receive a substantial fraction of theirincome from investment returns, whereas today most of the income accruing to the toppercentile comes in the form of wage income. For example, in 1937, 23% of the toppercentiles income came from labour income, whereas by 2000, this had risen to 65%(Atkinson, 2007).
5 Updated from the World Top Incomes Database: http://g-mond.parisschoolofeconomics.eu/topincomes/.
© 2013 The Authors.The Economic Journal published by John Wiley & Sons Ltd on behalf of Royal Economic Society.
2014] B A N K E R S A N D TH E I R B ONU S E S F3

By disaggregating the top decile we can see how uneven the gains have been evenwithin this high-earning group. Table 1 reports the share of total income taken by thetop 1%, the next four percentiles (i.e. the top 5% excluding the top 1%) and thesecond vingtile (i.e. the sixth through tenth percentiles) between 1979 and 2009. Overthis 30-year period, the top decile increased their share of total income by 12.1percentage points (from 28.4% to 40.4%). Fully two-thirds of this increased share (8%)went solely to those in the top percentile, while only 0.9% went to those in the secondvingtile – even though there are five times as many people in this group. This againhighlights how we miss a key aspect of rising inequality when we focus on standardmeasures such as the 90–10 differential.
1.2. Extreme Wage Inequality in the Last Decade
We now focus on the last decade where we have richer individual-level data. Our maindata set is ASHE (previously called the New Earnings Survey). ASHE is a random sampleof 1% of employees based on the final two digits of an individual’s National Insurance(same as US Social Security) number. All the data are provided by the employer directfrom their payroll system and so is considered highly reliable. There is no top coding ofwage data, which is the key source of difficulty for most analysis of wage inequality at the
0
5
10
15
20
25
30
1918
1921
1924
1927
1930
1933
1936
1939
1942
1945
1948
1951
1954
1957
1960
1963
1966
1969
1972
1975
1978
1981
1984
1987
1990
1993
1996
1999
2002
2005
2008
Perc
entil
e Sh
are
UK Top 1% UK Top 0.1% US Top 1% US Top 0.1%
Fig. 1. Top Percentile Income Shares in the UK and US, 1918–2010Note. Estimates shares of total income accruing to top 1% and 0.1% of all individuals in selectedyears from tax return data.Source. World Top Incomes Database http://g-mond.parisschoolofeconomics.eu/topincomes/
© 2013 The Authors.The Economic Journal published by John Wiley & Sons Ltd on behalf of Royal Economic Society.
F4 T H E E CONOM I C J O U RN A L [ F E B R U A R Y

top of the distribution (e.g. the US Current Population Survey). We examine two wagemeasures. First, the gross weekly wage is collected with reference to a specified surveyweek (always in April). This is the measure commonly used in the analysis of wageinequality trends in the UK (Machin and Van Reenen, 2010) and is consistentlymeasured back to the early 1970s. However, a weekly wage misses any remuneration thatis made at a lower frequency than the current pay period. In particular, incentive andbonus paymentsmade in infrequent lump sums (e.g. a year-end bonus) will in general bemissed. Since 1998, ASHE has also collected the gross annual wage. This measure is thetotal paymentmade to an employee over the proceeding 12months and captures all cashbonus and incentive payments. We exclude all wage data affected by absence, and focuson full-time adult employees who have been in the same job for at least 12 months.6
Table 1
Shares of Total Income, 1979–2009
Top 1% Next 2–5%Next 6–10%
(second vingtile) Top 10%
1979 5.9 11.6 10.8 28.419801981 6.7 12.8 11.6 31.01982 6.9 12.8 11.6 31.21983 6.8 13.2 11.8 31.81984 7.2 13.5 11.9 32.51985 7.4 13.4 11.9 32.71986 7.6 13.5 11.9 32.91987 7.8 13.6 11.9 33.31988 8.6 13.7 11.8 34.21989 8.7 13.8 11.6 34.21990 9.8 14.6 12.5 36.91991 10.3 14.8 12.5 37.71992 9.9 15.0 12.8 37.61993 10.4 15.2 12.8 38.31994 10.6 15.0 12.7 38.31995 10.8 15.1 12.7 38.51996 11.9 15.0 12.5 39.31997 12.1 14.7 12.2 38.91998 12.5 14.9 12.1 39.51999 12.5 14.7 11.8 39.02000 12.7 14.4 11.4 38.42001 12.7 14.8 11.8 39.32002 12.3 14.7 11.7 38.72003 12.1 14.3 11.4 37.82004 12.9 14.8 11.9 39.52005 14.3 15.3 12.1 41.62006 14.8 15.3 11.9 42.02007 15.4 15.3 11.8 42.620082009 13.9 14.8 11.7 40.41979–2009 Change 8.0 3.2 0.9 12.1
Note. 1980 and 2008 data were not released by HMRC.Source. World Top Incomes Database http://g-mond.parisschoolofeconomics.eu/topincomes/.
6 This last criterion ensures that the annual wage does not relate to a partial work year. Nothing in whatfollows is dependent on these selection criteria. Results are available on request from authors.
© 2013 The Authors.The Economic Journal published by John Wiley & Sons Ltd on behalf of Royal Economic Society.
2014] B A N K E R S A N D TH E I R B ONU S E S F5

It is important to bear in mind the differences between such wage measures and themore comprehensive measures of income derived from tax data in Table 1 discussedabove. First, the wage data exclude self-employment and investment income.7 Second,the total wage bill measure we use only covers those in ASHE. Importantly, thisgenerally excludes workers whose earnings are so low they pay no tax or nationalinsurance. In contrast, the income share measures from the tax data are adjusted toinclude all those below the income tax threshold including those who are not workingat all (e.g. unemployed, inactive and retired).8 Thus, we are likely to understate theshare of total wages going to the top percentiles – and indeed the reported levels arelower than those in Atkinson et al. (2011). A full discussion of these issues is providedin the online Appendix.
Table 2 reports the share of total wages that accrue to the top percentiles of the wagedistribution using these two alternative measures of pay. Focusing first on ASHE weeklywages, we see that the top decile increased its share of the wage bill by 5.9 percentagepoints between 1975 and 2008 (last column of panel (a)). Most of this gain was dividedfairly evenly between the top percentile and those in the next four percentiles (i.e. the top
Table 2
Aggregate Changes in Total Wage Bill Share
Top 1% Next 2–5%Next 6–10%
(second vingtile) Top 10%
(a) ASHE weekly wages1975 3.4 8.2 8.2 19.81999 5.2 10.1 9.0 24.32008 5.6 10.8 9.3 25.72011 5.4 10.7 9.3 25.4
Change 1975–2008 2.2 2.6 1.1 5.9Change 1999–2008 0.4 0.7 0.3 1.4Change 2008–11 �0.2 �0.1 0.0 �0.3
(b) ASHE annual wages1999 7.1 10.1 8.7 25.92008 8.9 11.3 9.1 29.22011 8.4 11.1 9.0 28.5
Change 1999–2008 1.8 1.2 0.3 3.3Change 2008–11 �0.5 �0.2 �0.1 �0.7
(c) Tax returns annual wages1975 4.8 9.1 8.5 22.41999 8.4 11.1 9.3 28.92008 10.9 12.1 9.5 32.5
Change 1975–2008 6.1 3.0 1.0 10.1Change 1999–2008 2.4 1.0 0.2 3.6
Note.All figures are thepercentagepoint shares of the total aggregatewagebill for the relevant percentile group.
7 ASHE excludes all those who are only self-employed and also excludes all self-employment income fromthose who also have paid employment.
8 Atkinson et al. (2011) accomplish this by using the ONS estimate of total income for UK adults andadjusting the share of the upper percentiles to reflect this larger denominator (see online Appendix). It isnot clear how reliable this adjustment is. Even if the adjustment was perfect it represents the share of incomeamong all adult individuals rather than among all adult workers, so the concept is slightly different.
© 2013 The Authors.The Economic Journal published by John Wiley & Sons Ltd on behalf of Royal Economic Society.
F6 T H E E CONOM I C J O U RN A L [ F E B R U A R Y

5% excluding the top 1%), with only a small increase for the second vingtile (next 6%–10%). So even with the standard measure of wages used in the literature we miss asubstantial part of the wage inequality story by focusing on the 90th percentile.Interestingly, in the period between 1999 and 2008, the top percentile saw only a smallincrease in their share of the weekly wage bill. Finally, there has been a small decline in theshare of the gross weekly wagebill accruing to the top decile since the onset of the financialcrisis (2008–11), although it has unwound less than one-third of the previous decade gain.
Switching to annual wages in panel (b) of Table 2 gives a starkly different picture.The change in the wage bill share for the top decile between 1999 and 2008 was muchlarger on this measure (3.3 percentage points) than using weekly wages (1.4percentage points).9 Furthermore, the distribution of these gains was also completelydifferent. Using weekly wages suggested that those in the 6th–10th percentiles gainedas much as the top percentile (0.3 and 0.4 percentage points per annum respectively).Using annual wages shows that the top percentile actually gained almost six times asmuch as that group (1.8 versus 0.3 percentage points per annum).
Panel (c) shows that the trends in the tax returns for annual wages over the overlappingperiod for which we have data (i.e. 1999–2008) are slightly higher but broadly similar topanel (b). This is likely to be because the tax returns include some of the deferredincentive payments, not captured by annual bonuses (see the discussion below inSection 2 around Table 5). For example the growth of the share of the top decile was 3.6percentage points in the tax returns compared to 3.3 percentage points in ASHE.
0.390.69
0.34
1.42
1.8
1.24
0.31
3.35
0.0
0.5
1.0
1.5
2.0
2.5
3.0
3.5
4.0
Top 1% Next 2–5% Next 6–10% Top 10%
Perc
enta
ge P
oint
Cha
nge
in W
age
Shar
e
Weekly Wages Annual Wages
Fig. 2. Change in Shares of Total Wage Bill, 1999–2008, ASHENotes. Estimates shares of total wages accruing to 99th percentile (i.e. top 1% of earners), 95th–99th percentile (i.e. next 2–5%) and 90th–94th (i.e. next 6–10%) of all individuals in ASHE.Source. Annual Survey of Hours and Earnings.
9 The gain of 3.3 percentage points from 1999 to 2008 compares with a gain of 3.6 percentage points from1999 to 2008 using the income tax return shares given in Table 1. So there is a very tight relationship betweenour measure of wage share changes using ASHE and the share changes using tax data over this period.
© 2013 The Authors.The Economic Journal published by John Wiley & Sons Ltd on behalf of Royal Economic Society.
2014] B A N K E R S A N D TH E I R B ONU S E S F7

Figure 2 plots the change in the share of the total wage bill going to the three groupsover the period 1999–2008 using both weekly and annual wages and the top decile as awhole. The key point here is that the vast majority of the rise in the share of the top 1%over the last decade would be missed using weekly wages (0.4% versus 1.8%). In alabour market that increasingly uses incentive and bonus payments as part of theremuneration structure, weekly (and hourly) wages will increasingly fail to capture theevolution of the wage structure adequately.
1.3. Sectoral Decomposition of Gains: The Role of Finance
How much of the rise in inequality can be accounted for by workers within thefinancial industry? The furore over bankers’ pay has highlighted the high pay levels ofbankers at grades well below the level of the CEO. But in contrast to CEO pay, noneof this remuneration has been subject to required accounting disclosure. We can usethe ASHE data to explore the sectoral decomposition of wage inequality changes. Tomaintain large enough samples and to comply with ONS confidentiality requirementsassociated with accessing the data, we focus on one-digit industry breakdowns.Fortunately, financial intermediation is consistently categorised over our sampleperiod. Table 3 shows that workers in finance and business services (legal,accounting, management consultancy, IT services, etc.) have been the principalbeneficiaries of increased inequality, whereas top earners in manufacturing have
Table 3
Changes in Total Wage and Income Share by Industry
Level of share ofwage bill of top 1%in baseline year
Change in the share of wage bill of
Top 1% Next 2–5% Next 6–10% Top 10%
ASHE, 1999–2008All workers 7.1 1.8 1.2 0.4 3.3Finance 2.4 1.4 0.9 0.3 2.5Business services 1.6 0.8 1.1 0.8 2.7Health services 0.1 0.1 0.2 0.1 0.4Construction 0.1 0.3 0.2 0.3 0.6Transport & comm 0.3 0.0 0.0 0.0 0.0Public admin & education 0.1 0.0 �0.3 �0.2 �0.5Manufacturing 1.1 �0.4 �0.6 �0.7 �1.8Other 1.4 0.0 �0.1 0.0 �0.1
SPI, 1999–2008All workers 8.4 2.4 1.0 0.2 3.6Finance 2.7 1.6 0.3 0.0 2.0Business services 2.0 0.7 1.0 0.4 2.1Health services 0.1 0.2 0.3 0.3 0.8Construction 0.2 0.1 0.2 0.3 0.6Transport & comm 0.4 0.0 0.1 0.0 0.1Public admin & education 0.2 0.0 �0.1 �0.2 �0.2Manufacturing 1.0 �0.2 �0.6 �0.8 �1.6Other 1.8 0.0 �0.2 0.2 �0.2
Notes. All figures are the percentage point change in the share of the total aggregate wage bill for the relevantpercentile/industry group. Data from the Survey of Personal Incomes (SPI) relates to pay from employmentnet of benefits and foreign earnings.
© 2013 The Authors.The Economic Journal published by John Wiley & Sons Ltd on behalf of Royal Economic Society.
F8 T H E E CONOM I C J O U RN A L [ F E B R U A R Y
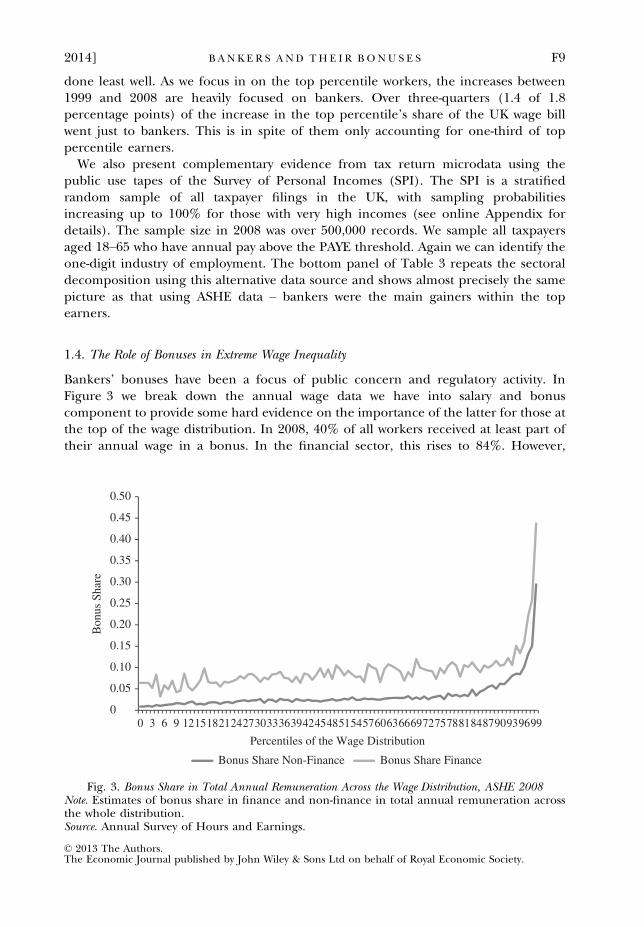
done least well. As we focus in on the top percentile workers, the increases between1999 and 2008 are heavily focused on bankers. Over three-quarters (1.4 of 1.8percentage points) of the increase in the top percentile’s share of the UK wage billwent just to bankers. This is in spite of them only accounting for one-third of toppercentile earners.
We also present complementary evidence from tax return microdata using thepublic use tapes of the Survey of Personal Incomes (SPI). The SPI is a stratifiedrandom sample of all taxpayer filings in the UK, with sampling probabilitiesincreasing up to 100% for those with very high incomes (see online Appendix fordetails). The sample size in 2008 was over 500,000 records. We sample all taxpayersaged 18–65 who have annual pay above the PAYE threshold. Again we can identify theone-digit industry of employment. The bottom panel of Table 3 repeats the sectoraldecomposition using this alternative data source and shows almost precisely the samepicture as that using ASHE data – bankers were the main gainers within the topearners.
1.4. The Role of Bonuses in Extreme Wage Inequality
Bankers’ bonuses have been a focus of public concern and regulatory activity. InFigure 3 we break down the annual wage data we have into salary and bonuscomponent to provide some hard evidence on the importance of the latter for those atthe top of the wage distribution. In 2008, 40% of all workers received at least part oftheir annual wage in a bonus. In the financial sector, this rises to 84%. However,
0
0.05
0.10
0.15
0.20
0.25
0.30
0.35
0.40
0.45
0.50
0 3 6 9 121518212427303336394245485154576063666972757881848790939699
Bon
us S
hare
Percentiles of the Wage Distribution
Bonus Share Non-Finance Bonus Share Finance
Fig. 3. Bonus Share in Total Annual Remuneration Across the Wage Distribution, ASHE 2008Note. Estimates of bonus share in finance and non-finance in total annual remuneration acrossthe whole distribution.Source. Annual Survey of Hours and Earnings.
© 2013 The Authors.The Economic Journal published by John Wiley & Sons Ltd on behalf of Royal Economic Society.
2014] B A N K E R S A N D TH E I R B ONU S E S F9
although the receipt of bonuses is common for many workers, these bonuses typicallyaccount for only a small part of overall pay. For those outside the top decile, bonusesaccount for only 2.9% of total pay.10 Even in the financial sector, only 8.6% of total payfor those outside the top decile is accounted for by bonuses. So for the average worker,bonuses are a small component of annual pay. In contrast, bonuses make up animportant part of pay for those at the top of the wage distribution. Fully 83% ofworkers in the top percentile received a bonus and 35% of total pay for these workerscame in the form of bonuses. The role of bonuses is even more substantial in thefinancial sector. Top percentile workers who are employed in finance received 44% oftheir total pay in bonuses.
The close link between rising wage inequality at the top and bonuses can be seen bycalculating how much of the change in the share of wage income going to those at thetop of the distribution has come in the form of bonuses. We can only do thiscalculation from 2002 as this is the first year that ASHE required the annual wage to bebroken down into salary and bonus. From 2002 to 2008, the top percentile increasedtheir share of the wage bill by 1.5 percentage points, from 7.4% to 8.9%. So most of the1.8 percentage point gain observed in Table 2 for the last decade actually occurred inthis subperiod.11 Remarkably, the entire gain to the top percentile was a result ofincreased bonus payments. Indeed, salaries for this group grew at a slower rate than forworkers in the rest of the wage distribution. Of the 7.4% of the wage bill accruing tothe top percentile in 2002, 5.5% was paid as salary and 1.9% was bonuses. By 2008, thefigures were 4.9% and 4.0% respectively.
We are not, of course, claiming here that bonuses caused the increase in extremewage inequality. But it is clear that the growth in bonuses that we have witnessed overthe last decade, particularly for bankers, has gone hand in hand with a significantincrease in the share of total wages taken by those at the top of the wage distribution. Itis therefore not surprising that bonuses have been such a source of contention.
1.5. The Impact of the Crisis on Bankers’ Pay and Jobs
Has the financial crisis and subsequent weak recovery reversed the gains of thebankers? As we documented in Table 2, there is evidence of a small decline in theshare of the wage bill taken by all those in the top decile since 2008. For the toppercentile, this has amounted to a 0.5 percentage point decline.12 This drop stillrepresents less than a third of the gains made in the preceding decade. However, thedecline has not been uniform across sectors. If we compute the sectoral decomposition
10 This can be decomposed into a bonus share in total pay of 7.6% for the 37.6% of workers in the bottomnine deciles who receive a bonus.
11 This is not surprising given that the economy had exited recession by 2002 and this was the periodcharacterised by low long-term and policy rates, elevated risk taking and large profits at major banks.
12 This decline in the top percentile share appears smaller than that estimated from the income tax returndata reported in Table 1. Between 2007 and 2009, the decline in income share was 1.5 percentage pointsaccording to that data. As it happens, the ASHE data paint almost the same picture. Between 2007 and 2009,the top percentile decline was 1.3 percentage points in ASHE. But the share then recovered by 0.8percentage points by 2011 to give an overall decline of 0.5 percentage points. This suggests that the share ofincome recorded for the top percentile using income tax returns will bounce back when more recent yearsbecome available (as happened in the US data in 2010, see Figure 1).
© 2013 The Authors.The Economic Journal published by John Wiley & Sons Ltd on behalf of Royal Economic Society.
F10 TH E E CONOM I C J O U RN A L [ F E B R U A R Y

of the decline since 2008, we find that bankers in the top percentile actually increasedtheir share of the total wage bill by 0.2 percentage points between 2008 and 2011. Thisshould really come as no surprise, as the published official figures reveal the samebroad picture at the aggregate level. Between 2008 and 2011, the mean gross annualwage for all full-time employees rose 3.7% (which was of course a real wage decline asprices rose 9.6% over the same period). For finance workers in London, the rise was14.2%.13 The share of finance workers in London in the total UK wage bill rose from5.4% to 6.4% between 2008 and 2011 using this official data on full-time employees.
Are we overestimating the resilience of top bankers’ pay by ignoring the employmenteffects of the crisis? It may be that many of those bankers previously in the toppercentiles of the wage distribution have been made redundant as a result of the crisisand subsequent anaemic recovery in much greater proportions than those in othersectors of the economy. On the face of it, this seems unlikely. The official workforcejobs numbers show that the economy as a whole shed 621,000 jobs between March2008 and March 2011 – a drop of 1.9%. But the financial sector in London lost only5,000 jobs – a drop of 1.4%.14
To examine this issue in more detail, we created a sample from the five-quarterlongitudinal data of the Labour Force Survey (LFS). The LFS surveys a largerepresentative cross section of the UK population and follows them for five quarters.Thus, we can examine transitions from employment over a 12-month period bycomparing the first and fifth wave of data. We take all respondents who entered theLFS from the first quarter of 2008 to the first quarter of 2011 and have thereforecompleted their fifth-quarter interview. We then estimate equations of the followingform on all workers who were employed in their first interview:
yi;tþ4 ¼ a1FINANCEi;t þ a2FINANCE� LONDONi;t þ X i;tbþ ui ; (1)
where FINANCE is a dummy variable equal to unity if worker i was employed infinance, and FINANCE 9 LONDON is a dummy variable equal to unity if worker i wasemployed in finance in London. The first outcome (yi;tþ4) we consider is whether theworker was still observed to be working 12-months later (Employed). We also considerwhether the worker remained in the same firm or not (SameFirm). Xi,t is a vector ofother controls for age, education, occupation, industry, region, gender and publicsector and ui is an error term. The LFS also provides information on gross weekly wagesthat allow us to estimate these equations for both the total workforce and for the upperpart of the wage distribution.
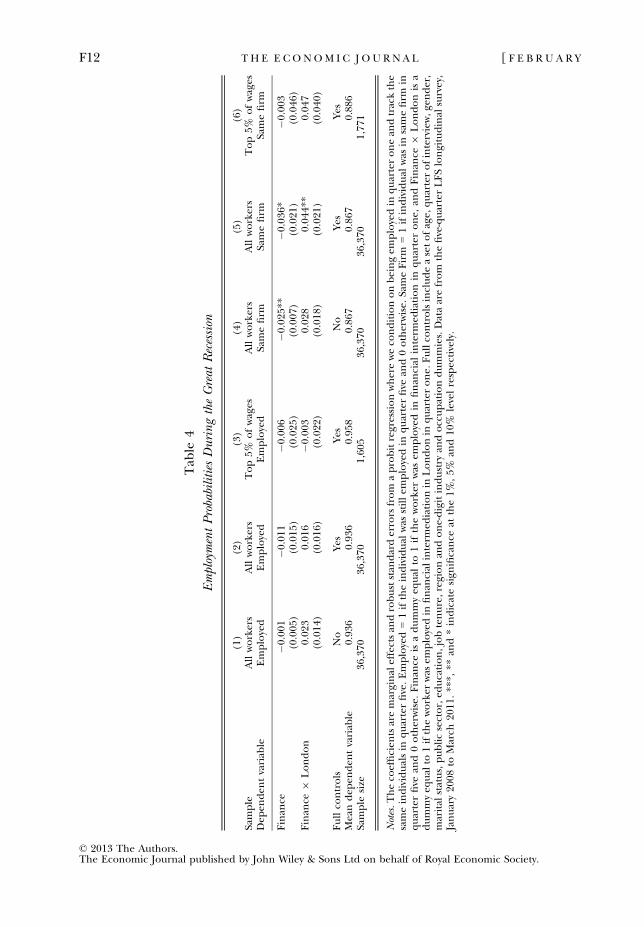
Table 4 reports estimates of the probability of being in various states conditional onbeing employed in the first interview (these are marginal effects from probits). Thefirst three columns focus on whether the worker is still in employment 12 months later,
13 It seems natural to focus on London financial sector workers when looking at the aggregate publishedstatistics. For all workers in the top percentile of the wage distribution in 2011, 59% worked in London(compared with 16% of all workers). For those top percentile workers in finance, 88% worked in London.
14 There have been numerous media reports of impending large-scale headcount reductions across majorbanks in London. Thus far, the official data do not reflect this. The most recent workforce jobs number(March 2013) actually shows a rise of 8,000 jobs in the financial sector in London since March 2011 – so thenumber of jobs is now higher than pre-crisis. It may well be, however, that there has been a shift inemployment within the financial sector away from investment banking and towards fund management andinsurance.
© 2013 The Authors.The Economic Journal published by John Wiley & Sons Ltd on behalf of Royal Economic Society.
2014] B A N K E R S A N D TH E I R B ONU S E S F11
Tab
le4
EmploymentProbabilities
DuringtheGreat
Recession
(1)
(2)
(3)
(4)
(5)
(6)
Sample
Allworkers
Allworkers
Top5%
ofwages
Allworkers
Allworkers
Top5%
ofwages
Dep
enden
tvariab
leEmployed
Employed
Employed
Samefirm
Samefirm
Samefirm
Finan
ce�0
.001
�0.011
�0.006
�0.025
**�0
.036
*�0
.003
(0.005
)(0.015
)(0.025
)(0.007
)(0.021
)(0.046
)Finan
ce9
London
0.02
30.01
6�0
.003
0.02
80.04
4**
0.04
7(0.014
)(0.016
)(0.022
)(0.018
)(0.021
)(0.040
)
Fullco
ntrols
No
Yes
Yes
No
Yes
Yes
Meandep
enden
tvariab
le0.93
60.93
60.95
80.86
70.86
70.88
6Sample
size
36,370
36,370
1,60
536
,370
36,370
1,77
1
Notes.Theco
efficien
tsaremarginal
effectsan
drobuststan
darderrors
from
aprobitregressionwhereweco
nditiononbeingem
ployedin
quarteronean
dtrackthe
sameindividualsin
quarterfive.Employed=1iftheindividual
was
stillem
ployedin
quarterfive
and0otherwise.
SameFirm
=1ifindividual
was
insamefirm
inquarterfive
and0otherwise.
Finan
ceisadummyeq
ual
to1iftheworker
was
employedin
finan
cial
interm
ediationin
quarterone,
andFinan
ce9
Londonisa
dummyeq
ual
to1iftheworker
was
employedin
finan
cial
interm
ediationin
Londonin
quarterone.
Fullco
ntrolsincludeasetofage,
quarterofinterview,g
ender,
marital
status,publicsector,ed
ucation,jobtenure,regionan
done-digitindustry
andoccupationdummies.Dataarefrom
thefive-quarterLFSlongitudinal
survey,
January20
08to
March
2011
.**
*,**
and*indicatesign
ificance
atthe1%
,5%
and10
%levelrespectively.
© 2013 The Authors.The Economic Journal published by John Wiley & Sons Ltd on behalf of Royal Economic Society.
F12 TH E E CONOM I C J O U RN A L [ F E B R U A R Y

while the final three columns focus on whether the worker is with the same firm 12months later. Our key coefficient variables of interest are the a’s. It is clear fromcolumns (1) and (2) that subsequent employment probabilities where no worse forthose who initially had a job in finance than those in other sectors – and the additionalimpact of working in finance in London was if anything positive, althoughinsignificant.15 Taken literally, column (1) says that a worker in the finance industryin London was 2.2% more likely to remain employed. One explanation of this findingis that financial workers have more (unobserved) human capital and such workers areless likely to lose their jobs during a recession regardless of industry. To investigate thiswe repeat the specification of column (2) but confine the sample to workers who werein the top 5% of the pay distribution in the first quarter. While the sample size is muchreduced, there remains no evidence that bankers did significantly worse in theiremployment outcomes in the recession compared with other workers.16
The last three columns of Table 4 examine whether the worker remains employed inthe same firm. Interestingly, column (5) suggests that financial sector workers outsideLondon were significantly more likely to move jobs than both non-financial workersand financial workers in London. So although there is substantial job churning, thisdoes not seem to have affected London finance workers more than comparableworkers. Overall, the evidence is consistent with the aggregate employment picture –‘City bankers’ have not suffered exceptionally since the onset of the crisis.
2. Public Disclosure of Bankers’ Pay
We next provide a brief summary of some newly available pay data on bankers thatsuggests that the estimates in the previous section are likely to represent a lower boundon the importance of financial sector workers at the top of the distribution. TheFinancial Services Authority (FSA) introduced a new reporting requirement in 2010for regulated financial entities in the UK. The rule requires a firm to identify all ‘codestaff’ whose professional activities are determined as having a material impact on thefirm’s risk profile. The firm must report the full aggregate remuneration of all suchcode staff, including deferred and equity-based compensation. These data provide anew glimpse into the world of bankers’ pay and can provide some perspective on thelikely underestimation that is involved by using ASHE data that cover only salary andcash bonus payments. Code staff are effectively in the top percentile of earners.
We have collected the 2010 disclosures for some of the most significant banks thatare either headquartered or have a reporting entity in London. Table 5 reports foreach bank the number of code staff, the average salary, cash bonus, equity-based bonusand deferred bonus awards. For comparison, we report the estimated salary and cashbonus in 2010 from ASHE for those London bankers in the top 1% and 0.25% of theearnings distribution.
15 One might worry that the models in Table 4 are so saturated that it is difficult to identify any significanteffect. This is not the case. Among the unreported coefficients, we find consistent and highly significantnegative effects on remaining employed during the recession for women, private sector workers, low jobtenure workers and those in lower occupation categories.
16 As an alternative, we re-ran column (2) and included dummies for each 5 percentage point range of thefirst-quarter wage distribution. The results are almost identical to those in column (2).
© 2013 The Authors.The Economic Journal published by John Wiley & Sons Ltd on behalf of Royal Economic Society.
2014] B A N K E R S A N D TH E I R B ONU S E S F13
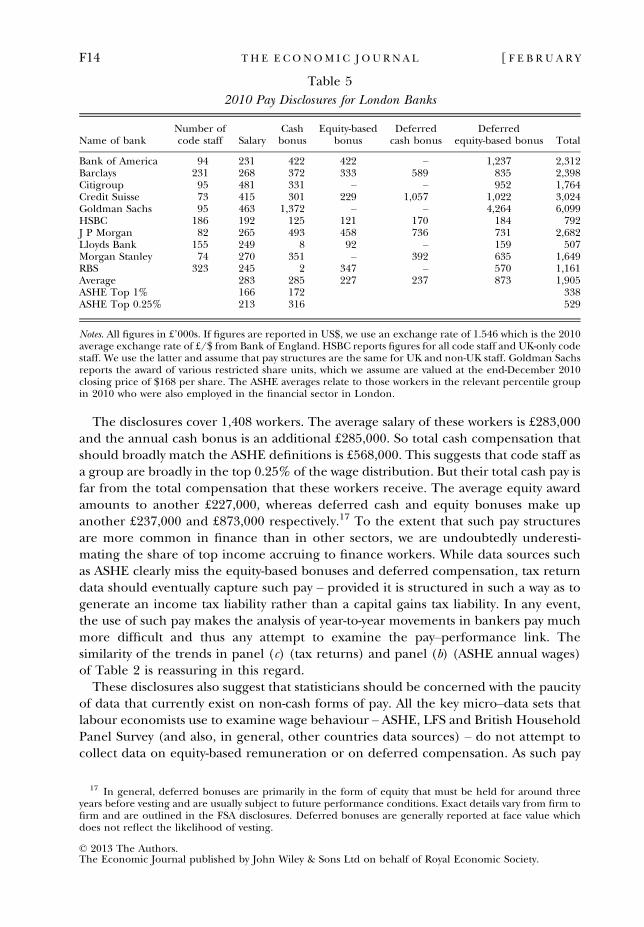
The disclosures cover 1,408 workers. The average salary of these workers is £283,000and the annual cash bonus is an additional £285,000. So total cash compensation thatshould broadly match the ASHE definitions is £568,000. This suggests that code staff asa group are broadly in the top 0.25% of the wage distribution. But their total cash pay isfar from the total compensation that these workers receive. The average equity awardamounts to another £227,000, whereas deferred cash and equity bonuses make upanother £237,000 and £873,000 respectively.17 To the extent that such pay structuresare more common in finance than in other sectors, we are undoubtedly underesti-mating the share of top income accruing to finance workers. While data sources suchas ASHE clearly miss the equity-based bonuses and deferred compensation, tax returndata should eventually capture such pay – provided it is structured in such a way as togenerate an income tax liability rather than a capital gains tax liability. In any event,the use of such pay makes the analysis of year-to-year movements in bankers pay muchmore difficult and thus any attempt to examine the pay–performance link. Thesimilarity of the trends in panel (c) (tax returns) and panel (b) (ASHE annual wages)of Table 2 is reassuring in this regard.
These disclosures also suggest that statisticians should be concerned with the paucityof data that currently exist on non-cash forms of pay. All the key micro–data sets thatlabour economists use to examine wage behaviour – ASHE, LFS and British HouseholdPanel Survey (and also, in general, other countries data sources) – do not attempt tocollect data on equity-based remuneration or on deferred compensation. As such pay
Table 5
2010 Pay Disclosures for London Banks
Name of bankNumber ofcode staff Salary
Cashbonus
Equity-basedbonus
Deferredcash bonus
Deferredequity-based bonus Total
Bank of America 94 231 422 422 – 1,237 2,312Barclays 231 268 372 333 589 835 2,398Citigroup 95 481 331 – – 952 1,764Credit Suisse 73 415 301 229 1,057 1,022 3,024Goldman Sachs 95 463 1,372 – – 4,264 6,099HSBC 186 192 125 121 170 184 792J P Morgan 82 265 493 458 736 731 2,682Lloyds Bank 155 249 8 92 – 159 507Morgan Stanley 74 270 351 – 392 635 1,649RBS 323 245 2 347 – 570 1,161Average 283 285 227 237 873 1,905ASHE Top 1% 166 172 338ASHE Top 0.25% 213 316 529
Notes. All figures in £’000s. If figures are reported in US$, we use an exchange rate of 1.546 which is the 2010average exchange rate of £/$ from Bank of England. HSBC reports figures for all code staff and UK-only codestaff. We use the latter and assume that pay structures are the same for UK and non-UK staff. Goldman Sachsreports the award of various restricted share units, which we assume are valued at the end-December 2010closing price of $168 per share. The ASHE averages relate to those workers in the relevant percentile groupin 2010 who were also employed in the financial sector in London.
17 In general, deferred bonuses are primarily in the form of equity that must be held for around threeyears before vesting and are usually subject to future performance conditions. Exact details vary from firm tofirm and are outlined in the FSA disclosures. Deferred bonuses are generally reported at face value whichdoes not reflect the likelihood of vesting.
© 2013 The Authors.The Economic Journal published by John Wiley & Sons Ltd on behalf of Royal Economic Society.
F14 TH E E CONOM I C J O U RN A L [ F E B R U A R Y

becomes more common, partly as a result of the policy responses we discuss below, theneed for more comprehensive data becomes clear if one is concerned about what ishappening at the top of the pay distribution.
Some have argued that greater transparency of pay will by itself help rectify the‘problem’ of the level and structure of bankers pay. There is little empirical evidencehere but we are sceptical that transparency by itself leads to declining pay rates or fewerbonuses. Indeed, Card et al. (2012) find that greater knowledge of pay structures leadsto those in the lower half of the distribution feeling aggrieved and may lead to pressurefor less well-paid bankers to demand higher wages, further increasing the average payin this sector.
3. The Policy Response
Finally, we turn to a discussion of policy. The starting point is whether there was in fact aproblem to begin with. It may be that bankers’ pay is simply the outcome of a competitivelabour market in which the returns to talent are high and rising over time. The Rosen(1981) model of superstars provides one framework: sellers of a particular service, e.g.traders at an investment bank, are not perfect substitutes. The purchaser of theseservices – the investment bank – will prefer to buy the services of the extraordinarilytalented trader rather than one almost as good. Because only a few traders possessexceptional ability, investment banks will be willing to pay substantial premia for theirservices. The potential importance of such superstars in the financial sector is likely tohave increased in recent years as a result of technological change. As markets havebecome more globalised and liquid, traders have witnessed a substantial rise in thenumber of different markets and asset types they can trade. In addition, large increasesin the size of assets under management allow for superstars to trade with much largercapital. This combination of superstars and an increasing asset base is at the heart ofGabaix and Landier (2008). In their model, CEOs differ in talent and are matched tofirms competitively. If the marginal impact of a CEO’s talent increases with the value ofthe firm under his control, the best CEO manages the biggest firm. Similarly, the besttrader should work with the largest asset base. Crucially in their equilibrium, very smalldifferences in talent can produce large differences in pay. In their calibration they showthat the value of a firm increases by only 0.016% if they replace the 250th best CEO withthe best CEO. Yet these small differences in talent translate into large pay differences asthey are magnified by firm size. The same calibration shows that the best CEO should bepaid over five times more than the 250th CEO.
An alternative explanation of the wage premia enjoyed by bankers focuses on therents that accrue in the sector. These may come about as a result of lack of productmarket competition within the sector or as a result of implicit or explicit subsidies andguarantees that banks receive from the taxpayer. The much discussed ‘too-big-to-fail’problem is an example. Governments will not allow systemically important financialinstitutions to fail and therefore they provide an implicit bailout guarantee. Thisguarantee is valuable to creditors and thus reduces the cost of finance for banks. Asshareholders have limited liability, the guarantee encourages risky lending financed bythe cheaper finance – losses are limited on the downside and shareholders (andworkers) benefit on the upside.
© 2013 The Authors.The Economic Journal published by John Wiley & Sons Ltd on behalf of Royal Economic Society.
2014] B A N K E R S A N D TH E I R B ONU S E S F15

The first best response to such market failures is to correct the failure and removethe ability to generate rents. The problems with such an approach should not beunderestimated. Suppose we focus on the ‘too-big-to-fail’ issue. One response, madefamous by Mervyn King, is to argue that a bank that is too-big-to-fail is too big. Then astructural response of breaking up large banks to prevent them becoming systemicallyimportant seems called for. But how do we define ‘too big’? And what is the trade-offbetween the social costs of the implicit guarantee and the efficiency gains that largebanks can potentially achieve?
As an alternative to structural reforms of breaking up universal banks, they could bedivided into their retail and investment banking arms and required to hold separatecapital for each arm. This is essentially one of the key recommendations of the‘Vickers’ Report’ (formally the Independent Commission on Banking, ICB). Thestructural and regulatory reforms along the lines of those outlined by the ICB are likelyto mitigate the market failures that give rise to rents in the sector but are unlikely toremove such rents entirely. Indeed, the performance of the regulators during the lastdecade is unlikely to inspire confidence in their ability to overcome the entrenchedinterests at work in protecting the rents.
Thus, while financial regulatory reform18 is vital, it is unlikely that policy makers willbe able and willing to commit to eliminate financial sector rents. Thus, an alternative isto tax or regulate the outcomes. Here, we consider three proposed policy responses.First, a tax on bank profits or revenues. Such a tax has been introduced in a number ofEU countries and was implemented as a Bank Levy in the UK in Budget 2010. All UKbanks and building societies and foreign banks operating through permanent UKsubsidiaries are required to pay an annual tax rate of 0.105% on their total balancesheet. The tax rate is set so that the total expected tax revenue is equal to £2.5 billion.In addition, ‘safer’ forms of funding are either excluded from the balance sheetcalculation or taxed at a half-rate to encourage their use over risky funding (Devereux,2011). Larger firms will pay more under such a tax and this at least goes some way tocapture the implicit cost of the guarantees but in practice the link between systemicrisk and balance sheet size is likely to be complex. It is also unclear why such a levy ispreferable to a tax on economic rent in the banking sector. Such a tax could beimplemented as a surcharge rate on the regular corporation tax rate, rather like thatapplied to the oil industry. Alternatively, the International Monetary Fund (2010) hasproposed a financial activities tax, which would approximate a tax on rents but inaddition impose a further tax on high remuneration.
Second, consider a tax on the pool of money used to pay bankers’ bonuses. TheLabour Government pursued this policy in the immediate aftermath of the financialcrisis. Announced in the 2009 pre-budget report, employers were subject to a 50% taxrate for any bonus paid to bankers in excess of £25,000 in the 2009/10 tax year. Thebonus tax was explicitly declared as a one-off tax – although the Labour party (now inopposition) is in favour of repeating the exercise. At the time, the Treasury predictedthe tax would raise £550 million. In fact, the tax seemed to generate revenue of some£2.3 billion. The key reason for the higher tax take seems to have been that firms
18 For more on financial regulatory reform, see Rajan (2010), Squam Lake Report (2010) and Turner(2011).
© 2013 The Authors.The Economic Journal published by John Wiley & Sons Ltd on behalf of Royal Economic Society.
F16 TH E E CONOM I C J O U RN A L [ F E B R U A R Y

accepted the one-off nature of the tax and absorbed the cost of the tax across theirglobal wage bill rather than reduce the payments to their UK-based workers. Whethersuch shifting would occur if the tax was viewed as permanent is less clear. In addition,taxing only one component of pay would surely encourage employers to re-classify payin ways that avoided the tax.
Third, there has been much attention paid to altering the structure of banker’sremuneration. This approach does not explicitly seek to affect the size of pay and thusdoes not seem to directly affect the sharing out of rents. However, it may be arguedthat the combination of the moral hazard problem that banks have implicit andexplicit guarantees that protect the downside (the too-big-to-fail problem) and thestandard principal–agent problems of management and shareholders may haveresulted in the provision of high-powered incentives to workers that do not induce thesocially optimal level of risk taking on the part of workers. Workers paid bonuses on thebasis of the annual profits of their trading book have an incentive to search for short-term profit and to increase the risk they take at the expense of the long-term interest ofthe firm. These effects become magnified during a period in which the low interestrates of the major central banks encouraged excessive risk taking and leverage. This isparticularly so for traders who make money in aggregate only by luck and have noability to outperform the market in the long run. The worst that can happen to suchtraders is that they lose their jobs, but they keep the bonuses they had previouslyreceived. The management of the firm is less incentivised to address these issues as themoral hazard problem reduces the downside costs of such actions. Thus, the focus onpay structures seeks to address these negative incentive effects and align the workersobjective with those of the long-run interests of the firm.
Besley and Ghatak (2013) examine a model where there is state insurance for thefinancial sector on the downside and principal agent problems in banking. They showthat in equilibrium there will be excessive incentives for risk taking and consideroptimal policy responses over financial sector pay. They further prove that acombination of regulation of the structure of bonuses and a tax on their levelemerges as the optimal policy in such a set-up.
The Financial Stability Board issued a set of principles for Sound CompensationPractices in 2009. The EU and FSA have subsequently implemented many of theseprinciples as regulatory requirements under the Capital Requirements Directive(CRD) and the Remuneration Code respectively. UK institutions were required tocomply with the FSA Code from 1 January 2011. As highlighted in Section 2, the FSArequires firms to identify code staff whose professional activities are determined ashaving a material impact on the firm’s risk profile. The key components of a compliantpay policy are as follows:
● A substantial fraction of pay must be in variable form that is fully flexible,allowing for decreases when performance is poor.
● Between 40% and 60% of variable remuneration must be deferred with aminimum deferral period of three years. Institutions should have mechanismsto claw-back deferred remuneration in the light of poor performance.
● At least 50% of variable remuneration should be in shares or other non-cashinstruments.
© 2013 The Authors.The Economic Journal published by John Wiley & Sons Ltd on behalf of Royal Economic Society.
2014] B A N K E R S A N D TH E I R B ONU S E S F17

● Guaranteed bonuses should be exceptional and limited to the first year ofemployment.
● Employees must not undertake hedging activities to undermine the riskalignment effect.
More recently, the EU has adopted a restriction as part of the CRD that limits bonusesin the financial sector to be no more than salary, or no more than twice as large ifshareholders approve. The rule will become effective from January 2014, subject to alegal challenge by the UK government. There has been intense speculation that therule will primarily encourage both a switch from flexible to fixed pay and a shift ofpersonnel to outside the EU – neither of which were presumably the intention ofpolicy makers. It is too early to judge the effectiveness of such regulations, and indeedgiven the paucity of data it is hard to see how success would be measured. Nevertheless,the considerations discussed elsewhere in the article suggest that if successfullyenforced, some rules governing the risk structure of pay could be a broadly sensiblepolicy response.
The above overview of policy responses is focused on whether and how to correctfailures specific to the banking sector that generate large income gains for workers inthe sector. However, more generally, policy makers may wish to focus on the equityaspect of the general increase in inequality. This leads naturally to a focus on all thoseat the top of the income distribution. As bankers are a disproportionate share of suchworkers (and are disproportionately well paid within this extreme), any such policywould have the implicit effect of targeting bankers. The key response on thisdimension has been the introduction of a new 50% marginal income tax rate in April2010 on all income over £150,000. This cut-off is almost identical to the top percentileentry point and thus the policy was squarely focused on the top 1%. The rate wasreduced to 45% in April 2013 following a review of the operation of the new 50% rateby HMRC (2012). In announcing the rate reduction, the Chancellor concluded thatthe higher rate introduced ‘massive distortions’ and may raise no more than a 45%rate. Oddly, one of the key findings of the HMRC report is that around £16 billion ofincome was brought forward to avoid the new 50% rate. As this cannot happenrepeatedly, it is not clear why this provides any important evidence on whether the 50%rate should be reduced. In reality, the revenue-maximising marginal rate estimatedfrom most models has large standard errors that do not allow for confident assertionon the appropriate marginal tax rate – see Mirrlees et al. (2011) and Saez (2013) for anextensive discussion.
Having said that, there is some evidence to suggest that there is a link between thetop marginal tax rate and the share of total income going to the top percentile. Pikettyet al. (2011) examine time-series evidence across 18 OECD countries and show thatthere is a strong negative correlation between changes in top marginal tax rates andchanges in the top percentile income share since 1960 (see Figure 4). They interpretthis correlation as supporting the hypothesis that the returns to investing in‘compensation bargaining’ rise as the top rate falls, i.e. as workers keep more of thebargained wage after tax, the incentives to bargain harder will rise. This suggests thatthe optimal top tax rate is higher than in models that focus solely on the standardlabour supply response.
© 2013 The Authors.The Economic Journal published by John Wiley & Sons Ltd on behalf of Royal Economic Society.
F18 TH E E CONOM I C J O U RN A L [ F E B R U A R Y

4. Conclusions
The occupy movement brought a new saliency to the issue of income inequality. Theirkey slogan – ‘we are the 99%’ – dramatically highlighted the sense that a small elitehave been the main winners in the decades leading up to the crisis (Stiglitz, 2012). Toppercentile workers have substantially increased their share of the income pie – in the1970s they took around 6% of total UK income but, by the end of the 2000s, this hadrisen to 15%. On this measure, we returned to levels of inequality not seen since theinterwar years. But one key difference is that the high-income group used to be therentier class enjoying returns on their fixed capital. Now, the high-income group isprimarily high-wage workers enjoying returns on human capital.
Among these high-wage workers in the UK, bankers feature heavily. In 2008, 28% ofall top percentile earners in the UK were London bankers. But this dramaticallyunderstates their importance in the rise in overall wage inequality during the lastdecade. We estimate that somewhere between two-thirds and three-quarters of theoverall increase in the share of wages taken by those in the top percentile have accruedto bankers. More remarkably, the financial crisis seems to have been so far little morethan a blip for the pay of bankers.
It should be borne in mind, however, that we have focused in this study on the payand employment of bankers in the run-up to, and the immediate aftermath of, thefinancial crisis. Our data end roughly three years after the crisis began. It is thereforetoo early to assess whether the changed regulatory and competitive environment and
Change in Top Marginal Tax Rate (Points)
Cha
nge
in T
op 1
% I
ncom
e Sh
are
(Poi
nts)
–40 –30 –20 –10 0 10
Elasticity = 0.47 (0.11)0
24
810
6US
UK
Portugal
Ireland
NorwayCanada
Italy
NZ
Australia
SwedenJapan
France
Netherlands
FinlandGermany
Switzerland
Denmark
Spain
Fig. 4. Changes in Top Income Shares and Top Marginal Tax RatesSource. Piketty et al. (2011).
© 2013 The Authors.The Economic Journal published by John Wiley & Sons Ltd on behalf of Royal Economic Society.
2014] B A N K E R S A N D TH E I R B ONU S E S F19

the inevitable adjustment to a slow, protracted economic recovery will alter the relativepay of bankers in the medium term. Preliminary evidence from the 2012 ASHE datasuggests a marked fall in top bankers pay for that year. Whether this is the beginning ofa medium-run adjustment or simply a bad year in the financial sector is an importantissue for future research.
How should policy respond to these facts? From an efficiency perspective, the keyquestion is the extent to which bankers pay arises from financial sector rents. To theextent that it does, regulatory and structural reforms to remove or lessen the ability togenerate such rents are called for. We are sceptical, however, that such reforms will bewholly successful, which suggests that policy will also need to focus on taxing the rentsthemselves – either before or after they are paid out to bankers. From an equityperspective, the remarkable gains to those at the top of the income distribution over thelast few decades, may call for higher marginal income taxes. The appropriate level atwhich to set such tax rates remains a matter of intense political and economic debate.
University of Oxford and London School of EconomicsLondon School of Economics, CEPR and NBER
Additional Supporting Information may be found in the online version of this article:
Appendix A. Differences in Measurement of Income and Earnings Across AlternativeData Sources.
ReferencesAtkinson, A. (2007). ‘The distribution of top incomes in the United Kingdom 1908–2000’ in (A. Atkinson
and T. Piketty, eds.), Top Incomes over the 20th Century: A Contrast Between Continental European and English-speaking Countries, pp. 82–140, Oxford: Oxford University Press.
Atkinson, A. and Piketty, T. (2010). Top Incomes: A Global Perspective, Oxford: Oxford University Press.Atkinson, A., Piketty, T. and Saez, E. (2011). ‘Top incomes in the long run of history’, Journal of Economic
Literature, vol. 49(1), pp. 3–71.Bell, B. and Van Reenen, J. (2010). ‘Bankers’ pay and extreme wage inequality in the UK’, Centre for
Economic Performance Special Paper No. 21, London School of Economics.Bell, B. and Van Reenen, J. (2012). ‘Firm performance and wages: evidence from across the corporate
hierarchy’, Centre for Economic Performance Discussion Paper No. 1088, London School of Economics.Bell, B. and Van Reenen, J. (2013). ‘Extreme wage inequality: pay at the very top’, American Economic Review,
vol. 103(3), pp. 153–7.Besley, T. and Ghatak, M. (2013). ‘Bailouts and the optimal taxation of bonus pay’, American Economic Review,
vol. 103(3), pp. 163–7.Card, D., Mas, A., Moretti, E. and Saez, E. (2012). ‘Inequality at work: the effect of peer salaries on job
satisfaction’, American Economic Review, vol. 102(6), pp. 2981–3003.Devereux, M. (2011). ‘Will the bank levy meet its objectives?’, British Tax Review, vol. 1, pp. 33–39.Gabaix, X. and Landier, A. (2008). ‘Why has CEO pay increased so much?’, Quarterly Journal of Economics, vol.
123(1), pp. 49–100.Haldane, A. (2010). ‘The $100 billion question’, Comments at the Institute of Risk and Regulation, Hong
Kong.HMRC. (2012). The Exchequer Effect of the 50 Percent Additional Rate of Income Tax, London: Her Majesty’s
Revenue and Customs.International Monetary Fund (2010). Financial Sector Taxation: The IMF’s Report to the G20 and Background
Material, Washington, DC: International Monetary Fund.Kaplan, S. and Rauh, J. (2010). ‘Wall street and main street: what contributes to the rise in the highest
incomes?’, Review of Financial Studies, vol. 23(3), pp. 1004–50.
© 2013 The Authors.The Economic Journal published by John Wiley & Sons Ltd on behalf of Royal Economic Society.
F20 TH E E CONOM I C J O U RN A L [ F E B R U A R Y

Machin, S. and Van Reenen, J. (2010). ‘Inequality’, Centre for Economic Performance Election Analysis,London School of Economics, available at: http://cep.lse.ac.uk/pubs/download/ea015.pdf (lastaccessed: 19 November 2013).
Mirrlees, J., Adam, A., Besley, T., Blundell, R., Bond, S., Chote, R., Gammie, M., Johnson, P., Myles, G. andPoterba, J. (2011). Tax by Design: The Mirrlees Review, Oxford: Oxford University Press.
Philippon, T. and Reshef, A. (2012). ‘Wages and human capital in the US finance industry: 1909-2006’,Quarterly Journal of Economics, vol. 127(4), pp. 1551–1609.
Piketty, T., Saez, E. and Stantcheva, S. (2011) ‘Optimal taxation of top labor incomes: a tale of threeelasticities’, Working Paper No. 17616, NBER.
Rajan, R. (2010). Fault Lines, Princeton, NJ: Princeton University Press.Rosen, S. (1981). ‘The economics of superstars’, American Economic Review, vol. 71(5), pp. 845–58.Saez, E. (2013). ‘Income inequality: evidence and policy implications’, Arrow Lecture, Stanford University.Squam Lake Report (2010). Fixing the Financial System, Princeton, NJ: Princeton University Press.Stiglitz, J. (2012). The Price of Inequality, London: Allen Lane.Turner, A. (2011). The Future of Finance, London: London School of Economics.
© 2013 The Authors.The Economic Journal published by John Wiley & Sons Ltd on behalf of Royal Economic Society.
2014] B A N K E R S A N D TH E I R B ONU S E S F21