Embed Size (px)
Citation preview

SEA LEVEL RISE ADAPTATION PLAN FOR DON CESAR NEIGHBORHOODBRIEFING PRESENTATION
SEPTEMBER 15, 2020
ST. PETE BEACH

INTRODUCTIONS
P H I L L I P K E Y E S , P EP U B L I C I N F R A S T R U C T U R E E X P E R T
K I M B E R L Y M I L L E R , A I C PR E S I L I E N C E P L A N N E R
G U I L L E R M O S I M O N , P E , C F MC O A S T A L E N G I N E E R – S E A L E V E L R I S E
V U L N E R A B I L I T Y
T I M M A Y, P L AL A N D S C A P E A R C H I T E C T

PRESENTATION OVERVIEW
1. Purpose and Goals of Don
CeSar Neighborhood Study
2. SLR & Drainage Analysis
3. Interim Improvements
4. Adaptation Alternatives
5. Cost Implications
6. Discussion and What’s Next?

GOALS FOR DESIGN
■ Reduce nuisance/ tidal flooding
■ Meet LOS for 5’ NAVD 88
■ Minimize need for repairs to
roads or other infrastructure
■ Use natural techniques to
preserve aesthetics
■ Improve stormwater management
■ Enhance community safety
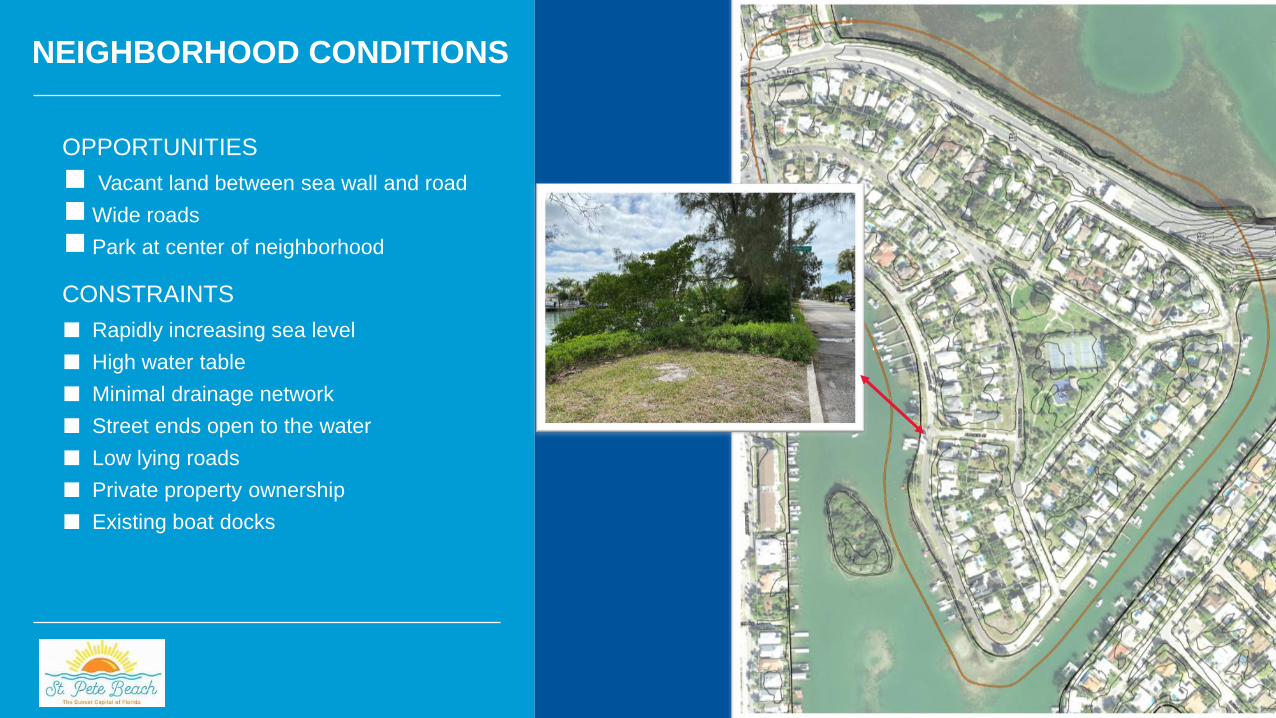
NEIGHBORHOOD CONDITIONS
OPPORTUNITIES
◼︎ Vacant land between sea wall and road
◼︎Wide roads
◼︎Park at center of neighborhood
CONSTRAINTS
■ Rapidly increasing sea level
■ High water table
■ Minimal drainage network
■ Street ends open to the water
■ Low lying roads
■ Private property ownership
■ Existing boat docks

SEA LEVEL RISE & DRAINAGE ANALYSIS

SEA LEVEL CHANGE
SEA LEVEL TRENDS —
TB Climate Science Advisory
Panel
YearNOAA2017 NOAA2017 NOAA2017
Low Intermediate High
2020 0.0 0.0 0.0
2030 0.2 0.3 0.5
2040 0.3 0.6 1.1
2050 0.5 1.0 1.8
2060 0.6 1.4 2.8
2070 0.8 1.8 3.8
2080 0.9 2.3 5.0
2090 1.0 2.9 6.3
2100 1.1 3.4 7.8
Intermediate2050
High2050
Mean High High Water flooding
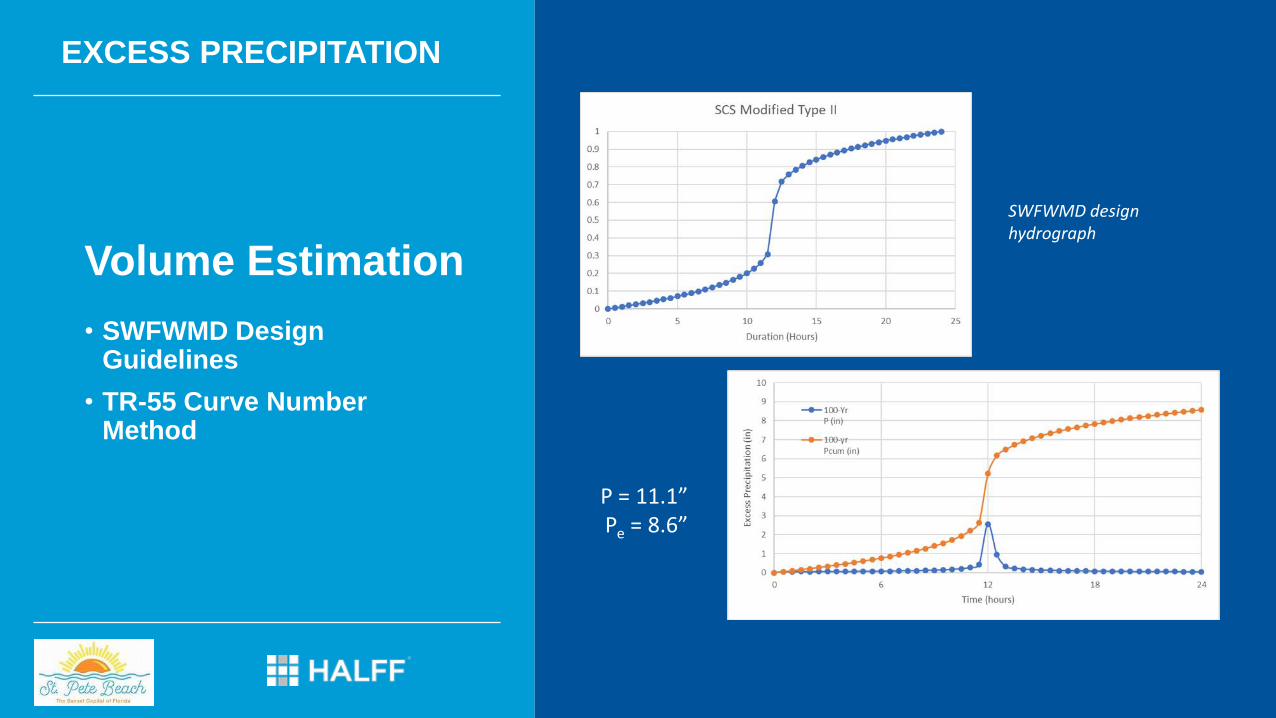
SWFWMD design hydrograph
P = 11.1”Pe = 8.6”
EXCESS PRECIPITATION
Volume Estimation
• SWFWMD Design Guidelines
• TR-55 Curve Number Method

Sto
rmw
ate
r R
ou
tin
g
Storage pond4:1 slope
PROVIDING DETENTION
Pumping rate of 8,000 GPM
Pond design criteria(Rainfall, pumping standards, spillway)

ADAPTING TO CHANGING CONDITIONS
PROPOSED IMPROVEMENTS:
• Interim Solution
• Raising the Perimeter
• Replacing the Streets
• Providing Detention
• Restoring Amenities
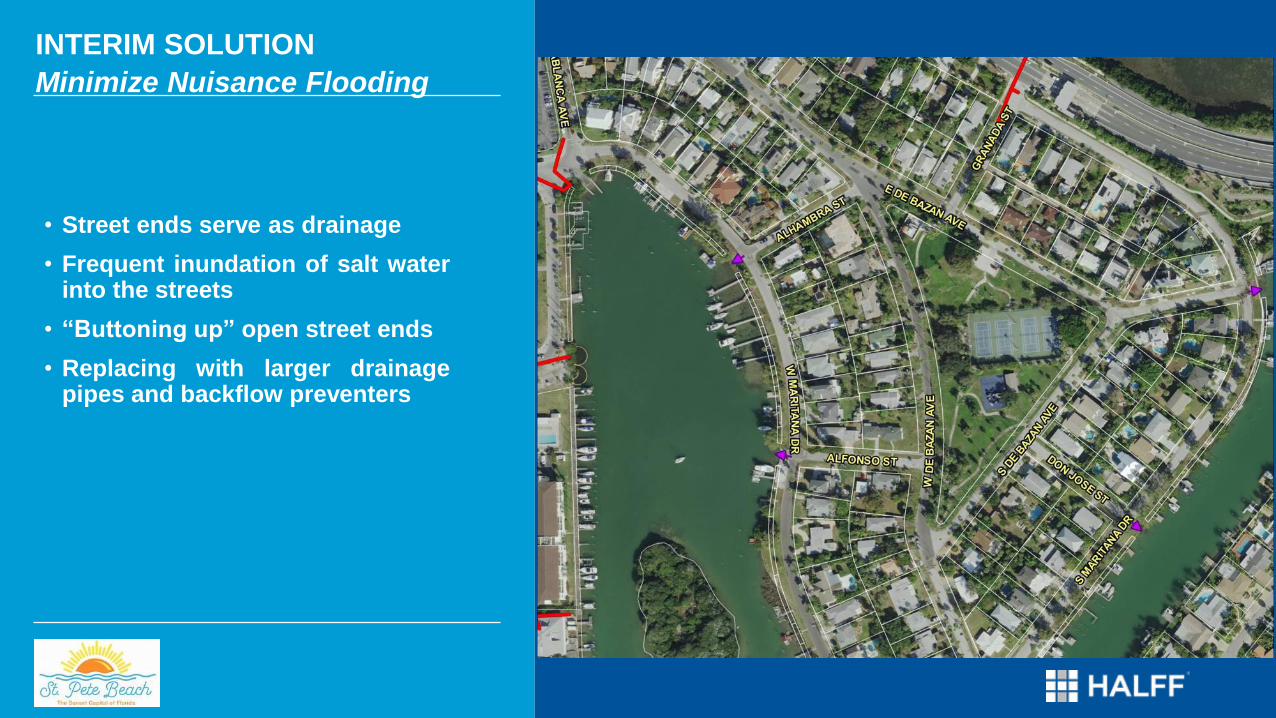
INTERIM SOLUTION
Minimize Nuisance Flooding
• Street ends serve as drainage
• Frequent inundation of salt waterinto the streets
• “Buttoning up” open street ends
• Replacing with larger drainagepipes and backflow preventers

ADAPTATION OPPORTUNITIES
▪ Raising the Perimeter
▪ Replacing the Streets
▪ Providing Detention
▪ Restoring Amenities

RAISING THE PERIMETER
◼︎ Raising perimeter barrier to 5’
LOS NAVD 88
◼︎ Waterfront perimeter is
private property
◼︎ Maintaining waterfront
access

REPLACING THE STREETS
◼︎Grading Streets
◼︎Piping Network
◼︎ Inlets/ Outfalls
◼︎Lower Road for conveyance
◼︎ Interior Storage

Sto
rmw
ate
r R
ou
tin
g
PROVIDING DETENTION
▪ Grading Streets
▪ 4:1 Slope
▪ Pump Stations
▪ Spillway
Storage pond4:1 slope

RESTORING AMENITIES
RECLAIMING LAZARILLO PARK
▪ Minimizing grade change
▪ Pedestrian & ADA access
▪ Reconfiguring the tennis court
▪ Restoring the playground
▪ Edge treatments

Amenitize the Defense
• Reduce roadway from 2-lane to 1-lane
• Outside lane removed
• Swale and/or retaining wall to create a house-side berm
• 5 - 6 above water elevation
• Pedestrian connection to waterfront
• Attractive landscaping
RESTORING AMENITIES

DETENTION POND PERIMETER
RESTORING AMENITIES
▪ Creating a pedestrian experience
▪ Improving the streetscape
▪ Landscape screening
▪ Disguising the pump stations
▪ Enhancing views & shade protection

COST ASSUMPTIONS
o Construction of a perimeter barrier system, including
seawall reconstruction and cut and fill activities
• Amenities included
o Reconstruction of local streets
• Installation of stormwater drainage pipes
o Construction of Detention Area
• Installation of stormwater pumping infrastructure
• Landscape improvements
The OPCC includes a 30% contingency to account for
unknown costs, but does not specifically include the
following services:
o Topographic survey
o Geotechnical investigations
o Real estate acquisitions
o Direct connections to private docks
o Engineering services

QUESTIONS?
CONTACT:
Phillip Keyes/ Kimberly Miller