Embed Size (px)
Citation preview
BringingData&ResearchintotheClassroom
JoshGalsterEarth&EnvironmentalStudiesDept.
MontclairStateUniversity
LauraRademacherGeologyandEnvironmentalScienceDept.
UniversityofthePacific
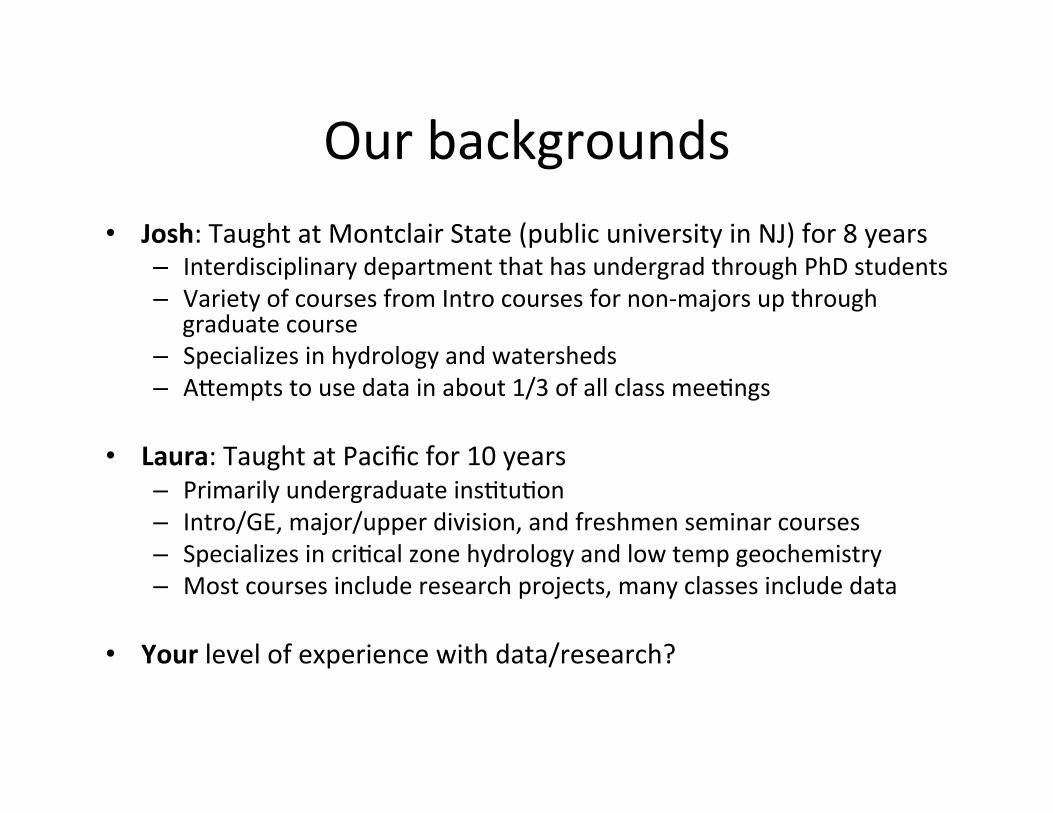
Ourbackgrounds• Josh:TaughtatMontclairState(publicuniversityinNJ)for8years
– InterdisciplinarydepartmentthathasundergradthroughPhDstudents– VarietyofcoursesfromIntrocoursesfornon-majorsupthrough
graduatecourse– Specializesinhydrologyandwatersheds– ATemptstousedatainabout1/3ofallclassmeeXngs
• Laura:TaughtatPacificfor10years– PrimarilyundergraduateinsXtuXon– Intro/GE,major/upperdivision,andfreshmenseminarcourses– SpecializesincriXcalzonehydrologyandlowtempgeochemistry– Mostcoursesincluderesearchprojects,manyclassesincludedata
• Yourlevelofexperiencewithdata/research?

Whyincorporatedata/researchintotheclassroom?
• Thinkofandthenpairupandgenerateaquicklistofthebenefits

Whyincorporatedata/researchintotheclassroom?(exampleresponses)
• CogniXvegrowth– gainsinknowledgeandskills– moreabletothinkandworklikeascienXst(ifmadeexplicit)– communicateeffecXvely– thinkanalyXcallyandcriXcally– increasedretenXoninthecourseand/ordiscipline
• Personalgrowth– gainconfidence– moreindependent– moreself-moXvated
• Professionalgrowth– interestsinasciencecareerarevalidatedorenhanced– developXestothescienXficcommunity

ObjecXvesforthissession
• MakethecaseforusingdataandconducXngresearchintheclassroom.
• Giveexamplesatavarietyofscales.• Haveyougenerateexercisesthatincorporatedata/researchintoyourteaching.

ScaleofClassroomacXviXes
• Data&Research– Usingdataasapieceoftheresearchprocess
• Timeinvolved:10minutes,aclass/lab,asemester?
• Individualvs.group• Outcome:thinking(TPS),wriXng,presentaXon,homework…
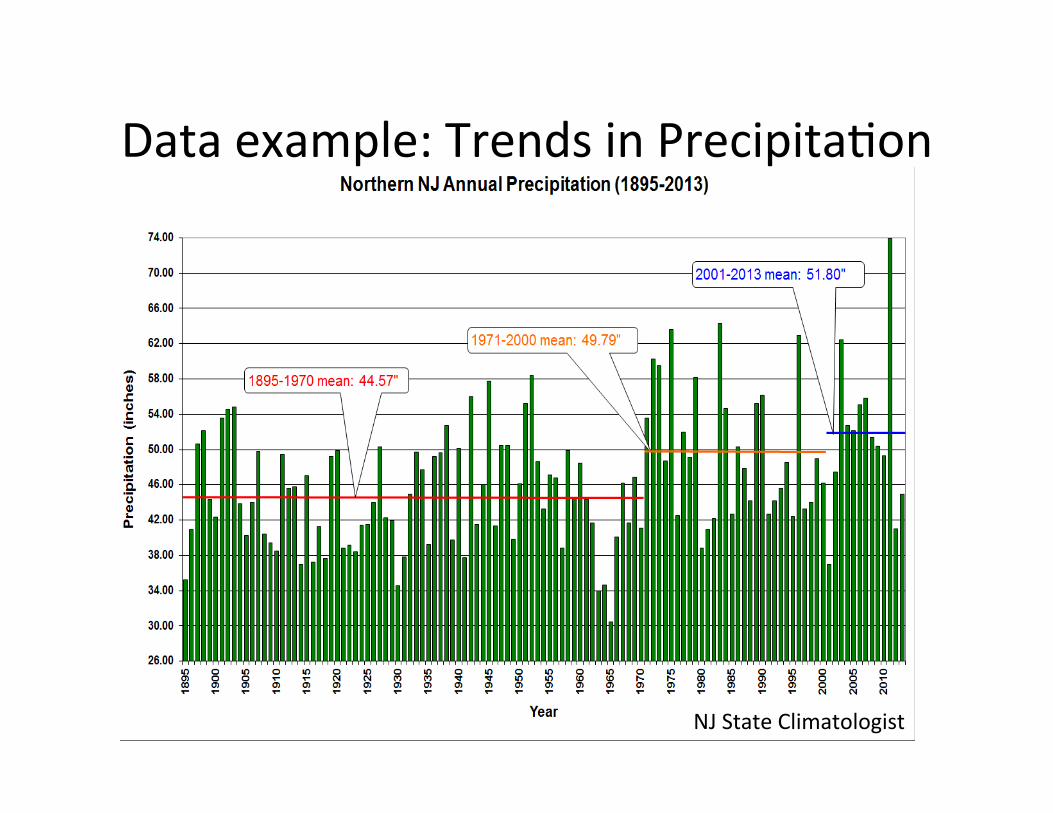
Dataexample:TrendsinPrecipitaXon
NJStateClimatologist
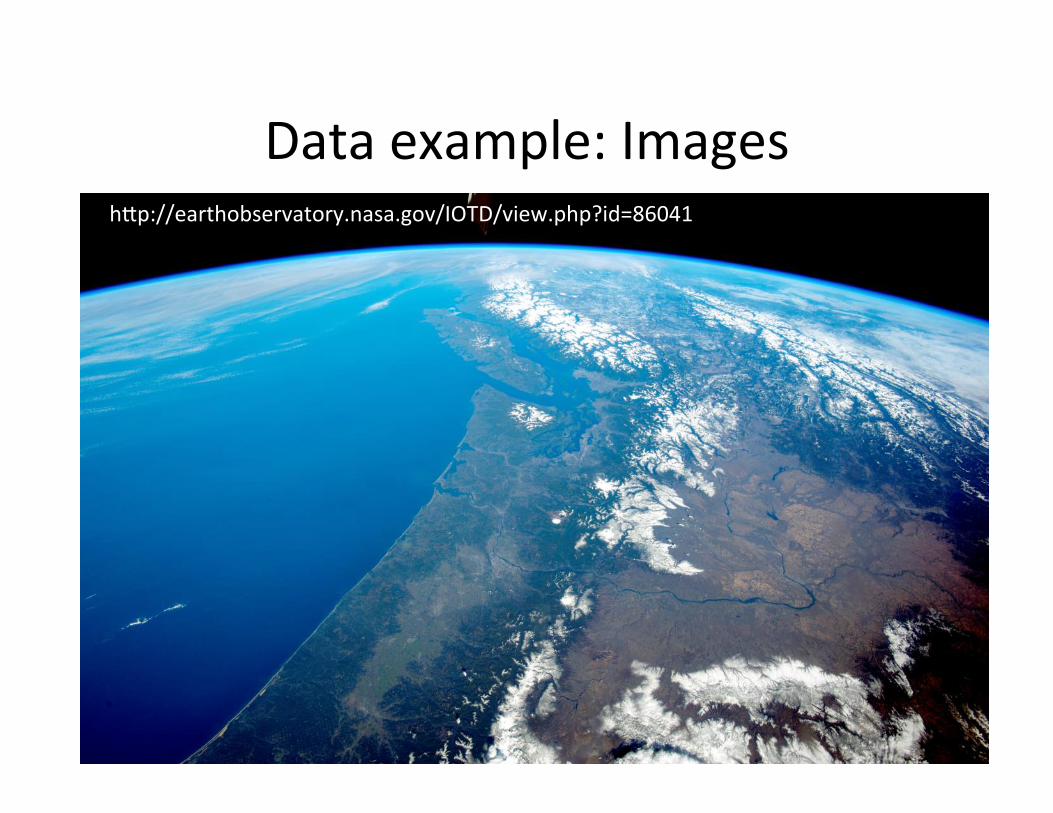
Dataexample:ImageshTp://earthobservatory.nasa.gov/IOTD/view.php?id=86041

7
59.4
9.1
47.72.5
7.6
13.7
19.4
2014Total 1700.1
thousand millionbarrels2004
Total 1366.2thousand million
barrels
7.6
10.3
7.9
3.0 54.9
16.4
1994Total 1118.0
thousand millionbarrels
11.4
3.55.8
12.6
7.3
Distribution of proved reserves in 1994, 2004 and 2014Percentage
Middle EastS. & Cent. America North AmericaEurope & EurasiaAfricaAsia Pacific
0
150
120
60
90
30
NorthAmerica
S. & Cent.America
Europe &Eurasia
MiddleEast
Africa AsiaPacific
2014 by region
Total world proved oil reserves reached 1700.1 billion barrels at the end of 2014, sufficient to meet 52.5 years of global production. The largest addition to reserves came from Saudi Arabia, adding 1.1 billion barrels. The largest decline came from Russia, where reserves fell by 1.9 billion barrels. OPEC countries continue to hold the majority of the world’s reserves, accounting for 71.6% of the global total. South & Central America continues to hold the highest R/P ratio, more than 100 years. Over the past decade, global proved reserves have increased by 24%, or more than 330 billion barrels.
0
160
140
120
100
80
60
40
20
84 89 94 99 04 09 14
North America S. & Cent. America Europe & Eurasia Middle East Africa Asia Pacific World
History
Reserves-to-production (R/P) ratiosYears
7
59.4
9.1
47.72.5
7.6
13.7
19.4
2014Total 1700.1
thousand millionbarrels2004
Total 1366.2thousand million
barrels
7.6
10.3
7.9
3.0 54.9
16.4
1994Total 1118.0
thousand millionbarrels
11.4
3.55.8
12.6
7.3
Distribution of proved reserves in 1994, 2004 and 2014Percentage
Middle EastS. & Cent. America North AmericaEurope & EurasiaAfricaAsia Pacific
0
150
120
60
90
30
NorthAmerica
S. & Cent.America
Europe &Eurasia
MiddleEast
Africa AsiaPacific
2014 by region
Total world proved oil reserves reached 1700.1 billion barrels at the end of 2014, sufficient to meet 52.5 years of global production. The largest addition to reserves came from Saudi Arabia, adding 1.1 billion barrels. The largest decline came from Russia, where reserves fell by 1.9 billion barrels. OPEC countries continue to hold the majority of the world’s reserves, accounting for 71.6% of the global total. South & Central America continues to hold the highest R/P ratio, more than 100 years. Over the past decade, global proved reserves have increased by 24%, or more than 330 billion barrels.
0
160
140
120
100
80
60
40
20
84 89 94 99 04 09 14
North America S. & Cent. America Europe & Eurasia Middle East Africa Asia Pacific World
History
Reserves-to-production (R/P) ratiosYears DataExample:Energy
BP Statistical Review of World Energy 2015 http://www.bp.com/en/global/corporate/energy-economics/statistical-review-of-world-energy.html
7
59.4
9.1
47.72.5
7.6
13.7
19.4
2014Total 1700.1
thousand millionbarrels2004
Total 1366.2thousand million
barrels
7.6
10.3
7.9
3.0 54.9
16.4
1994Total 1118.0
thousand millionbarrels
11.4
3.55.8
12.6
7.3
Distribution of proved reserves in 1994, 2004 and 2014Percentage
Middle EastS. & Cent. America North AmericaEurope & EurasiaAfricaAsia Pacific
0
150
120
60
90
30
NorthAmerica
S. & Cent.America
Europe &Eurasia
MiddleEast
Africa AsiaPacific
2014 by region
Total world proved oil reserves reached 1700.1 billion barrels at the end of 2014, sufficient to meet 52.5 years of global production. The largest addition to reserves came from Saudi Arabia, adding 1.1 billion barrels. The largest decline came from Russia, where reserves fell by 1.9 billion barrels. OPEC countries continue to hold the majority of the world’s reserves, accounting for 71.6% of the global total. South & Central America continues to hold the highest R/P ratio, more than 100 years. Over the past decade, global proved reserves have increased by 24%, or more than 330 billion barrels.
0
160
140
120
100
80
60
40
20
84 89 94 99 04 09 14
North America S. & Cent. America Europe & Eurasia Middle East Africa Asia Pacific World
History
Reserves-to-production (R/P) ratiosYears

Researchexample• Long-termstudyofAMDimpacts(ES&Geochem)

Researchexample
• MappingHurricaneSandystormsurgeinGIS

TipsandRecommendaXonsforData
• Setthetoneearly:beginonthefirstdayofclass• Startwiththebasics:defineaxes,lookatunits,trends,etc.• Besurestudentsarepreparedtodowhatyou’reaskingthemtodo• EnsurestudentsseetherelaXonshipbetweenthetopicandcourse
content.• Incorporategroupwork.• Makeitclearhowtheuseofdatafitsintotheprocessofscience.• Uselocalexamples.
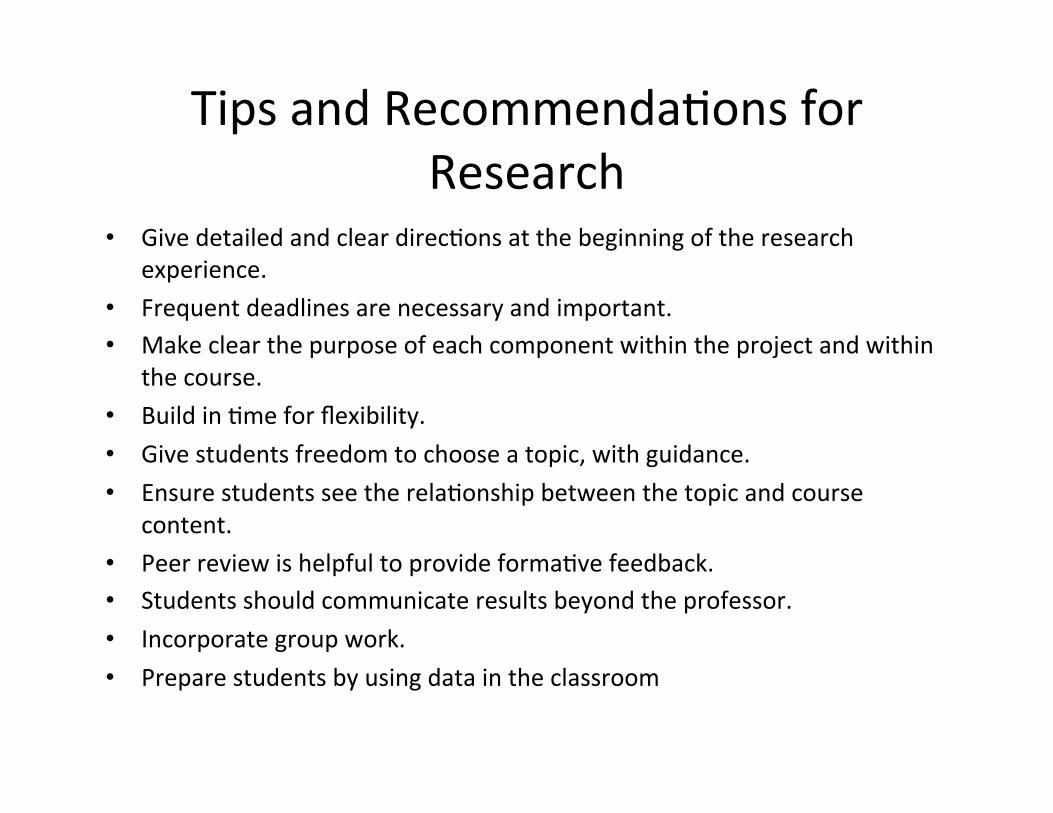
TipsandRecommendaXonsforResearch
• GivedetailedandcleardirecXonsatthebeginningoftheresearchexperience.
• Frequentdeadlinesarenecessaryandimportant.• Makeclearthepurposeofeachcomponentwithintheprojectandwithin
thecourse.• BuildinXmeforflexibility.• Givestudentsfreedomtochooseatopic,withguidance.• EnsurestudentsseetherelaXonshipbetweenthetopicandcourse
content.• PeerreviewishelpfultoprovideformaXvefeedback.• Studentsshouldcommunicateresultsbeyondtheprofessor.• Incorporategroupwork.• Preparestudentsbyusingdataintheclassroom

IndividualreflecXon
• Thinkofexamplesdatasetstopresentinclass• Thinkofpossibleresearchprojectstoincorporateinaclassroom– Whatlevelofclass?– Howlongfordiscussion?– Whatwillthestudentsactuallydo?Willtheywrite,dohomework,sharesomething
Developsomethingthatwillworkbestforyou!

AddiXonalResources
• OntheCuingEdgeUndergraduateResearchasTeachingPracXce(hTp://serc.carleton.edu/NAGTWorkshops/undergraduate_research/index.html)
• CouncilforUndergraduateResearch(CUR);OntheCuingEdgeTeachingwithData,SimulaXons,andModels(hTp://serc.carleton.edu/NAGTWorkshops/data_models/index.html)