Embed Size (px)
Citation preview

British Journal of Science 42
January 2012, Vol. 3 (1)
© 2011 British Journals ISSN 2047-3745
The Development of the Geologic Model of the Gongola Basin Depositional Sequence
Using Lithofacies Map
E.E.Epuh*, D. O.Olorode** P.C. Nwilo, C. U Ezeigbo
* Department of Surveying and Geoinformatics, University of Lagos
** Physics Department, University of Lagos
Abstract
Seven horizons representing the six stratigraphic units and the top basement of the basin were picked from
the seismic sections for mapping and lithofacies analysis. The lithofacies parameters such as lithology
thickness, interval and depth normalized interval velocities, density, reflection coefficients and acoustic
impedances were determined using the sonic log, checkshot curves and the iterative depth algorithm (IDA)
process. In order to obtain a subtle gradation of the lithofacies, they maps were produced using patterns.
The various pattern observed on the maps show the areal distribution of the facies in each stratigraphic unit.
The delineation of the maps helped in the development of a geologic model of the basin depositional
sequence. The basin shows the progradation of sand towards the northwest part of the project area at the
prospect horizon; with sand thickness and reservoir quality increasing in the southeast direction. This is as a
result of the sand nourishment provided by the presence of Gaji and Kolmani River. The basin predominantly
shows a combination of laterally and vertically gradational sequence with some parts also exhibiting the
presence of intertonguing sequence.
Keywords: Lithofacies, interval velocity, depth normalized interval velocity, progradation, Gongola basin
1.0 Introduction
As subsurface mapping techniques develop further, it becomes conventional to examine not only the areal
distribution of stratigraphic units beneath an unconformity, but also to examine the kinds of rock units
beneath that unconformity. It is observed that no single number, symbol or code shown on a map can
completely express all the compositional aspects of a stratigraphic section. The variety of rock types present,
their repeated positions on the stratigraphic interval, and their varying thicknesses of the beds from top to
bottom of the section represent complex interrelationships that require maps especially designed to bring out
features of importance in a given study. In this study, lithofacies maps were produced with distinct pattern
representing variations of rock compositions within a given stratigraphic unit. Facies map show the areal
variation in every aspect of a stratigraphic unit. When the facies maps are based on lithological attributes,
they are called lithofacies maps. Lithofacies are defined as the sum total of the lithological aspects of
stratigraphic units in a particular place (Reijers, 1995). A lithofacies describes a rock unit in terms of a set of
lithological features which are related to one or more depositional process ongoing in time. In this research,
the lithofacies maps were used to define the upper and lower bed boundary in time at which the depositional
process changed.
1.1 Geology of the Basin
The area under investigation can be classified into two broad geological regions namely: the Basement
Complex and the sedimentary formations.
British Journal of Science 43
January 2012, Vol. 3 (1)
© 2011 British Journals ISSN 2047-3745
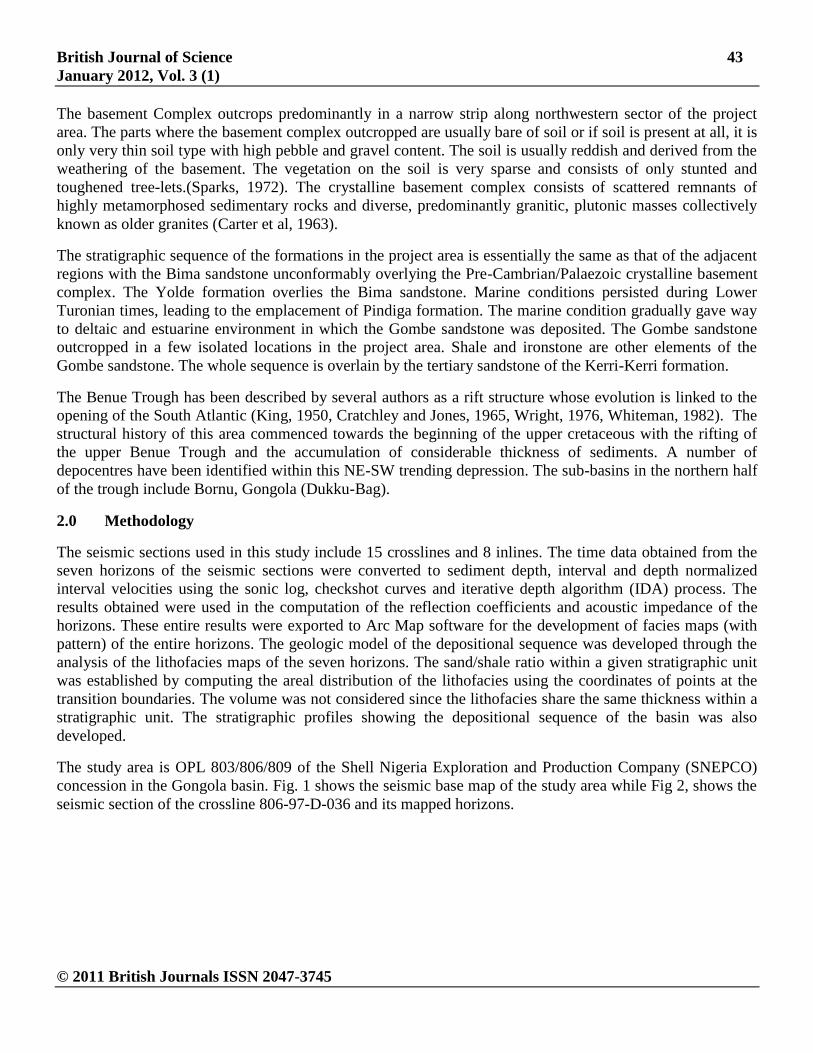
The basement Complex outcrops predominantly in a narrow strip along northwestern sector of the project
area. The parts where the basement complex outcropped are usually bare of soil or if soil is present at all, it is
only very thin soil type with high pebble and gravel content. The soil is usually reddish and derived from the
weathering of the basement. The vegetation on the soil is very sparse and consists of only stunted and
toughened tree-lets.(Sparks, 1972). The crystalline basement complex consists of scattered remnants of
highly metamorphosed sedimentary rocks and diverse, predominantly granitic, plutonic masses collectively
known as older granites (Carter et al, 1963).
The stratigraphic sequence of the formations in the project area is essentially the same as that of the adjacent
regions with the Bima sandstone unconformably overlying the Pre-Cambrian/Palaezoic crystalline basement
complex. The Yolde formation overlies the Bima sandstone. Marine conditions persisted during Lower
Turonian times, leading to the emplacement of Pindiga formation. The marine condition gradually gave way
to deltaic and estuarine environment in which the Gombe sandstone was deposited. The Gombe sandstone
outcropped in a few isolated locations in the project area. Shale and ironstone are other elements of the
Gombe sandstone. The whole sequence is overlain by the tertiary sandstone of the Kerri-Kerri formation.
The Benue Trough has been described by several authors as a rift structure whose evolution is linked to the
opening of the South Atlantic (King, 1950, Cratchley and Jones, 1965, Wright, 1976, Whiteman, 1982). The
structural history of this area commenced towards the beginning of the upper cretaceous with the rifting of
the upper Benue Trough and the accumulation of considerable thickness of sediments. A number of
depocentres have been identified within this NE-SW trending depression. The sub-basins in the northern half
of the trough include Bornu, Gongola (Dukku-Bag).
2.0 Methodology
The seismic sections used in this study include 15 crosslines and 8 inlines. The time data obtained from the
seven horizons of the seismic sections were converted to sediment depth, interval and depth normalized
interval velocities using the sonic log, checkshot curves and iterative depth algorithm (IDA) process. The
results obtained were used in the computation of the reflection coefficients and acoustic impedance of the
horizons. These entire results were exported to Arc Map software for the development of facies maps (with
pattern) of the entire horizons. The geologic model of the depositional sequence was developed through the
analysis of the lithofacies maps of the seven horizons. The sand/shale ratio within a given stratigraphic unit
was established by computing the areal distribution of the lithofacies using the coordinates of points at the
transition boundaries. The volume was not considered since the lithofacies share the same thickness within a
stratigraphic unit. The stratigraphic profiles showing the depositional sequence of the basin was also
developed.
The study area is OPL 803/806/809 of the Shell Nigeria Exploration and Production Company (SNEPCO)
concession in the Gongola basin. Fig. 1 shows the seismic base map of the study area while Fig 2, shows the
seismic section of the crossline 806-97-D-036 and its mapped horizons.

British Journal of Science 44
January 2012, Vol. 3 (1)
© 2011 British Journals ISSN 2047-3745
R.
Ga
ji
R.
Ko
lma
ni
L E G E N D
S e is m ic Line s
Rive r
N
Figure 1: Seismic Base map (Source: SNEPCO)

British Journal of Science 45
January 2012, Vol. 3 (1)
© 2011 British Journals ISSN 2047-3745
Fi
g. 2: Line 806-97-D-36 showing the horizons used for Lithofacies analysis
3.0 Results and Analysis
3.1 Results
The lithofacies maps obtained from each horizon are shown in Figures 3 to 9 respectively. Each of the maps
shows the variation and areal distribution of the lithofacies within a given stratigraphic unit.
3.2 Lithofacies Map Analyses
From the lithofacies maps, the following are inferred:
i. Horizon H1 This horizon shows lithofacies variations in all the project area. This is as a result of the influence of
geomorphology. The lithology is indicated as the combination of shale and sandstone and this falls
within the Kerri-Kerri stratigraphic formation. The sediment thickness is 500m (between the surface
and depth of 500m). The sand/shale ratio is estimated as 7:3 within the unit. The lithofacies map of
this horizon is shown in Fig 3
Basement/G
Top
Basement
Hr 5/E
Hr 4/D
HR 3
Hr 2/B
HR 1
HR 6
HR 4
HR 2
HR 5

British Journal of Science 46
January 2012, Vol. 3 (1)
© 2011 British Journals ISSN 2047-3745
ii. Horizon H2 and H3 At these horizons, the lithofacies are uniform. They horizons show similar lithofacies variations
because they have the same rate of sedimentation and cementation. The dominant lithology is shale
which is shown in green colour with little presence of dolomite. These horizons fall within the
Gombe and Pindiga stratigraphic formations. The sediment thickness is 1600m (between the depth of
500m and 2100m respectively). The sand/shale ratio is estimated as 9:1 within the unit. The
lithofacies maps of these horizons are shown in Fig 4 and 5.
iii. Horizon H4 At this horizon, the upper part of the project area, beyond the Gaji River (from inline 806-97-D-047)
shows area of shale dominant lithology. This is shown in green colour. Lead L-A closure which was
identified in the time and depth structural maps disappears at this horizon because of the dominant
presence of impermeable shale sediments. Lead L-B which lies in the Kolmani River shows the
dominant presence of dolomite (gas sand). The gas sand is shown in white colour within the dolomite
zone, while the dolomite is shown in brown colour. The variable patterns within the lead L-B
lithofacies are as a result of differential sedimentation, cementation and compaction caused by the
presence of Gaji and Kolmani Rivers. This also indicates the lateral variation in porosity and
permeability of within the lead. This horizon lies within the Yolde stratigraphic formation. The
sediment thickness is 600m (between the depths of 2100m and 2700m respectively). The sand/shale
ratio is estimated as 4:6 within the unit. The lithofacies map of this horizon is shown in Fig 6.
iv. Horizon H5
At this horizon, there is progradation of dolomite towards the northwest part of the project area with
the progradation terminating at inline 806-97-D-045. The lithology is identified as dolomite and
shale. The horizon lies within the Bima stratigraphic formation The sediment thickness is 700m
(between the depths of 2700m and 3400m respectively). The sand/shale ratio is estimated as 6:4
within the unit. The lithofacies map of this horizon is shown in Fig 7
v. Horizon H6
At horizon H6, the dolomite progradation has moved up to inline 806-97-D-041. The lithofacies
patterns show distinct segmentation caused by variable progradation towards the northwest part of the
project area. The dolomite and shale lithological units are segmented because the sediments were
distributed and accumulated with changing energy pattern. This horizon lies within the Bima
stratigraphic formation. The sediment thickness is 1800m (between the depths of 3400m and 5200m
respectively). The sand/shale ratio is estimated as 9:1 within the unit. The lithofacies map of this
horizon is shown in Fig 8.
vi. Top basement
At this horizon, the lithofacies variation is erratic, and it covers the entire project area. This can be
visualized using the erratic colour variation exhibited on the map. The lithology is identified as
gneiss. The sediment depth is 5200m. The map is shown in Fig 9.
The six stratigraphic sequences of the basin are shown in Fig 10.

British Journal of Science 47
January 2012, Vol. 3 (1)
© 2011 British Journals ISSN 2047-3745
3.2.2 Depositional Sequence Analysis of the Leads
Two leads L-A and L-B were recognized between horizon H4 and H6 in the time and depth structural maps.
Their lithofacies analyses are discussed below.
a. The Garin Habu Lead: The depositional pattern is one of thinning of sand from southeast to
northwest part in a downlap fashion. These units thin in the same direction over a wide region without
regard to the local structure. This shows a regional pattern involving landward edge of deposition,
with the thinning caused mainly by starvation because of remoteness from the source (Rivers
Kolmani and Gaji). The sediments are shale which is fine-grained sediments that lack permeability
and are not of reservoir quality. The closures obtained in the structural (time and depth) maps
vanished in the interval, depth normalized interval velocity and lithofacies maps. From this, it could
be inferred that the structural closure in lead L-A is found to be a result of velocity gradient rather
than hydrocarbon accumulation.
b. The Kolmani River Lead: Further evaluation of the interval and depth normalized interval velocities
and lithofacies map shows clearly the presence of gas sand. The depositional pattern is one of
thickening of sand from northwest to southeast in a downlap fashion. These units thicken in the same
direction over a wide region with regard to the local structure. This shows a regional pattern
involving landward edge of deposition, with the thickening caused mainly by nourishment provided
by its closeness to the source (Rivers Kolmani and Gaji). The sand sediments are coarse sediments
(Dolomite) that have permeability and are of good reservoir quality.
The gradual spread out of the divergent reflections as shown in the crosslines sections (Fig 2: 806-97-D-036)
in the dip directions indicates the areal variation in the rate of deposition, progressive tilting, differential
basin subsidence and faulting which resulted in the gradual tilting of the basin in the eastern direction.
The channel fill sand bars present in the lead L-B are generated by the fluvial process of Rivers Gaji and
Kolmani with channel cut and then channel fill and valley fill which resulted in stream channels migrating
laterally. The lateral accretion point bars deposits which fills the entire channel from the base to flood plain
level gradually fills the latter. During successive floods by the Gaji and Kolmani Rivers, different lithologies
were deposited which grade upward into flood plain ooze and yield the stratigraphy of the basin sequence
beginning at the top.
Based on the above depositional process, the channel fill sand bars found in the Gongola basin possess the
following features as displayed on the crosslines seismic sections.
a. Shape: It is observed that the channel fill sand bars have flat top with an asymmetric plano-convex
base that is perpendicular to the paleodepositional strike. The axes of the grains are parallel to the
channel axis. The sand thickness was at the expense of the overlying shale with thickness increasing
toward the basin in the west-east direction. This can be seen using seismic sections from the cross
lines.
b. Internal structure: The horizontal trough stratification (constant thickness of horizontal strata is
fairly common) within horizon H1 and H2 respectively. The basin is asymmetrically filled with
thickness divergence toward axis. This is common because of the differential tilting and oscillations
of the flood plain. The pre-compaction cut and fill shows no deformation of the lower time marker,
however, compaction deformation of upper time marker is identified.

British Journal of Science 48
January 2012, Vol. 3 (1)
© 2011 British Journals ISSN 2047-3745
From the Lithofacies maps, the underlying geometry of the stratigraphic units and the pattern of their areal
variation in lithology are easily visualized. Also, the lithofacies boundaries are easily classified and
mappable. The inference obtained from the analysis of the lithofacies maps of each horizon led to the
development of the geologic model of the depositional sequence of the basin which is shown in Fig 9. It
shows that the progradation is towards the northwest of the project area. It also shows the decrease in grain
size with an increase in the thickness of shale towards the direction of progradation. The reservoir quality
increases towards the southeast with an increase in sand thickness.
4.0 Summary of Findings
The application of patterns in this research has helped in the classification of lithofacies boundaries in terms
of the following:
i. Determination of boundaries at sharp lithologic contacts and laterally gradational sequence.
ii. Determination of alternative boundaries in a vertically gradational sequence.
iii. Determination of possible boundaries for laterally intertonguing sequence.
iv. Determination and possible classification of parts of an intertonguing sequence.
Also, in using the patterns as produced by the Arc Map software, the following risks were avoided:
i. Description of the lithofacies using irrelevant details
ii. Missing out critical parameters within the lithofacies.
iii. Inconsistency in describing similar lithofacies in various parts of a stratigraphic unit and the entire
project area.
iv. The determination of the areal distribution and the transition zones of the lithofacies.
5.0 Conclusion
It is clear that there is no unique seismic signature for each lithofacies and sedimentary environment.
However, the application of pattern recognition in the delineation of lithofacies makes it easy to identify
variations within a given stratigraphic unit. It also helps in mapping the lithofacies boundaries in three
dimensions (3D) with the fourth attribute been the colour pattern (C) for distinction. This approach could be
expressed as a 3D+C pattern. The integration of the 3D+C approach with the numbers, codes and symbols on
a map will aid in a better definition of the lithofacies within a given stratigraphic unit.

British Journal of Science 49
January 2012, Vol. 3 (1)
© 2011 British Journals ISSN 2047-3745
Fig 3 : Horizon H1 Lithofacies Map showing the various sand and shale pattern

British Journal of Science 50
January 2012, Vol. 3 (1)
© 2011 British Journals ISSN 2047-3745
Fig 4: Horizon H2 Lithofacies Map showing the various sand and shale pattern

British Journal of Science 51
January 2012, Vol. 3 (1)
© 2011 British Journals ISSN 2047-3745
Fig 5: Horizon H3 Lithofacies Map showing the various sand and shale pattern

British Journal of Science 52
January 2012, Vol. 3 (1)
© 2011 British Journals ISSN 2047-3745
Fig 6: Horizon H4 Lithofacies Map showing the various dolomite and shale pattern and the gas
locations.
Kolmani
River Gas
Prospect
Location
Shale
Dolomite

British Journal of Science 53
January 2012, Vol. 3 (1)
© 2011 British Journals ISSN 2047-3745
Fig 7: Horizon H5 Lithofacies Map showing the various dolomie and shale pattern
Kolmani
River
Prospect

British Journal of Science 54
January 2012, Vol. 3 (1)
© 2011 British Journals ISSN 2047-3745
Fig 8: Horizon H6 Lithofacies Map showing the dolomite and shale with their variable energy
distribution pattern.
Fig 9: Top Basement Lithofacies Map showing the various Gneiss and shale pattern

British Journal of Science 55
January 2012, Vol. 3 (1)
© 2011 British Journals ISSN 2047-3745
Fig. 10: Lithostratigraphic Sequence from H1 down to Top Basement)
Shale thickens
Basement
Sand thickens
Reservoir Quality
increases
Progradation
Grain sizedecreases
NW
Depositional
Strike
Gneiss/Granite
N
H1
H2
H3
H4
H5
H6
Top Basement

British Journal of Science 56
January 2012, Vol. 3 (1)
© 2011 British Journals ISSN 2047-3745
Fig. 11: Geologic Model of the Gongola Basin Depositional Sequence
Acknowledgement
We thank Shell Nigeria Exploration and Production Company for the release of the data used in this research.
Bibliography
Al Chalabi, M., (1974), An Analysis of Stacking rms Average and Interval Velocities over a Horizontally
Layered Ground, Gophys Prosp., v22, p458-475.
Avasthi, D. N and Verma, S. K (1973): Analysis of the Statistical Structure of Seismic Reflection for
Delineation of Stratigraphic Traps for Oil, Symposium on Recent Trends in Exploration of Minerals, Oil and
Ground Water, New Delhi, India
Avbordo, A A(1978): Geology and Hydrocarbon Productive Trends 0f Southern Nigeria Basin. The Oil and
Gas Journal. Pg 90-93.
Badley, M. E, Anstey, N. A (1988) : Seismic Contouring GP 502. Exploration Geophysics. 201p
Beck, A. E (1981): Physical Principles of Exploration Methods. Macmillian Press Limited, London. 234p
Bishop, T. N; Bube, K. P.; Cutler, R. T.;Langan, R. T.; Love, P. L.; Resnick, J. R.; Shuey, R. T.; Spindler, D.
A. and Wyld, H. W. (1985). Tomographic determination of velocity and depth in laterally varying media;
Geophysics50, 903-923.
Carter, M. D and Siraki, E. S (1993): Velocity Interpretation and Depth Conversion. Exploration Geophysics.
GP504: 141p
Chen, C. U. (1978): Seismic Pattern Recognition, Geoexploration, Elservier, Amsterdam
Chiu, S. K; Kanasewich, E. R.; and Phadke, S. (1986): Three – dimensional determination of structure and
velocity by seismic tomography: Geophysics, 51. 1559-1571.
Bhaskara Rao, D. (1990): Analysis of Gravity Anomalies of Sedimentary Basin By Trapezoidal Model
Cotton, R and Pohlman, J (1992): 3-D Field Work and Processing 3-D Interpretation. Exploration
Geophysics. GP 702/704. 132p.
Dix, C. H., 1995, Seismic velocities from surface measurements: Geophysics, 20, 68-86.
Dobrin, M. B (1980): Geophysical Prospecting. McGrawhill Book Company, New York.
Dobrin, M. B (1977): Seismic Exploration for Stratigraphic Traps, in AAPG Memeoir no 26, Ed. C. E.
Payton, 516p.
Gardner, G. H. F, Gardner, L. W. and Gregory, A. W. (1974): Formation Velocity and Density- the
Diagnostic Basis for Stratigraphic Traps, Geophysics, v39, p770-780.
Gardner, G.H.F., (1985), Migration of seismic data: Geophysics reprint series. No. 4: Soc. Expl. Geophys.

British Journal of Science 57
January 2012, Vol. 3 (1)
© 2011 British Journals ISSN 2047-3745
Gerristma, P.H. A., (1977): Time – to – depth conversion in the presence of structure: Geophysics, 42. 760-
772.
Grant, F. S, West, G. F (1987): Interpretation Theory In Applied Geophysics. McGrawhill Book Company,
Toronto.
Hossack, J.R., (1979), The Use Of Balanced Cross – Sections In The Calculation Of Orogenic Contraction:
A review: J. Geol. Soc. London, 136, 705-711.
Hron, P., 1977, Time migration – some ray theoretical aspects: Geophys. Props., 25. 738-745.
Kennett, B. L and Harding, A. J. (1985). Is ray theory adequate for reflection seismic modeling? (a survey of
modeling methods)
Levin, F. K.,(1971). Apparent Velocity From Dipping Interface Reflections: Geophysics, 36. 510-516.
May. B.T., and Covey, J.D., (1981). An Inverse Ray Method For Computing Geoloe Structures From
Seismic Reflections – ero – offset case: Geophysics. 46, 268-287.
Melran, D. C, Siraki, E. S, Douglas, J. C (1993) Velocity Interpretation and Depth Conversion. Exploration
Geophysics Series GP 504.
Phil, Schultz (1998) the Seismic Velocity Model As an Interpretation Asset. Society Of Exploration
Geophysics, Tulsa, USA.
Rider, M. H. (2006). The Geological Interpretation of Well Logs. .Rider-French Consulting Ltd, Sutherland,
Scotland.280p.
Shah, P. M., (1973), Ray Tracing In Three Dimensions: Geophysics, 38, p600-604.
Sherrif, R. E (1975): Factors Affecting Seismic Amplitudes., Geophys Prosp, v23, p125-138.
Sherrif, R. E (1976): Inferring Stratigraphy from Seismic Data, Bull AAPG, v60, p528-542
Sherrif, R. E (1987): Seismic Stratigraphy . International Human Resources Development Corporation,
Boston, USA.p227
Shuey, T. N., Bube, K.P., Culter, R. T. Langan, R.T., Love, P.L., Resnick, J.R., velocity and depth in
laterally varying media: Geophysics, 50, 903-923.
Sinvhal, A ,Sinvhal, H (1992) Seismic Modeling and Pattern Recognition In Oil Exploration. Kluwer
Academic Publisers, Netherland. 178p
Skeen, P.M., (1983). Seismic Models And Interpretation Of The Caspar Arch Thrust: Application to Rocky
Mountain foreland structure: in Lowell. J.D., Ed., Rocky
Mountain foreland busins and uplifts: Rocky Mountain Assn. Geologists, 99-124.
Taner, M. T.; Cook, E. E., and Neidell, N. S (1970) Limitations of the seismic reflection methods- Lessons
from computer simulations: Geophysics, 35.551-573.

British Journal of Science 58
January 2012, Vol. 3 (1)
© 2011 British Journals ISSN 2047-3745
Telford, W.M, Geldart, C. P, Sheriff, R. T, Keys, D. A (1990): Applied Geophysics. Cambridge University
Press.584p
Toby, D (2005). Well Logging and Formation Evaluations. Elsevier Inc. USA.
Turker, P. M, Yorston, H. H (1985): Pitfalls In Seismic Interpretation. Society of Exploration Geophysicist ,
Oklahoma.
Wason, C.B. Black, J. I., and King. G.A. (1984), Seismic Modeling And Inversion: Proe, Inst. Elect.
Electron. Eng. 72. 1385-1393.
Northeast
Asia Trade
tower, South
Korea, 2006.
J
n – Mao
tower,
Shanghai,
China 2000.