Embed Size (px)
Citation preview
LUND UNIVERSITY
PO Box 117221 00 Lund+46 46-222 00 00
Brittle Failure Modes in Nailed Steel Plate Connections
Danielsson, Henrik; Crocetti, Roberto; Gustafsson, Per-Johan; Serrano, Erik
Published in:World Conference on Timber Engineering 2016
2016
Document Version:Publisher's PDF, also known as Version of record
Link to publication
Citation for published version (APA):Danielsson, H., Crocetti, R., Gustafsson, P-J., & Serrano, E. (2016). Brittle Failure Modes in Nailed Steel PlateConnections. In World Conference on Timber Engineering 2016
Total number of authors:4
General rightsUnless other specific re-use rights are stated the following general rights apply:Copyright and moral rights for the publications made accessible in the public portal are retained by the authorsand/or other copyright owners and it is a condition of accessing publications that users recognise and abide by thelegal requirements associated with these rights. • Users may download and print one copy of any publication from the public portal for the purpose of private studyor research. • You may not further distribute the material or use it for any profit-making activity or commercial gain • You may freely distribute the URL identifying the publication in the public portal
Read more about Creative commons licenses: https://creativecommons.org/licenses/Take down policyIf you believe that this document breaches copyright please contact us providing details, and we will removeaccess to the work immediately and investigate your claim.
BRITTLE FAILURE MODES IN NAILED STEEL PLATE CONNECTIONS
Henrik Danielsson1, Roberto Crocetti2, Per Johan Gustafsson3, Erik Serrano4
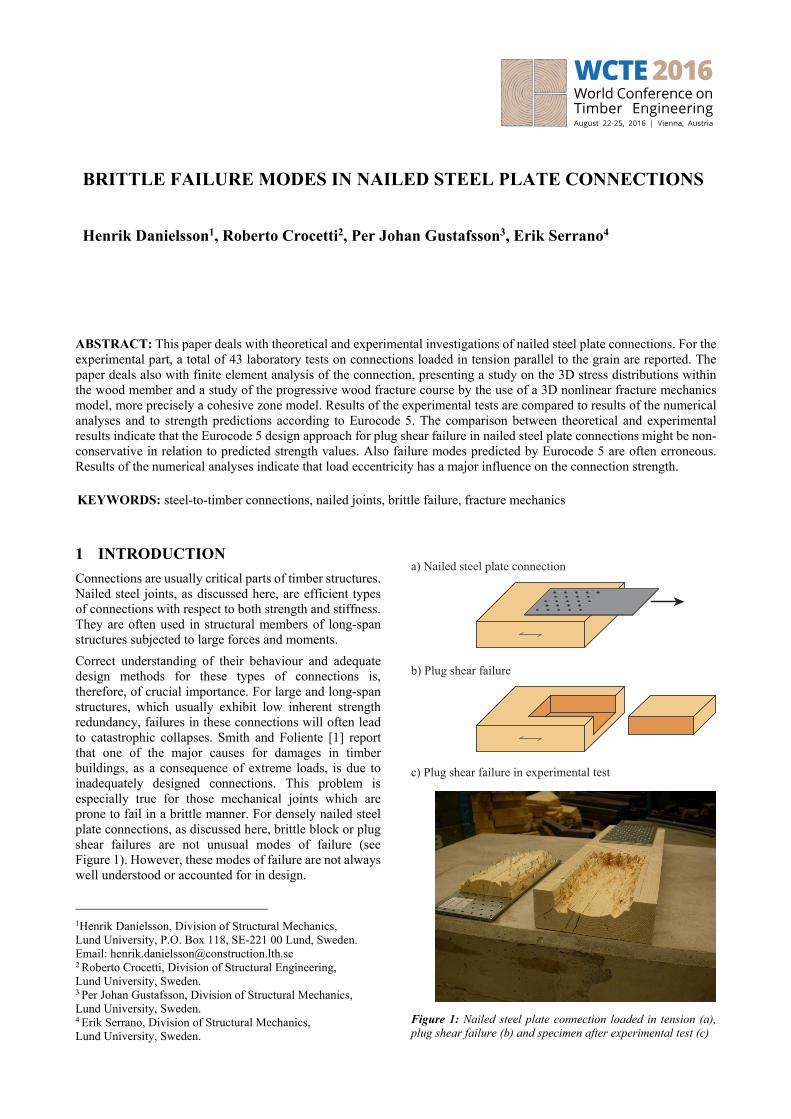
ABSTRACT: This paper deals with theoretical and experimental investigations of nailed steel plate connections. For the experimental part, a total of 43 laboratory tests on connections loaded in tension parallel to the grain are reported. The paper deals also with finite element analysis of the connection, presenting a study on the 3D stress distributions within the wood member and a study of the progressive wood fracture course by the use of a 3D nonlinear fracture mechanics model, more precisely a cohesive zone model. Results of the experimental tests are compared to results of the numerical analyses and to strength predictions according to Eurocode 5. The comparison between theoretical and experimental results indicate that the Eurocode 5 design approach for plug shear failure in nailed steel plate connections might be non-conservative in relation to predicted strength values. Also failure modes predicted by Eurocode 5 are often erroneous. Results of the numerical analyses indicate that load eccentricity has a major influence on the connection strength. KEYWORDS: steel-to-timber connections, nailed joints, brittle failure, fracture mechanics 1 INTRODUCTION
Connections are usually critical parts of timber structures. Nailed steel joints, as discussed here, are efficient types of connections with respect to both strength and stiffness. They are often used in structural members of long-span structures subjected to large forces and moments.
Correct understanding of their behaviour and adequate design methods for these types of connections is, therefore, of crucial importance. For large and long-span structures, which usually exhibit low inherent strength redundancy, failures in these connections will often lead to catastrophic collapses. Smith and Foliente [1] report that one of the major causes for damages in timber buildings, as a consequence of extreme loads, is due to inadequately designed connections. This problem is especially true for those mechanical joints which are prone to fail in a brittle manner. For densely nailed steel plate connections, as discussed here, brittle block or plug shear failures are not unusual modes of failure (see Figure 1). However, these modes of failure are not always well understood or accounted for in design.
1Henrik Danielsson, Division of Structural Mechanics, Lund University, P.O. Box 118, SE-221 00 Lund, Sweden. Email: [email protected] 2 Roberto Crocetti, Division of Structural Engineering, Lund University, Sweden. 3 Per Johan Gustafsson, Division of Structural Mechanics, Lund University, Sweden. 4 Erik Serrano, Division of Structural Mechanics, Lund University, Sweden.
Figure 1: Nailed steel plate connection loaded in tension (a), plug shear failure (b) and specimen after experimental test (c)
a) Nailed steel plate connection
b) Plug shear failure
c) Plug shear failure in experimental test
2 BACKGROUND
It is desirable to design a nailed steel plate connection so as to obtain a ductile failure mode. It is also desirable to be able to, preferably in an analytical way, establish the criteria necessary to avoid brittle failure modes. The possible ultimate failure modes for dowel type connections loaded parallel to grain are referred to as: a) row shear (usually not for nails, but for larger bolts),
b) plug shear or block shear (two similar modes involving group tear-out of the wooden piece within the nailed area),
c) bearing or embedding crushing (with or without nail yielding),
d) splitting (along the row of nails, especially in case of no pre-drilling).
All these modes represent brittle failure except the mode associated with bearing failure. Johnsson and Stehn [2] report that for nailed joints, bearing and plug shear failure modes dominate for loading in tension parallel to the grain. Plug shear failure involves crack development along the sides of the plug (part of the nail group perimeter), tensile rupture at the rear end of the nail group, and a shear crack along the bottom face joining the two side cracks [3]. Block shear failure is similar, however without the shear crack along the bottom face. Experimental tests presented by Johnsson [4] suggest that the plug shear failure is commonly initiated at the nail farthest from the free end of the wood member. To avoid splitting during nailing and in order to prevent brittle failures, Eurocode 5 (EC 5) [5] provides minimum nail spacing distances. However, from testing experience it is known that these nail spacing requirements are not always sufficient to exclude brittle failures [4]. Wood strength prediction models for design purposes need to be sufficiently accurate and reliable, but also sufficiently easy to use for the practising engineer. Over the years, a number of different models for calculation of strength with respect to plug shear failure of nailed steel plate connections loaded parallel to grain have been suggested. The faces of the failed volume are commonly assumed to be loaded in either pure tension (back face of the plug) or in pure shear (bottom and side faces of the plug). The models are typically based on either the minimum, the maximum or the summation of the capacities of the faces of the torn out wood plug, see e.g. [6], [7], [8] and [9] for different models and [3] for an overview of models. As pointed out by Zarnani and Quenneville in [9] and shown by Johnsson in [3], the differences between the strength predictions models result in disagreements between experimentally found strength values and model predictions.
A new design method for timber riveted connections has recently been presented by Zarnani and Quenneville [9] (including also perpendicular to grain loading). In this method, the portion of the total load carried by each of the relevant fracture planes is determined based on the relative stiffness of the adjacent wood block. The connection strength can then be determined by consideration of the resisting capacities of the relevant fracture planes in combination with possible failure modes. 3 AIM AND OVERVIEW OF PAPER
This paper concerns brittle failure modes in nailed steel plate connections. Comprehensive experimental testing of this type of connection was carried out at Lund University and test results are reported by Asimakidis in [10]. The studies comprised investigations of nail pattern, number of nails, nail length and other parameters. Included in the test programme were eight test series which were designed in order to study brittle wood plug shear failure. These eight test series are considered within the work presented here. The overall aim of the study presented here is to gain knowledge about the mechanical behaviour and strength of nailed steel plate connections with respect to plug shear failure. Specific objectives include investigation of the stress distributions within the considered connection and how these distributions are influenced by geometry and material properties. Also the progressive wood fracture course at plug shear failure is studied by the use of nonlinear fracture mechanics. Experimental test results are presented and compared to theoretical strength predictions according to EC 5 [5] and according to linear and nonlinear 3D finite element (FE) analysis. The experimental test setup, test method, materials and tests results in terms of global strength are presented in Section 4. Predicted strengths with respect to brittle failure (plug shear) and ductile failure (nail yielding and embedment) according to EC 5 are also presented. The theoretical work regarding FE-analysis is presented in Section 5, including comparison between experimental and theoretical results in terms of connections strength. The theoretical work includes 3D linear elastic stress analysis and wood fracture simulation by the use of a 3D nonlinear fracture mechanics model, a cohesive zone model. General results are presented and discussed in Section 6 and some concluding remarks are finally given in Section 7.
4 EXPERIMENTAL WORK
4.1 TEST SETUP AND MATERIALS
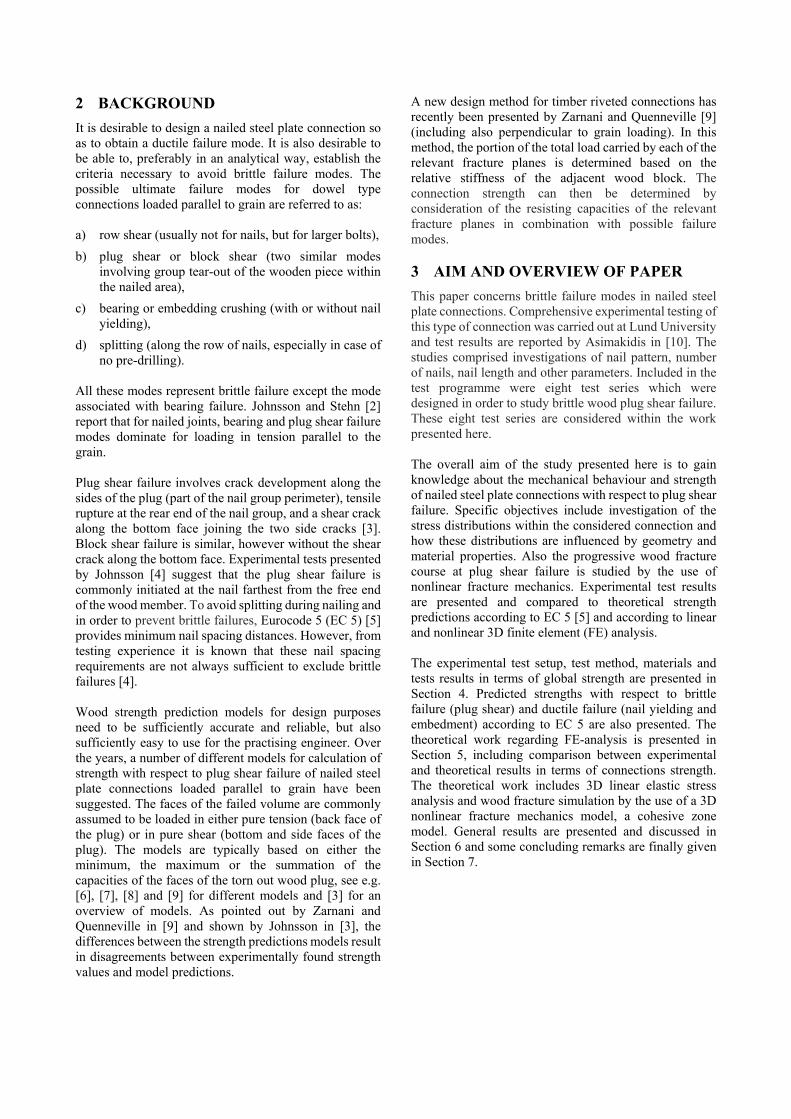
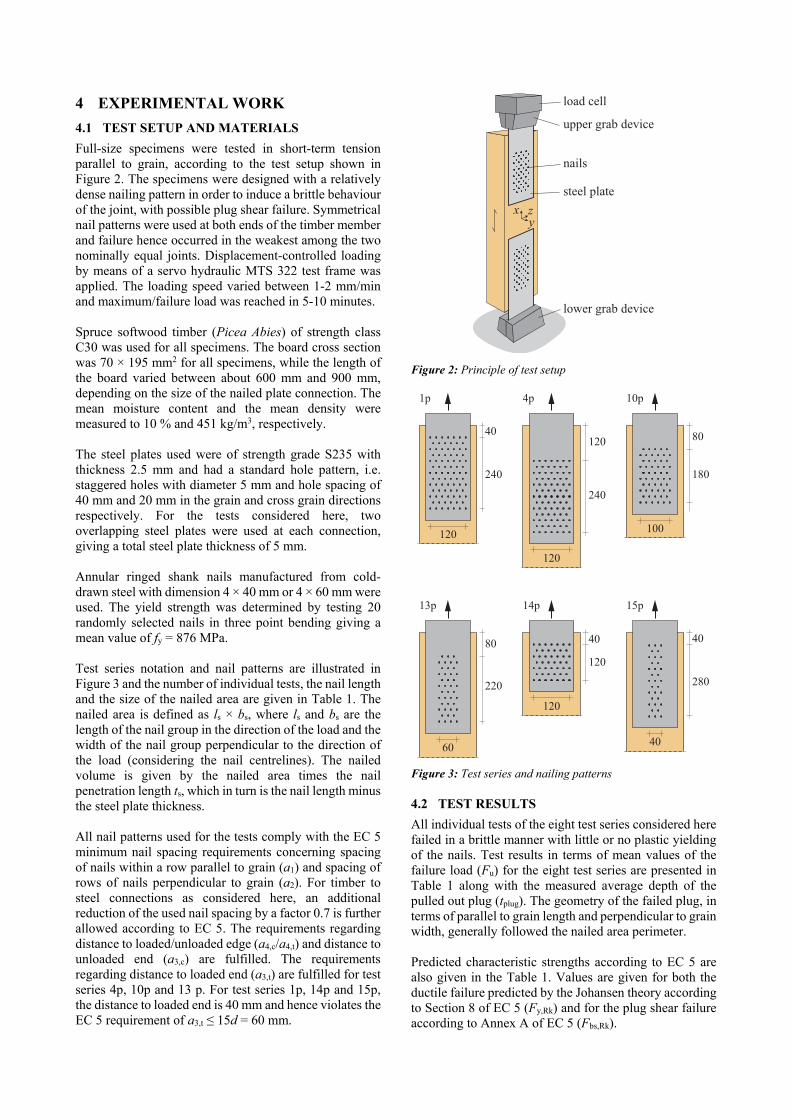
Full-size specimens were tested in short-term tension parallel to grain, according to the test setup shown in Figure 2. The specimens were designed with a relatively dense nailing pattern in order to induce a brittle behaviour of the joint, with possible plug shear failure. Symmetrical nail patterns were used at both ends of the timber member and failure hence occurred in the weakest among the two nominally equal joints. Displacement-controlled loading by means of a servo hydraulic MTS 322 test frame was applied. The loading speed varied between 1-2 mm/min and maximum/failure load was reached in 5-10 minutes. Spruce softwood timber (Picea Abies) of strength class C30 was used for all specimens. The board cross section was 70 × 195 mm2 for all specimens, while the length of the board varied between about 600 mm and 900 mm, depending on the size of the nailed plate connection. The mean moisture content and the mean density were measured to 10 % and 451 kg/m3, respectively. The steel plates used were of strength grade S235 with thickness 2.5 mm and had a standard hole pattern, i.e. staggered holes with diameter 5 mm and hole spacing of 40 mm and 20 mm in the grain and cross grain directions respectively. For the tests considered here, two overlapping steel plates were used at each connection, giving a total steel plate thickness of 5 mm. Annular ringed shank nails manufactured from cold-drawn steel with dimension 4 × 40 mm or 4 × 60 mm were used. The yield strength was determined by testing 20 randomly selected nails in three point bending giving a mean value of fy = 876 MPa. Test series notation and nail patterns are illustrated in Figure 3 and the number of individual tests, the nail length and the size of the nailed area are given in Table 1. The nailed area is defined as ls × bs, where ls and bs are the length of the nail group in the direction of the load and the width of the nail group perpendicular to the direction of the load (considering the nail centrelines). The nailed volume is given by the nailed area times the nail penetration length ts, which in turn is the nail length minus the steel plate thickness. All nail patterns used for the tests comply with the EC 5 minimum nail spacing requirements concerning spacing of nails within a row parallel to grain (a1) and spacing of rows of nails perpendicular to grain (a2). For timber to steel connections as considered here, an additional reduction of the used nail spacing by a factor 0.7 is further allowed according to EC 5. The requirements regarding distance to loaded/unloaded edge (a4,c/a4,t) and distance to unloaded end (a3,c) are fulfilled. The requirements regarding distance to loaded end (a3,t) are fulfilled for test series 4p, 10p and 13 p. For test series 1p, 14p and 15p, the distance to loaded end is 40 mm and hence violates the EC 5 requirement of a3,t ≤ 15d = 60 mm.
Figure 2: Principle of test setup
Figure 3: Test series and nailing patterns 4.2 TEST RESULTS
All individual tests of the eight test series considered here failed in a brittle manner with little or no plastic yielding of the nails. Test results in terms of mean values of the failure load (Fu) for the eight test series are presented in Table 1 along with the measured average depth of the pulled out plug (tplug). The geometry of the failed plug, in terms of parallel to grain length and perpendicular to grain width, generally followed the nailed area perimeter. Predicted characteristic strengths according to EC 5 are also given in the Table 1. Values are given for both the ductile failure predicted by the Johansen theory according to Section 8 of EC 5 (Fy,Rk) and for the plug shear failure according to Annex A of EC 5 (Fbs,Rk).
load cell
upper grab device
lower grab device
steel plate
nails
x zy
40
240
120
1p
120
240
120
4p
80
180
100
10p
80
220
60
13p
40
120
120
14p
40
280
40
15p
The contribution from the rope effect is taken into account, but limited to no more than 25 % of the capacity given by the Johansen theory. In order to design for a ductile failure mode, the joint capacity with respect to the brittle plug shear failure should be greater than the joint capacity with respect to nail yielding and/or embedment.
According to EC 5, the capacity with respect to plug shear failure is given by the maximum value of the capacity with respect to tensile failure at the back face of the plug, Ft,Rk, and the capacity with respect to shear failure long the along the bottom and/or side faces, Fv,Rk, according to
, = max , , , (1)
, = 0.7 , , (2)
, = 1.5 , , , (3)
where Anet,v and Anet,t are the assumed failure areas stressed in shear and tension, respectively, and are calculated based on the nail pattern and the governing mode of ductile nail failure predicted by the Johansen theory. The assumed net failure area for the tension failure, Anet,t, is based on the penetration length of the nail. The assumed net failure area for the shear failure, Anet,v, is instead based on either the nail penetration length or on the location of a potential plastic hinge being formed in the nail.
In addition to the geometry parameters stated in Section 4.1, characteristic capacities according to EC 5 stated in Table 1 are based on assumptions of ultimate strength of the nails fu = 600 N/mm2, characteristic timber density ρk = 380 kg/m3, characteristic timber tensile strength ft,0,k = 18 MPa and characteristic timber shear strength fv,k = 4.0 MPa. Contributions from the rope effect are based on assumption of characteristic withdrawal strength fax,k = 7.6 N/mm2 and on lengths of the threaded nail parts as tpen = 24 and 44 mm for the 40 and 60 mm nails, respectively.
Looking at the predicted strengths according to EC 5 given in Table 1, the capacity appears to be limited by nail yielding and hence a ductile failure mode for all test series except test series 1p. As mentioned above, all 43 individual tests however failed in a brittle manner by plug shear failure. It should be noted that the capacity according to EC 5 is given as the characteristic capacity, while the mean values of the experimental test results are presented in Table 1.
Since the nailed steel plate connections were only applied on one side of the timber member, see Figure 2, the member is exposed to eccentric loading. This load eccentricity seems not to be accounted for in the EC 5 strength model for plug shear failure. This issue if further commented below.
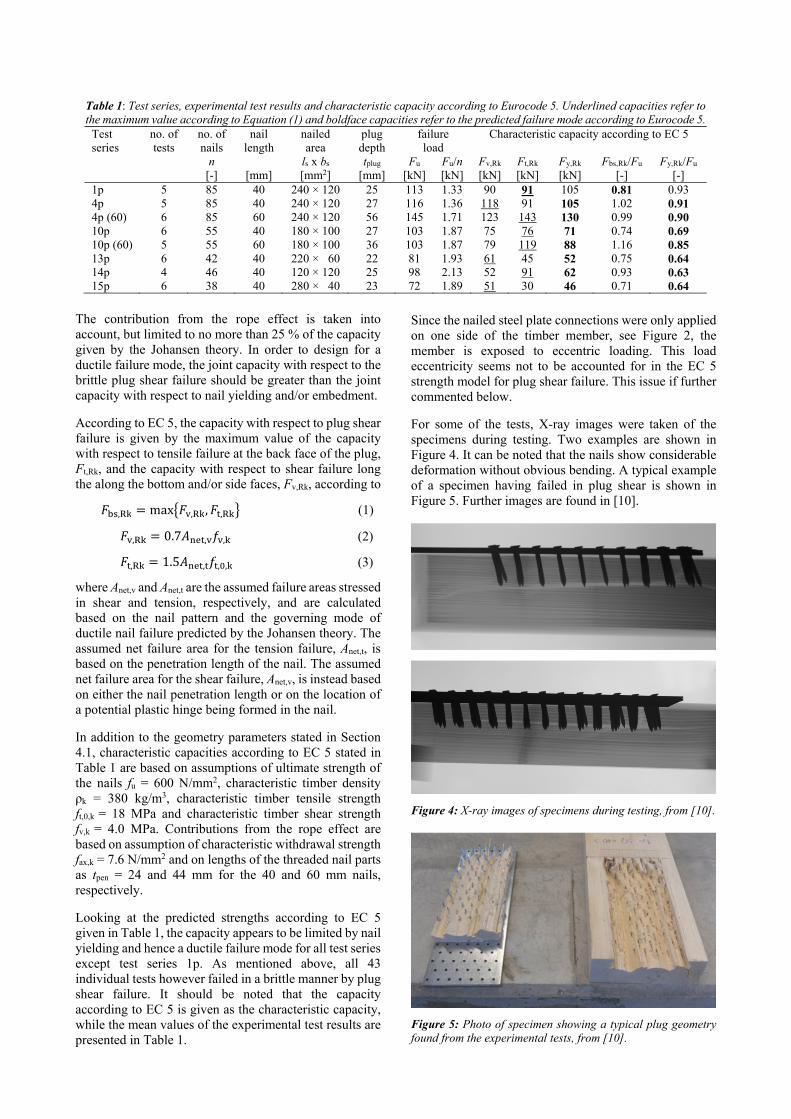
For some of the tests, X-ray images were taken of the specimens during testing. Two examples are shown in Figure 4. It can be noted that the nails show considerable deformation without obvious bending. A typical example of a specimen having failed in plug shear is shown in Figure 5. Further images are found in [10].
Figure 4: X-ray images of specimens during testing, from [10].
Figure 5: Photo of specimen showing a typical plug geometry found from the experimental tests, from [10].
Table 1: Test series, experimental test results and characteristic capacity according to Eurocode 5. Underlined capacities refer to the maximum value according to Equation (1) and boldface capacities refer to the predicted failure mode according to Eurocode 5.
Test series
no. of tests
no. of nails
nail length
nailed area
plug depth
failure load
Characteristic capacity according to EC 5
n ls x bs tplug Fu Fu/n Fv,Rk Ft,Rk Fy,Rk Fbs,Rk/Fu Fy,Rk/Fu [-] [mm] [mm2] [mm] [kN] [kN] [kN] [kN] [kN] [-] [-] 1p 5 85 40 240 × 120 25 113 1.33 90 91 105 0.81 0.93 4p 5 85 40 240 × 120 27 116 1.36 118 91 105 1.02 0.91 4p (60) 6 85 60 240 × 120 56 145 1.71 123 143 130 0.99 0.90 10p 6 55 40 180 × 100 27 103 1.87 75 76 71 0.74 0.69 10p (60) 5 55 60 180 × 100 36 103 1.87 79 119 88 1.16 0.85 13p 6 42 40 220 × 60 22 81 1.93 61 45 52 0.75 0.64 14p 4 46 40 120 × 120 25 98 2.13 52 91 62 0.93 0.63 15p 6 38 40 280 × 40 23 72 1.89 51 30 46 0.71 0.64
5 THEORETICAL WORK
The nailed steel plate connection, shown in Figure 2, has been studied by 3D finite element (FE) analyses. The analyses include both linear elastic stress analysis and nonlinear fracture course analysis. The aim of these analyses is to gain knowledge of the force and stress distributions within the considered connection and how these distributions are influenced by the joint geometry, material properties and loading/boundary conditions. The fracture relevant stress states along the sides of the failing wooden plug are of specific interest. Features in common for both analysis approaches are presented in this section, while analysis specific features are commented in Sections 5.1 and 5.2 respectively.
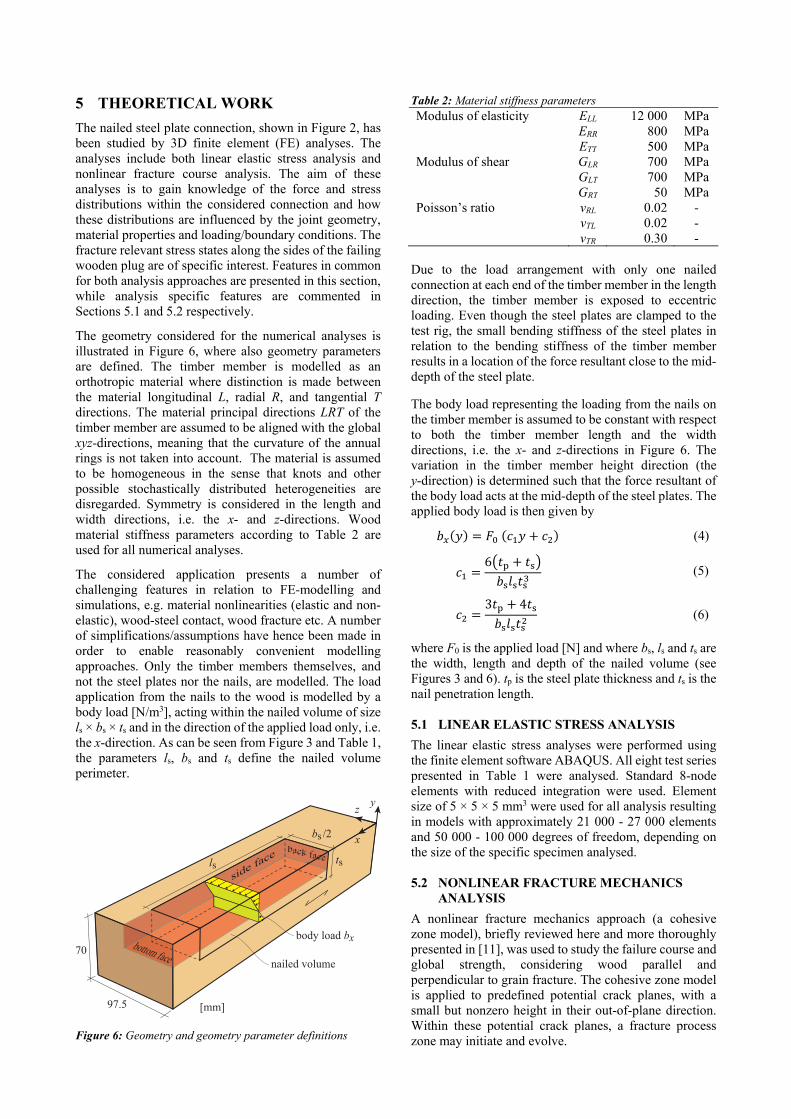
The geometry considered for the numerical analyses is illustrated in Figure 6, where also geometry parameters are defined. The timber member is modelled as an orthotropic material where distinction is made between the material longitudinal L, radial R, and tangential T directions. The material principal directions LRT of the timber member are assumed to be aligned with the global xyz-directions, meaning that the curvature of the annual rings is not taken into account. The material is assumed to be homogeneous in the sense that knots and other possible stochastically distributed heterogeneities are disregarded. Symmetry is considered in the length and width directions, i.e. the x- and z-directions. Wood material stiffness parameters according to Table 2 are used for all numerical analyses.
The considered application presents a number of challenging features in relation to FE-modelling and simulations, e.g. material nonlinearities (elastic and non-elastic), wood-steel contact, wood fracture etc. A number of simplifications/assumptions have hence been made in order to enable reasonably convenient modelling approaches. Only the timber members themselves, and not the steel plates nor the nails, are modelled. The load application from the nails to the wood is modelled by a body load [N/m3], acting within the nailed volume of size ls × bs × ts and in the direction of the applied load only, i.e. the x-direction. As can be seen from Figure 3 and Table 1, the parameters ls, bs and ts define the nailed volume perimeter.
Figure 6: Geometry and geometry parameter definitions
Table 2: Material stiffness parameters Modulus of elasticity ELL 12 000 MPa ERR 800 MPa ETT 500 MPa Modulus of shear GLR 700 MPa GLT 700 MPa GRT 50 MPa Poisson’s ratio νRL 0.02 - νTL 0.02 - νTR 0.30 -
Due to the load arrangement with only one nailed connection at each end of the timber member in the length direction, the timber member is exposed to eccentric loading. Even though the steel plates are clamped to the test rig, the small bending stiffness of the steel plates in relation to the bending stiffness of the timber member results in a location of the force resultant close to the mid-depth of the steel plate.
The body load representing the loading from the nails on the timber member is assumed to be constant with respect to both the timber member length and the width directions, i.e. the x- and z-directions in Figure 6. The variation in the timber member height direction (the y-direction) is determined such that the force resultant of the body load acts at the mid-depth of the steel plates. The applied body load is then given by
( ) = ( + ) (4)
= 6 + (5)
= 3 + 4 (6)
where F0 is the applied load [N] and where bs, ls and ts are the width, length and depth of the nailed volume (see Figures 3 and 6). tp is the steel plate thickness and ts is the nail penetration length. 5.1 LINEAR ELASTIC STRESS ANALYSIS
The linear elastic stress analyses were performed using the finite element software ABAQUS. All eight test series presented in Table 1 were analysed. Standard 8-node elements with reduced integration were used. Element size of 5 × 5 × 5 mm3 were used for all analysis resulting in models with approximately 21 000 - 27 000 elements and 50 000 - 100 000 degrees of freedom, depending on the size of the specific specimen analysed. 5.2 NONLINEAR FRACTURE MECHANICS
ANALYSIS
A nonlinear fracture mechanics approach (a cohesive zone model), briefly reviewed here and more thoroughly presented in [11], was used to study the failure course and global strength, considering wood parallel and perpendicular to grain fracture. The cohesive zone model is applied to predefined potential crack planes, with a small but nonzero height in their out-of-plane direction. Within these potential crack planes, a fracture process zone may initiate and evolve.
x
z y
97.5
70nailed volume
body load bx
ls
bs /2
tssid
e face
[mm]
bottom face
back face
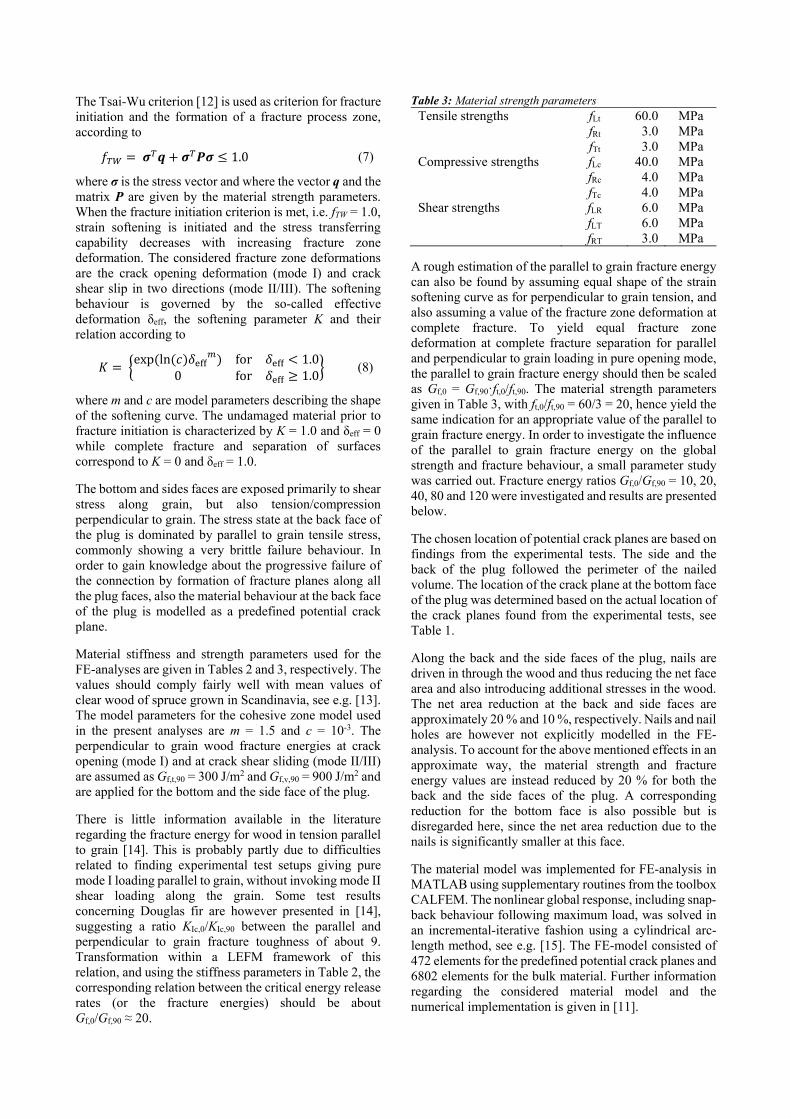
The Tsai-Wu criterion [12] is used as criterion for fracture initiation and the formation of a fracture process zone, according to
= + ≤ 1.0 (7)
where σ is the stress vector and where the vector q and the matrix P are given by the material strength parameters. When the fracture initiation criterion is met, i.e. fTW = 1.0, strain softening is initiated and the stress transferring capability decreases with increasing fracture zone deformation. The considered fracture zone deformations are the crack opening deformation (mode I) and crack shear slip in two directions (mode II/III). The softening behaviour is governed by the so-called effective deformation δeff, the softening parameter K and their relation according to
= exp(ln( ) ) for < 1.00 for ≥ 1.0 (8)
where m and c are model parameters describing the shape of the softening curve. The undamaged material prior to fracture initiation is characterized by K = 1.0 and δeff = 0 while complete fracture and separation of surfaces correspond to K = 0 and δeff = 1.0.
The bottom and sides faces are exposed primarily to shear stress along grain, but also tension/compression perpendicular to grain. The stress state at the back face of the plug is dominated by parallel to grain tensile stress, commonly showing a very brittle failure behaviour. In order to gain knowledge about the progressive failure of the connection by formation of fracture planes along all the plug faces, also the material behaviour at the back face of the plug is modelled as a predefined potential crack plane.
Material stiffness and strength parameters used for the FE-analyses are given in Tables 2 and 3, respectively. The values should comply fairly well with mean values of clear wood of spruce grown in Scandinavia, see e.g. [13]. The model parameters for the cohesive zone model used in the present analyses are m = 1.5 and c = 10-3. The perpendicular to grain wood fracture energies at crack opening (mode I) and at crack shear sliding (mode II/III) are assumed as Gf,t,90 = 300 J/m2 and Gf,v,90 = 900 J/m2 and are applied for the bottom and the side face of the plug.
There is little information available in the literature regarding the fracture energy for wood in tension parallel to grain [14]. This is probably partly due to difficulties related to finding experimental test setups giving pure mode I loading parallel to grain, without invoking mode II shear loading along the grain. Some test results concerning Douglas fir are however presented in [14], suggesting a ratio KIc,0/KIc,90 between the parallel and perpendicular to grain fracture toughness of about 9. Transformation within a LEFM framework of this relation, and using the stiffness parameters in Table 2, the corresponding relation between the critical energy release rates (or the fracture energies) should be about Gf,0/Gf,90 ≈ 20.
Table 3: Material strength parameters Tensile strengths fLt 60.0 MPa fRt 3.0 MPa fTt 3.0 MPa Compressive strengths fLc 40.0 MPa fRc 4.0 MPa fTc 4.0 MPa Shear strengths fLR 6.0 MPa fLT 6.0 MPa fRT 3.0 MPa
A rough estimation of the parallel to grain fracture energy can also be found by assuming equal shape of the strain softening curve as for perpendicular to grain tension, and also assuming a value of the fracture zone deformation at complete fracture. To yield equal fracture zone deformation at complete fracture separation for parallel and perpendicular to grain loading in pure opening mode, the parallel to grain fracture energy should then be scaled as Gf,0 = Gf,90·ft,0/ft,90. The material strength parameters given in Table 3, with ft,0/ft,90 = 60/3 = 20, hence yield the same indication for an appropriate value of the parallel to grain fracture energy. In order to investigate the influence of the parallel to grain fracture energy on the global strength and fracture behaviour, a small parameter study was carried out. Fracture energy ratios Gf,0/Gf,90 = 10, 20, 40, 80 and 120 were investigated and results are presented below.
The chosen location of potential crack planes are based on findings from the experimental tests. The side and the back of the plug followed the perimeter of the nailed volume. The location of the crack plane at the bottom face of the plug was determined based on the actual location of the crack planes found from the experimental tests, see Table 1.
Along the back and the side faces of the plug, nails are driven in through the wood and thus reducing the net face area and also introducing additional stresses in the wood. The net area reduction at the back and side faces are approximately 20 % and 10 %, respectively. Nails and nail holes are however not explicitly modelled in the FE-analysis. To account for the above mentioned effects in an approximate way, the material strength and fracture energy values are instead reduced by 20 % for both the back and the side faces of the plug. A corresponding reduction for the bottom face is also possible but is disregarded here, since the net area reduction due to the nails is significantly smaller at this face.
The material model was implemented for FE-analysis in MATLAB using supplementary routines from the toolbox CALFEM. The nonlinear global response, including snap-back behaviour following maximum load, was solved in an incremental-iterative fashion using a cylindrical arc-length method, see e.g. [15]. The FE-model consisted of 472 elements for the predefined potential crack planes and 6802 elements for the bulk material. Further information regarding the considered material model and the numerical implementation is given in [11].
5.3 THEORETICAL RESULTS – LINEAR ELASTIC STRESS ANALYSIS
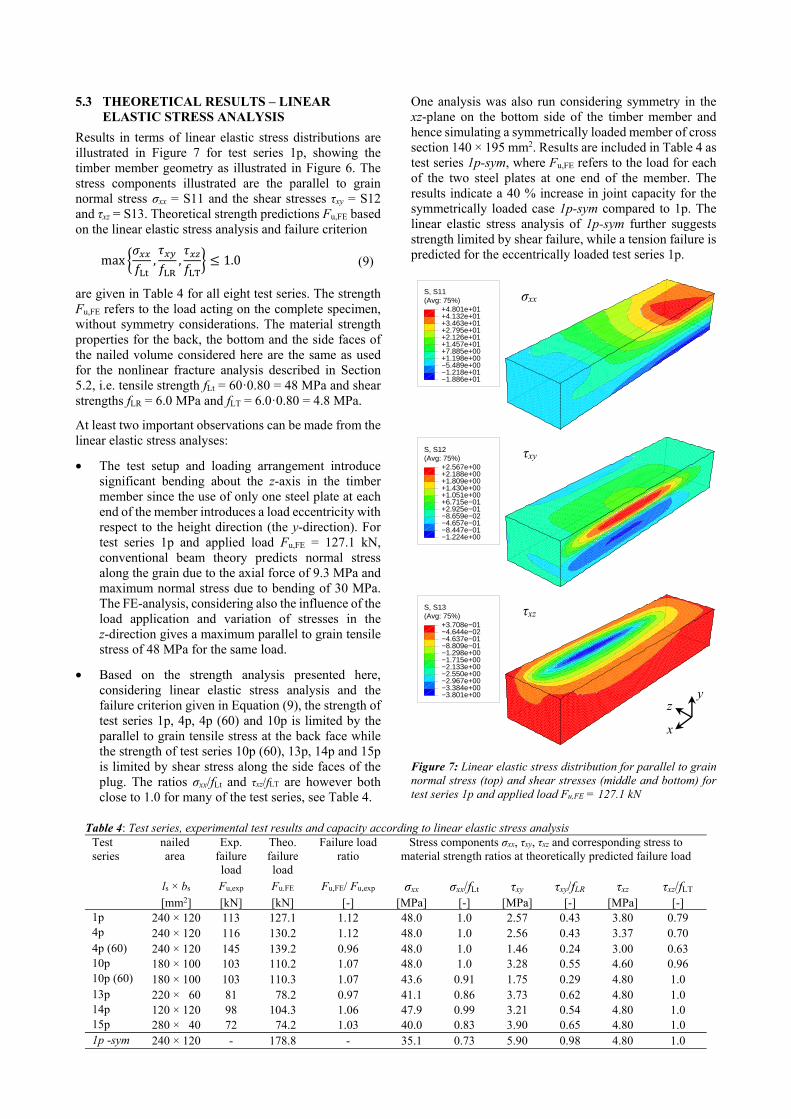
Results in terms of linear elastic stress distributions are illustrated in Figure 7 for test series 1p, showing the timber member geometry as illustrated in Figure 6. The stress components illustrated are the parallel to grain normal stress σxx = S11 and the shear stresses τxy = S12 and τxz = S13. Theoretical strength predictions Fu,FE based on the linear elastic stress analysis and failure criterion
max , , ≤ 1.0 (9)
are given in Table 4 for all eight test series. The strength Fu,FE refers to the load acting on the complete specimen, without symmetry considerations. The material strength properties for the back, the bottom and the side faces of the nailed volume considered here are the same as used for the nonlinear fracture analysis described in Section 5.2, i.e. tensile strength fLt = 60·0.80 = 48 MPa and shear strengths fLR = 6.0 MPa and fLT = 6.0·0.80 = 4.8 MPa.
At least two important observations can be made from the linear elastic stress analyses:
• The test setup and loading arrangement introduce significant bending about the z-axis in the timber member since the use of only one steel plate at each end of the member introduces a load eccentricity with respect to the height direction (the y-direction). For test series 1p and applied load Fu,FE = 127.1 kN, conventional beam theory predicts normal stress along the grain due to the axial force of 9.3 MPa and maximum normal stress due to bending of 30 MPa. The FE-analysis, considering also the influence of the load application and variation of stresses in the z-direction gives a maximum parallel to grain tensile stress of 48 MPa for the same load.
• Based on the strength analysis presented here, considering linear elastic stress analysis and the failure criterion given in Equation (9), the strength of test series 1p, 4p, 4p (60) and 10p is limited by the parallel to grain tensile stress at the back face while the strength of test series 10p (60), 13p, 14p and 15p is limited by shear stress along the side faces of the plug. The ratios σxx/fLt and τxz/fLT are however both close to 1.0 for many of the test series, see Table 4.
One analysis was also run considering symmetry in the xz-plane on the bottom side of the timber member and hence simulating a symmetrically loaded member of cross section 140 × 195 mm2. Results are included in Table 4 as test series 1p-sym, where Fu,FE refers to the load for each of the two steel plates at one end of the member. The results indicate a 40 % increase in joint capacity for the symmetrically loaded case 1p-sym compared to 1p. The linear elastic stress analysis of 1p-sym further suggests strength limited by shear failure, while a tension failure is predicted for the eccentrically loaded test series 1p.
Figure 7: Linear elastic stress distribution for parallel to grain normal stress (top) and shear stresses (middle and bottom) for test series 1p and applied load Fu,FE = 127.1 kN
(Avg: 75%)S, S11
−1.886e+01−1.218e+01−5.489e+00+1.198e+00+7.885e+00+1.457e+01+2.126e+01+2.795e+01+3.463e+01+4.132e+01+4.801e+01
(Avg: 75%)S, S12
−1.224e+00−8.447e−01−4.657e−01−8.659e−02+2.925e−01+6.715e−01+1.051e+00+1.430e+00+1.809e+00+2.188e+00+2.567e+00
(Avg: 75%)S, S13
−3.801e+00−3.384e+00−2.967e+00−2.550e+00−2.133e+00−1.715e+00−1.298e+00−8.809e−01−4.637e−01−4.644e−02+3.708e−01
Table 4: Test series, experimental test results and capacity according to linear elastic stress analysis Test series
nailed area
Exp. failure load
Theo. failure load
Failure load ratio
Stress components σxx, τxy, τxz and corresponding stress to material strength ratios at theoretically predicted failure load
ls × bs Fu,exp Fu.FE Fu,FE/ Fu,exp σxx σxx/fLt τxy τxy/fLR τxz τxz/fLT [mm2] [kN] [kN] [-] [MPa] [-] [MPa] [-] [MPa] [-] 1p 240 × 120 113 127.1 1.12 48.0 1.0 2.57 0.43 3.80 0.79 4p 240 × 120 116 130.2 1.12 48.0 1.0 2.56 0.43 3.37 0.70 4p (60) 240 × 120 145 139.2 0.96 48.0 1.0 1.46 0.24 3.00 0.63 10p 180 × 100 103 110.2 1.07 48.0 1.0 3.28 0.55 4.60 0.96 10p (60) 180 × 100 103 110.3 1.07 43.6 0.91 1.75 0.29 4.80 1.0 13p 220 × 60 81 78.2 0.97 41.1 0.86 3.73 0.62 4.80 1.0 14p 120 × 120 98 104.3 1.06 47.9 0.99 3.21 0.54 4.80 1.0 15p 280 × 40 72 74.2 1.03 40.0 0.83 3.90 0.65 4.80 1.0 1p -sym 240 × 120 - 178.8 - 35.1 0.73 5.90 0.98 4.80 1.0
σxx
τxy
τxz
y
x
z
5.4 THEORETICAL RESULTS – NONLINEAR FRACTURE MECHANICS ANALYSIS
Results presented in Figures 8 - 11 concern the nonlinear fracture analyses described in Section 5.2. Only test series 1p was analysed considering this approach and results are hence limited to this geometry and nailing pattern.
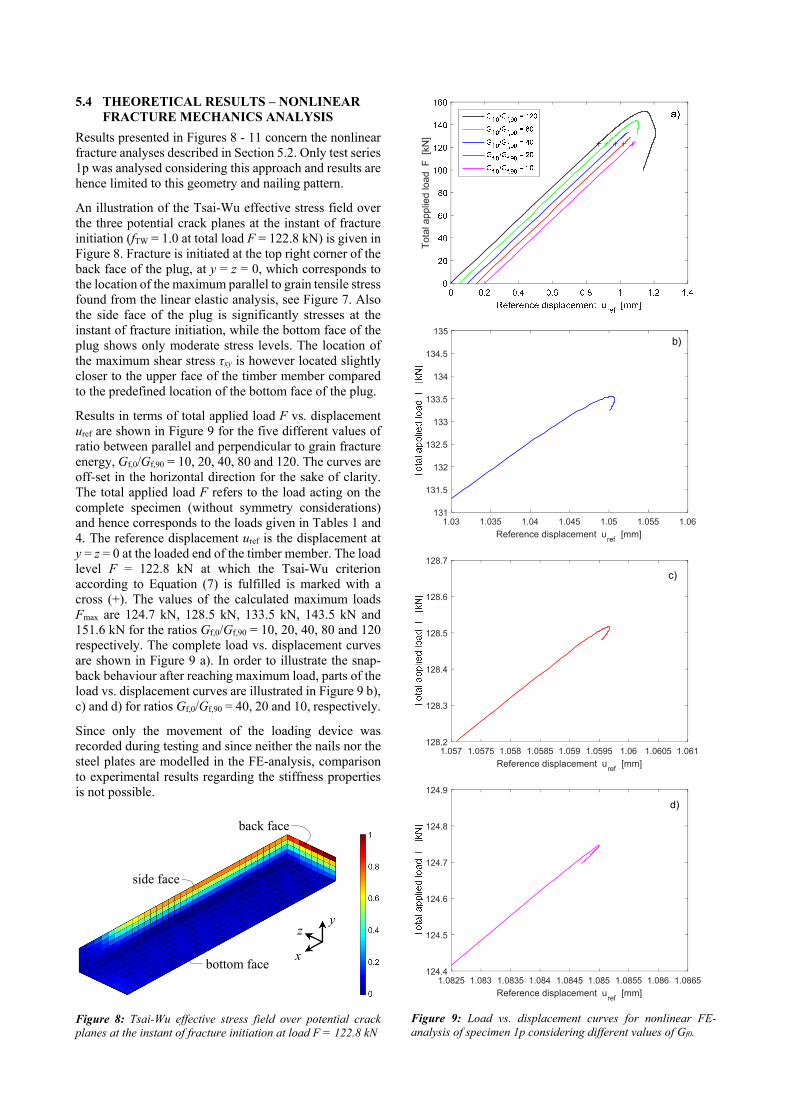
An illustration of the Tsai-Wu effective stress field over the three potential crack planes at the instant of fracture initiation (fTW = 1.0 at total load F = 122.8 kN) is given in Figure 8. Fracture is initiated at the top right corner of the back face of the plug, at y = z = 0, which corresponds to the location of the maximum parallel to grain tensile stress found from the linear elastic analysis, see Figure 7. Also the side face of the plug is significantly stresses at the instant of fracture initiation, while the bottom face of the plug shows only moderate stress levels. The location of the maximum shear stress τxy is however located slightly closer to the upper face of the timber member compared to the predefined location of the bottom face of the plug.
Results in terms of total applied load F vs. displacement uref are shown in Figure 9 for the five different values of ratio between parallel and perpendicular to grain fracture energy, Gf,0/Gf,90 = 10, 20, 40, 80 and 120. The curves are off-set in the horizontal direction for the sake of clarity. The total applied load F refers to the load acting on the complete specimen (without symmetry considerations) and hence corresponds to the loads given in Tables 1 and 4. The reference displacement uref is the displacement at y = z = 0 at the loaded end of the timber member. The load level F = 122.8 kN at which the Tsai-Wu criterion according to Equation (7) is fulfilled is marked with a cross (+). The values of the calculated maximum loads Fmax are 124.7 kN, 128.5 kN, 133.5 kN, 143.5 kN and 151.6 kN for the ratios Gf,0/Gf,90 = 10, 20, 40, 80 and 120 respectively. The complete load vs. displacement curves are shown in Figure 9 a). In order to illustrate the snap-back behaviour after reaching maximum load, parts of the load vs. displacement curves are illustrated in Figure 9 b), c) and d) for ratios Gf,0/Gf,90 = 40, 20 and 10, respectively.
Since only the movement of the loading device was recorded during testing and since neither the nails nor the steel plates are modelled in the FE-analysis, comparison to experimental results regarding the stiffness properties is not possible.
Figure 8: Tsai-Wu effective stress field over potential crack planes at the instant of fracture initiation at load F = 122.8 kN
Figure 9: Load vs. displacement curves for nonlinear FE-analysis of specimen 1p considering different values of Gf0.
Tot
al a
pplie
d lo
ad F
[kN
]
1.03 1.035 1.04 1.045 1.05 1.055 1.06
Reference displacement uref
[mm]
131
131.5
132
132.5
133
133.5
134
134.5
135b)
1.057 1.0575 1.058 1.0585 1.059 1.0595 1.06 1.0605 1.061
Reference displacement uref
[mm]
128.2
128.3
128.4
128.5
128.6
128.7
c)
1.0825 1.083 1.0835 1.084 1.0845 1.085 1.0855 1.086 1.0865
Reference displacement uref
[mm]
124.4
124.5
124.6
124.7
124.8
124.9
d)
side face
bottom face
back face
y
x
z
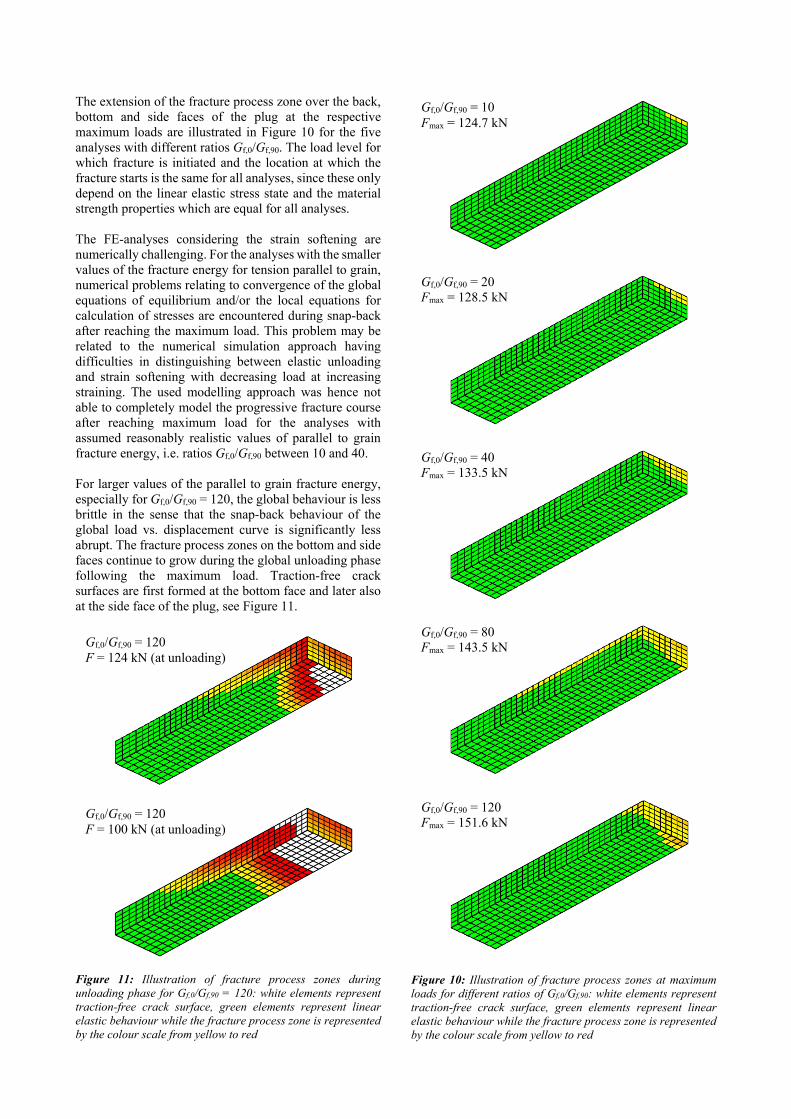
The extension of the fracture process zone over the back, bottom and side faces of the plug at the respective maximum loads are illustrated in Figure 10 for the five analyses with different ratios Gf,0/Gf,90. The load level for which fracture is initiated and the location at which the fracture starts is the same for all analyses, since these only depend on the linear elastic stress state and the material strength properties which are equal for all analyses. The FE-analyses considering the strain softening are numerically challenging. For the analyses with the smaller values of the fracture energy for tension parallel to grain, numerical problems relating to convergence of the global equations of equilibrium and/or the local equations for calculation of stresses are encountered during snap-back after reaching the maximum load. This problem may be related to the numerical simulation approach having difficulties in distinguishing between elastic unloading and strain softening with decreasing load at increasing straining. The used modelling approach was hence not able to completely model the progressive fracture course after reaching maximum load for the analyses with assumed reasonably realistic values of parallel to grain fracture energy, i.e. ratios Gf,0/Gf,90 between 10 and 40. For larger values of the parallel to grain fracture energy, especially for Gf,0/Gf,90 = 120, the global behaviour is less brittle in the sense that the snap-back behaviour of the global load vs. displacement curve is significantly less abrupt. The fracture process zones on the bottom and side faces continue to grow during the global unloading phase following the maximum load. Traction-free crack surfaces are first formed at the bottom face and later also at the side face of the plug, see Figure 11.
Figure 11: Illustration of fracture process zones during unloading phase for Gf,0/Gf,90 = 120: white elements represent traction-free crack surface, green elements represent linear elastic behaviour while the fracture process zone is represented by the colour scale from yellow to red
Figure 10: Illustration of fracture process zones at maximum loads for different ratios of Gf,0/Gf,90: white elements represent traction-free crack surface, green elements represent linear elastic behaviour while the fracture process zone is represented by the colour scale from yellow to red
Gf,0/Gf,90 = 120 Fmax = 151.6 kN
Gf,0/Gf,90 = 20 Fmax = 128.5 kN
Gf,0/Gf,90 = 40 Fmax = 133.5 kN
Gf,0/Gf,90 = 80 Fmax = 143.5 kN Gf,0/Gf,90 = 120
F = 124 kN (at unloading)
Gf,0/Gf,90 = 120 F = 100 kN (at unloading)
Gf,0/Gf,90 = 10 Fmax = 124.7 kN
6 RESULTS AND DISCUSSION
The comparison between the experimentally found strength and the strength predicted by Eurocode 5 reveals discrepancies, see Table 1. The EC 5 strength predictions with respect to plug shear failure seem to be non-conservative and the predicted failure modes are furthermore in general erroneous. The eccentric load application, introducing bending of the timber member, may be one reason for the differences in results. The EC 5 strength model appears to disregard any possible influence of load eccentricity and instead implicitly assumes centric loading of the timber member.
The linear elastic FE-analyses suggest a significant influence of the eccentric loading on the connection strength. For symmetric loading, the parallel to grain tensile stress is reduced and the numerical analysis suggests considerably greater strength, see Table 4. This finding is interesting in relation to evaluation of experimental tests, in relation further experimental testing and also in relation to practical design.
Another interesting observation concerns the location of the bottom face of the plug. The location of the failure plane is according to EC 5 governed by the location of the plastic hinge formed in the nails for the governing ductile nail failure mode. This location does however not necessarily coincide with the location of maximum shear stress in the wood. The nails may furthermore still be in the linear elastic state at the load level leading to plug shear failure.
There are a number of simplifications introduced in the numerical models used here, e.g. regarding to load transfer from the nails to the timber member. In the present study, the loading is modelled by a body load acting within the nailed volume. The applied body load is assumed to vary linearly with respect to the nail length direction, corresponding roughly to elastic performance of the wood and rigid body rotation of the nail. A more realistic way to model the load application can be to account for the nail deformation and the local deformation of the wood (elastic and/or plastic), and also to take the clamping effect of the steel plate at the nail head into account. Further possible improvements of the models include modelling the individual nails, the steel plates and some more sophisticated approach for modelling the parallel to grain fracture at the back face of the plug. 7 CONCLUDING REMARKS
The long term goal of the theoretical work is to develop a design method for nailed steel plate connections, which is based on a sound and rational mechanical background. Of specific interest is the capabilities to predict (1) under which circumstances brittle failure due to plug or block shear is likely to occur and (2) the corresponding failure load. During the course of such work, FE-analysis based on linear or nonlinear approaches serve as a valuable tool for analysis of different geometries of the connections, e.g. with different nail patterns. The results from such a study could then be used to optimize the connections in terms of both strength and ductility.
REFERENCES
[1] I. Smith, G. Foliente: Load and resistance factor design of timber joints: International practice and future direction. Journal of Structural Engineering, 128:48-59, 2002.
[2] H. Johnsson, L. Stehn: Effects of joint geometry on the shear plug failure in nailed timber connections. In: Proceedings of the World Conference on Timber Engineering, WCTE, Shah Alam, Malaysia, 2002.
[3] H. Johnsson: Plug shear failure in nailed timber connections – Avoiding brittle and promoting ductile failures. PhD thesis, Luleå University of Technology, Sweden, 2004.
[4] H. Johnsson: Plug shear failure in nailed timber connections: Experimental studies. In: Proceedings of the International Council for Research and Innovation in Building and Construction, CIB-W18, Meeting 36, Colorado, USA, Paper 36-7-2, 2003.
[5] European Committee for Standardization (CEN): EN 1995-1-1:2004, Eurocode 5: Design of Timber Structures. Brussels, Belgium, 2004.
[6] R.O. Foschi, J. Longworth: Analysis and design of griplam nailed connections. Journal of the Structural Division, 101(12):2537-2555, 1975.
[7] J. Kangas, J. Vesa: Design on timber capacity in nailed steel-to-timber joints. In: Proceedings of the International Council for Research and Innovation in Building and Construction, CIB-W18, Meeting 31, Savonlinna, Finland, Paper 31-7-4, 1998.
[8] P. Quenneville, M. Mohammad: On the failure modes and strength of steel-wood-steel bolted timber connections loaded parallel to grain. Canadian Journal of Civil Engineering, 27(4):761-773, 2000.
[9] P. Zarnani, P. Quenneville: Strength of timber connections under potential failure modes - An improved design procedure. Construction and Building Materials, 60:81-90, 2014.
[10] A. Asimakidis: Experimental study on mechanical joints with nail type fasteners. Master thesis, Report TVBK-5210, Division of Structural Engineering, Lund University, Sweden, 2012.
[11] H. Danielsson: Perpendicular to grain fracture analysis of wooden structural elements – Models and applications. PhD thesis, Report TVSM-1024, Division of Structural Mechanics, Lund University, Sweden, 2013.
[12] S.W. Tsai, E.M. Wu: A general theory of the strength of anisotropic materials. Journal of Composite Materials, 5:58-801, 1971.
[13] K. Berbom Dahl: Mechanical properties of clear wood from Norway spruce. Phd Thesis, Norwegian University of Science and Technology, Norway, 2009.
[14] I. Smith, E. Landis, M. Gong: Fracture and fatigue in wood. John Wiley & Sons Ltd, Chichester, England, 2003.
[15] M.A. Crisfield: Non-linear Finite Element Analysis of Solids and Structures – Volume 1. John Wiley & Sons Ltd, Chichester, England, 1991.