Embed Size (px)
Citation preview
International Journal of Physics and Applications.
ISSN 0974-3103 Volume 8, Number 1 (2016), pp. 1-14
© International Research Publication House
http://www.irphouse.com
Broadband Dielectric Spectroscopy and Electric Modulus
Analysis of Poly (3-hydroxybutyrate-co-3-hydroxyvalerate)
and Related Copolymers Films
T. Fahmy1,2, M. T. Ahmed2, A. El-kotp1,2,
H. G. Abdelwahed1,3 and M. Y. Alshaeer1
1)Plasma Technology and Material Science Unit (PTMSU),
Physics Department, College of Science and Humanitarian Studies,
Prince Sattam bin Abdulaziz University, Alkharj, KSA.
2)Polymer Research group, Physics Department, Faculty of Science,
Mansoura University, 35516 Mansoura, Egypt. 3)Theoretical Research group, Physics Department, Faculty of Science,
Mansoura University, 35516 Mansoura, Egypt.
Abstract
The dielectric relaxation behavior of pure (3-hydroxybutyrate), PHB and its
copolymer (3-hydroxybutyrate-co-3-hydroxyvalerate), PHB-HV, is
investigated in wide range of frequency from 0.001 Hz to 1x10⁷ Hz at
different fixed temperatures. It is observed that, pure PHB and its copolymers
with different ratios of hydroxyvale rate are characterized by high dielectric
constant at low frequency and high temperature. This behavior is attributed to
interfacial polarization, (Maxwell-Wagner-Sillars) polarization. The behavior
of imaginary part of electric modulus (M//) with temperature for the samples is
characterized by two different relaxational peaks. The first one is positioned
in the region of Tg of pure PHB, whereas, the second peak at temperature ~
338 0K, and is assigned as Maxwell-Wagner- Sillars (MWS) relaxation. AC
conductivity of all samples is investigated. The Arrhenius plots of AC
conductivity showed a remarkable change in the conduction mechanism in
glass transition temperature region of pure PHB.
Keywords: Broadband, Dielectric Relaxation, Pure (3-hydroxybutyrate),
Interfacial Polarization, Electric Modulus
2 T. Fahmy et al
Introduction Poly (hydroxyalkanoates) are biological polyesters produced by microorganisms
[1,2]. The chemical structure of pure PHB and its copolymer is shown as follow:
O HC*
CH3
H2C C *
O
n
PH3B
O HC*
CH3
H2C C
O
O HC
CH2CH3
H2C C
O
*
n
PHBV
Poly (hydroxyl butyrate) is considered as crystalline polyester and has great
technological applications, such as, disposable items and biomedical applications,
because of its biocompatibility. The physical properties of poly (hydroxyalkanoates)
can be modified by adopting the monomer ratio of PHA. PHAs are biodegradable and
biosynthetic polymers in comparison with other biodegradable plastics [3]. The
applications of PHB are limited because of its brittleness due to its high crystallinity.
On the other hand, the copolymer of (3-hydroxybutyrate-co-3-hydroxyvalerate)
(PHB-HV) is widely used due to its flexibility, because of its lower crystallinity [4,5].
Dielectric relaxation spectroscopy (DRS) is sensitive method to investigate the
mobility of dipolar groups in the polymer chains [6]. Study of both dielectric constant
and dielectric loss in temperature-frequency domain is one of the convenient methods
to study the polymeric structure [7]. The aim of this present work is to shed light on
the dielectric relaxation and AC conductivity of Poly (hydroxyl butyrate) and its
copolymer in a wide range of frequency and temperature.
Experimental Work Poly(3-hydroxybutyrate-co-3-hydroxyvalerate), with three HV concentrations, PHB-
5wt% HV, PHB-8wt% HV, PHB-12wt% HVare supplied from (Aldrich chemical
company, USA). The samples under investigation for dielectric measurements are
placed as thin films between two cupper electrodes. First, the samples are melted at
the melting temperature on one of the electrodes. Second, the spacers are added to the
sample then the other electrode is added. Third, the sample and electrodes are
quenched to the room temperature.
The dielectric measurements are carried out in the frequency range 10-2-107 Hz and
temperature range 273 - 353 0K, using commercially device supplied by
NOVOCONTROL, GmbH, (Germany).
Results and Discussion Permittivity:
The dielectric relaxation spectroscopy is sensitive to dipole moment orientation in
materials under applying AC field. Hence, the rotation of small groups in polymer
Broadband Dielectric Spectroscopy and Electric Modulus Analysis of Poly 3
chain having a dipole moment could be investigated using dielectric spectroscopy [8].
The polymer materials exhibit different behaviors depending on frequency and
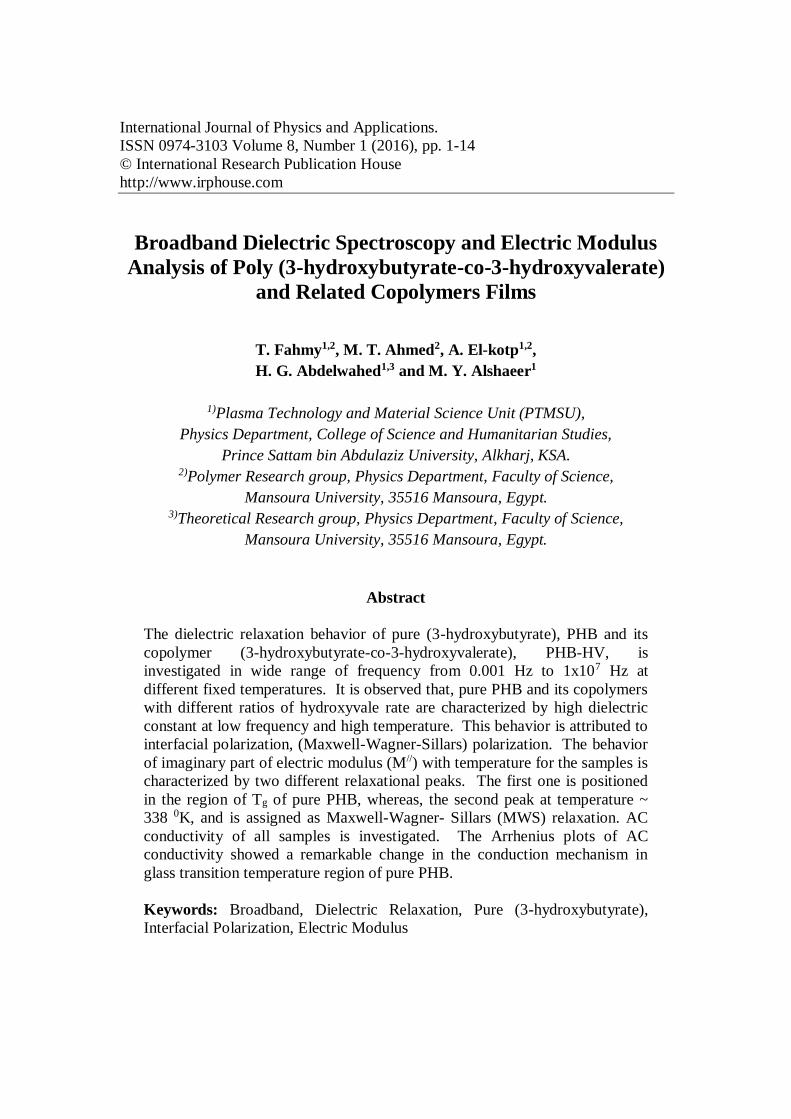
temperatures [9]. A typical dielectric spectrum, dielectric constant ( /), of pure PHB
and PHB- 12wt%VH as a representative sample of its copolymer is investigated in a
wide range of frequency and fixed temperatures, as shown in Fig. 1.
10-2
10-1
100
101
102
103
104
105
106
107
2
4
6
8
10
10-2
10-1
100
101
102
103
104
105
106
107
2.0
2.5
3.0
3.5
273 K, 278 K, 283 K,
288 K, 293 K, 303 K
398 K, 313 K, 323 K,
328 K, 333 K, 338 K
343 K. 348 K, 353 K.
Pure PHB
F (Hz)
f (Hz)
(a)
10-2
10-1
100
101
102
103
104
105
106
107
2
4
6
8
10
12
PHB-12wt% HV
F (Hz)
273 K, 278 K
283 K, 288 K
293 K, 303 K
398 K, 313 K
323 K, 328 K
333 K, 338 K
343 K, 348 K
353 K,
(b)
Fig. 1: The dielectric constant / of (a) pure PHB and (b) PHB-12wt% HV
copolymer
As already well known, the behavior of dielectric constant ( /) is different for non-
polar and polar polymeric materials. Generally, dielectric constant ( /) is
independent on temperature in case of non-polar material, whereas, it increases with
increasing temperature in case of polar material. In polar polymeric materials, the
dielectric constant ( /) starts to drop at certain frequency. It is found that, for pure
PHB and its copolymer sample the dielectric constant ( /) values decrease as
frequency increases and display a dispersive behavior at lower frequency. In addition,
the dielectric constant ( /) increases with increasing temperature. The dipole
molecules cannot orient themselves at low temperatures. Hence, when the
temperature of the material increases the ration of the number of molecules to
effective length of dielectric will decrease and the amount of amorphous material will
increase, leading to facilitating of dipole orientation and this increases the dielectric
constant. The temperature dependence of dielectric constant indicates to orientational
distribution of the polymer chains in the crystalline and amorphous regions through
the material [10,11]. With increasing temperature, mobility of the dipoles increases
due to the increase in specific volume of the material and number of the polar C=O
and methyl, CH3, groups becomes free to orient, leading to an increase of dielectric
constant ( /) values [12]. On the other side, higher values of dielectric constant ( /)
4 T. Fahmy et al
at lower frequencies are indicated to the accumulation of charge carriers at the
interface between the samples and electrodes, i.e., space charge relaxation or
interfacial polarization. Lower values of dielectric constant ( /) values at higher
frequencies can be related to electrical relaxation, but at the same time the material
electrode polarization cannot be ignored.
10-2
10-1
100
101
102
103
104
105
106
107
10-2
10-1
100
101
Pure PHB 273 K
278 K
283 K
288 K
293 K
303 K
398 K
313 K
323 K
328 K
333 K
338 K
343 K
348 K
353 K
//
f (Hz)
(a)
10-2
10-1
100
101
102
103
104
105
106
107
10-1
100
101
102
PHB-12wt% VH 273 K
278 K
283 K
288 K
293 K
303 K
398 K
313 K
323 K
328 K
333 K
338 K
343 K
348 K
353 K
//
f (Hz)
(b)
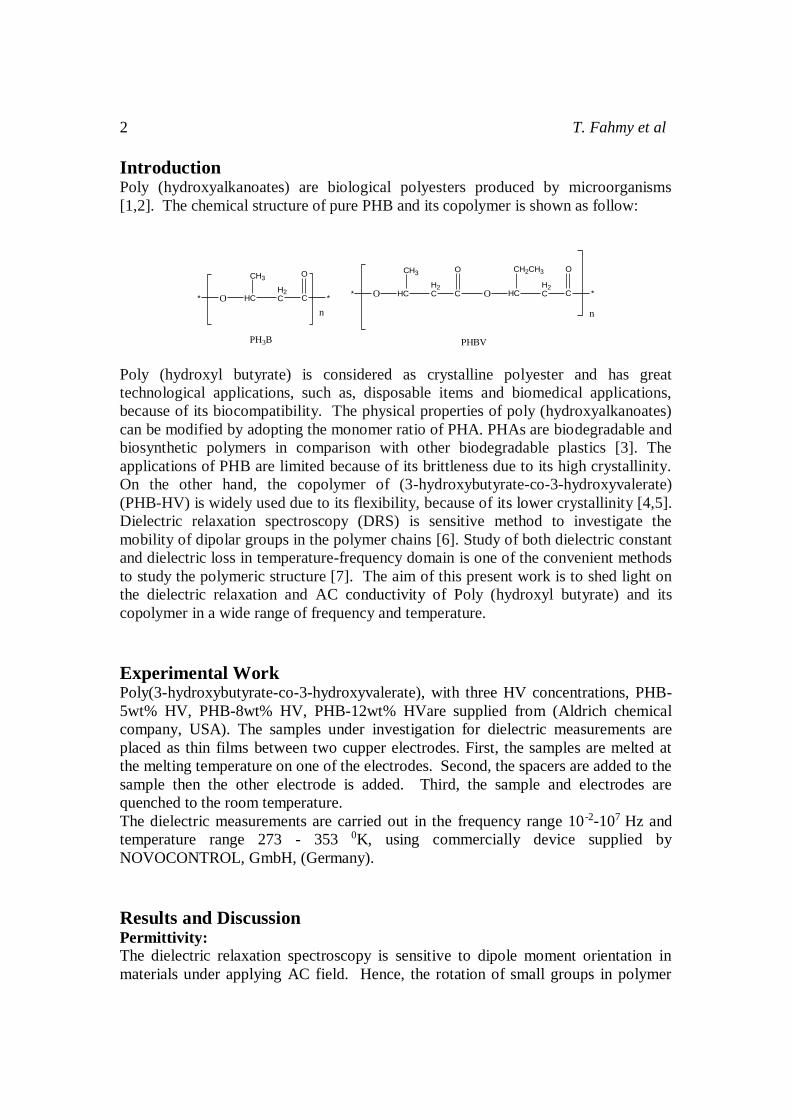
Fig. 2: Dielectric loss ( //) as a function of frequency at fixed temperatures for
(a)pure PHB and (b) PHB-12wt% HV copolymer.
Fig. 2 shows the variation of dielectric loss ( //) of pure PHB and PHB-12wt%HV
with frequency at fixed temperatures. It is observed that, this behavior is
characterized by a loss peak at high frequency side and it is related to -relaxation.
The origin of this loss peak is the micro-Brownian cooperative motions of the main
chain backbone ad related to glass transition temperature (Tg) of pure PHB. On the
other hand, the copolymer sample is characterized by an additional relaxation
observed at higher temperature and very low frequency as a shoulder. This relaxation
is attributed to the contribution of ionic conductivity to the dielectric measurements.
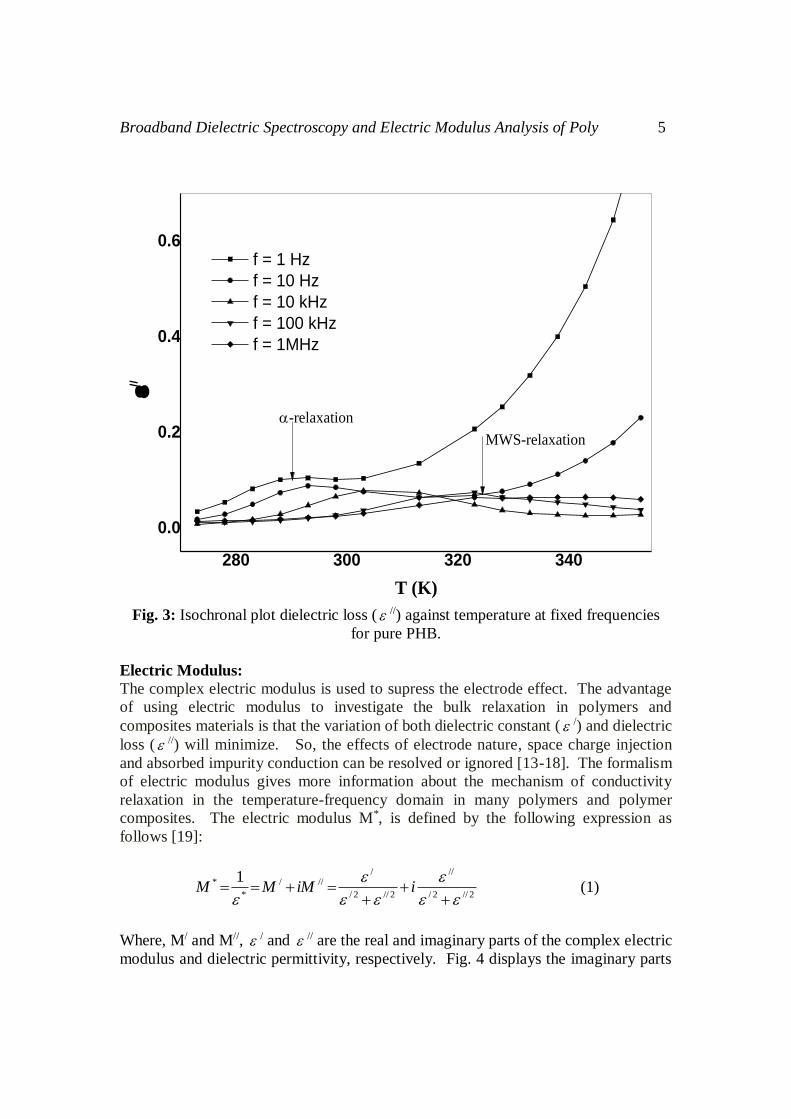
Fig. 3 shows the variation of dielectric loss ( //) of pure PHB with temperature at
fixed frequencies. One can see that, this behavior is characterized by a loss peak in
the glass transition temperature region, i.e., -relaxation, which is attributed to large
conformational rearrangement of the main chain in the amorphous region of the
material. This behavior is a characteristic to dipolar relaxation. An additional peak is
observed in high temperature region and can be assigned to Maxwell-Wagner-Sillars
(MWS) interfacial polarization. The origin of this relaxation peak is from the charge
carriers build-up created by contact of amorphous and crystalline phases of different
conductivities.
Broadband Dielectric Spectroscopy and Electric Modulus Analysis of Poly 5
280 300 320 340
0.0
0.2
0.4
0.6
MWS-relaxation
//
T (K)
f = 1 Hz
f = 10 Hz
f = 10 kHz
f = 100 kHz
f = 1MHz
-relaxation
Fig. 3: Isochronal plot dielectric loss ( //) against temperature at fixed frequencies
for pure PHB.
Electric Modulus:
The complex electric modulus is used to supress the electrode effect. The advantage
of using electric modulus to investigate the bulk relaxation in polymers and
composites materials is that the variation of both dielectric constant ( /) and dielectric
loss ( //) will minimize. So, the effects of electrode nature, space charge injection
and absorbed impurity conduction can be resolved or ignored [13-18]. The formalism
of electric modulus gives more information about the mechanism of conductivity
relaxation in the temperature-frequency domain in many polymers and polymer
composites. The electric modulus M*, is defined by the following expression as
follows [19]:
2//2/
//
2//2/
////
*
* 1
iiMMM (1)
Where, M/ and M//, / and // are the real and imaginary parts of the complex electric
modulus and dielectric permittivity, respectively. Fig. 4 displays the imaginary parts
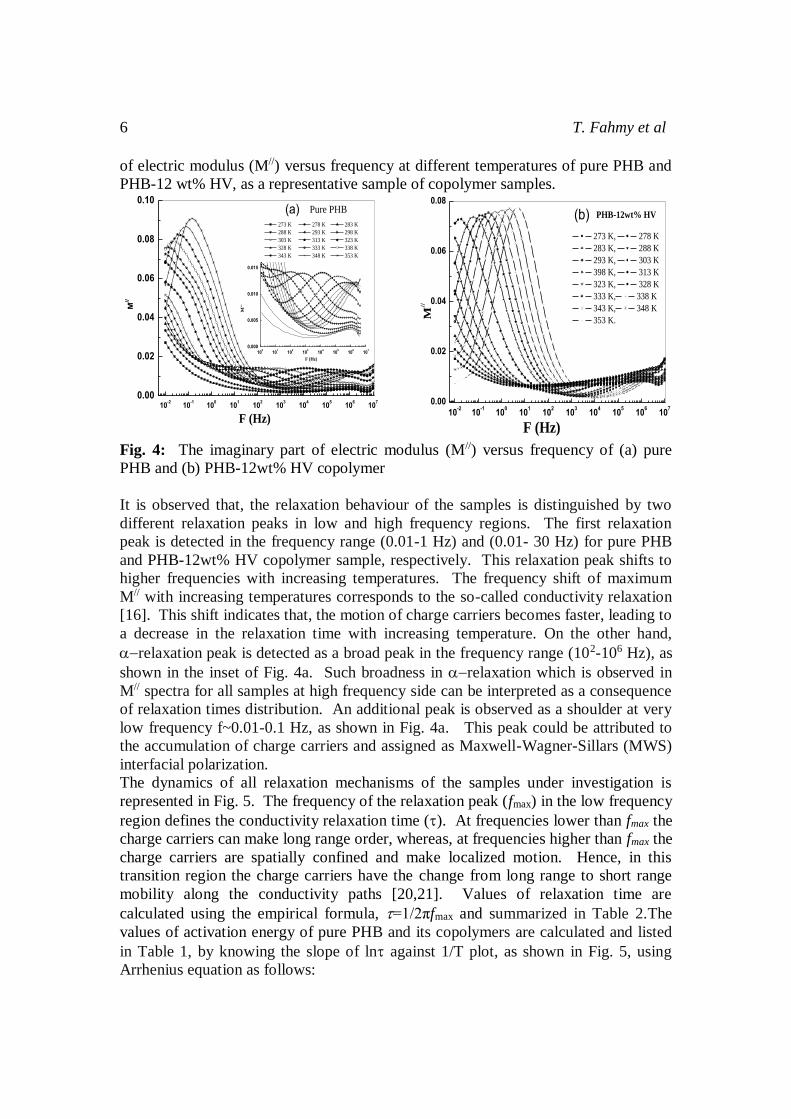
6 T. Fahmy et al
of electric modulus (M//) versus frequency at different temperatures of pure PHB and
PHB-12 wt% HV, as a representative sample of copolymer samples.
10-2
10-1
100
101
102
103
104
105
106
107
0.00
0.02
0.04
0.06
0.08
0.10
100
101
102
103
104
105
106
107
0.000
0.005
0.010
0.015
Pure PHB
273 K 278 K 283 K
288 K 293 K 298 K
303 K 313 K 323 K
328 K 333 K 338 K
343 K 348 K 353 K
M//
F (Hz)
(a)
M''
F (Hz)
10
-210
-110
010
110
210
310
410
510
610
70.00
0.02
0.04
0.06
0.08
PHB-12wt% HV
273 K, 278 K
283 K, 288 K
293 K, 303 K
398 K, 313 K
323 K, 328 K
333 K, 338 K
343 K, 348 K
353 K.M//
F (Hz)
(b)
Fig. 4: The imaginary part of electric modulus (M//) versus frequency of (a) pure
PHB and (b) PHB-12wt% HV copolymer
It is observed that, the relaxation behaviour of the samples is distinguished by two
different relaxation peaks in low and high frequency regions. The first relaxation
peak is detected in the frequency range (0.01-1 Hz) and (0.01- 30 Hz) for pure PHB
and PHB-12wt% HV copolymer sample, respectively. This relaxation peak shifts to
higher frequencies with increasing temperatures. The frequency shift of maximum
M// with increasing temperatures corresponds to the so-called conductivity relaxation
[16]. This shift indicates that, the motion of charge carriers becomes faster, leading to
a decrease in the relaxation time with increasing temperature. On the other hand,
relaxation peak is detected as a broad peak in the frequency range (102-106 Hz), as
shown in the inset of Fig. 4a. Such broadness in relaxation which is observed in
M// spectra for all samples at high frequency side can be interpreted as a consequence
of relaxation times distribution. An additional peak is observed as a shoulder at very
low frequency f~0.01-0.1 Hz, as shown in Fig. 4a. This peak could be attributed to
the accumulation of charge carriers and assigned as Maxwell-Wagner-Sillars (MWS)
interfacial polarization.
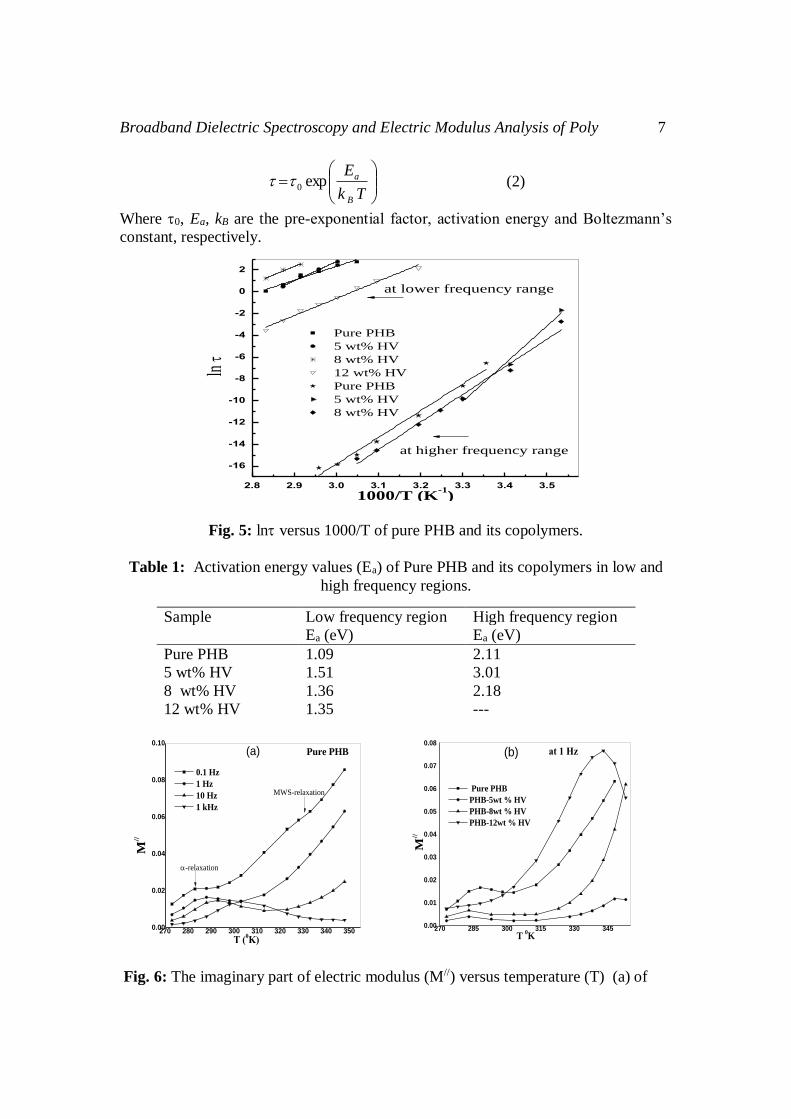
The dynamics of all relaxation mechanisms of the samples under investigation is
represented in Fig. 5. The frequency of the relaxation peak (fmax) in the low frequency
region defines the conductivity relaxation time (). At frequencies lower than fmax the
charge carriers can make long range order, whereas, at frequencies higher than fmax the
charge carriers are spatially confined and make localized motion. Hence, in this
transition region the charge carriers have the change from long range to short range
mobility along the conductivity paths [20,21]. Values of relaxation time are
calculated using the empirical formula, =1/2πfmax and summarized in Table 2.The
values of activation energy of pure PHB and its copolymers are calculated and listed
in Table 1, by knowing the slope of ln against 1/T plot, as shown in Fig. 5, using
Arrhenius equation as follows:
Broadband Dielectric Spectroscopy and Electric Modulus Analysis of Poly 7
Tk
E
B
aexp0 (2)
Where 0, Ea, kB are the pre-exponential factor, activation energy and Boltezmann’s
constant, respectively.
2.8 2.9 3.0 3.1 3.2 3.3 3.4 3.5
-16
-14
-12
-10
-8
-6
-4
-2
0
2
at higher frequency range
Pure PHB
5 wt% HV
8 wt% HV
12 wt% HV
Pure PHB
5 wt% HV
8 wt% HV
ln
1000/T (K-1
)
at lower frequency range
Fig. 5: ln versus 1000/T of pure PHB and its copolymers.
Table 1: Activation energy values (Ea) of Pure PHB and its copolymers in low and
high frequency regions.
Sample Low frequency region High frequency region
Ea (eV) Ea (eV)
Pure PHB 1.09 2.11
5 wt% HV 1.51 3.01
8 wt% HV 1.36 2.18
12 wt% HV 1.35 ---
270 280 290 300 310 320 330 340 3500.00
0.02
0.04
0.06
0.08
0.10
M//
T (0K)
0.1 Hz
1 Hz
10 Hz
1 kHz
(a) Pure PHB
-relaxation
MWS-relaxation
270 285 300 315 330 3450.00
0.01
0.02
0.03
0.04
0.05
0.06
0.07
0.08
M//
T 0K
Pure PHB
PHB-5wt % HV
PHB-8wt % HV
PHB-12wt % HV
at 1 Hz(b)
Fig. 6: The imaginary part of electric modulus (M//) versus temperature (T) (a) of
8 T. Fahmy et al
pure PHB at different frequencies and (b) of pure PHB and its copolymers
at f= 1 Hz.
Fig. 6a displays the variation of M// as a function of temperature at different
frequencies, for pure PHB Fig. 6b displays the variation of M// as a function of
temperature for pure PHB and its copolymer samples at f= 1Hz. Generally, the
behavior of pure PHB and its copolymer samples is characterized by a loss peak
around ~ 288 0K, which is attributed to the orientation related to the main chain as it is
associated with the glass transition temperature (Tg), i.e., -relaxation of pure PHB.
This transition occurs in the amorphous region of the polymer with the initiation of
the micro Brownian motion. On the other hand, another loss peak is detected at
temperature larger than glass transition temperature of pure PHB around ~ 338 0K,
and could be assigned as Maxwell-Wagner- Sillars (MWS) relaxation [22]. The
MWS interfacial polarization process exists in the heterogeneous systems due to the
difference in conductivities and permittivities of the constituents through the material
[23]. The MWS interfacial polarization needs more time in comparison with the
electronic polarization. Such behaviour is observed in semi crystalline polymeric
materials [12,24].
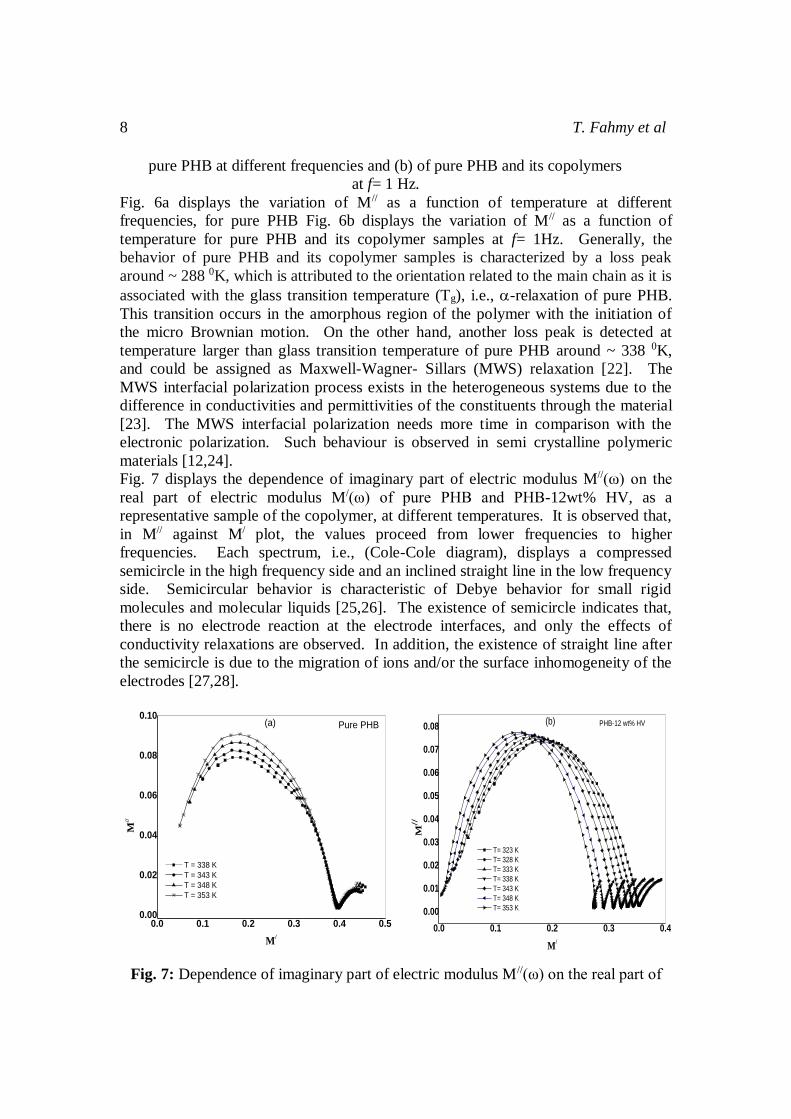
Fig. 7 displays the dependence of imaginary part of electric modulus M//(ω) on the
real part of electric modulus M/(ω) of pure PHB and PHB-12wt% HV, as a
representative sample of the copolymer, at different temperatures. It is observed that,
in M// against M/ plot, the values proceed from lower frequencies to higher
frequencies. Each spectrum, i.e., (Cole-Cole diagram), displays a compressed
semicircle in the high frequency side and an inclined straight line in the low frequency
side. Semicircular behavior is characteristic of Debye behavior for small rigid
molecules and molecular liquids [25,26]. The existence of semicircle indicates that,
there is no electrode reaction at the electrode interfaces, and only the effects of
conductivity relaxations are observed. In addition, the existence of straight line after
the semicircle is due to the migration of ions and/or the surface inhomogeneity of the
electrodes [27,28].
0.0 0.1 0.2 0.3 0.4 0.50.00
0.02
0.04
0.06
0.08
0.10
M//
M/
T = 338 K
T = 343 K
T = 348 K
T = 353 K
Pure PHB(a)
0.0 0.1 0.2 0.3 0.4
0.00
0.01
0.02
0.03
0.04
0.05
0.06
0.07
0.08
M//
M/
T= 323 K
T= 328 K
T= 333 K
T= 338 K
T= 343 K
T= 348 K
T= 353 K
PHB-12 wt% HV(b)
Fig. 7: Dependence of imaginary part of electric modulus M//(ω) on the real part of
Broadband Dielectric Spectroscopy and Electric Modulus Analysis of Poly 9
electric modulus M/(ω) of (a) pure PHB and (b) PHB-12wt% HV at fixed
temperatures.
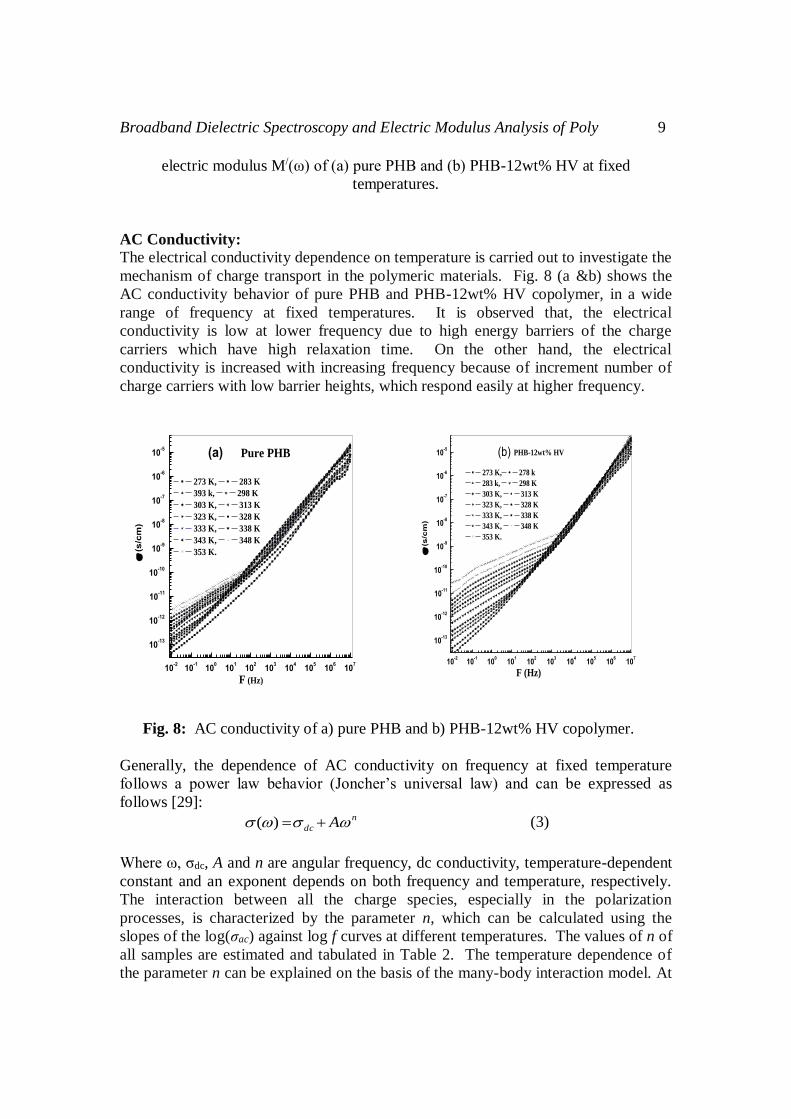
AC Conductivity:
The electrical conductivity dependence on temperature is carried out to investigate the
mechanism of charge transport in the polymeric materials. Fig. 8 (a &b) shows the
AC conductivity behavior of pure PHB and PHB-12wt% HV copolymer, in a wide
range of frequency at fixed temperatures. It is observed that, the electrical
conductivity is low at lower frequency due to high energy barriers of the charge
carriers which have high relaxation time. On the other hand, the electrical
conductivity is increased with increasing frequency because of increment number of
charge carriers with low barrier heights, which respond easily at higher frequency.
10-2
10-1
100
101
102
103
104
105
106
107
10-13
10-12
10-11
10-10
10-9
10-8
10-7
10-6
10-5
273 K, 283 K
393 k, 298 K
303 K, 313 K
323 K, 328 K
333 K, 338 K
343 K, 348 K
353 K.
Pure PHB
(
s/c
m)
F (Hz)
(a)
10-2
10-1
100
101
102
103
104
105
106
107
10-13
10-12
10-11
10-10
10-9
10-8
10-7
10-6
10-5
273 K, 278 k
283 k, 298 K
303 K, 313 K
323 K, 328 K
333 K, 338 K
343 K, 348 K
353 K.
PHB-12wt% HV
(
s/c
m)
F (Hz)
(b)
Fig. 8: AC conductivity of a) pure PHB and b) PHB-12wt% HV copolymer.
Generally, the dependence of AC conductivity on frequency at fixed temperature
follows a power law behavior (Joncher’s universal law) and can be expressed as
follows [29]: n
dc A )( (3)
Where ω, σdc, A and n are angular frequency, dc conductivity, temperature-dependent
constant and an exponent depends on both frequency and temperature, respectively.
The interaction between all the charge species, especially in the polarization
processes, is characterized by the parameter n, which can be calculated using the
slopes of the log(σac) against log f curves at different temperatures. The values of n of
all samples are estimated and tabulated in Table 2. The temperature dependence of
the parameter n can be explained on the basis of the many-body interaction model. At
10 T. Fahmy et al
higher temperatures, the interaction between neighboring dipoles is negligible, and
only the conductive element is the DC resistance [30].
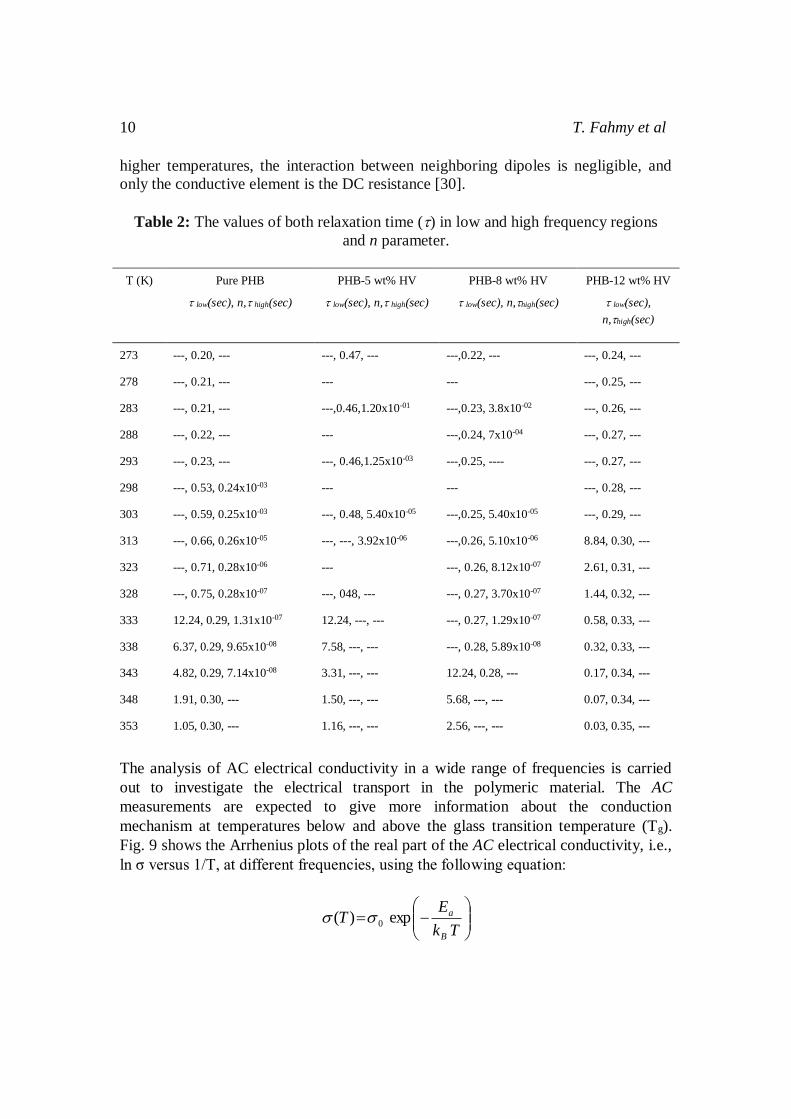
Table 2: The values of both relaxation time () in low and high frequency regions
and n parameter.
T (K) Pure PHB
low(sec), n,high(sec)
PHB-5 wt% HV
low(sec), n,high(sec)
PHB-8 wt% HV
low(sec), n,high(sec)
PHB-12 wt% HV
low(sec),
n,high(sec)
273 ---, 0.20, --- ---, 0.47, --- ---,0.22, --- ---, 0.24, ---
278 ---, 0.21, --- --- --- ---, 0.25, ---
283 ---, 0.21, --- ---,0.46,1.20x10-01 ---,0.23, 3.8x10-02 ---, 0.26, ---
288 ---, 0.22, --- --- ---,0.24, 7x10-04 ---, 0.27, ---
293 ---, 0.23, --- ---, 0.46,1.25x10-03 ---,0.25, ---- ---, 0.27, ---
298 ---, 0.53, 0.24x10-03 --- --- ---, 0.28, ---
303 ---, 0.59, 0.25x10-03 ---, 0.48, 5.40x10-05 ---,0.25, 5.40x10-05 ---, 0.29, ---
313 ---, 0.66, 0.26x10-05 ---, ---, 3.92x10-06 ---,0.26, 5.10x10-06 8.84, 0.30, ---
323 ---, 0.71, 0.28x10-06 --- ---, 0.26, 8.12x10-07 2.61, 0.31, ---
328 ---, 0.75, 0.28x10-07 ---, 048, --- ---, 0.27, 3.70x10-07 1.44, 0.32, ---
333 12.24, 0.29, 1.31x10-07 12.24, ---, --- ---, 0.27, 1.29x10-07 0.58, 0.33, ---
338 6.37, 0.29, 9.65x10-08 7.58, ---, --- ---, 0.28, 5.89x10-08 0.32, 0.33, ---
343 4.82, 0.29, 7.14x10-08 3.31, ---, --- 12.24, 0.28, --- 0.17, 0.34, ---
348 1.91, 0.30, --- 1.50, ---, --- 5.68, ---, --- 0.07, 0.34, ---
353 1.05, 0.30, --- 1.16, ---, --- 2.56, ---, --- 0.03, 0.35, ---
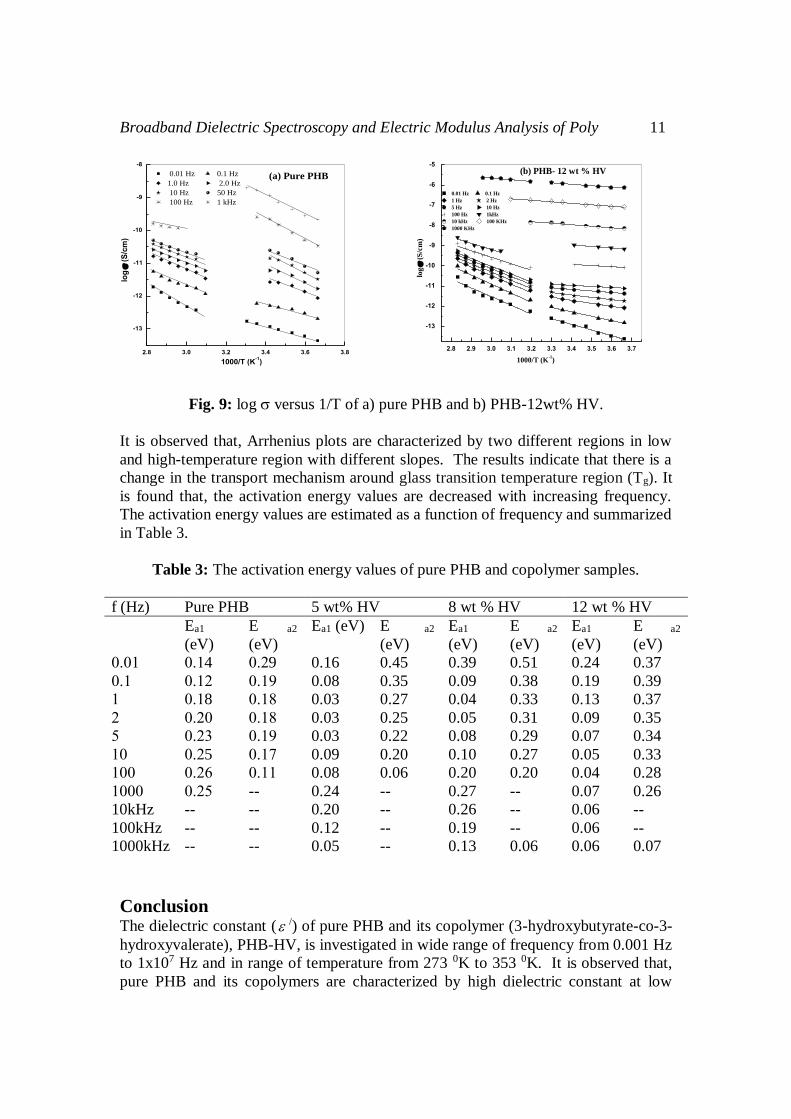
The analysis of AC electrical conductivity in a wide range of frequencies is carried
out to investigate the electrical transport in the polymeric material. The AC
measurements are expected to give more information about the conduction
mechanism at temperatures below and above the glass transition temperature (Tg).
Fig. 9 shows the Arrhenius plots of the real part of the AC electrical conductivity, i.e.,
ln σ versus 1/T, at different frequencies, using the following equation:
Tk
ET
B
aexp)( 0
Broadband Dielectric Spectroscopy and Electric Modulus Analysis of Poly 11
2.8 3.0 3.2 3.4 3.6 3.8
-13
-12
-11
-10
-9
-8
0.01 Hz 0.1 Hz
1.0 Hz 2.0 Hz
10 Hz 50 Hz
100 Hz 1 kHz
log
(
S/c
m)
1000/T (K-1)
(a) Pure PHB
2.8 2.9 3.0 3.1 3.2 3.3 3.4 3.5 3.6 3.7
-13
-12
-11
-10
-9
-8
-7
-6
-5
0.01 Hz 0.1 Hz
1 Hz 2 Hz
5 Hz 10 Hz
100 Hz 1kHz
10 kHz 100 KHz
1000 KHz
log
(S
/cm
)
1000/T (K-1)
••••Equ ••••y =
�•••Adj 0.97679
T �•••Int
T Slope
U �•••Int
U Slope
V �•••Int
V Slope
W �•••Int
W Slope
X �•••Int
X Slope
Y �•••Int
Y Slope
Z �•••Int
Z Slope
AA �•••Int
AA Slope
AB �•••Int
AB Slope
AC �•••Int
AC Slope
AD �•••Int
AD Slope
AE �•••Int
AE Slope
O �•••Int
O Slope
R �•••Int
R Slope
AK �•••Int
AK Slope
AL �•••Int
AL Slope
AN �•••Int
(b) PHB- 12 wt % HV
Fig. 9: log versus 1/T of a) pure PHB and b) PHB-12wt% HV.
It is observed that, Arrhenius plots are characterized by two different regions in low
and high-temperature region with different slopes. The results indicate that there is a
change in the transport mechanism around glass transition temperature region (Tg). It
is found that, the activation energy values are decreased with increasing frequency.
The activation energy values are estimated as a function of frequency and summarized
in Table 3.
Table 3: The activation energy values of pure PHB and copolymer samples.
f (Hz) Pure PHB 5 wt% HV 8 wt % HV 12 wt % HV
Ea1
(eV)
E a2
(eV)
Ea1 (eV) E a2
(eV)
Ea1
(eV)
E a2
(eV)
Ea1
(eV)
E a2
(eV)
.0.0 .004 .009 0.16 0.45 0.39 0.51 0.24 0.37
.00 .000 .000 0.08 0.35 0.09 0.38 0.19 0.39
0 .008 .000 0.03 0.27 0.04 0.33 0.13 0.37
0 .00. .000 0.03 0.25 0.05 0.31 0.09 0.35
5 .000 .000 0.03 0.22 0.08 0.29 0.07 0.34
0. .005 .000 0.09 0.20 0.10 0.27 0.05 0.33
0.. .000 .000 0.08 0.06 0.20 0.20 0.04 0.28
0... .005 -- 0.24 -- 0.27 -- 0.07 0.26
10kHz -- -- 0.20 -- 0.26 -- 0.06 --
100kHz -- -- 0.12 -- 0.19 -- 0.06 --
1000kHz -- -- 0.05 -- 0.13 0.06 0.06 0.07
Conclusion The dielectric constant ( /) of pure PHB and its copolymer (3-hydroxybutyrate-co-3-
hydroxyvalerate), PHB-HV, is investigated in wide range of frequency from 0.001 Hz
to 1x10⁷ Hz and in range of temperature from 273 0K to 353 0K. It is observed that,
pure PHB and its copolymers are characterized by high dielectric constant at low
12 T. Fahmy et al
frequency and high temperature. This behavior is attributed to interfacial polarization,
(Maxwell-Wagner-Sillars) polarization. The behavior of imaginary part of electric
modulus (M//) as a function of frequency for all samples is carried out to suppress the
electrode effect. It is found that, this behavior is distinguished by two relaxation
regions in low and high frequency. In addition, the behavior of (M//) with temperature
for the samples is characterized by two different relaxation peaks. The first one is
positioned in the region of Tg of pure PHB, whereas, the second peak at temperature ~
338 0K, and is assigned as Maxwell-Wagner- Sillars (MWS) relaxation. AC electrical
conductivity of all samples is investigated. The Arrhenius plots of AC conductivity
showed a remarkable change in the conduction mechanism in glass transition
temperature region of pure PHB.
Acknowledgement We would like to thank Prince Sattam bin Abdulaziz University, KSA and Deanship
of Scientific Research for their supporting. The work is supported by the Deanship of
Scientific Research in Prince Sattam bin Abdulaziz University, Saudi Arabia under
Grant No. 0.02/01/2258.
References
[1] Yu, W. Lan, C-H. Wang, S-J. Fang, P-F. and Sun, Y-M, Influence of zinc
oxide nanoparticles on the crystallization behavior of electrospun poly (3-
hydroxybutyrate-co-3-hydroxyvalerate) nanofibers, Polymer, 51: 2403-2409
(2010).
[2] Doi, Y. and Steinbuchel, A, Biopolymers, Weinheim, Germany, Wiley-VCH,
(2002).
[3] Khanna, S. and Srivastava, A. K, Recent advances in microbial
polyhydroxyalkanoates, Process Biochem. 40: 607-619 (2005).
[4] Mitomo, H. Barham, P. J. and Keller, A, Crystallization and morphology of
poly(p- hydroxybutyrate) and its copolymer, Polym. J. 19: 1241-1253 (1987).
[5] Gassner, F. and Owen, A.J, Some properties of poly(3hydroxybutyrate)-poly(3-
hydroxyvalerate) blends. Polymer Inter. 39: 215-219, (1996).
[6] Madbouly, S. A. and Otaigbe, J. U, Broadband dielectric spectroscopy of
nanostructured maleated polypropylene/polycarbonate blends prepared by in
situpolymerization and compatibilization, Polymer. 48: 4097-4107, (2007).
[7] Yadav, V. S, Sahu, D. K. Singh, Y. and Dhubkarya, D.C, The Effect of
Frequency and Temperature on Dielectric Properties of Pure Poly Vinylidene
Fluoride (PVDF) Thin Films, Proceedings of the Inter. MultiConf. of Engineers
and Computer Scientists, IMECS, Vol. 3. Hong Kong, (2010).
[8] La Rosa, A. D. Heux, L. and Cavaille, J. Y, Secondary relaxations in poly(allyl
alcohol), PAA, and poly(vinyl alcohol), PVA. II. Dielectric relaxations
compared with dielectric behaviour of amorphous dried and hydrated cellulose
and dextran, Polymer. 42: 5371-5379, (2001).
Broadband Dielectric Spectroscopy and Electric Modulus Analysis of Poly 13
[9] Runt, J. P. and Fitzgerald, J. J, Dielectric Spectroscopy of Polymeric Materials,
American Chem. Soc., P.3 Washington, DC, (1997).
[10] Brown, S. B. and Orlando, C. M, In Encyclopedia of Polymer Science and
Engineering, Wiley-Interscience, John Wiley &Sons: NY, (1988).
[11] Shafee, E. E, The influence of semicrystalline morphology on the dielectric
relaxation properties of poly (3-hydroxybutyrate). Eur. Polym. J. 37: 1677-
1684, (2001).
[12] Hanafy, T. A. Elbanna, K. El-Sayed, S. and Hassan, A, Dielectric Relaxation
Analysis of Biopolymer Poly (3-hydroxybutyrate). J. Appl. Polym. Sci. 121:
3306-3313, (2011).
[13] Fahmy, T. and Ahmed, M. T, Dielectric Relaxation Spectroscopy and AC
Conductivity of Doped Poly (Vinyl Alcohol). Inter. J. Mater. Phys. 6: 7-20
(2015).
[14] Fahmy, T, Dielectric Relaxation Spectroscopy of Poly (Vinyl Chloride-co-
Vinyl Acetate-co-2-Hydroxypropyl Acrylate)/ Poly (Acrylonitrile-Butadiene-
Styrene) Polymer Blend. Polym. Plast. Tech. & Eng. 46: 7-18 (2007).
[15] Chen, S. A. and Liao, C.S, Conductivity relaxation and chain motions of
poly(3-alkylthiophenes). Macromolecules. 26: 2810-2816 (1993).
[16] Tsangaris, G.M. Psarras, G. C. and Kouloumbi, N, Electric modulus and
interfacial polarization in composite polymeric systems. J. Mater. Sci. 33:
2027-2037 (1998).
[17] Ladhar, A, Arous, M, Kaddami, H, Raihane, M, Kallel, A, F.Graça, M. P. and
Cost, L. C, Molecular dynamics of nanocomposites natural rubber/cellulose
nanowhiskers investigated by impedance spectroscopy. J. Molec. Liq. 196:
187-191 (2014).
[18] Migahed, M. D. Ishra, M. Fahmy, T. and Barakat, A, Electric modulus and AC
conductivity studies in conducting PPy composite films at low temperature. J.
Phys. Chem. Solids. 65: 1121-1125 (2004).
[19] MacCrum, N. G. Read, B. E. and Williams, G, Anelastic and Dielectric Effects
in Polymeric Solids. John Wiley &Sons, Ltd., London (1967).
[20] Xu, P and Zhang, X, Investigation of MWS polarization and dc conductivity in
polyamide 610 using dielectric relaxation spectroscopy. Eur. Polym. J. 47:
1031-1038 (2011).
[21] Bohmer, R. and Angell, C. A, Correlations of the Non-exponentiality and State
Dependence of Mechanical Relaxations with Bond Connectivity in Ge-As-Se
Supercooled Liquid. Phys. Rev. B. 45: 10091-10094 (1992).
[22] Pratt, G. J. and Smith, M. J. A, Dielectric relaxation spectroscopy of a poly-β-
hydroxybutyratehomopolymer. Eur. Polym. J. 33: 857-861 (1997).
[23] Boyd, R. H. and Liu, F, In dielectric Spectroscopy of Polymeric Materials.
Eds., American Chemical Society, Washington, DC (1997).
[24] Fahmy, T, Dielectric Relaxation and Electrical Conductivity Study in Thiourea-
Doped Poly (Vinyl Alcohol). Inter., J. Polym. Mater. 50: 109-127 (2001).
[25] Hilker, B. Fields, K. B. Stern, A. Space, B. Zhang, X. P. and Harmon, J. P,
Dielectric analysis of poly (methyl methacrylate) zinc(II) mono-
pinacolboranediphenylporphyrin composites. Polymer. 51: 4790-4805 (2010).
14 T. Fahmy et al
[26] Debye, P, Dielectric Properties of Pure Liquids. Chem. Rev. 19: 171-182
(1936).
[27] Macdonald, J. R, Impedance spectroscopy. Wiley, NY (1987).
[28] Watanabe, M. Sanui, K. Ogata, N. Kobayashi, T. and Ohtaki, Z, Ionic
Conductivity and Mobility in Network Polymers from Poly (propylene oxide)
Containing Lithium Perchlorate. J. Appl. Phys. 57: 123-128 (1985).
[29] Joncher, A. K, The ‘universal’ dielectric response. Nature. 267: 673-679 (1977).
[30] Venkateswarlu, P. Laha, A. and Krupanidhi, S. B, AC properties of laser ablated
La-modified lead titanate. Thin Solid Films 474: 1-9 (2004).