Embed Size (px)
Citation preview
BROWARD COUNTY, FLORIDA AND INCORPORATED AREAS
Community Name Community
Number
BROWARD COUNTY (UNINCORPORATED AREAS) 125093
COCONUT CREEK, CITY OF 120031
COOPER CITY, CITY OF 120032
CORAL SPRINGS, CITY OF 120033
Community Name Community
Number DANIA BEACH, CITY OF 120034
DAVIE, TOWN OF 120035 OAKLAND PARK, CITY OF 120050
DEERFIELD BEACH, CITY OF 125101 PARKLAND, CITY OF 120051
FORT LAUDERDALE, CITY OF 125105 PEMBROKE PARK, TOWN OF 120052
HALLANDALE BEACH, CITY OF 125110 PEMBROKE PINES, CITY OF 120053
HILLSBORO BEACH, TOWN OF 120040 PLANTATION, CITY OF 120054 HOLLYWOOD, CITY OF 125113 POMPANO BEACH, CITY OF 120055 LAUDERDALE-BY-THE-SEA,
TOWN OF 125123 SEA RANCH LAKES,
VILLAGE OF 120056
LAUDERDALE LAKES, CITY OF 120043 SEMINOLE TRIBE OF FLORIDA 120685
LAUDERHILL, CITY OF 120044 SOUTHWEST RANCHES, TOWN OF 120691
LAZY LAKE, VILLAGE OF 120045 SUNRISE, CITY OF 120328
LIGHTHOUSE POINT, CITY OF 125125 TAMARAC, CITY OF 120058
MARGATE, CITY OF 120047 WEST PARK, CITY OF 120222
MIRAMAR, CITY OF 120048 WESTON, CITY OF 120678
NORTH LAUDERDALE, CITY OF 120049 WILTON MANORS, CITY OF 125156
Federal Emergency Management Agency FLOOD INSURANCE STUDY NUMBER
12011CV000A
Broward County
REVISED August 18, 2014
1
NOTICE TO FLOOD INSURANCE STUDY USERS
Communities participating in the National Flood Insurance Program have established repositories of flood hazard data for floodplain management and flood insurance purposes. This Flood Insurance Study may not contain all data available within the repository. It is advisable to contact the community repository for any additional data.
Part or all of this Flood Insurance Study may be revised and republished at any time. In addition, part of this Flood Insurance Study may be revised by the Letter of Map Revision process, which does not involve republication or redistribution of the Flood Insurance Study. It is, therefore, the responsibility of the user to consult with community officials and to check the community repository to obtain the most current Flood Insurance Study components. A listing of the Community Map Repositories can be found on the Index Map.
Initial Countywide FIS Effective Date: August 18, 1992
First Countywide FIS Revision Date: October 2, 1997
Second Countywide FIS Revision Date: August 18, 2014
i
TABLE OF CONTENTS
Page
1.0 INTRODUCTION ........................................................................................................................... 4
1.1 Purpose of Study ............................................................................................................... 4 1.2 Authority and Acknowledgments ...................................................................................... 4 1.3 Coordination ...................................................................................................................... 6
2.0 AREA STUDIED ............................................................................................................................ 6
2.1 Scope of Study .................................................................................................................. 6 2.2 Community Description .................................................................................................... 8 2.3 Principal Flood Problems .................................................................................................. 9 2.4 Flood Protection Measures .............................................................................................. 10
3.0 ENGINEERING METHODS ........................................................................................................ 11
3.1 Hydrologic Analysis ........................................................................................................ 11 3.1.1 Methods for Flooding Sources Incorporated from Previous Studies .................... 12 3.1.2 Methods for Flooding Sources with New or Revised Analyses in Current Study.12 3.2 Hydraulic Analyses ......................................................................................................... 19 3.2.1 Methods for Flooding Sources with New or Revised Analyses in Current Study.19 3.2.2 Methods for Flooding Sources Incorporated from Previous Studies .................... 19 3.3 Coastal Storm Surge ........................................................................................................ 20 3.4 Coastal Analyses ............................................................................................................. 22 3.5 Vertical Datum ................................................................................................................ 33
4.0 FLOODPLAIN MANAGEMENT APPLICATIONS ................................................................... 33
4.1 Floodplain Boundaries .................................................................................................... 34 4.2 Floodways ....................................................................................................................... 34
5.0 INSURANCE APPLICATIONS ................................................................................................... 35
6.0 FLOOD INSURANCE RATE MAP ............................................................................................. 36
7.0 OTHER STUDIES ......................................................................................................................... 43
8.0 LOCATION OF DATA ................................................................................................................. 43
ii
TABLE OF CONTENTS (Continued)
9.0 BIBLIOGRAPHY AND REFERENCES ...................................................................................... 43
10.0 REVISION DESCRIPTION .......................................................................................................... 47
10.1 First Revision (Revised October 2, 1997) ................................................................... 50 10.2 Second Revision (Revised August 18, 2014) .............................................................. 50
FIGURES
Figure 1: Transect Location Map ............................................................................................................... 29 Figure 2: Transect Schematic ..................................................................................................................... 32 Figure 3: Floodway Schematic .................................................................................................................. 35
TABLES
Table 1: Flooding Sources Studied by Detailed Methods ............................................................................ 7 Table 2: Letters of Map Revision ................................................................................................................ 7 Table 3: Upstream Boundary Conditions ................................................................................................... 14 Table 4: Downstream Boundary Conditions .............................................................................................. 15 Table 5: Rainfall for the 10-, 2-, 1-, and 0.2-Percent-Annual-Chance Storms .......................................... 16 Table 6: Summary of Discharges ............................................................................................................... 17 Table 7: Parameter Values for Surge Elevations ....................................................................................... 21 Table 8: Summary of Stillwater Elevations ............................................................................................... 24 Table 9: Transect Locations, Stillwater Starting Elevations, and Initial Wave Crest Elevations .............. 29 Table 10: Community Map History ........................................................................................................... 37
iii
TABLE OF CONTENTS (Continued)
EXHIBITS
Exhibit 1 – Flood Profiles
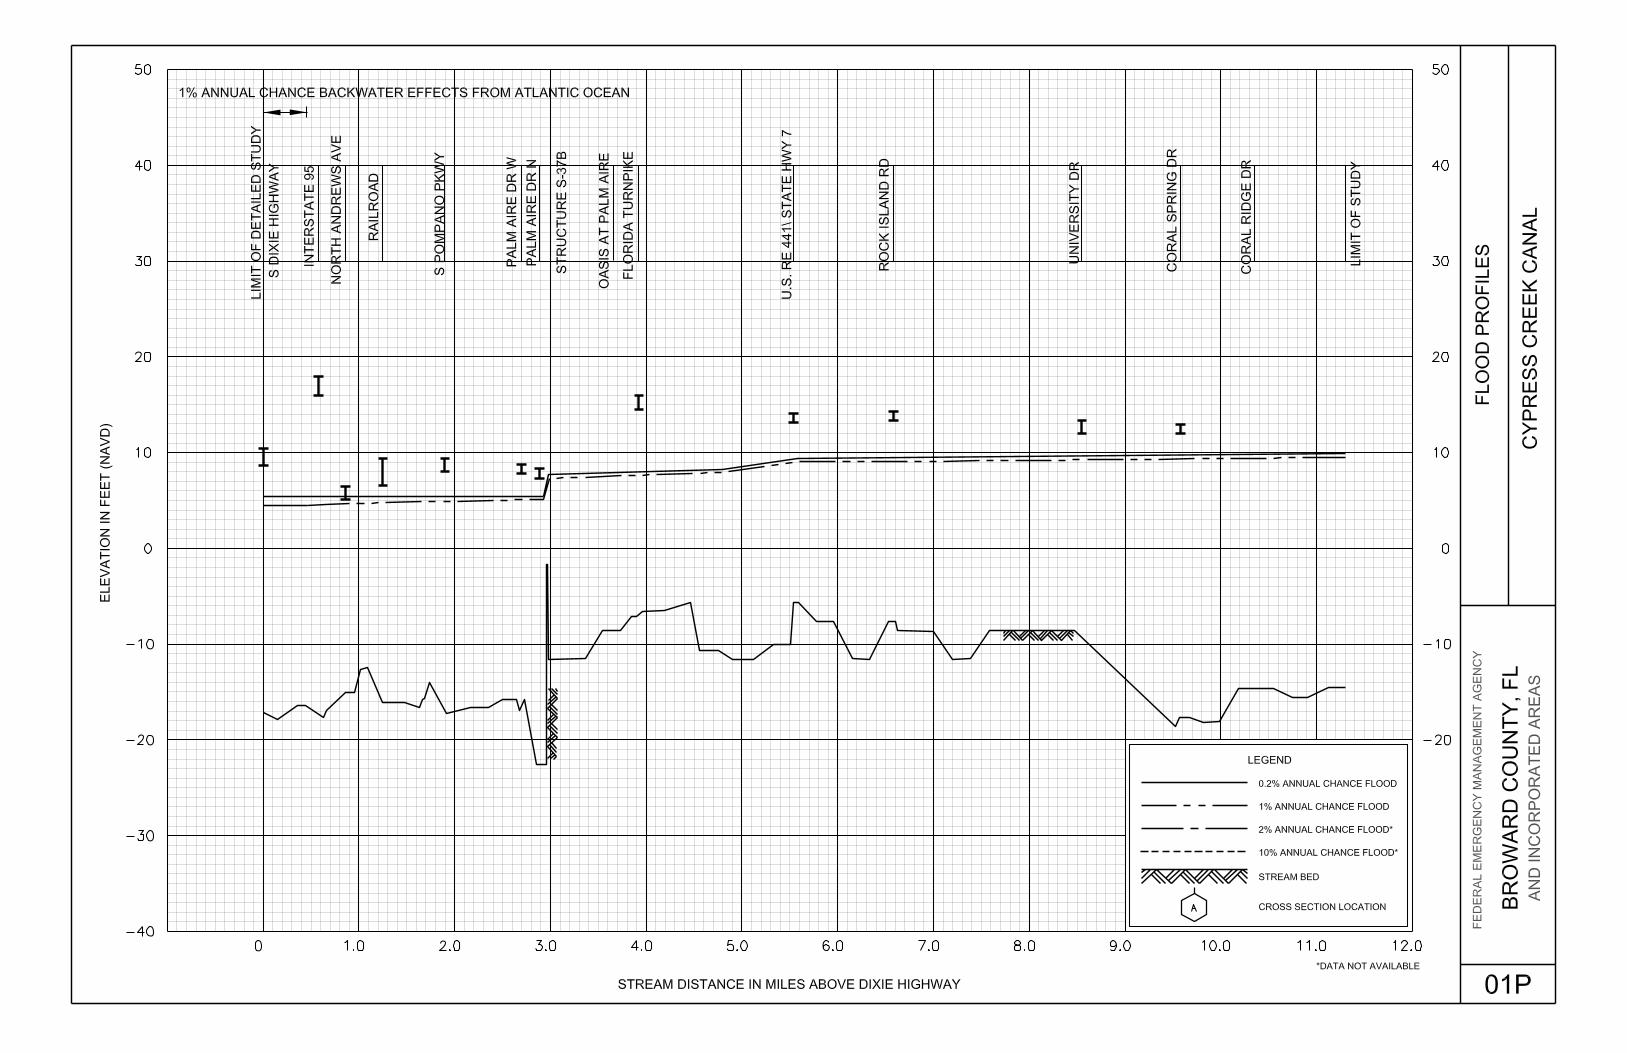
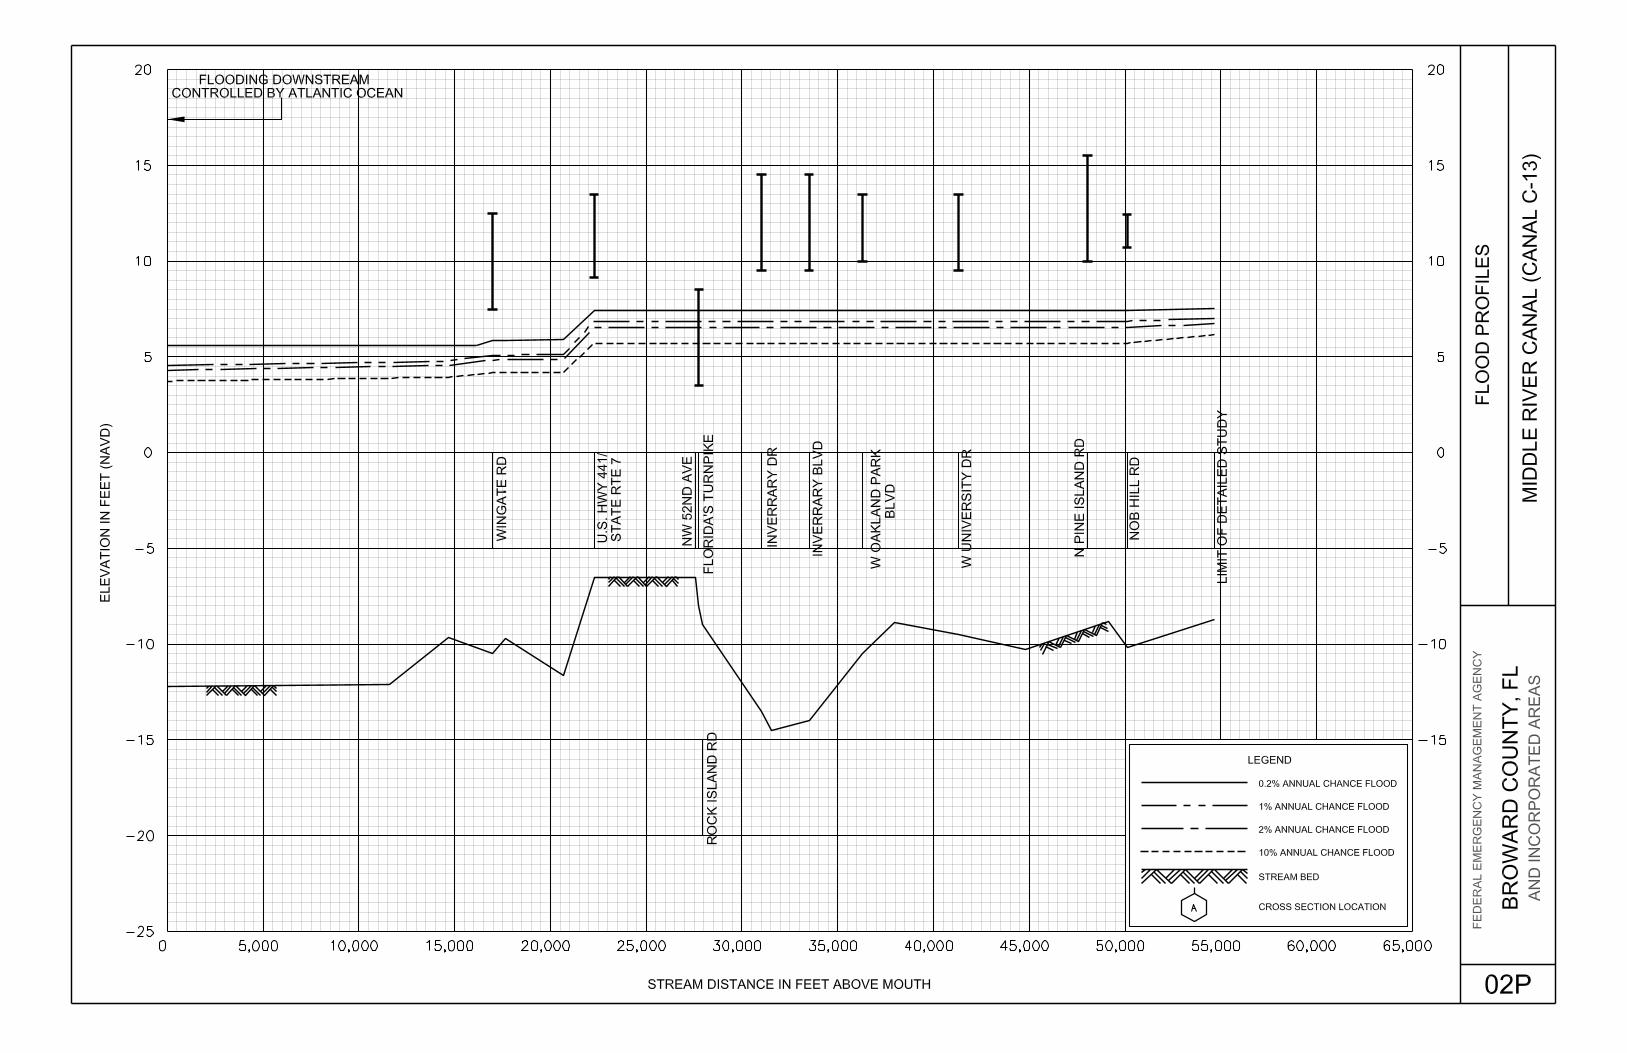
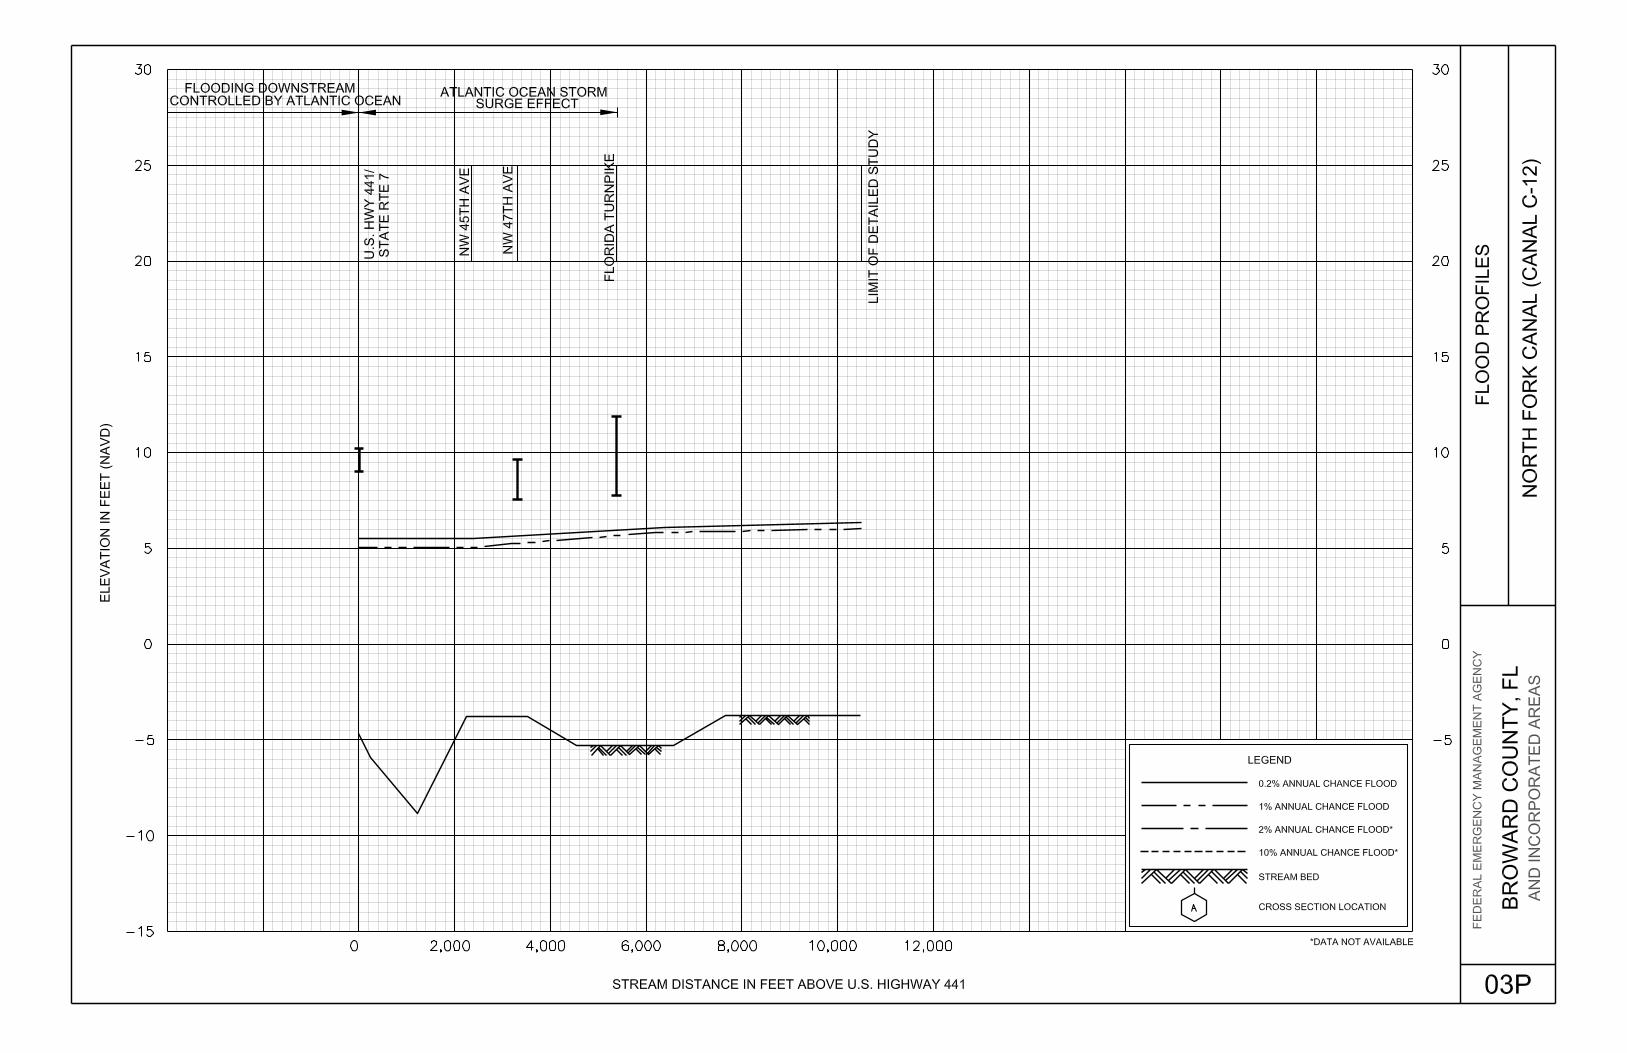
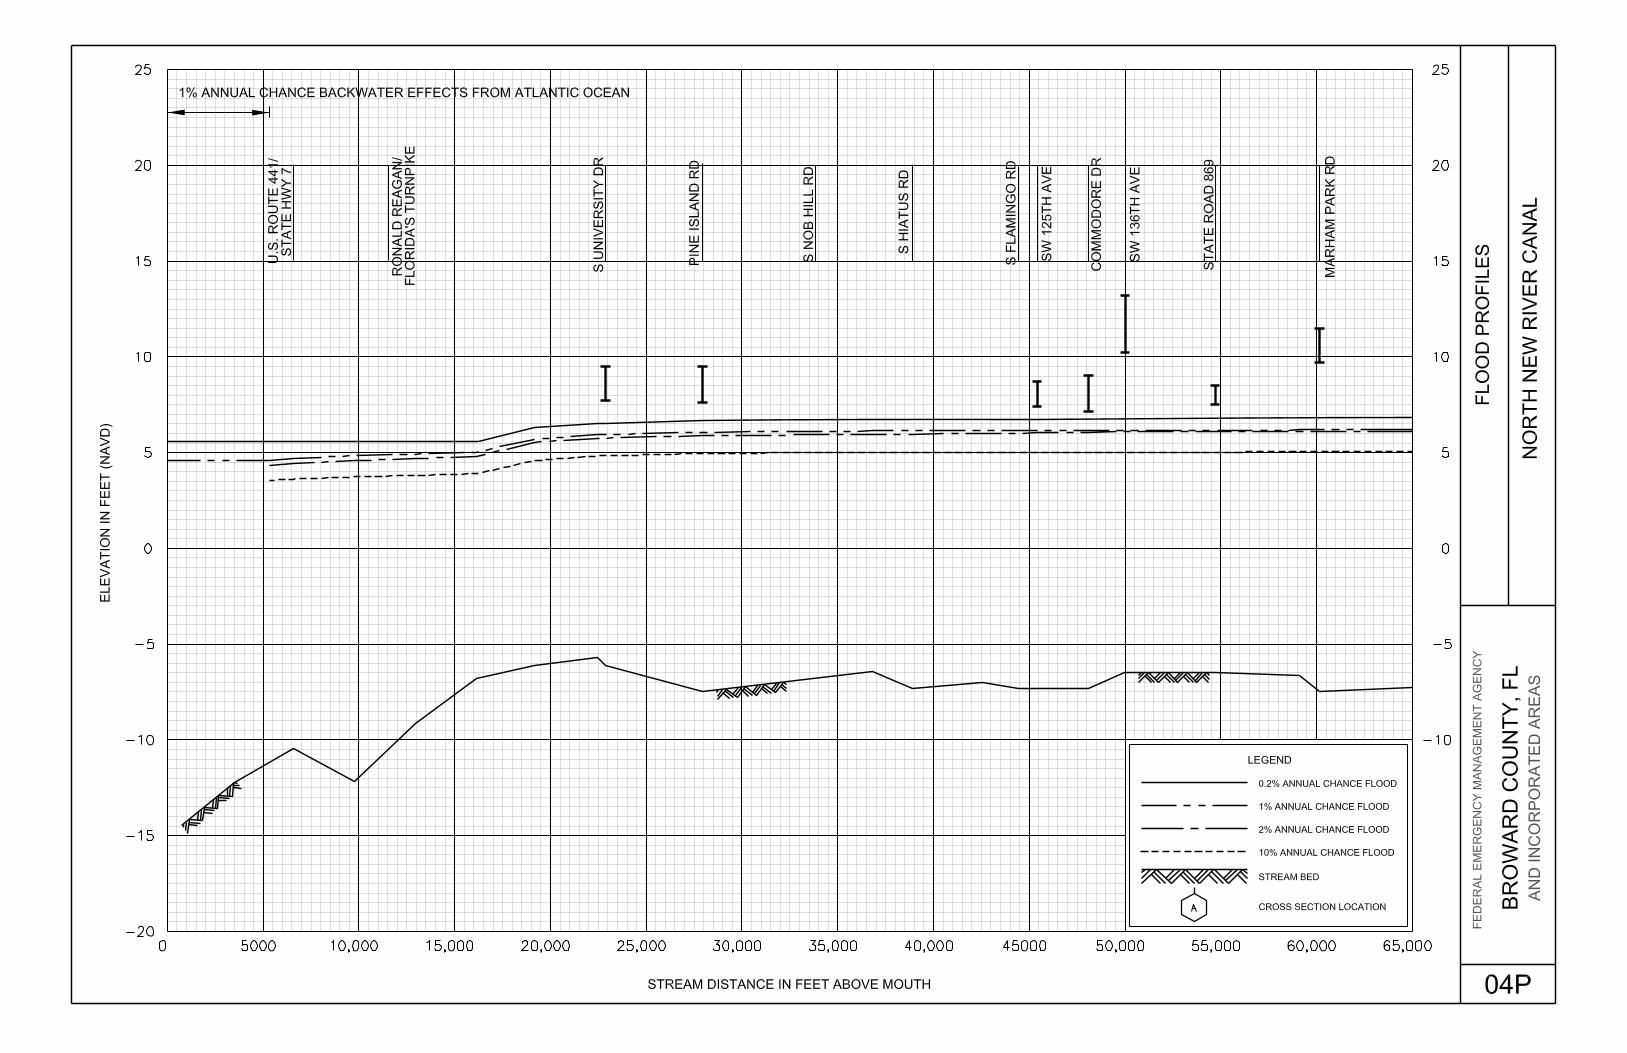
Cypress Creek Canal Panel 01P Middle River Canal (Canal C-13) Panel 02P North Fork Canal (Canal C-12) Panel 03P North New River Canal Panel 04P - 05P Pompano Canal Panel 06P South New River Canal Panel 07P – 08P
Exhibit 2 – Flood Insurance Rate Map Index (Published Separately)
Flood Insurance Rate Maps (Published Separately)
4
FLOOD INSURANCE STUDY
BROWARD COUNTY, FLORIDA AND INCORPORATED AREAS
1.0 INTRODUCTION
1.1 Purpose of Study
This Flood Insurance Study (FIS) revises and updates information on the existence and severity of flood hazards in the geographic area of Broward County, including the Cities of Coconut Creek, Cooper City, Coral Springs, Dania Beach, Deerfield Beach, Fort Lauderdale, Hallandale Beach, Hollywood, Lauderdale Lakes, Lauderhill, Lighthouse Point, Margate, Miramar, North Lauderdale, Oakland Park, Parkland, Pembroke Pines, Plantation, Pompano Beach, Sunrise, Tamarac, West Park, Weston and Wilton Manors; the Towns of Davie (including the area formerly known as the Village of Hacienda), Hillsboro Beach, Lauderdale-By-The-Sea, Pembroke Park, and Southwest Ranches; the Villages of Lazy Lake and Sea Ranch Lakes; the Seminole Tribe of Florida; and the unincorporated areas of Broward County (referred to collectively herein as Broward County).
This FIS aids in the administration of the National Flood Insurance Act of 1968 and the Flood Disaster Protection Act of 1973. This study has developed flood-risk data for various areas of the community that will be used to establish actuarial flood insurance rates and to assist the community in its efforts to promote sound floodplain management. Minimum floodplain management requirements for participation in the National Flood Insurance Program (NFIP) are set forth in the Code of Federal Regulations at 44 CFR, 60.3.
In some States or communities, floodplain management criteria or regulations may exist that are more restrictive or comprehensive than the minimum Federal requirements. In such cases, the more restrictive criteria take precedence, and the State (or other jurisdictional agency) will be able to explain them.
The Digital Flood Insurance Rate Map (DFIRM) and FIS Report for this countywide study have been produced in digital format. Flood hazard information was converted to meet the Federal Emergency Management Agency (FEMA) DFIRM database specifications and geographic information standards. This information is provided in a digital format so that it can be incorporated into a local Geographic Information System (GIS) and be accessed more easily by the community.
1.2 Authority and Acknowledgments
The sources of authority for this FIS report are the National Flood Insurance Act of 1968 and the Flood Disaster Protection Act of 1973.
For the October 2, 1997, revision, the updated coastal analyses were prepared by Dewberry & Davis under contract to FEMA. That work was completed in December 1995.
5
For the original August 18, 1992, countywide FIS, the hydrologic and hydraulic analyses for Pompano Canal, Cypress Creek Canal (Canal C14), Middle River Canal (Canal C-13), North Fork Canal (Canal C-12), North New River Canal, and South New River Canal (Canal C-11) were prepared by Post, Buckley, Schuh & Jernigan for FEMA under Contract No. EMW-85-C1908. That work was completed in April 1989.
The original storm surge and coastal analyses for areas affected by flooding from the Atlantic Ocean were prepared by FEMA in December 1988.
The hydrologic and hydraulic analyses for the following areas were taken from the FIS for the unincorporated areas of Broward County: Crystal Lake; Hillsboro Canal; and ponding areas at the intersection of State Road 7 and Northeast 19th Avenue, the intersection of Northwest 74th Place and Lyons Road, the intersection of University Drive and Coral Springs Drive, and the intersection of Coral Ridge Drive and Remsberg Drive (Reference 1).
The hydrologic and hydraulic analyses for the area at the intersection of Powerline Road and Green Road and at the intersection of State Road 7 and Northeast 19th Avenue were taken from the FIS reports for the City of Deerfield Beach and the unincorporated areas of Broward County (References 2 and 1).
The hydrologic and hydraulic analyses for the area near the intersection of Trotters Lane and University Drive were taken from the FIS reports for the City of Parkland and the unincorporated areas of Broward County (References 3 and 1).
The hydrologic and hydraulic analyses for the area near the intersection of Cullum Road and Banks Road were taken from the FIS for the City of Coconut Creek (Reference 4).
The hydrologic and hydraulic analyses for the area of north of Holmberg Road were taken from the FIS for the City of Parkland (Reference 3).
The hydrologic and hydraulic analyses for the geographic area south of Hollywood Boulevard between the conservation area and the Florida Turnpike were taken from the FIS for the City of Pembroke Pines and the FIRM for the City of Miramar (References 5 and 6).
For this revision of the countywide FIS report, new hydrologic and hydraulic analyses were performed by the Watershed IV Alliance for the Federal Emergency Management Agency (FEMA), under Contract No. EMA-2002-CO-011A, Task Order No. 023. Hydrologic and hydraulic analyses were performed for Middle River Canal, North New River Canal and South New River Canal. Coastal and storm surge analyses were modified for areas affected by flooding from the Atlantic Ocean.
The coordinate system used for the production of this FIRM is Transverse Mercator State Plane Florida East FIPS 0901. The horizontal datum is North American Datum of 1983 (NAD 83) HARN, GRS 1980 spheroid. Differences in the datum, spheroid, projection or State Plane zones used in production of FIRMs for adjacent counties may result in slight
6
positional differences in map features at the county boundaries. These differences do not affect the accuracy of information shown on the FIRM.
1.3 Coordination
An initial Consultation Coordination Officer (CCO) meeting (also occasionally referred to as the Scoping meeting) is held with representatives of the communities, FEMA, and the study contractors to explain the nature and purpose of the FIS and to identify the streams to be studied by detailed methods. A final CCO (often referred to as the Preliminary DFIRM Community Coordination, or PDCC, meeting) is held with representatives of the communities, FEMA, and the study contractors to review the results of the study.
For the revision dated October 2, 1997, FEMA notified the county by letter on April 27, 1995, that a revision would be prepared using Dewberry & Davis' coastal analyses.
For the initial countywide FIS report dated August 18, 1992, a final CCO meeting was held on January 10, 1991, and was attended by representatives of Post, Buckley, Schuh & Jernigan, Broward County, and FEMA.
For this revision of the countywide FIS, the initial CCO meeting was held on September 29, 2008, and attended by representatives of FEMA, the Watershed IV Alliance, Broward County and local communities, the State of Florida, and various consulting firms.
The results of the study were reviewed at the final CCO meeting held on November14, 2011, and attended by representatives of the study contractors and communities. All problems raised at that meeting have been addressed in this study.
2.0 AREA STUDIED
2.1 Scope of Study
This FIS report covers the geographic area of Broward County, Florida, including the incorporated communities listed in Section 1.1.
A total of 60 stream miles were updated using detailed methods (including conversion of miles of effective Zone A reaches). Floodplain boundaries of Coastal AE areas, streams and ponding areas that had been previously studied by detailed methods were redelineated based on more detailed and up-to-date topographic mapping for this FIS report.
7
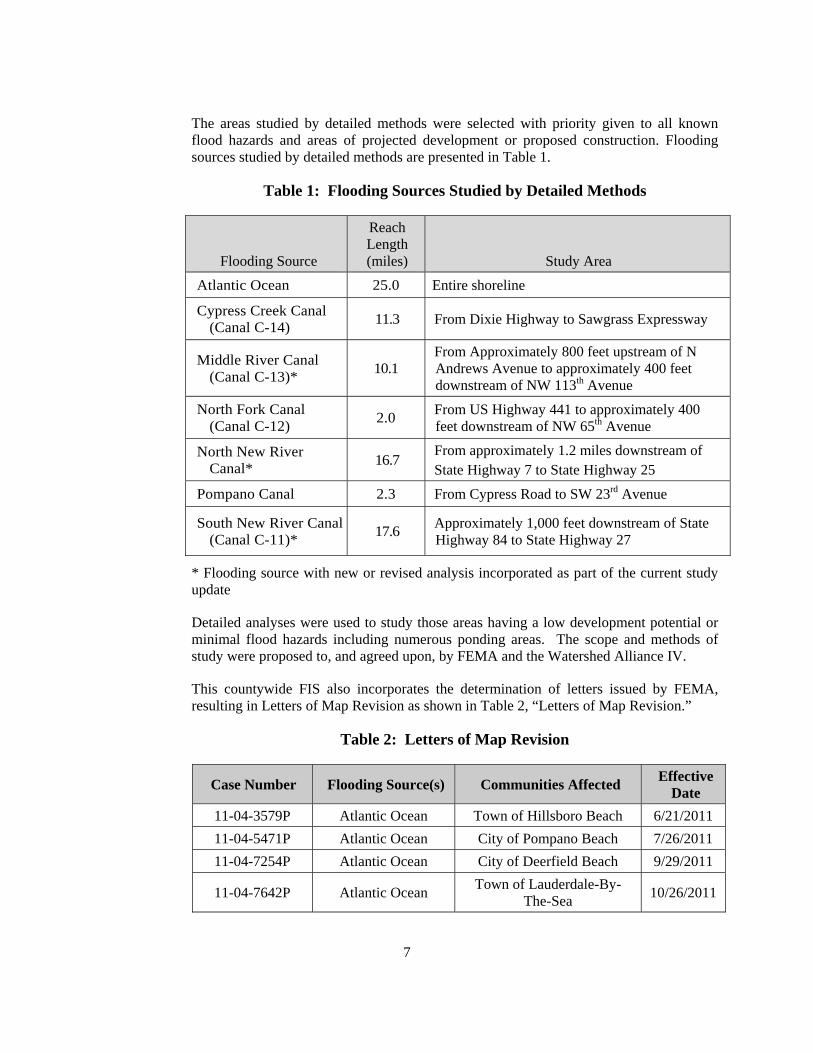
The areas studied by detailed methods were selected with priority given to all known flood hazards and areas of projected development or proposed construction. Flooding sources studied by detailed methods are presented in Table 1.
Table 1: Flooding Sources Studied by Detailed Methods
Flooding Source
Reach Length (miles) Study Area
Atlantic Ocean 25.0 Entire shoreline
Cypress Creek Canal (Canal C-14) 11.3 From Dixie Highway to Sawgrass Expressway
Middle River Canal (Canal C-13)* 10.1
From Approximately 800 feet upstream of N Andrews Avenue to approximately 400 feet downstream of NW 113th Avenue
North Fork Canal (Canal C-12) 2.0 From US Highway 441 to approximately 400
feet downstream of NW 65th Avenue
North New River Canal* 16.7
From approximately 1.2 miles downstream of State Highway 7 to State Highway 25
Pompano Canal 2.3 From Cypress Road to SW 23rd Avenue
South New River Canal (Canal C-11)* 17.6 Approximately 1,000 feet downstream of State
Highway 84 to State Highway 27
* Flooding source with new or revised analysis incorporated as part of the current study update
Detailed analyses were used to study those areas having a low development potential or minimal flood hazards including numerous ponding areas. The scope and methods of study were proposed to, and agreed upon, by FEMA and the Watershed Alliance IV.
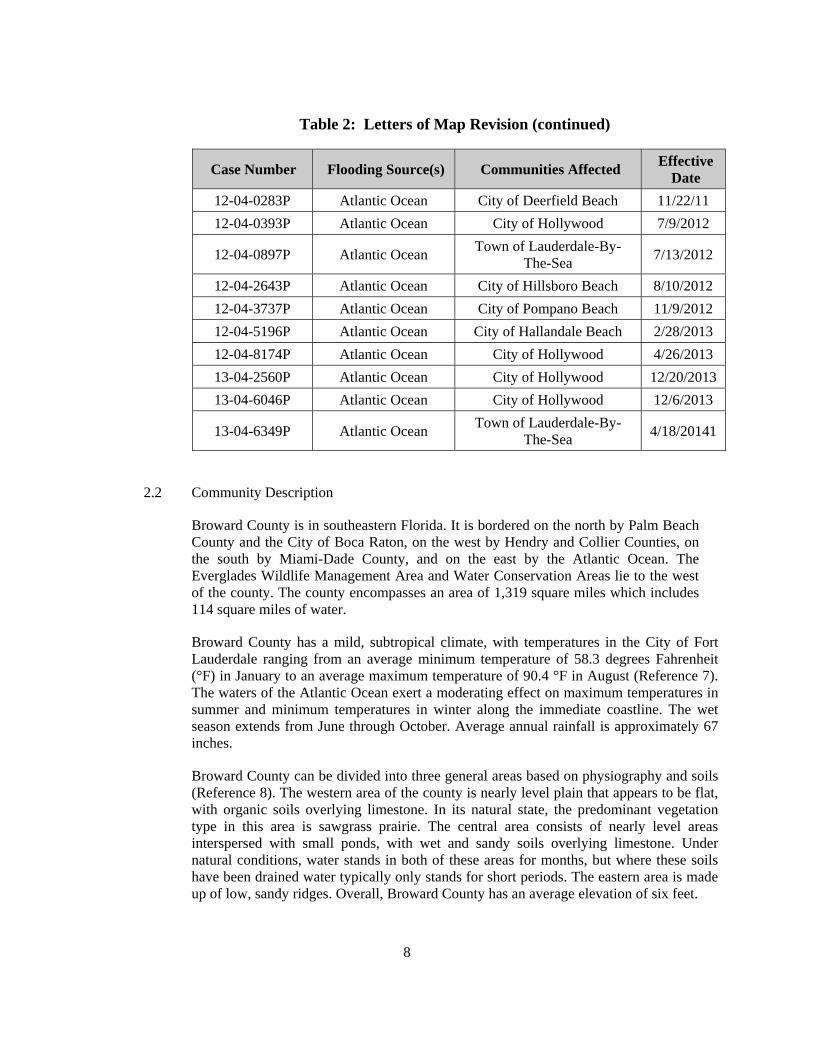
This countywide FIS also incorporates the determination of letters issued by FEMA, resulting in Letters of Map Revision as shown in Table 2, “Letters of Map Revision.”
Table 2: Letters of Map Revision
Case Number Flooding Source(s) Communities Affected Effective Date
11-04-3579P Atlantic Ocean Town of Hillsboro Beach 6/21/2011 11-04-5471P Atlantic Ocean City of Pompano Beach 7/26/2011 11-04-7254P Atlantic Ocean City of Deerfield Beach 9/29/2011
11-04-7642P Atlantic Ocean Town of Lauderdale-By-The-Sea 10/26/2011
8
Table 2: Letters of Map Revision (continued)
Case Number Flooding Source(s) Communities Affected Effective Date
12-04-0283P Atlantic Ocean City of Deerfield Beach 11/22/11 12-04-0393P Atlantic Ocean City of Hollywood 7/9/2012
12-04-0897P Atlantic Ocean Town of Lauderdale-By-The-Sea 7/13/2012
12-04-2643P Atlantic Ocean City of Hillsboro Beach 8/10/2012 12-04-3737P Atlantic Ocean City of Pompano Beach 11/9/2012 12-04-5196P Atlantic Ocean City of Hallandale Beach 2/28/2013 12-04-8174P Atlantic Ocean City of Hollywood 4/26/2013 13-04-2560P Atlantic Ocean City of Hollywood 12/20/2013 13-04-6046P Atlantic Ocean City of Hollywood 12/6/2013
13-04-6349P Atlantic Ocean Town of Lauderdale-By-The-Sea 4/18/20141
2.2 Community Description
Broward County is in southeastern Florida. It is bordered on the north by Palm Beach County and the City of Boca Raton, on the west by Hendry and Collier Counties, on the south by Miami-Dade County, and on the east by the Atlantic Ocean. The Everglades Wildlife Management Area and Water Conservation Areas lie to the west of the county. The county encompasses an area of 1,319 square miles which includes 114 square miles of water.
Broward County has a mild, subtropical climate, with temperatures in the City of Fort Lauderdale ranging from an average minimum temperature of 58.3 degrees Fahrenheit (°F) in January to an average maximum temperature of 90.4 °F in August (Reference 7). The waters of the Atlantic Ocean exert a moderating effect on maximum temperatures in summer and minimum temperatures in winter along the immediate coastline. The wet season extends from June through October. Average annual rainfall is approximately 67 inches.
Broward County can be divided into three general areas based on physiography and soils (Reference 8). The western area of the county is nearly level plain that appears to be flat, with organic soils overlying limestone. In its natural state, the predominant vegetation type in this area is sawgrass prairie. The central area consists of nearly level areas interspersed with small ponds, with wet and sandy soils overlying limestone. Under natural conditions, water stands in both of these areas for months, but where these soils have been drained water typically only stands for short periods. The eastern area is made up of low, sandy ridges. Overall, Broward County has an average elevation of six feet.
9
Broward County is served by Interstate Routes 75, 595, and 95, Florida’s Turnpike and the Homestead Extension to Florida’s Turnpike, State Road 869 (Sawgrass Expressway), and the Tri-rail and Amtrak Railways. The 2010 population of Broward County was reported to be 1,748,066 (Reference 9). In the last three decades of the 1900s its population grew by 162% with retail trade as the largest economic sector. The county seat of Broward County is the City of Fort Lauderdale, with an estimated population of 185,804 in 2006.
The major drainage systems in Broward County flow from west to east and discharge to the Atlantic Ocean. These include many canals, including those originating in the Everglades and crossing the county, and short streams nearer to the Atlantic Ocean. The canals are under the control of the South Florida Water Management District (SFWMD). In addition, there are numerous ponding areas in Broward County.
2.3 Principal Flood Problems
Floods resulting from prolonged, heavy rainfall can occur in streams that drain the coastal highland areas and discharge into the Atlantic Ocean. Flooding from heavy rainfall occurs in lowland areas and streams including the study streams and their tributaries.
Coastal areas of the county adjacent to the Atlantic Ocean are subject to storm surge flooding because of hurricanes and/or tropical storms. Large tidal surges, combined with wave action and the heavy rainfall that accompanies these storms, have caused flooding. Areas along the Atlantic Ocean experience flooding from wide tides caused by hurricane winds piling water against shorelines and various causeways and bridges near the coast.
There is considerable historical evidence of storms affecting the southeastern coast of the United States before the 20th century (Reference 10). Some of the most significant 20th-century storms that have affected the study area were recorded in 1924, 1926, 1928, 1929, 1934, and 1947. Severe flooding between 1924 and 1947 resulted in significant runoff from the Everglades area, which is located west of the City of Tamarac (Reference 11). The severe flooding that occurred because of the exceedingly wet summers and hurricanes of September 17 and October 12, 1947, was the impetus for creating the Central and Southern Florida Flood Control District (C&SFFCD). That organization was replaced by the South Florida Water Management District in 1972 with passage of the Florida Water Resources Act (Chapter 373).
On December 17, 2009, extensive and severe flooding occurred over southeastern Broward and northeastern Miami-Dade counties due to heavy rains. North Miami Beach recorded 14 inches of rain in 6 hours. Flooding in Broward County was most severe in Dania Beach, Hollywood, Hallandale Beach, Pembroke Park, and Aventura. Damages included 101 homes with major flood damage and 88 homes with minor damage, six businesses damaged, and two roofs collapsed. Water reached as high as 2 feet deep in some homes and a mobile home park had to be evacuated in Pembroke Park.
Flood damage has been associated with several hurricanes that passed over Broward County since the October 3, 1997, revised countywide FIS report
10
Hurricane Irene (October 14-15, 1999) – Heavy rains and sustained winds of tropical storm force caused widespread flooding and power outages. Rainfall varied from 6 to 17 inches in southeast Florida.
Tropical Storm Leslie (Oct 3-4, 2000) – Approximately 10 to 20 inches of rain fell in Miami-Dade and southeastern Broward Counties causing flooding of poorly drained urban areas. Some floodwater lingered up to a week in Pembroke Park. An estimated 214, 000 persons were isolated by flood waters.
Hurricane Wilma (Oct 24, 2005) – Most of Broward County fell within the very large 55 to 65 mile-wide eye. This hurricane caused widespread damage to structures and deaths from sustained hurricane force winds (Reference 12).
2.4 Flood Protection Measures
The potential for long duration flooding has lessened since the inception of the SFWMD and the construction of levees, control works, and pumping stations. Due to intense rainfall during flooding conditions, personnel at pumping stations in the study area report to their stations and follow procedures set by the SFWMD (Reference 13).
Existing levees in the study area provide the community with some degree of protection against flooding. However, it has been ascertained that all of these levees may not protect the community from rare events such as the 1-percent-annual-chance flood. The criteria used to evaluate protection against the 1-percent-annual-chance flood are 1) adequate design, including freeboard, 2) structural stability, and 3) proper operation and maintenance. Levees that do not protect against the 1-percent-annual-chance flood are not considered in the hydraulic analysis of the 1-percent-annual-chance floodplain.
For purposes of the NFIP, FEMA only recognizes levee systems that meet, and continue to meet, minimum design, operation, and maintenance standards that are consistent with comprehensive floodplain management criteria. The Code of Federal Regulations, Title 44, Section 65.10 (44 CFR 65.10) describes the information needed for FEMA to determine if a levee system reduces the risk from the 1% annual chance flood. This information must be supplied to FEMA by the community or other party when a flood risk study or restudy is conducted, when FIRMs are revised, or upon FEMA request. FEMA reviews the information for the purpose of establishing the appropriate FIRM flood zone.
Levee systems that are determined to reduce the risk from the 1-percent-annual-chance flood are accredited by FEMA. FEMA can also grant provisional accreditation to a levee system that was previously accredited on an effective FIRM and for which FEMA is awaiting data and/or documentation to demonstrate compliance with Section 65.10. These levee systems are referred to as Provisionally Accredited Levees, or PALs. Provisional accreditation provides communities and levee owners with a specified timeframe to obtain the necessary data to confirm the levee’s certification status. Accredited levee systems and PALs are shown on the FIRM. If the required information
11
for a PAL is not submitted within the required timeframe, or if information indicates that a levee system no longer meets Section 65.10, FEMA will de-accredit the levee system and issue an effective FIRM showing the levee-impacted area as a SFHA.
FEMA coordinates its programs with United States Army Corps of Engineers (USACE), who may inspect, maintain, and repair levee systems. The USACE has authority under Public Law 84-99 to supplement local efforts to repair flood control projects that are damaged by floods. Like FEMA, the USACE provides a program to allow public sponsors or operators to address levee system maintenance deficiencies. Failure to do so within the required timeframe results in the levee system being placed in an inactive status in the USACE Rehabilitation and Inspection Program. Levee systems in an inactive status are ineligible for rehabilitation assistance under Public Law 84-99.
FEMA coordinated with the USACE, the local communities, and other organizations to compile a list of levees that exist within Broward County.
FEMA specifies that all levees must have a minimum of 3 feet of freeboard against 1-percent-annual-chance flooding to be considered a safe flood protection measure.
3.0 ENGINEERING METHODS
For the flooding sources studied by detailed methods in the community, standard hydrologic and hydraulic study methods were used to determine the flood-hazard data required for this study. Flood events of a magnitude that is expected to be equaled or exceeded once on the average during any 10-, 50-, 100-, or 500-year period (recurrence interval) have been selected as having special significance for floodplain management and for flood insurance rates. These events, commonly termed the 10-, 50-, 100-, and 500-year floods, have a 10-, 2-, 1-, and 0.2-percent chance, respectively, of being equaled or exceeded during any year. Although the recurrence interval represents the long-term, average period between floods of a specific magnitude, rare floods could occur at short intervals or even within the same year. The risk of experiencing a rare flood increases when periods greater than 1 year are considered. For example, the risk of having a flood that equals or exceeds the 1-percent-annual-chance flood in any 50-year period is approximately 40 percent (4 in 10); for any 90-year period, the risk increases to approximately 60 percent (6 in 10). The analyses reported herein reflect flooding potentials based on conditions existing in the community at the time of completion of this study. Maps and flood elevations will be amended periodically to reflect future changes.
3.1 Hydrologic Analysis
Hydrologic analyses were carried out to establish peak discharge-frequency relationships for each flooding source studied by detailed methods affecting Broward County, including both riverine and coastal sources.
Information on the methods used to determine peak discharge-frequency relationships for the streams studied by detailed methods is shown below.
12
3.1.1 Methods for Flooding Sources Incorporated from Previous Studies
This section describes the methods used for riverine hydrologic analyses for the August 18, 1992, countywide FIS. There were no new riverine studies performed for the October 2, 1997, FIS report.
A hydrologic set of data for each of the canal basins was developed to evaluate the basin response to various frequency rainfall events and was verified for the April 1979 flood. Runoff hydrographs were generated using the Soil Conservation Service (SCS) infiltration losses (Reference 14).
An inspection of the area revealed that during intense floods, flood elevations in some of the subareas can exceed the subarea divides.
The initial subbasin delineation was based on the location of lateral drainage connections to the main canals and manmade features such as streets, drainage canals, and levees. In cases where several structures drained an area with no clear divides, drainage boundaries were assumed and modified as required for model calibration and verification. Lateral connections to the main canals were identified during field visits, from drainage permits supplied by SFWMD, and through discussions with personnel from SFWMD and local water-control districts. Drainage boundaries were determined using topographic maps, aerial photographs, and engineering judgment (References 15 and 16).
Weighted curve numbers (CNs) were computed for each subarea using data from the soil survey of Broward County, the real estate aerial photo atlas of Broward County, and topographic maps (References 14, 17, and 15).
Unit hydrographs for each of the subareas were computed using procedures developed by the SFWMD for the Western C-51 Basin (Reference 18). This methodology combines aspects of three procedures: the peak rate of flow, the unit hydrograph peak flow, and the U.S. Army Corps of Engineers HEC-1 unit hydrograph computer program (References 19 and 20). A computer program UHY was developed by Post, Buckley, Schuh & Jernigan and used in accordance with the hydrologic analysis for the FIS (Reference 21).
Stage-outflow relationships for each structure were computed for an expected range of tailwater elevations in the canals at the subarea confluence. Corresponding subarea discharges were then computed by assuming a head differential between subarea ("reservoir") elevations and canal stages.
For subareas where pump stations regulate the outflow, it was assumed that tailwater conditions would not have a significant effect on the performance of the pump. Therefore, pump outflow depends only upon headwater elevations.
3.1.2 Methods for Flooding Sources with New or Revised Analyses in Current Study
For modeling purposes, Broward County was divided in previous studies into
13
3 geographical areas: The North Aquifer Drainage Assessment (NADA), theCentral Aquifer Drainage District Assessment (CADA) and the South Aquifer Drainage Assessment (SADA).
The NADA, CADA and the SADA have been previously studied using a linked MIKE SHE/MIKE 11 model which incorporates the effects of groundwater on these stream and canal systems. MIKE 11, a hydrodynamic model, is a FEMA approved flood routing model and can be dynamically linked to MIKE SHE, a hydrologic model, to handle strong interaction between surface water and groundwater in South Florida.
Broward County combined and improved the three MIKE SHE/MIKE 11 models (northern, central, and southern) to provide a seamless integrated surface water and groundwater model (Consolidated Broward County model – CBCM) for all of the urban area of Broward County. A most recent model, “Baseline” MIKE SHE/MIKE 11 model (BLM) was used to evaluate alternative surface water and Biscayne Aquifer water supply projects. The CBCM developed by Broward County (2006) was used to develop the BLM (Reference 22).
The existing water supply model (BLM) developed by Broward County and the South Florida Water Management District (SFWMD) was modified to create a flood event model for Broward County. The model improvements included additional survey data for the main canals. The model was calibrated using Hurricane Irene (October 1999), utilizing the main control structures within the primary canals to compare observed flow and stage versus simulated flow and stage. After the model was calibrated, the 10-, 2-, 1-, and 0.2%-annual-chance storm events were simulated.
The rainfall spatial distribution of the existing model was changed from station based to fully distributed. The fully distributed precipitation rate file was modified based on the NEXRAD rainfall files for Hurricane Irene (October 1999). The South Florida Water Management District (SFWMD) 72-hour distribution was used for the production run.
The existing reference evapotranspiration file with time period of 2006 to 2026 was modified with a new dfs file of time period October 1 to October 31, 1999 to simulate Hurricane Irene (October 1999). The evapotranspiration was modeled based on three stations (LOXWS_RW485, used October 1999 data, S140W_OH516, used October 2001 data, and 3AS3WX_OH515, used October 2001 data). A new 10-ft LiDAR dataset (Reference 23) was obtained; based on this survey; updated model topography (500-foot cells) was developed. Levees along the water conservation areas were incorporated manually into the topography based on the “East Coast Protective Levee Topographic Survey” performed by GCY incorporated surveyors and mappers for the South Florida Water Management District in 2010.
The existing start date for the vegetation module was modified from 1/1/2006 to 1/1/1999 for all grid codes. The irrigation was turned off, and the land use
14
vegetation file (dfs2) was modified from the CBCM to the BLM. The overland flow module was not used in the original water supply models (CBCM and BLM). These models relied on the drainage and groundwater connections to convey water from MIKE SHE to MIKE 11. This approach was acceptable for the purpose of these models, but for the flood event models, it is absolutely necessary to simulate the overland flow. Therefore, the overland module was utilized during the conversion process and the overland groundwater leakage coefficient file was modified during the calibration. A Manning’s M value of 6 was used for overland flow.
Cross sections for the secondary canals and tributaries were modified based on the 10-foot Digital Elevation Models produced by the U.S. Geological Survey (Reference 24). New cross sections from a new survey were used for the primary canals cross sections. The canals that were surveyed are: South New River (C-11), Middle River Canal (C-13), Cypress Creek Canal (C-14), C-42, and North New River Canal.
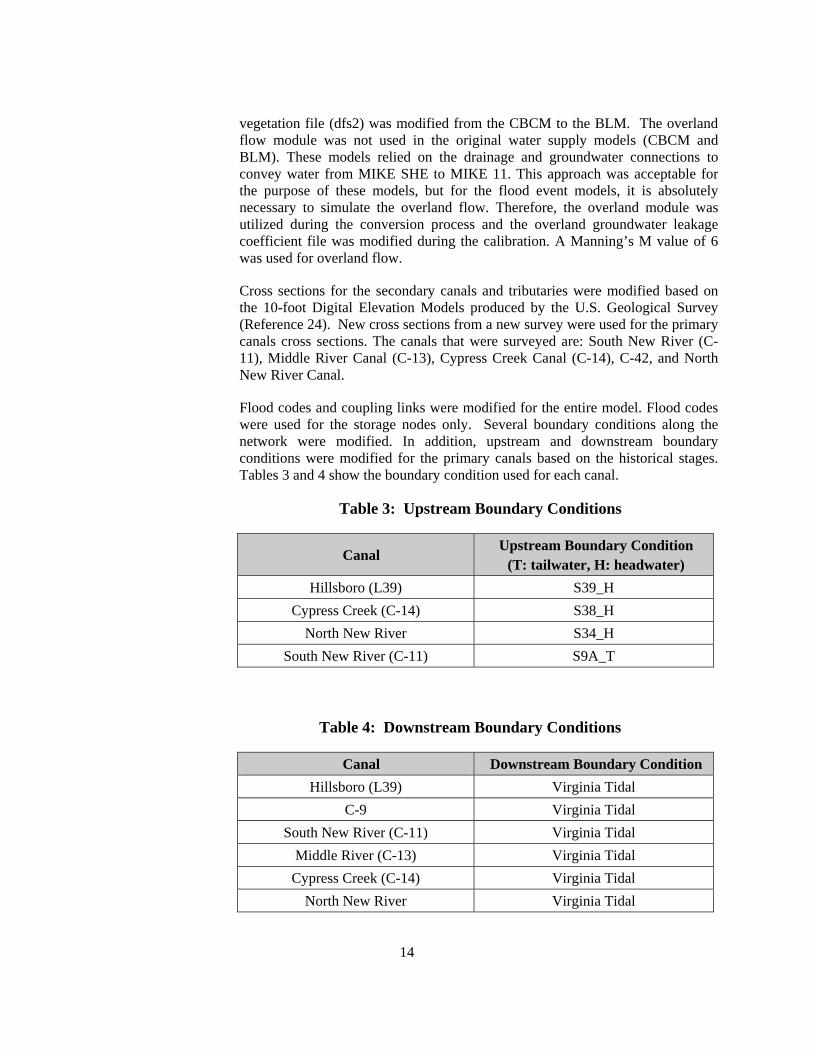
Flood codes and coupling links were modified for the entire model. Flood codes were used for the storage nodes only. Several boundary conditions along the network were modified. In addition, upstream and downstream boundary conditions were modified for the primary canals based on the historical stages. Tables 3 and 4 show the boundary condition used for each canal.
Table 3: Upstream Boundary Conditions
Canal Upstream Boundary Condition
(T: tailwater, H: headwater) Hillsboro (L39) S39_H
Cypress Creek (C-14) S38_H North New River S34_H
South New River (C-11) S9A_T
Table 4: Downstream Boundary Conditions
Canal Downstream Boundary Condition Hillsboro (L39) Virginia Tidal
C-9 Virginia Tidal South New River (C-11) Virginia Tidal
Middle River (C-13) Virginia Tidal Cypress Creek (C-14) Virginia Tidal
North New River Virginia Tidal
15
The initial conditions were modified for all the points based on the October 1999 event (Hurricane Irene). Also, the initial conditions upstream of L39 and L40 were modified based on the October 1999 event using S39_H (headwater) historical values, and for the C11 canal (from chainage 24394 to 36945), S9_T (tailwater) historical values were used.
Since the primary interest of these models were to predict flood levels during major storm events, it was necessary to choose a major storm that occurred in the recent past to adequately calibrate the model. Hurricane Irene (October 1999) was used to calibrate the model. NEXRAD rainfall data, with 2 Km by 2 Km pixel and 15-minute radar estimates, were used to obtain rainfall depths to use in the Hurricane Irene (1999) simulation. The simulation period for the calibration run is from October 10, 1999 to October 26, 1999. Simulated values of stage and flow were compared with historical data for the structures in the main channels (C-11, North New River Canal, C-12, C-13, and C-14).
Some structure operations were modified with effective gate opening approach based historical records of stage and flow. This approach has been used in the past by the SFWMD and consists in calculating the gate opening based on time series of observed headwater, tailwater and flow, using the formulation used by the MIKE 11 code for each particular structure. This approach differs from the approach used in the original calibration of the water supply model where the structures were operated to match the headwater stages. This approach was used only for the calibration run, the production runs were modeled using the operations as described by the SFWMD structure.
Horizontal and vertical hydraulic conductivity (Kh, Kv) were modified in all geological layers to increase the groundwater – surface water interchange (increase the overland flow). Groundwater leakage coefficient (OLcoeff) was modified to increase the groundwater – surface water interchange (increase the overland flow). Manning’s n was adjusted in some canals as part of the calibration process.
The observed flows use a set of equations to compute flow as a function of the head and tailwater elevations at the structure. The equation depends on the flow conditions (controlled-submerge, uncontrolled-submerge, etc). The equation used by DBHYDRO to compute flow for the uncontrolled conditions (gates fully open), yields questionable results as identified by the SFWMD. Uncontrolled conditions were present during the peak of the calibration storm event. Therefore, a comparison of stages is a better indicator of the accuracy of the model due to the above mentioned uncertainty in the observed flow data.
After the model was calibrated, four productions run were made for the 72-hour 10-, 2-, 1- and 0.2%-annual-chance storm events. The production runs were simulated for 18 days, for modeling purposes only the date selected was from 1/1/2011 to 1/18/2011. The rainfall for the 10-, 2- and 1-percent runs was obtained using the South Florida Water Management District (SFWMD) distribution and maximum rainfall data. (Reference 25). The 0.2-percent rainfall
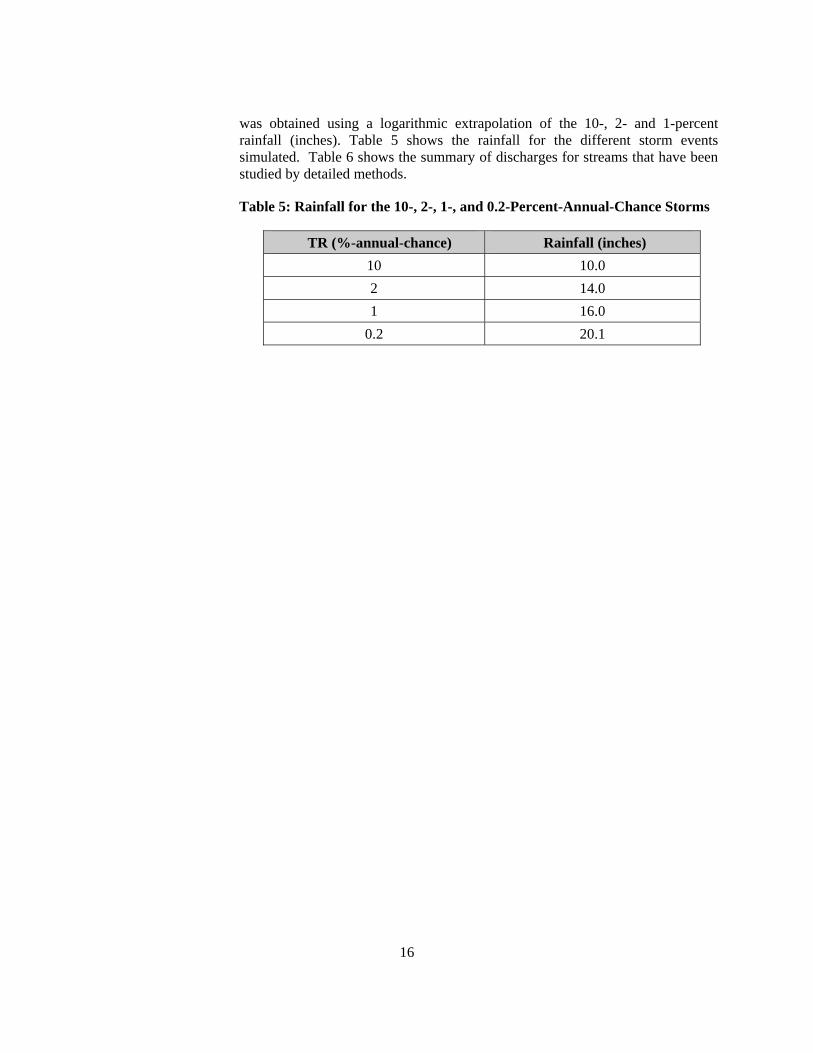
16
was obtained using a logarithmic extrapolation of the 10-, 2- and 1-percent rainfall (inches). Table 5 shows the rainfall for the different storm events simulated. Table 6 shows the summary of discharges for streams that have been studied by detailed methods.
Table 5: Rainfall for the 10-, 2-, 1-, and 0.2-Percent-Annual-Chance Storms
TR (%-annual-chance) Rainfall (inches) 10 10.0 2 14.0 1 16.0
0.2 20.1
17
Table 6: Summary of Discharges
Flooding Source and Location
Drainage Area Peak Discharges (Cubic Feet per Second) (Square miles) 10-percent- 2-percent- 1-percent- 0.2-percent- annual-chance annual-chance annual-chance annual-chance
CYPRESS CREEK CANAL (CANAL C-14)
Just upstream of Dixie Highway * 3,579 3,896 4,008 4,114
Just upstream of Interstate Route 95 * 3,579 3,896 4,008 4,114
Just upstream of Pompano Parkway * 3,344 3,558 3,602 3,643
Just upstream of Structure S-37B * 3,330 3,520 3,550 3,578
Just upstream of Florida Turnpike * 3,258 3,469 3,485 3,523
Just upstream of Rock Island Road * 2,120 2,120 2,120 2,133
Just upstream of University Drive * 1,200 1,200 1,200 1,200
Just upstream of State Road 869 * 239 239 239 239
MIDDLE RIVER CANAL (CANAL C-13)
Just upstream of Pine Island Road * 350 353 357 383
Just upstream of Oakland Park Boulevard * 578 597 562 535
Just upstream of the Florida Turnpike * 914 1,119 1,181 1,433
Just upstream of the State Road 7 * 1,001 1,149 1,160 1,178
NORTH FORK CANAL (CANAL C-12)
Just upstream of U.S. Route 441 * 705 756 749 749
Just upstream of NW 47th Avenue * 661 709 702 707
Just upstream of Florida Turnpike * 488 523 523 523
Approximately 0.96 mile upstream of Florida Turnpike * 301 331 331 331
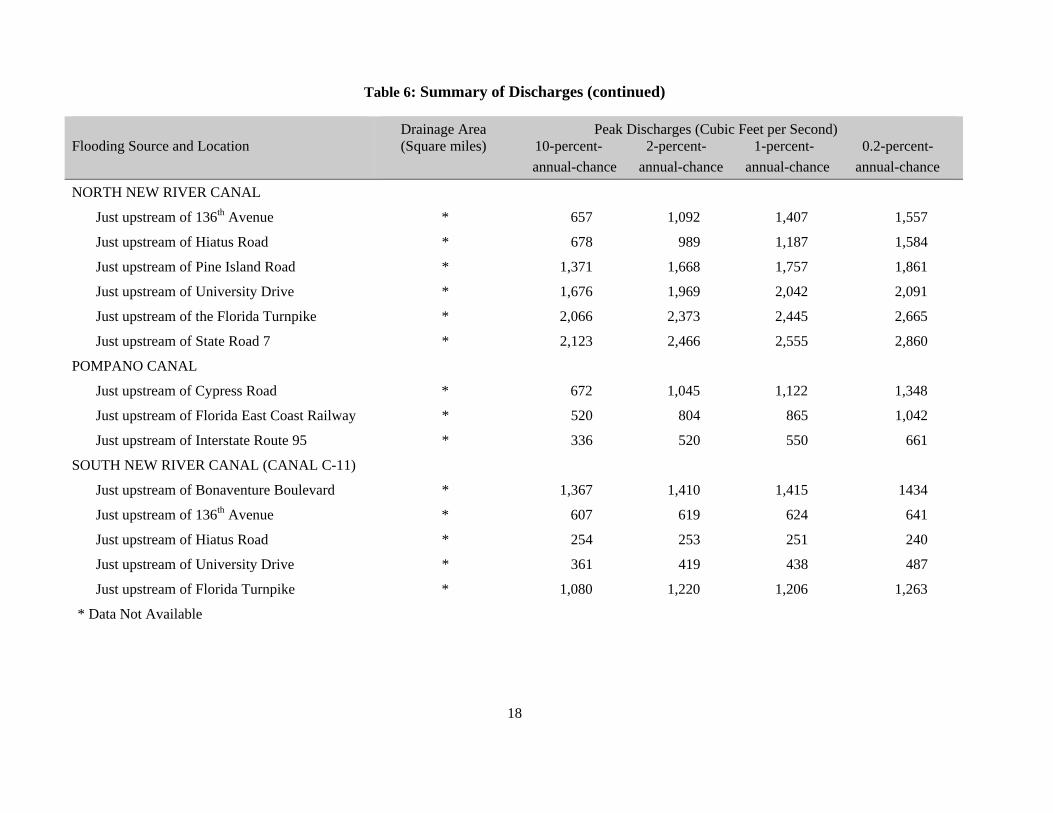
Table 6: Summary of Discharges (continued)
18
Flooding Source and Location
Drainage Area Peak Discharges (Cubic Feet per Second) (Square miles) 10-percent- 2-percent- 1-percent- 0.2-percent- annual-chance annual-chance annual-chance annual-chance
NORTH NEW RIVER CANAL
Just upstream of 136th Avenue * 657 1,092 1,407 1,557
Just upstream of Hiatus Road * 678 989 1,187 1,584
Just upstream of Pine Island Road * 1,371 1,668 1,757 1,861
Just upstream of University Drive * 1,676 1,969 2,042 2,091
Just upstream of the Florida Turnpike * 2,066 2,373 2,445 2,665
Just upstream of State Road 7 * 2,123 2,466 2,555 2,860
POMPANO CANAL
Just upstream of Cypress Road * 672 1,045 1,122 1,348
Just upstream of Florida East Coast Railway * 520 804 865 1,042
Just upstream of Interstate Route 95 * 336 520 550 661
SOUTH NEW RIVER CANAL (CANAL C-11)
Just upstream of Bonaventure Boulevard * 1,367 1,410 1,415 1434
Just upstream of 136th Avenue * 607 619 624 641
Just upstream of Hiatus Road * 254 253 251 240
Just upstream of University Drive * 361 419 438 487
Just upstream of Florida Turnpike * 1,080 1,220 1,206 1,263
* Data Not Available
19
3.2 Hydraulic Analyses
Analyses of the hydraulic characteristics of flooding from the sources studied were carried out to provide estimates of the elevations of floods of the selected recurrence intervals. Users should be aware that flood elevations shown on the FIRM represent rounded whole-foot elevations and may not exactly reflect the elevations shown on the Flood Profiles or in the Floodway Data tables in the FIS report. Flood elevations shown on the FIRM are primarily intended for flood insurance rating purposes. For construction and/or floodplain management purposes, users are cautioned to use the flood elevation data presented in this FIS in conjunction with the data shown on the FIRM.
Locations of selected cross sections are shown on the Flood Profiles (Exhibit 1).
The hydraulic analyses for this study were based on unobstructed flow. The flood elevations shown on the Flood Profiles (Exhibit 1) are thus considered valid only if hydraulic structures remain unobstructed, operate properly, and do not fail.
3.2.1 Methods for Flooding Sources with New or Revised Analyses in Current Study
The MIKE SHE/MIKE 11 model and methods described in section 3.1.2 was used to establish water-surface elevations for the detailed cross sections along the canals and for areas of overland flooding and ponding.
3.2.2 Methods for Flooding Sources Incorporated from Previous Studies
This section describes the methods used for riverine hydraulic analyses for the August 18, 1992, countywide FIS. There were no new riverine studies performed for the October 2, 1997, FIS report.
Runoff hydrographs computed for each subarea were combined and routed through each of the canal systems using the National Weather Service's one-dimensional unsteady flow model, DWOPER, which is a subroutine in BRASS (References 26 and 27). Stages and discharges were computed in BRASS at canal cross sections using subareas discharges, driving boundary conditions (such as stage or discharge hydrographs), rating curves, and gate operating schedules.
Dynamic routing was used from the DWOPER and BRASS models. Geometric data for the cross sections were obtained from field surveys. Physical characteristics of bridges were obtained from the Florida Department of Transportation, the Broward County Department of Transportation, and from field surveys.
Flood discharges and stages resulting from 3-day rainfalls with recurrence intervals of 10, 50, 100, and 500 years were simulated using BRASS and calibrated sets of data for each of the canal watersheds. Rainfall amount and distribution areas are in accordance with SFWMD Stormwater Management procedures (References 28 and 29). The 3-day rainfall amounts and distributions are obtained by extrapolating the 24-hour rainfall of the same frequency. The 24-
20
hour rainfall depth for the 10-, 50-, and 100- year recurrence intervals for the central and south Florida areas can be found in the SFWMD Technical Publication 81-3 (Reference 28). The 0.2-percent-annual-chance rainfall depth was extrapolated from the 10-, 2-, and 1-percent-annual-chance rainfall amounts plotted on normal probability paper. The hourly rainfall distribution for the 3-day events is presented in the SFWMD Permit Manual (Reference 29).
3.3 Coastal Storm Surge
Storm surge modeling was carried out to establish the peak elevation-frequency relationships for floods of the selected recurrence intervals for each flooding source studied in detail affecting the county. All coastal analyses in this revision to the countywide FIS report are based on previous analyses. Since the October 3, 1997, revisions used the storm surge analysis from the initial countywide FIS, only those results are presented here.
August 18, 1992, Countywide FIS
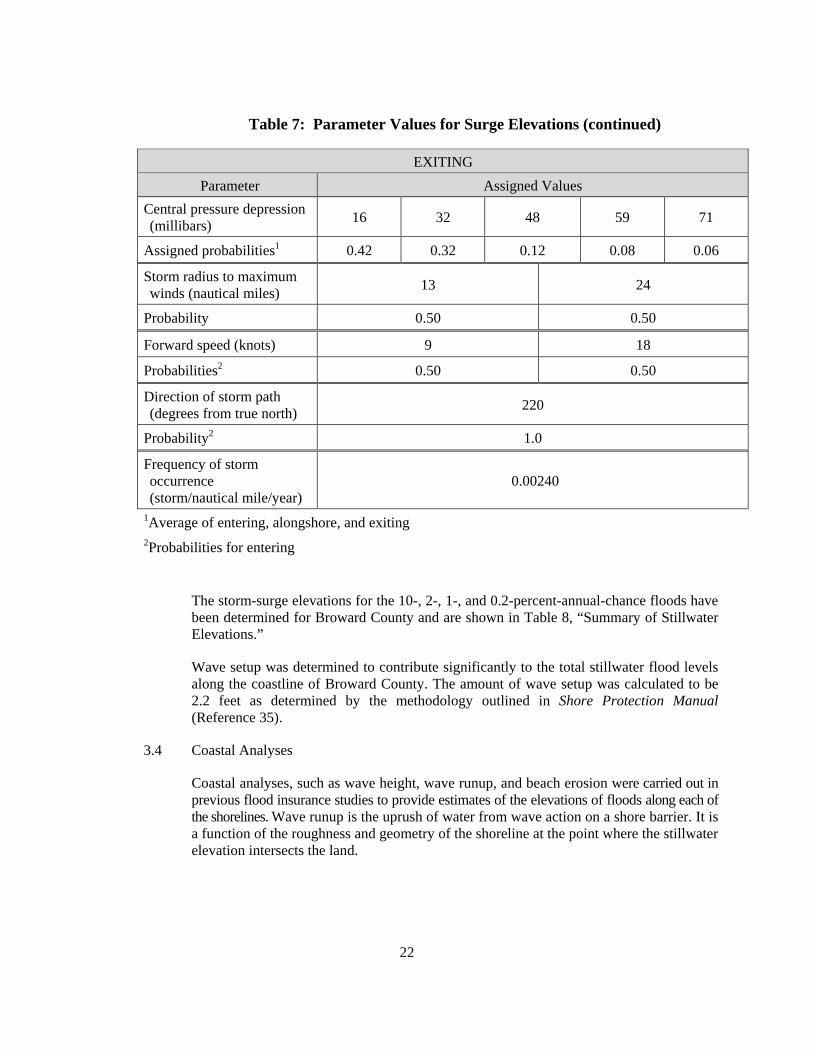
Inundation from the Atlantic Ocean caused by passage of storms (storm surge) was determined by the joint probability method (Reference 30). The storm populations were described by probability distributions of five parameters that influence surge heights. These parameters were central pressure depression (which measures the intensity of the storm), radius to maximum winds, forward speed of the storm, shoreline crossing point, and crossing angle. These characteristics were described statistically based on an analysis of observed storms in the vicinity of Broward County. Primary sources of data for this analysis were Hurricane Climatology for the Atlantic and Gulf Coasts of the United States; Meteorological Criteria for Standard Project Hurricane and Probable Maximum Hurricane Windfields, Gulf and East Coasts of the United States; and Hurricane Climatology for the Atlantic and Gulf Coasts of the United States (References 31, 32, and 33). A summary of the parameters used for the area is presented in Table 7, "Parameter Values for Surge Elevations."
For areas subject to flooding directly from the Atlantic Ocean, the FEMA standard storm surge model was used to simulate the coastal surge generated by any chosen storm (that is, any combination of the five storm parameters defined previously) (Reference 34). Performing such simulations for a large number of storms, each of known total probability, allows the frequency distribution of surge height to be established as a function of coastal location. These distributions incorporate the large-scale surge behavior, but do not include an analysis of the added effects associated with much finer scale wave phenomena, such as wave height or runup. As the final step in the calculations, the astronomic tide for the region is then statistically combined with the computed storm surge to yield recurrence intervals of total water level.
The FEMA storm surge model was used to simulate the hydrodynamic behavior of the surge generated by the various synthetic storms (Reference 34). This model used a grid pattern approximating the geographical features of the study area and the adjoining areas. Surges were computed using grids of 5 by 5 nautical miles, and by 0.5 by 1 nautical mile, depending on the resolution required.
21
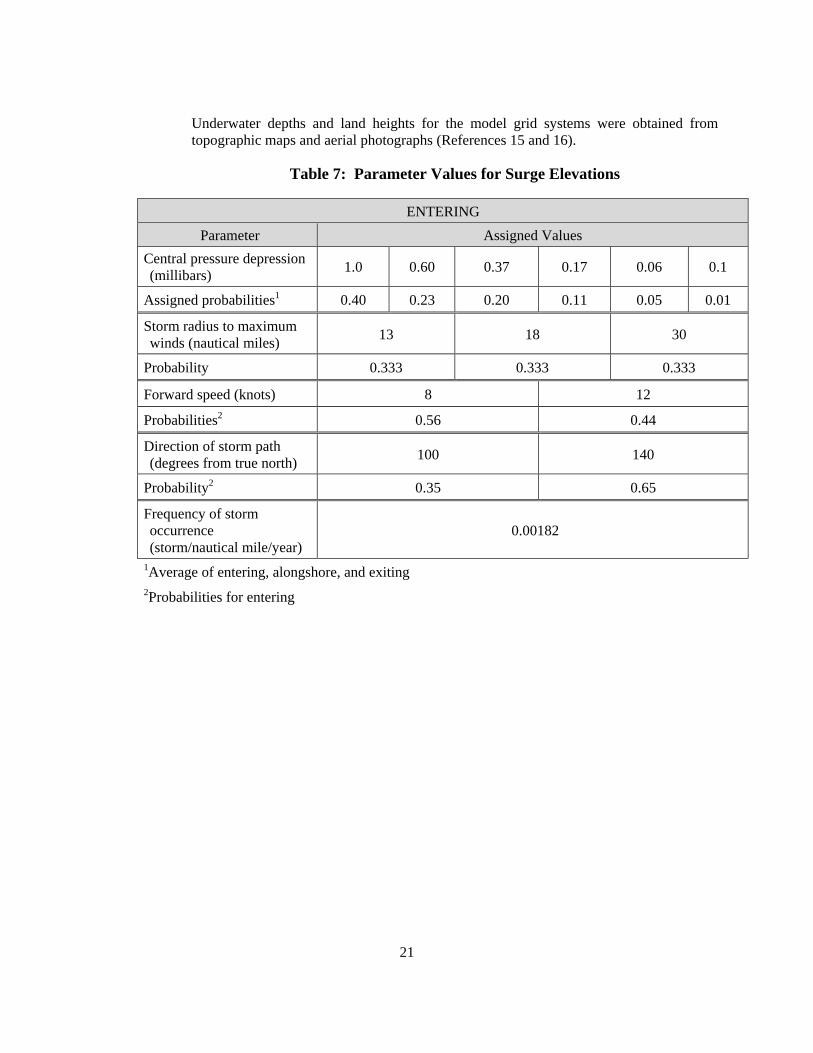
Underwater depths and land heights for the model grid systems were obtained from topographic maps and aerial photographs (References 15 and 16).
Table 7: Parameter Values for Surge Elevations
ENTERING Parameter Assigned Values
Central pressure depression (millibars) 1.0 0.60 0.37 0.17 0.06 0.1
Assigned probabilities1 0.40 0.23 0.20 0.11 0.05 0.01
Storm radius to maximum winds (nautical miles) 13 18 30
Probability 0.333 0.333 0.333
Forward speed (knots) 8 12
Probabilities2 0.56 0.44
Direction of storm path (degrees from true north) 100 140
Probability2 0.35 0.65
Frequency of storm occurrence (storm/nautical mile/year)
0.00182
1Average of entering, alongshore, and exiting 2Probabilities for entering
22
Table 7: Parameter Values for Surge Elevations (continued)
EXITING Parameter Assigned Values
Central pressure depression (millibars) 16 32 48 59 71
Assigned probabilities1 0.42 0.32 0.12 0.08 0.06
Storm radius to maximum winds (nautical miles) 13 24
Probability 0.50 0.50
Forward speed (knots) 9 18
Probabilities2 0.50 0.50
Direction of storm path (degrees from true north) 220
Probability2 1.0
Frequency of storm occurrence (storm/nautical mile/year)
0.00240
1Average of entering, alongshore, and exiting 2Probabilities for entering
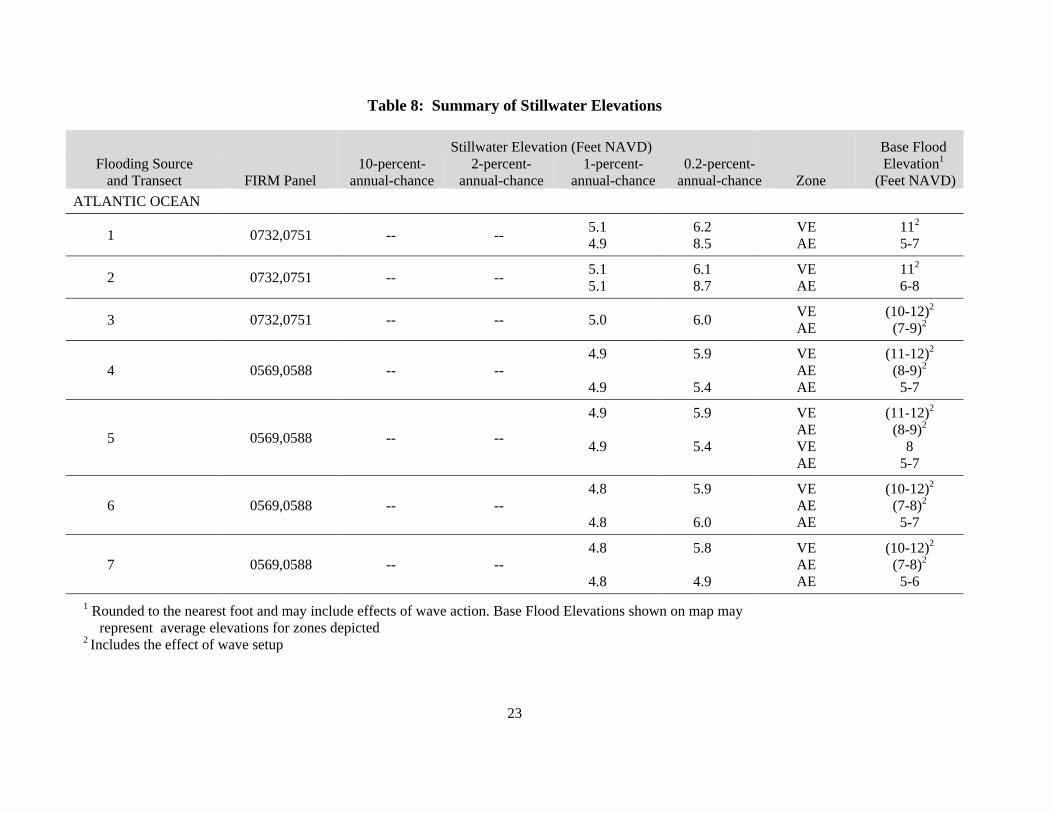
The storm-surge elevations for the 10-, 2-, 1-, and 0.2-percent-annual-chance floods have been determined for Broward County and are shown in Table 8, “Summary of Stillwater Elevations.”
Wave setup was determined to contribute significantly to the total stillwater flood levels along the coastline of Broward County. The amount of wave setup was calculated to be 2.2 feet as determined by the methodology outlined in Shore Protection Manual (Reference 35).
3.4 Coastal Analyses
Coastal analyses, such as wave height, wave runup, and beach erosion were carried out in previous flood insurance studies to provide estimates of the elevations of floods along each of the shorelines. Wave runup is the uprush of water from wave action on a shore barrier. It is a function of the roughness and geometry of the shoreline at the point where the stillwater elevation intersects the land.
23
Table 8: Summary of Stillwater Elevations
Stillwater Elevation (Feet NAVD) Base Flood Flooding Source
and Transect
FIRM Panel 10-percent-
annual-chance 2-percent-
annual-chance 1-percent-
annual-chance 0.2-percent-
annual-chance
Zone Elevation1
(Feet NAVD) ATLANTIC OCEAN
1 0732,0751 -- -- 5.1 4.9
6.2 8.5
VE AE
112
5-7
2 0732,0751 -- -- 5.1 5.1
6.1 8.7
VE AE
112
6-8
3 0732,0751 -- -- 5.0 6.0 VE AE
(10-12)2
(7-9)2
4 0569,0588 -- -- 4.9
4.9
5.9 5.4
VE AE AE
(11-12)2
(8-9)2
5-7
5 0569,0588 -- --
4.9
4.9
5.9 5.4
VE AE VE AE
(11-12)2
(8-9)2
8 5-7
6 0569,0588 -- -- 4.8
4.8
5.9 6.0
VE AE AE
(10-12)2
(7-8)2
5-7
7 0569,0588 -- -- 4.8
4.8
5.8 4.9
VE AE AE
(10-12)2
(7-8)2
5-6 1 Rounded to the nearest foot and may include effects of wave action. Base Flood Elevations shown on map may
represent average elevations for zones depicted 2 Includes the effect of wave setup
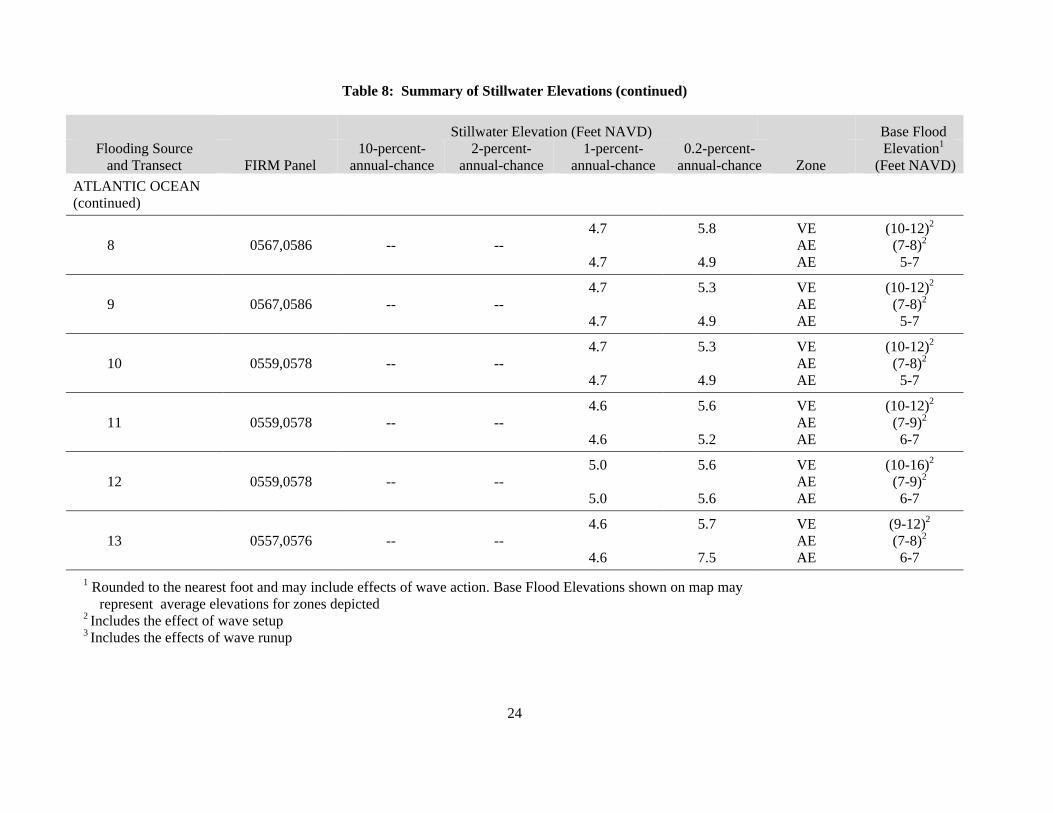
Table 8: Summary of Stillwater Elevations (continued)
24
Stillwater Elevation (Feet NAVD) Base Flood Flooding Source
and Transect
FIRM Panel 10-percent-
annual-chance 2-percent-
annual-chance 1-percent-
annual-chance 0.2-percent-
annual-chance
Zone Elevation1
(Feet NAVD) ATLANTIC OCEAN (continued)
8 0567,0586 -- -- 4.7
4.7
5.8
4.9
VE AE AE
(10-12)2
(7-8)2
5-7
9 0567,0586 -- -- 4.7
4.7
5.3
4.9
VE AE AE
(10-12)2
(7-8)2
5-7
10 0559,0578 -- -- 4.7
4.7
5.3
4.9
VE AE AE
(10-12)2
(7-8)2
5-7
11 0559,0578 -- -- 4.6
4.6
5.6
5.2
VE AE AE
(10-12)2
(7-9)2
6-7
12 0559,0578 -- -- 5.0
5.0
5.6
5.6
VE AE AE
(10-16)2
(7-9)2
6-7
13 0557,0576 -- -- 4.6
4.6
5.7
7.5
VE AE AE
(9-12)2
(7-8)2
6-7 1 Rounded to the nearest foot and may include effects of wave action. Base Flood Elevations shown on map may
represent average elevations for zones depicted 2 Includes the effect of wave setup 3 Includes the effects of wave runup
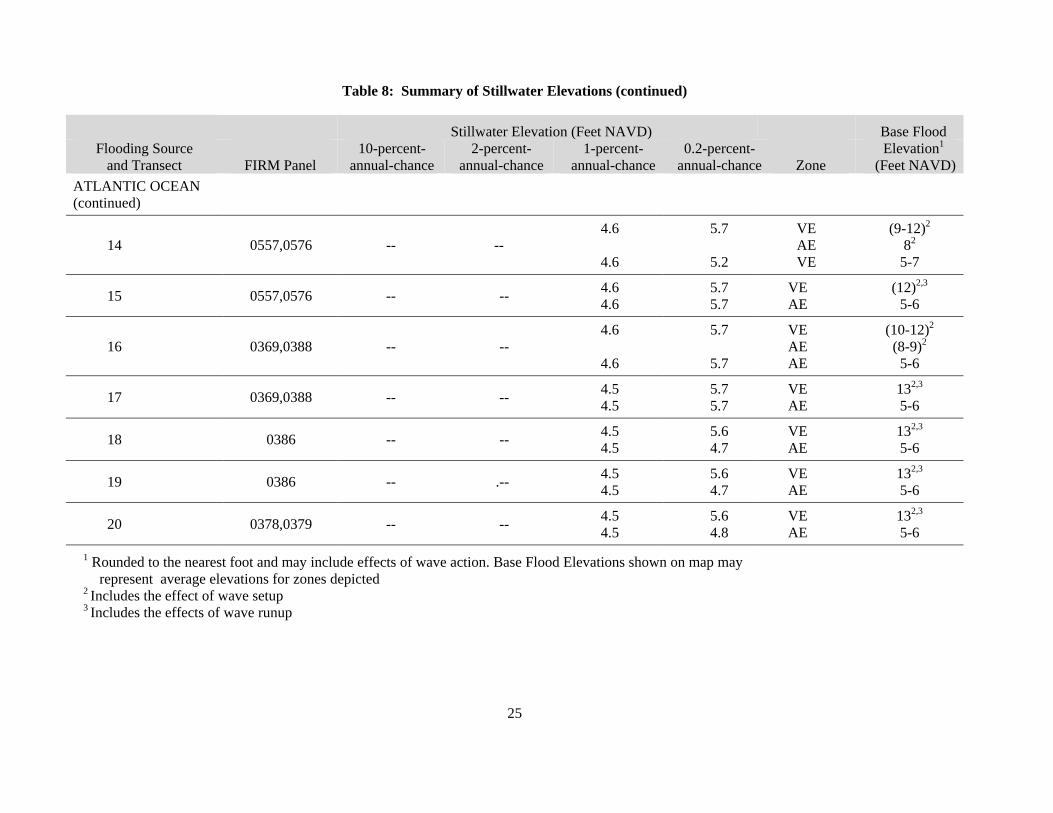
Table 8: Summary of Stillwater Elevations (continued)
25
Stillwater Elevation (Feet NAVD) Base Flood Flooding Source
and Transect
FIRM Panel 10-percent-
annual-chance 2-percent-
annual-chance 1-percent-
annual-chance 0.2-percent-
annual-chance
Zone Elevation1
(Feet NAVD) ATLANTIC OCEAN (continued)
14 0557,0576 -- -- 4.6
4.6
5.7
5.2
VE AE VE
(9-12)2
82
5-7
15 0557,0576 -- -- 4.6 4.6
5.7 5.7
VE AE
(12)2,3
5-6
16 0369,0388 -- -- 4.6
4.6
5.7
5.7
VE AE AE
(10-12)2
(8-9)2
5-6
17 0369,0388 -- -- 4.5 4.5
5.7 5.7
VE AE
132,3
5-6
18 0386 -- -- 4.5 4.5
5.6 4.7
VE AE
132,3
5-6
19 0386 -- .-- 4.5 4.5
5.6 4.7
VE AE
132,3
5-6
20 0378,0379 -- -- 4.5 4.5
5.6 4.8
VE AE
132,3
5-6 1 Rounded to the nearest foot and may include effects of wave action. Base Flood Elevations shown on map may
represent average elevations for zones depicted 2 Includes the effect of wave setup 3 Includes the effects of wave runup
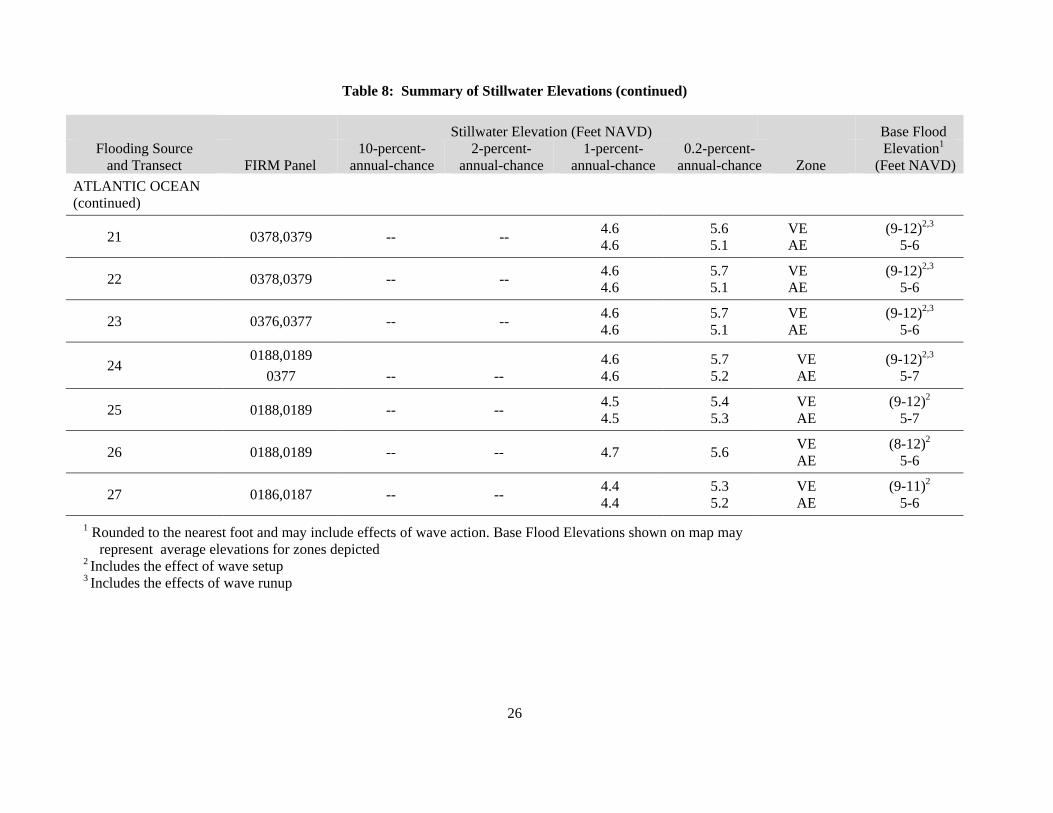
Table 8: Summary of Stillwater Elevations (continued)
26
Stillwater Elevation (Feet NAVD) Base Flood Flooding Source
and Transect
FIRM Panel 10-percent-
annual-chance 2-percent-
annual-chance 1-percent-
annual-chance 0.2-percent-
annual-chance
Zone Elevation1
(Feet NAVD) ATLANTIC OCEAN (continued)
21 0378,0379 -- -- 4.6 4.6
5.6 5.1
VE AE
(9-12)2,3
5-6
22 0378,0379 -- -- 4.6 4.6
5.7 5.1
VE AE
(9-12)2,3
5-6
23 0376,0377 -- -- 4.6 4.6
5.7 5.1
VE AE
(9-12)2,3
5-6
24 0188,0189
0377 -- -- 4.6 4.6
5.7 5.2
VE AE
(9-12)2,3
5-7
25 0188,0189 -- -- 4.5 4.5
5.4 5.3
VE AE
(9-12)2
5-7
26 0188,0189 -- -- 4.7 5.6 VE AE
(8-12)2
5-6
27 0186,0187 -- -- 4.4 4.4
5.3 5.2
VE AE
(9-11)2
5-6 1 Rounded to the nearest foot and may include effects of wave action. Base Flood Elevations shown on map may
represent average elevations for zones depicted 2 Includes the effect of wave setup 3 Includes the effects of wave runup
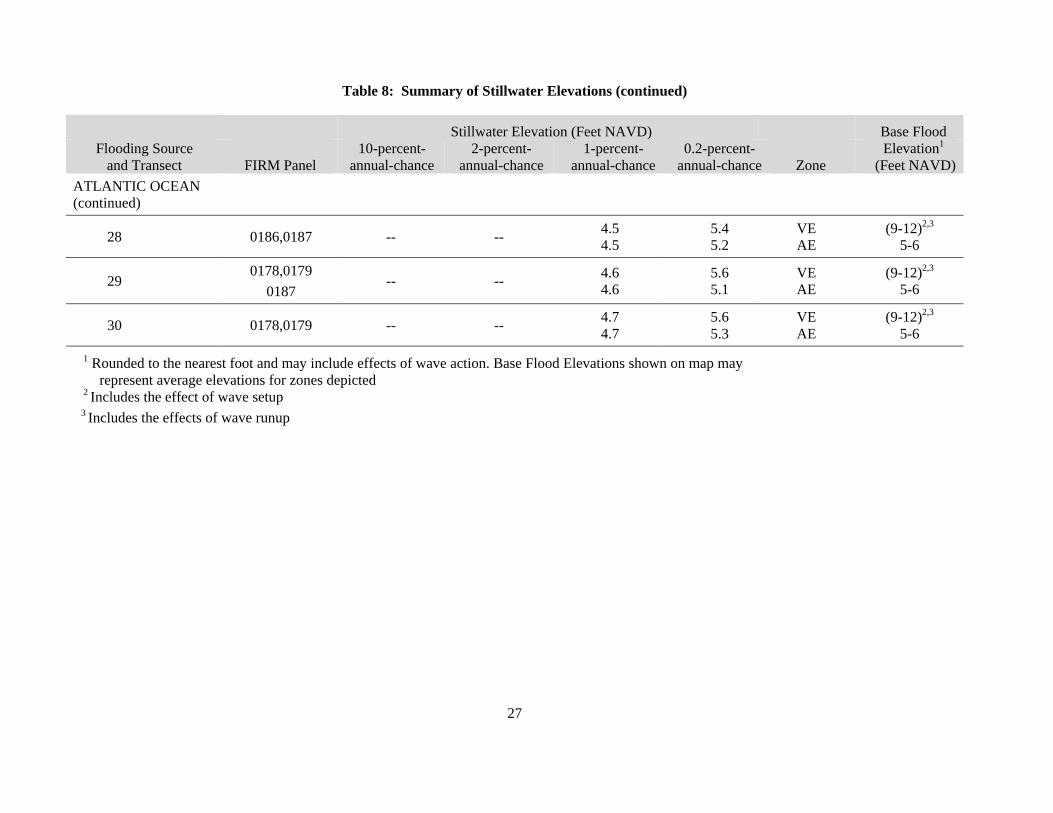
Table 8: Summary of Stillwater Elevations (continued)
27
Stillwater Elevation (Feet NAVD) Base Flood Flooding Source
and Transect
FIRM Panel 10-percent-
annual-chance 2-percent-
annual-chance 1-percent-
annual-chance 0.2-percent-
annual-chance
Zone Elevation1
(Feet NAVD) ATLANTIC OCEAN (continued)
28 0186,0187 -- -- 4.5 4.5
5.4 5.2
VE AE
(9-12)2,3
5-6
29 0178,0179
0187 -- -- 4.6
4.6 5.6 5.1
VE AE
(9-12)2,3
5-6
30 0178,0179 -- -- 4.7 4.7
5.6 5.3
VE AE
(9-12)2,3
5-6 1 Rounded to the nearest foot and may include effects of wave action. Base Flood Elevations shown on map may
represent average elevations for zones depicted 2 Includes the effect of wave setup 3 Includes the effects of wave runup
28
October 2, 1997 Countywide FIS Revision
Wave height analysis and wave runup along the Atlantic Ocean were revised for transects 21-30 using topographic maps, site-specific topography, and beach profiles taken from the Broward County Coastal Construction Control Line Study (References 15, 16, and 36). The FEMA Wave Height Analysis for Flood Insurance Studies (WHAFIS) program, and wave runup models were used in conjunction with the Investigation and Improvement of the Capabilities of the FEMA Wave Runup Model (Technical Documentation for RUNUP 2.0) report and computer program, and Guidelines and Specifications for Wave Elevation Determination and V-Zone Mapping (References 37, 38, and 39).
August 18, 1992, Countywide FIS
The methodology for analyzing the effects of wave heights associated with coastal storm surge flooding is described in a report prepared by the National Academy of Sciences (NAS) (Reference 40). This method is based on the following major concepts. First, depth- limited waves in shallow water reach a maximum breaking height that is equal to 0.78 times the stillwater depth. The wave crest is 70 percent of the total wave height above the stillwater level. The second major concept is that wave height may be diminished by dissipation of energy due to the presence of obstructions, such as sand dunes, dikes and seawalls, buildings, and vegetation. The amount of energy dissipation is a function of the physical characteristics of the obstruction and is determined by NAS procedures (Reference 40). The third major concept is that wave height can be regenerated in open fetch areas due to the transfer of wind energy to the water. This added energy is related to fetch length and depth.
Wave heights were computed along transects (cross section lines) that were located along the coastal area, as illustrated in Figure 1, "Transect Location Map." The transects were located with consideration given to the physical and cultural characteristics of the land so that they would closely represent conditions in their locality. Transects were spaced closely together in areas of complex topography and dense development. In areas having more uniform characteristics, transects were spaced at large intervals. It was also necessary to locate transects in areas where unique flooding existed as well as in areas where computed wave heights varied significantly between adjacent transects (References 41 and 42).
Each transect was taken perpendicular to the shoreline and extended inland to a point where wave action ceased. Along each transect, wave heights and elevations were computed considering the combined effects of changes in ground elevation, vegetation, and physical features. The stillwater elevations for the 1-percent-annual-chance flood were used as the starting elevations for these computations. Wave heights were calculated to the nearest 0.1 foot, and wave elevations were determined at whole-foot increments along the transects. The location of the 3-foot breaking wave for determining the terminus of the V zone (areas with velocity wave action) was computed at each transect. Also, along the open coast, the V zone designation applies to all areas seaward of the heel of the primary dune system. Table 9, “Transect Locations, Stillwater Starting Elevations, and Initial Wave Crest Elevations,” provides a listing of the transect locations and stillwater starting elevations, as well as initial wave crest elevations.
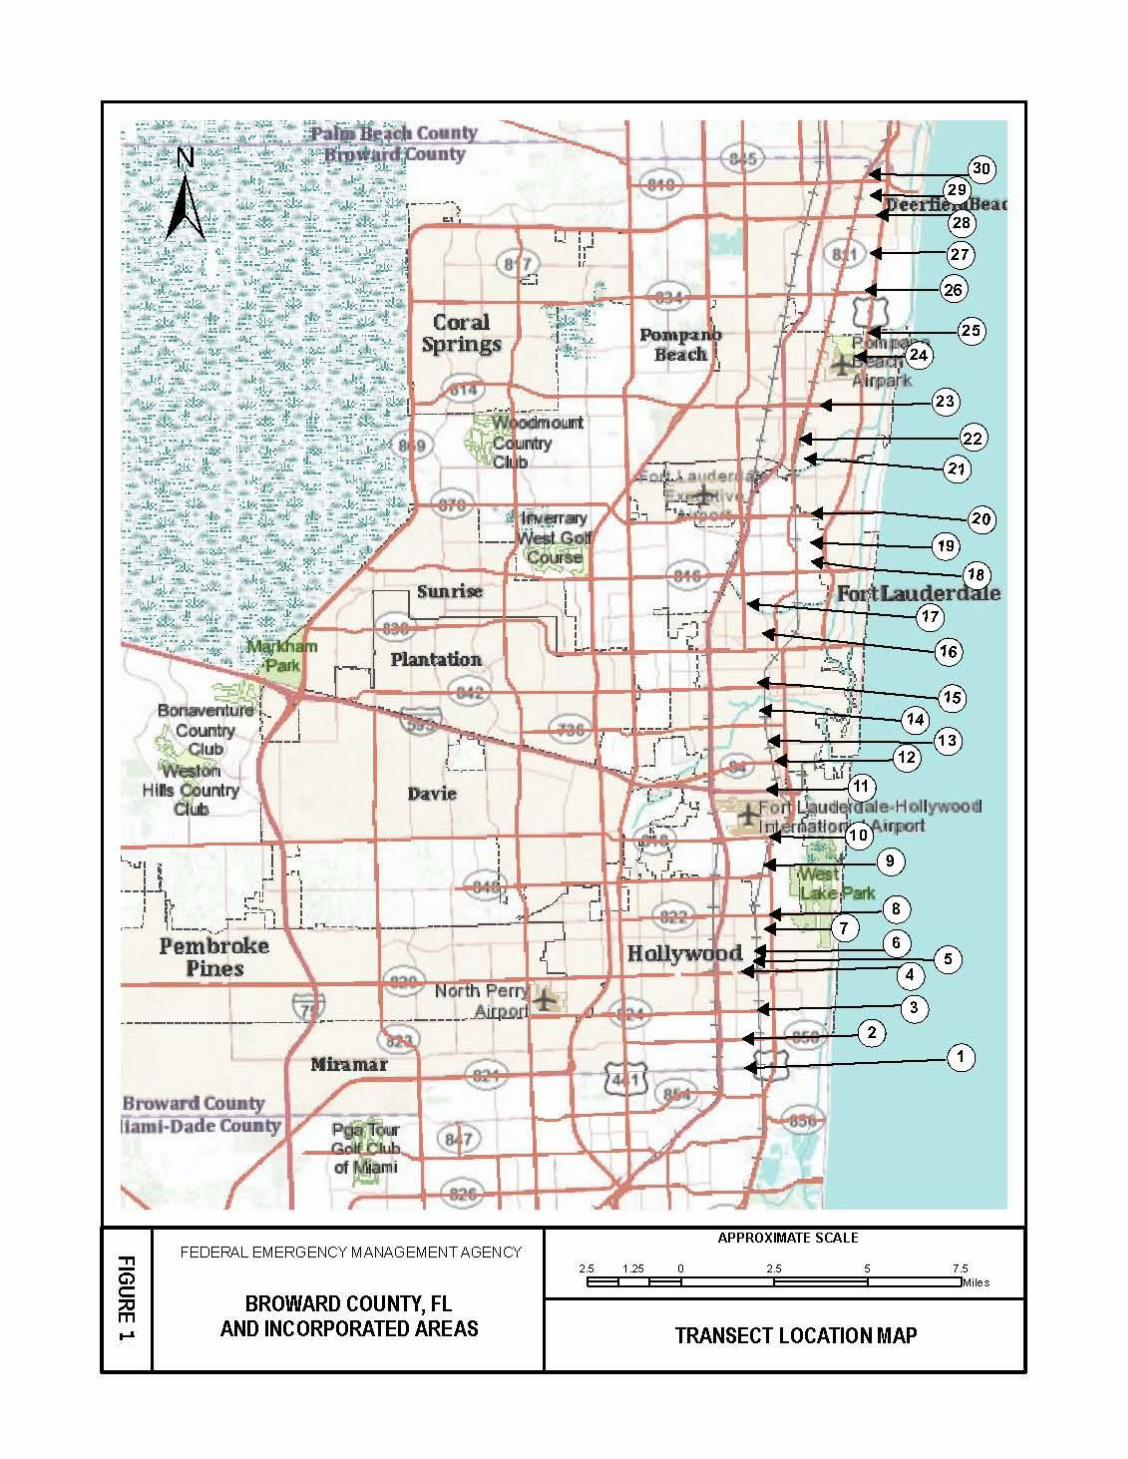
30
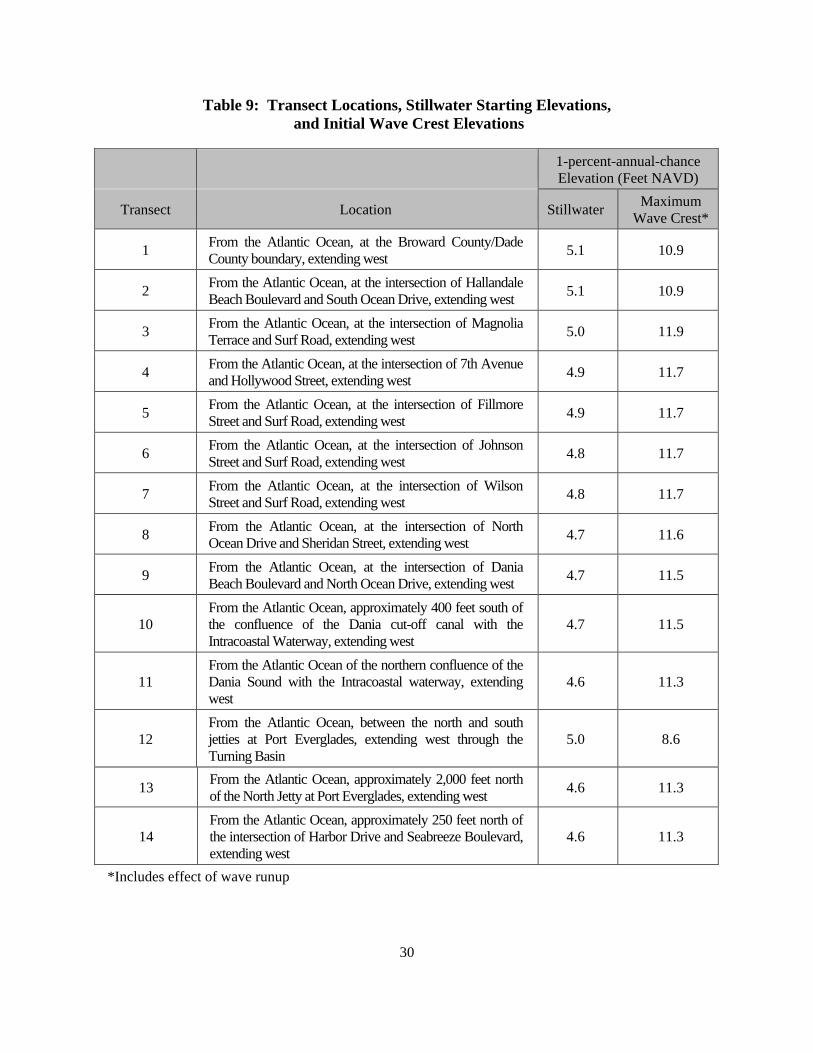
Table 9: Transect Locations, Stillwater Starting Elevations, and Initial Wave Crest Elevations
1-percent-annual-chance Elevation (Feet NAVD)
Transect Location Stillwater Maximum Wave Crest*
1 From the Atlantic Ocean, at the Broward County/Dade County boundary, extending west 5.1 10.9
2 From the Atlantic Ocean, at the intersection of Hallandale Beach Boulevard and South Ocean Drive, extending west 5.1 10.9
3 From the Atlantic Ocean, at the intersection of Magnolia Terrace and Surf Road, extending west 5.0 11.9
4 From the Atlantic Ocean, at the intersection of 7th Avenue and Hollywood Street, extending west 4.9 11.7
5 From the Atlantic Ocean, at the intersection of Fillmore Street and Surf Road, extending west 4.9 11.7
6 From the Atlantic Ocean, at the intersection of Johnson Street and Surf Road, extending west 4.8 11.7
7 From the Atlantic Ocean, at the intersection of Wilson Street and Surf Road, extending west 4.8 11.7
8 From the Atlantic Ocean, at the intersection of North Ocean Drive and Sheridan Street, extending west 4.7 11.6
9 From the Atlantic Ocean, at the intersection of Dania Beach Boulevard and North Ocean Drive, extending west 4.7 11.5
10 From the Atlantic Ocean, approximately 400 feet south of the confluence of the Dania cut-off canal with the Intracoastal Waterway, extending west
4.7 11.5
11 From the Atlantic Ocean of the northern confluence of the Dania Sound with the Intracoastal waterway, extending west
4.6 11.3
12 From the Atlantic Ocean, between the north and south jetties at Port Everglades, extending west through the Turning Basin
5.0 8.6
13 From the Atlantic Ocean, approximately 2,000 feet north of the North Jetty at Port Everglades, extending west 4.6 11.3
14 From the Atlantic Ocean, approximately 250 feet north of the intersection of Harbor Drive and Seabreeze Boulevard, extending west
4.6 11.3
*Includes effect of wave runup
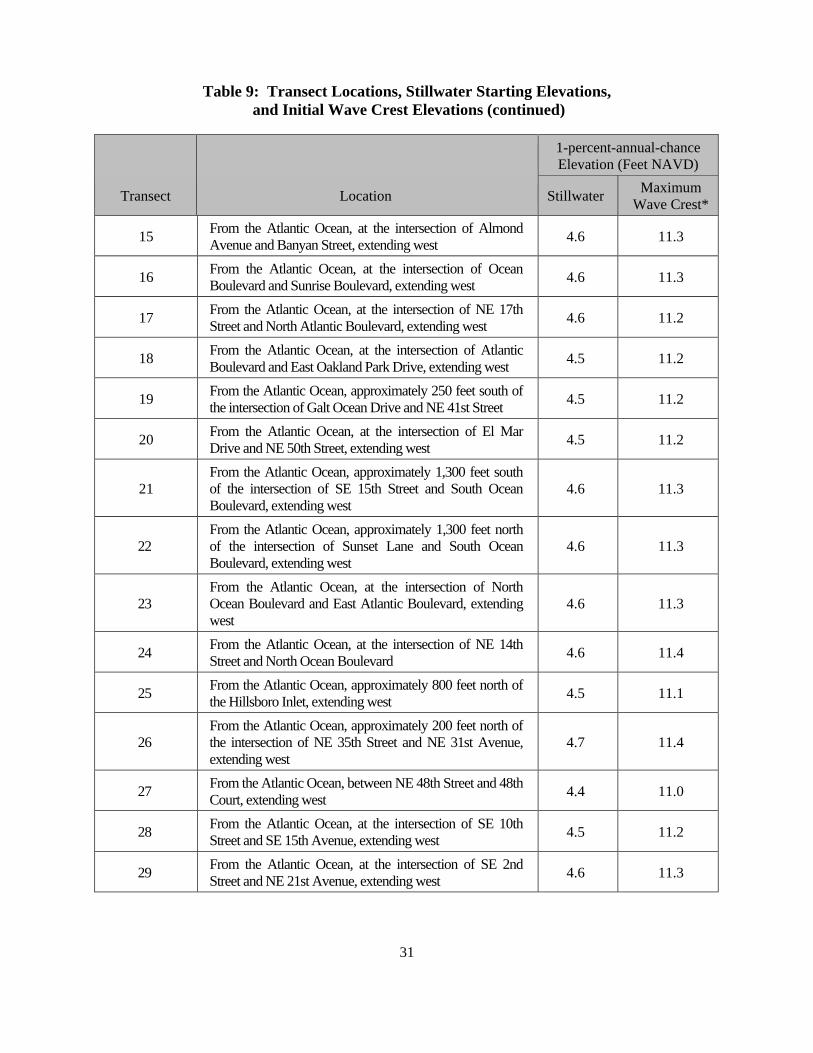
Table 9: Transect Locations, Stillwater Starting Elevations, and Initial Wave Crest Elevations (continued)
31
1-percent-annual-chance Elevation (Feet NAVD)
Transect Location Stillwater Maximum Wave Crest*
15 From the Atlantic Ocean, at the intersection of Almond Avenue and Banyan Street, extending west 4.6 11.3
16 From the Atlantic Ocean, at the intersection of Ocean Boulevard and Sunrise Boulevard, extending west 4.6 11.3
17 From the Atlantic Ocean, at the intersection of NE 17th Street and North Atlantic Boulevard, extending west 4.6 11.2
18 From the Atlantic Ocean, at the intersection of Atlantic Boulevard and East Oakland Park Drive, extending west 4.5 11.2
19 From the Atlantic Ocean, approximately 250 feet south of the intersection of Galt Ocean Drive and NE 41st Street 4.5 11.2
20 From the Atlantic Ocean, at the intersection of El Mar Drive and NE 50th Street, extending west 4.5 11.2
21 From the Atlantic Ocean, approximately 1,300 feet south of the intersection of SE 15th Street and South Ocean Boulevard, extending west
4.6 11.3
22 From the Atlantic Ocean, approximately 1,300 feet north of the intersection of Sunset Lane and South Ocean Boulevard, extending west
4.6 11.3
23 From the Atlantic Ocean, at the intersection of North Ocean Boulevard and East Atlantic Boulevard, extending west
4.6 11.3
24 From the Atlantic Ocean, at the intersection of NE 14th Street and North Ocean Boulevard 4.6 11.4
25 From the Atlantic Ocean, approximately 800 feet north of the Hillsboro Inlet, extending west 4.5 11.1
26 From the Atlantic Ocean, approximately 200 feet north of the intersection of NE 35th Street and NE 31st Avenue, extending west
4.7 11.4
27 From the Atlantic Ocean, between NE 48th Street and 48th Court, extending west 4.4 11.0
28 From the Atlantic Ocean, at the intersection of SE 10th Street and SE 15th Avenue, extending west 4.5 11.2
29 From the Atlantic Ocean, at the intersection of SE 2nd Street and NE 21st Avenue, extending west 4.6 11.3
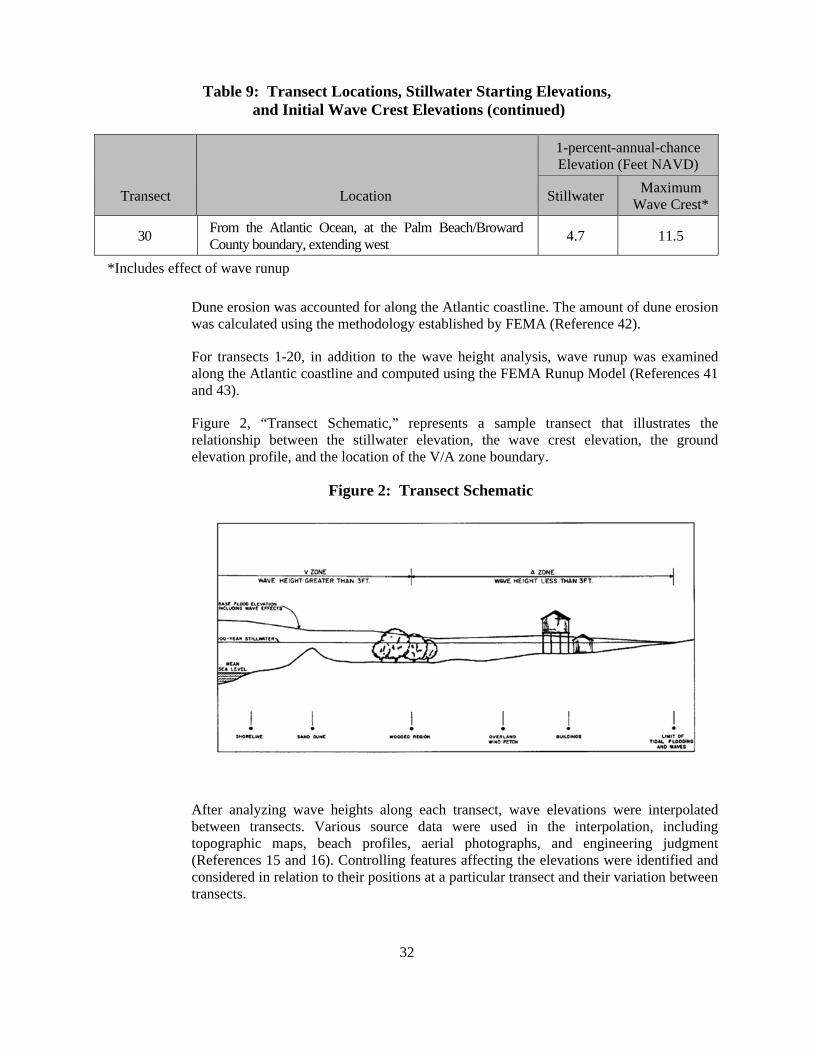
Table 9: Transect Locations, Stillwater Starting Elevations, and Initial Wave Crest Elevations (continued)
32
1-percent-annual-chance Elevation (Feet NAVD)
Transect Location Stillwater Maximum Wave Crest*
30 From the Atlantic Ocean, at the Palm Beach/Broward County boundary, extending west 4.7 11.5
*Includes effect of wave runup
Dune erosion was accounted for along the Atlantic coastline. The amount of dune erosion was calculated using the methodology established by FEMA (Reference 42).
For transects 1-20, in addition to the wave height analysis, wave runup was examined along the Atlantic coastline and computed using the FEMA Runup Model (References 41 and 43).
Figure 2, “Transect Schematic,” represents a sample transect that illustrates the relationship between the stillwater elevation, the wave crest elevation, the ground elevation profile, and the location of the V/A zone boundary.
Figure 2: Transect Schematic
After analyzing wave heights along each transect, wave elevations were interpolated between transects. Various source data were used in the interpolation, including topographic maps, beach profiles, aerial photographs, and engineering judgment (References 15 and 16). Controlling features affecting the elevations were identified and considered in relation to their positions at a particular transect and their variation between transects.
33
3.5 Vertical Datum
All FIS reports and FIRMs are referenced to a specific vertical datum. The vertical datum provides a starting point against which flood, ground, and structure elevations can be referenced and compared. Until recently, the standard vertical datum used for newly created or revised FIS reports and FIRMs was the National Geodetic Vertical Datum of 1929 (NGVD). With the completion of the North American Vertical Datum of 1988 (NAVD), many FIS reports and FIRMs are now prepared using NAVD as the referenced vertical datum.
Flood elevations shown in this FIS report and on the FIRM are referenced to NAVD88. These flood elevations must be compared to structure and ground elevations referenced to the same vertical datum. Some of the data used in this revision were taken from the prior effective FIS reports and FIRMs and adjusted to NAVD88. The datum conversion factor from NGVD29 to NAVD88 in Broward County is negative 1.5 feet.
For information regarding conversion between NGVD and NAVD, see the FEMA publication entitled Converting the National Flood Insurance Program to the North American Vertical Datum of 1988 (Reference 44), visit the National Geodetic Survey website at Hwww.ngs.noaa.govH, or contact the National Geodetic Survey at the following address:
NGS Information Services NOAA, N/NGS12 National Geodetic Survey
SSMC-3, #9202 1315 East-West Highway Silver Spring, Maryland 20910-3282 (301) 713-3242
Temporary vertical monuments are often established during the preparation of a flood hazard analysis for the purpose of establishing local vertical control. Although these monuments are not shown on the FIRM, they may be found in the Technical Support Data Notebook associated with the FIS report and FIRM for this community. Interested individuals may contact FEMA to access these data.
To obtain current elevation, description, and/or location information for benchmarks shown on this map, please contact the Information Services Branch of the NGS at (301) 713-3242, or visit their Web site at Hwww.ngs.noaa.govH.
4.0 FLOODPLAIN MANAGEMENT APPLICATIONS
The NFIP encourages State and local governments to adopt sound floodplain management programs. To assist in this endeavor, each FIS report provides 1-percent-annual-chance floodplain data, which may include a combination of the following: 10-, 2-, 1-, and 0.2-percent-annual-chance flood elevations; delineations of the 1- and 0.2-percent-annual-chance floodplains; and a 1-percent-annual-chance floodway. This information is presented on the FIRM and in many components of the FIS report, including Flood Profiles, Floodway Data Tables, and Summary of
34
Stillwater Elevation Tables. Users should reference the data presented in the FIS report as well as additional information that may be available at the local community map repository before making flood elevation and/or floodplain boundary determinations.
4.1 Floodplain Boundaries
To provide a national standard without regional discrimination, the 1-percent-annual-chance flood has been adopted by FEMA as the base flood for floodplain management purposes. The 0.2-percent-annual-chance flood is employed to indicate additional areas of flood risk in the community. For each stream studied by detailed methods, the 1- and 0.2-percent-annual-chance floodplain boundaries have been delineated using the flood elevations determined at each cross section. Between cross sections and in the overland flow and ponding areas, the boundaries were interpolated using elevations obtained from LiDAR provided by the Florida Division of Emergency Management (Reference 23). Coastal zones were revised to account for the datum shift.
On this map, the 1-percent-annual-chance floodplain boundary corresponds to the boundary of the areas of special flood hazards (Zones AE and AH), and the 0.2-percent-annual-chance floodplain boundary corresponds to the boundary of areas of moderate flood hazards. In cases where the 1- and 0.2-percent-annual-chance floodplain boundaries are close together, only the 1-percent-annual-chance floodplain boundary has been shown. Small areas within the floodplain boundaries may lie above the flood elevations, but cannot be shown due to limitations of the map scale and/or lack of detailed topographic data.
4.2 Floodways
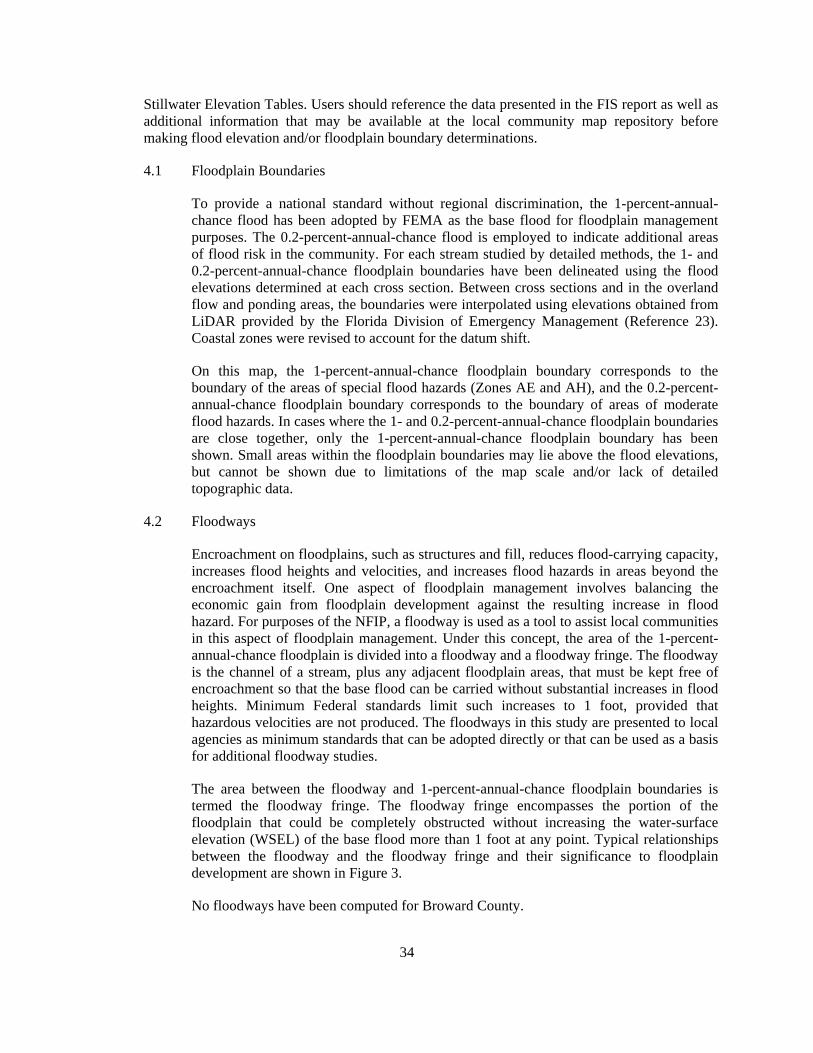
Encroachment on floodplains, such as structures and fill, reduces flood-carrying capacity, increases flood heights and velocities, and increases flood hazards in areas beyond the encroachment itself. One aspect of floodplain management involves balancing the economic gain from floodplain development against the resulting increase in flood hazard. For purposes of the NFIP, a floodway is used as a tool to assist local communities in this aspect of floodplain management. Under this concept, the area of the 1-percent-annual-chance floodplain is divided into a floodway and a floodway fringe. The floodway is the channel of a stream, plus any adjacent floodplain areas, that must be kept free of encroachment so that the base flood can be carried without substantial increases in flood heights. Minimum Federal standards limit such increases to 1 foot, provided that hazardous velocities are not produced. The floodways in this study are presented to local agencies as minimum standards that can be adopted directly or that can be used as a basis for additional floodway studies.
The area between the floodway and 1-percent-annual-chance floodplain boundaries is termed the floodway fringe. The floodway fringe encompasses the portion of the floodplain that could be completely obstructed without increasing the water-surface elevation (WSEL) of the base flood more than 1 foot at any point. Typical relationships between the floodway and the floodway fringe and their significance to floodplain development are shown in Figure 3.
No floodways have been computed for Broward County.
35
Figure 3: Floodway Schematic
5.0 INSURANCE APPLICATIONS
For flood insurance rating purposes, flood insurance zone designations are assigned to a community based on the results of the engineering analyses. These zones are as follows:
Zone AE
Zone AE is the flood insurance rate zone that corresponds to the 1-percent-annual-chance floodplains that are determined in the FIS report by detailed methods. Whole-foot BFEs derived from the detailed hydraulic analyses are shown at selected intervals within this zone.
Zone AH
Zone AH is the flood insurance rate zone that corresponds to the areas of 1-percent-annual-choice shallow flooding (usually areas of ponding) where average depths are between 1 and 3 feet. Whole-foot base flood elevations derived from the detailed hydraulic analyses are shown at selected intervals within this zone.
36
Zone AO
Zone AO is the flood insurance rate zone that corresponds to the areas of 1-percent-annual-chance shallow flooding (usually sheet flow on sloping terrain) where average depths are between 1 and 3 feet. Average whole-depths derived from the detailed hydraulic analyses are shown within this zone.
Zone VE
Zone VE is the flood insurance rate zone that corresponds to the 1-percent-annual-chance coastal floodplains that have additional hazards associated with storm waves. Whole-foot base flood elevations derived from the detailed hydraulic analyses are shown at selected intervals within this zone.
Zone X
Zone X is the flood insurance rate zone that corresponds to areas outside the 0.2-percent-annual-chance floodplain, areas within the 0.2-percent-annual-chance floodplain, areas of 1-percent-annual-chance flooding where average depths are less than 1 foot, areas of 1-percent-annual-chance flooding where the contributing drainage area is less than 1 square mile (sq. mi.), and areas protected from the base flood by levees. No BFEs or depths are shown within this zone.
6.0 FLOOD INSURANCE RATE MAP
The FIRM is designed for flood insurance and floodplain management applications.
For flood insurance applications, the map designates flood insurance rate zones as described in Section 5.0 and, in the 1-percent-annual-chance floodplains that were studied by detailed methods, shows selected whole-foot BFEs or average depths. Insurance agents use zones and BFEs in conjunction with information on structures and their contents to assign premium rates for flood insurance policies.
For floodplain management applications, the map shows by tints, screens, and symbols, the 1- and 0.2-percent-annual-chance floodplains, floodways, and the locations of selected cross sections used in the hydraulic analyses and floodway computations.
The countywide FIRM presents flooding information for the entire geographic area of Broward County. Previously, FIRMs were prepared for each incorporated community and the unincorporated areas of the County identified as flood-prone. This countywide FIRM also includes flood-hazard information that was presented separately on Flood Boundary and Floodway Maps (FBFMs), where applicable. Historical data relating to the maps prepared for each community are presented in Table 10, “Community Map History.”
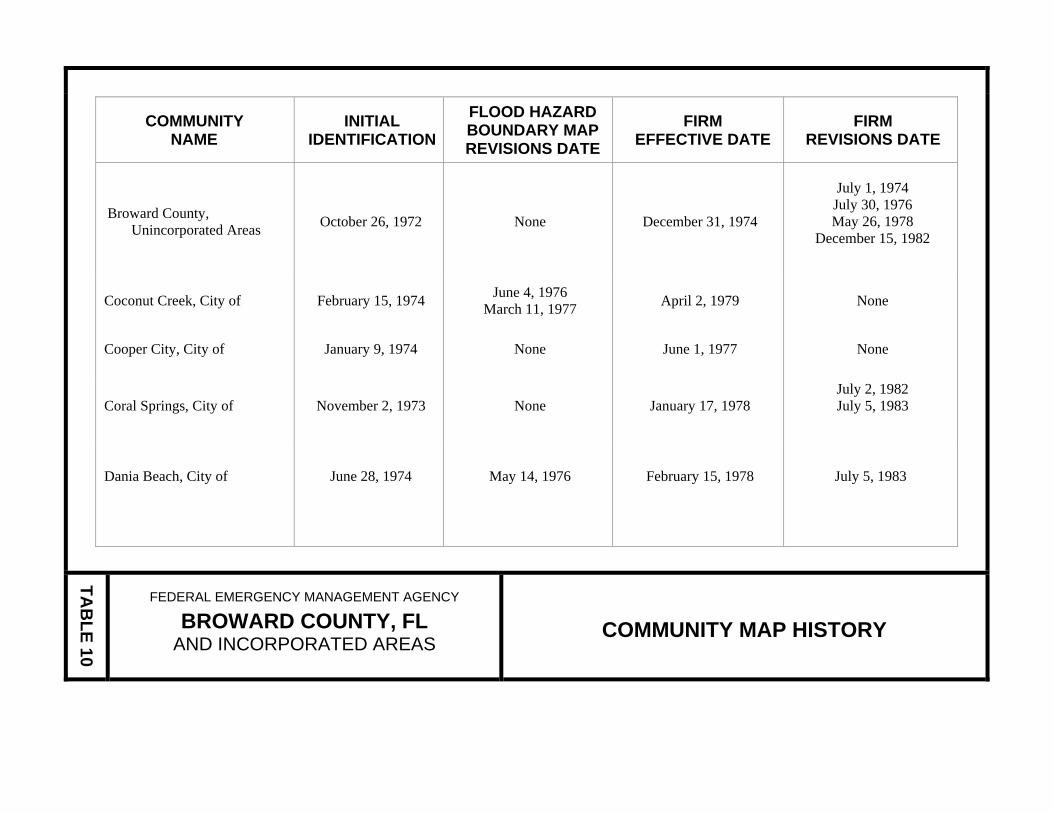
COMMUNITY NAME
INITIAL IDENTIFICATION
FLOOD HAZARD BOUNDARY MAP REVISIONS DATE
FIRM EFFECTIVE DATE
FIRM REVISIONS DATE
Broward County, Unincorporated Areas October 26, 1972 None December 31, 1974
July 1, 1974 July 30, 1976 May 26, 1978
December 15, 1982
Coconut Creek, City of February 15, 1974 June 4, 1976 March 11, 1977 April 2, 1979 None
Cooper City, City of January 9, 1974 None June 1, 1977 None
Coral Springs, City of November 2, 1973 None January 17, 1978 July 2, 1982 July 5, 1983
Dania Beach, City of June 28, 1974 May 14, 1976 February 15, 1978
July 5, 1983
TAB
LE 10
FEDERAL EMERGENCY MANAGEMENT AGENCY
BROWARD COUNTY, FL AND INCORPORATED AREAS
COMMUNITY MAP HISTORY
COMMUNITY NAME
INITIAL IDENTIFICATION
FLOOD HAZARD BOUNDARY MAP REVISIONS DATE
FIRM EFFECTIVE DATE
FIRM REVISIONS DATE
Davie, Town of February 8, 1974 None July 13, 1976 November 5, 1982 August 19, 1987
Deerfield Beach, City of November 10, 1972 None November 10, 1972
July 1, 1974 April 30, 1976 May 26, 1978
December 15, 1982
Fort Lauderdale, City of November 7, 1972 None December 31, 1974
July 1, 1974 May 14, 1976 May 26, 1978
December 15, 1982
Hallandale Beach, City of November 24, 1972 None November 24, 1972
July 1, 1974 August 29, 1975
May 26, 1978
TAB
LE 10
FEDERAL EMERGENCY MANAGEMENT AGENCY
BROWARD COUNTY, FL AND INCORPORATED AREAS
COMMUNITY MAP HISTORY
COMMUNITY NAME
INITIAL IDENTIFICATION
FLOOD HAZARD BOUNDARY MAP REVISIONS DATE
FIRM EFFECTIVE DATE
FIRM REVISIONS DATE
Hillsboro Beach, Town of January 9, 1974 January 30, 1976 April 17, 1978 December 15, 1982
Hollywood, City of November 7, 1972 None December 31, 1974
July 1, 1974 April 23, 1976 May 26, 1978
February 2, 1983 October 1, 1983
Lauderdale-By-the-Sea, Town of October 27, 1972 None December 31, 1974
July 1, 1974 April 30, 1976
December 15, 1982
Lauderdale Lakes, City of May 17, 1974 February 20, 1976 December 4, 1979 None
TAB
LE 10
FEDERAL EMERGENCY MANAGEMENT AGENCY
BROWARD COUNTY, FL AND INCORPORATED AREAS
COMMUNITY MAP HISTORY
COMMUNITY NAME
INITIAL IDENTIFICATION
FLOOD HAZARD BOUNDARY MAP REVISIONS DATE
FIRM EFFECTIVE DATE
FIRM REVISIONS DATE
Lauderhill, City of February 8, 1974 January 30, 1976 June 15, 1978 December 10, 1982 October 2, 1997
Lazy Lake, Village of September 13, 1974 None August 18, 1992 None
Lighthouse Point, City of November 7, 1972 None December 31, 1974 April 30, 1976
Margate, City of February 15, 1974 February 20, 1976 January 19, 1978 None
Miramar, City of January 23, 1974 November 1, 1974 December 1, 1977 None
North Lauderdale, City of February 22, 1974 None April 2, 1979 None
Oakland Park, City of June 28, 1974 April 9, 1976 December 1, 1977 None
TAB
LE 10
FEDERAL EMERGENCY MANAGEMENT AGENCY
BROWARD COUNTY, FL AND INCORPORATED AREAS
COMMUNITY MAP HISTORY
COMMUNITY NAME
INITIAL IDENTIFICATION
FLOOD HAZARD BOUNDARY MAP REVISIONS DATE
FIRM EFFECTIVE DATE
FIRM REVISIONS DATE
Parkland, City of August 30, 1974 April 30, 1976 April 2, 1979 None
Pembroke Park, Town of May 31, 1974 February 13, 1976 May 1, 1979 January 22, 1982
Pembroke Pines, City of April 6, 1973 None December 15, 1977 None
Plantation, City of June 28, 1974 January 9, 1976 September 15, 1977 None
Pompano Beach, City of March 16, 1973 March 5, 1976 September 5, 1979 December 15, 1982
Sea Ranch Lakes, Village of June 21, 1974 February 27, 1976 February 16, 1977 December 15, 1982
1Seminole Tribe of Florida October 26, 1972 None December 31, 1974 None
TAB
LE 10
FEDERAL EMERGENCY MANAGEMENT AGENCY
BROWARD COUNTY, FL AND INCORPORATED AREAS
COMMUNITY MAP HISTORY
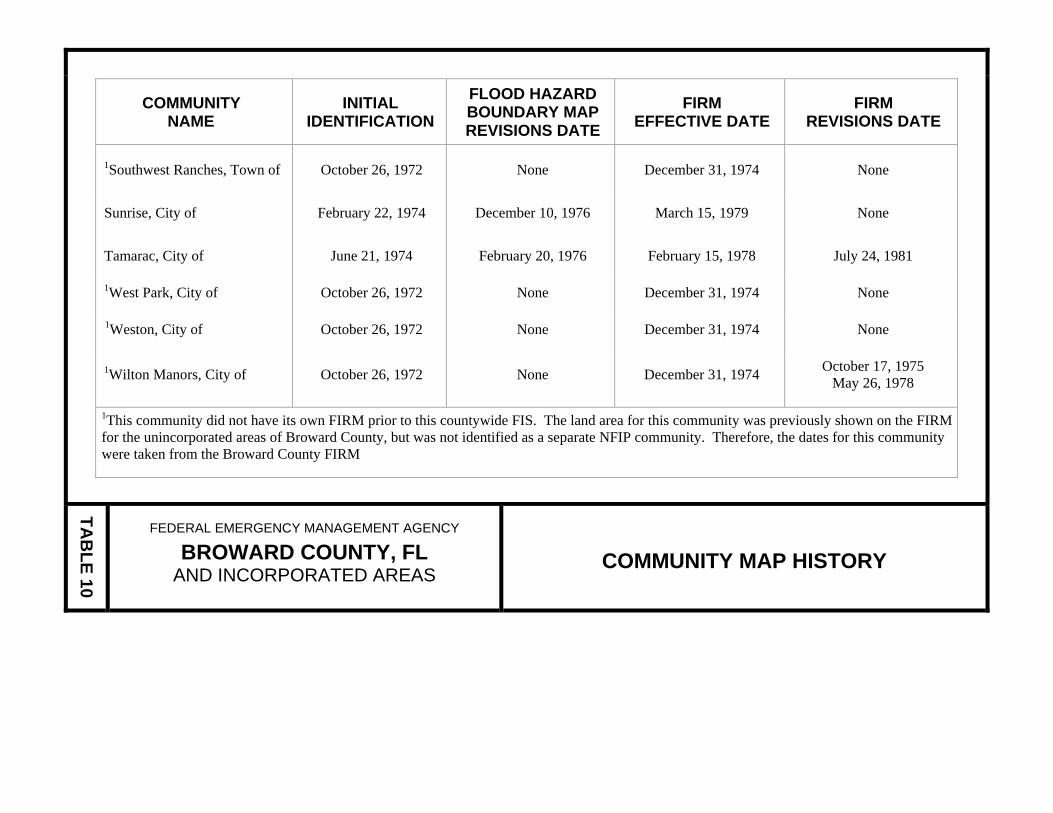
COMMUNITY NAME
INITIAL IDENTIFICATION
FLOOD HAZARD BOUNDARY MAP REVISIONS DATE
FIRM EFFECTIVE DATE
FIRM REVISIONS DATE
1Southwest Ranches, Town of October 26, 1972 None December 31, 1974 None
Sunrise, City of February 22, 1974 December 10, 1976 March 15, 1979 None
Tamarac, City of June 21, 1974 February 20, 1976 February 15, 1978 July 24, 1981
1West Park, City of October 26, 1972 None December 31, 1974 None
1Weston, City of October 26, 1972 None December 31, 1974 None
1Wilton Manors, City of October 26, 1972 None December 31, 1974 October 17, 1975 May 26, 1978
1This community did not have its own FIRM prior to this countywide FIS. The land area for this community was previously shown on the FIRM for the unincorporated areas of Broward County, but was not identified as a separate NFIP community. Therefore, the dates for this community were taken from the Broward County FIRM
TAB
LE 10
FEDERAL EMERGENCY MANAGEMENT AGENCY
BROWARD COUNTY, FL AND INCORPORATED AREAS
COMMUNITY MAP HISTORY
43
7.0 OTHER STUDIES
FIS reports have been prepared for the City of Boca Raton, the unincorporated areas of Palm Beach and Hendry Counties, and the unincorporated and incorporated areas of Miami-Dade and Collier Counties (References 45, 46, 47, 48, and 49).
This FIS report either supersedes or is compatible with all previous studies published on streams studied in this report and should be considered authoritative for the purposes of the NFIP.
8.0 LOCATION OF DATA
Information concerning the pertinent data used in the preparation of this study can be obtained by contacting Federal Insurance and Mitigation Division, FEMA Region IV, Koger-Center — Rutgers Building, 3003 Chamblee Tucker Road, Atlanta, GA 30341.
9.0 BIBLIOGRAPHY AND REFERENCES
1. Federal Emergency Management Agency, Flood Insurance Study, Broward County, Florida (Unincorporated Areas), Washington, D.C., Flood Insurance Study report dated June 15, 1982, Flood Insurance Rate Map dated December 15, 1982.
2. Federal Emergency Management Agency, Flood Insurance Study, City of Deerfield Beach, Broward County, Florida, Washington, D.C., December 15, 1982.
3. Federal Emergency Management Agency, Federal Insurance Administration, Flood Insurance Study, City of Parkland, Broward County. Florida, Washington, D.C., Flood Insurance Study report dated October 2, 1978, Flood Insurance Rate Map dated April 2, 1979.
4. Federal Emergency Management Agency, Federal Insurance Administration, Flood Insurance Study, City of Coconut Creek, Broward County, Florida, Washington, D.C., Flood Insurance Study report dated October 2, 1978, Flood Insurance Rate Map dated April 2, 1979.
5. U.S. Department of Housing and Urban Development, Federal Insurance Administration, Flood Insurance Study. City of Pembroke Pines, Broward County. Florida, Washington, D.C., Flood Insurance Study report dated February 15, 1977, Flood Insurance Rate Map dated December 15, 1977.
6. U.S. Department of Housing and Urban Development, Federal Insurance Administration, Flood Insurance Rate Map, City of Miramar, Broward County. Florida, Washington, D.C., December 1, 1977.
7. Southeast Regional Climate Center. Historical Climate Summaries for Florida: City of Fort Lauderdale. [Online, cited July 26, 2011.] Available http://www.sercc.com/ climateinfo/historical/historical_fl.html
8. U.S. Department of Agriculture, Soil Conservation Service. Soil Survey of Broward County Area, Florida, July 1976 [Online, cited July 26, 2011.] Available at http://soils.usda.gov/survey/online_surveys/florida/browardFL1976/Broward.pdf
44
9. U.S. Department of Commerce, Bureau of the Census. "State & County Quickfacts, Florida Quicklinks". [Online, cited July 26, 2011.] Available http://www.census.gov/ census2000/states/fl.html
10. American Meteorological Society, Early American Hurricanes 1492-1870, David M. Ludlum, 1963.
11. Federal Emergency Management Agency, Federal Insurance Administration, Flood Insurance Study, City of Tamarac, Broward County, Florida, Washington, D.C., Flood Insurance Study report dated May 15, 1977, Flood Insurance Rate Map dated July 24, 1981.
12. U.S. Department of Commerce, National Oceanic and Atmospheric Administration, National Climate Data Center. “Storm Events.” [Online, cited July 26, 2011.] Available http://www4.ncdc.noaa.gov.
13. Federal Emergency Management Agency, Federal Insurance Administration, Flood Insurance Study. City of Sunrise, Broward County. Florida, Washington, D.C., March 15, 1979.
14. U.S. Department of Agriculture, Soil Conservation Service, Soil Survey of Broward County, Florida, May 1984.
15. U.S. Department of the Interior, Geological Survey, 7.5-Minute Series Topographic Maps, Scale 1:24,000, Contour Interval 5 Feet: Fort Lauderdale 2 SE, Florida, 1963, photorevised 1983; West Dixie Bend, Florida, 1962, photorevised 1969; Boca Raton, Florida, 1962, photorevised 1969, photoinspected 1973; Cooper City NE, Florida, 1963, photorevised 1969 and 1973; Fort Lauderdale North, Florida, 1962, photorevised 1969 and 1973; Pompano Beach, Florida, 1962, photorevised 1969, photoinspected 1973; Cooper City SW, Florida, 1963, photorevised 1969; Andytown, Florida, 1963, photorevised 1969; Cooper City, Florida, 1963, photorevised 1969, photoinspected 1973; Fort Lauderdale South, 1962, photorevised 1969, photoinspected 1973; Port Everglades, Florida, 1945, photorevised 1969, photoinspected 1973; Pennsuco, Florida, 1963, photorevised 1969 and 1973; Opa Locka, Florida, 1962, photorevised 1969 and 1973; North Miami, Florida, 1962, photorevised 1972.
16. Broward County Engineering Division, Public Works Department, Aerial Photographs, Scale 1:3,600, March 1984.
17. Redi, Inc., Real Estate Atlas-Aerial/Metes & Bounds Map Volume of Broward County, Florida, 27th edition, 1986.
18. South Florida Water Management District, Water Management Planning for the Western C-51 Basin, March 1984.
19. U.S. Army Corps of Engineers, Hydrologic Engineering Center, HEC-1 Flood Hydrograph Package, Davis, California, January 1985.
20. Maidment, David R. Arc Hydro: GIS for Water Resources, ESRI, Inc., 2002.
45
21. Post, Buckley, Schuh & Jernigan, Inc., UHY-Computer Model, Atlanta, Georgia.
22. Broward County Environmental Protection Department, Broward County Integrated Water Resource Management Master Plan, Task 1.3 – MIKE SHE/MIKE 11 Baseline Model Technical Memorandum, Plantation, Florida, February 1, 2008.
23. Florida Division of Emergency Management, LiDAR, collected July 7, 2007 to December 22, 2007, Tallahassee, Florida.
24. U.S. Department of the Interior, Geological Survey, National Elevation Dataset, Washington, D.C. http://ned.usgs.gov
25. South Florida Water Management District, Technical Publication EMA #390, Frequency Analysis of Daily Rainfall Maxima for Central and South Florida, January 2001.
26. U.S. Department of Commerce, National Weather Service, Dynamic Wave Operational Model DWOPER, D.L. Fread, July 1984.
27. U.S. Army Corps of Engineers, Savannah District, Basin Runoff and Streamflow Simulation Model, BRASS, March 1982.
28. South Florida Water Management District, Technical Publication 81-3, Frequency Analysis of Rainfall Maximums for Central and South Florida, May 1981.
29. South Florida Water Management District, Resource Control Department, Permit Information Manual Volume IV. Management and Storage of Surface Waters, January 1984, revised May 1986.
30. U.S. Department of Commerce, Environmental Science Services Administration, Technical Memorandum WBTM Hydro II, Joint Probability Method of Tide Frequency Analysis Applied to Atlantic City and Long Beach Island. New Jersey, Vance A. Myers, April 1970.
31. U.S. Department of Commerce, National Oceanic and Atmospheric Administration, Technical Report NWS 38, Hurricane Climatology for Atlantic and Gulf Coasts of the United States, April 1987.
32. U.S. Department of Commerce, National Oceanic and Atmospheric Administration, Technical Report NWS 23, Meteorological Criteria for Standard Project Hurricane and Probable Maximum Hurricane Windfields, Gulf and East Coasts of the United States, September 1979.
33. U.S. Department of Commerce, National Oceanic and Atmospheric Administration, Technical Report NWS 15, Hurricane Climatology for the Atlantic and Gulf Coasts of the United States, December 1986.
34. Federal Emergency Management Agency, Coastal Flooding Hurricane Storm Surge Model, Methodology Volume 1; August 1988, User's Manual Volume 2, August 1988.
35. U.S. Army Corps of Engineers, Shore Protection Manual, 1984.
46
36. Florida Department of Natural Resources, Division of Marine Resources, Bureau of Beaches and Shores, Broward County Coastal Construction Control Line Study, January 1981.
37. Federal Emergency Management Agency, Wave Height Analysis for Flood Insurance Studies (Technical Documentation and WHAFIS Computer Program Version 3.0), Washington, D.C., September 1988.
38. Dewberry & Davis, Investigation and Improvement of the Capabilities of the FEMA Wave Runup Model (Technical Documentation for RUNUP 2.0), Report and Computer Program, Fairfax, Virginia, April 1990.
39. Federal Emergency Management Agency, Federal Insurance Administration, Guidelines and Specifications for Wave Elevation Determination and V-Zone Mapping, Third Draft, July 1989.
40. National Academy of Sciences, Methodology for Calculating Wave Action Effects Associated with Storm Surges, 1977.
41. Federal Emergency Management Agency, Federal Insurance Administration, Wave Height Analysis for Flood Insurance Studies, September 1988.
42. Federal Emergency Management Agency, Federal Insurance Administration, Guidelines and Specifications for Wave Elevation Determination and V Zone Mapping, October 1987.
43. Federal Emergency Management Agency, Federal Insurance Administration, Manual Runup Analysis, Coastal Flood Insurance Studies, November 1981.
44. Federal Emergency Management Agency. Converting the National Flood Insurance Program to the North American Vertical Datum of 1988 - Guidelines for Community Officials, Engineers, and Surveyors. June 1, 1992. 3-0170
45. Federal Emergency Management Agency, Flood Insurance Study, City of Boca Raton, Palm Beach County, Florida, Washington, D.C., March 19, 1984.
46. Federal Emergency Management Agency, Federal Insurance Administration, Flood Insurance Study, Palm Beach County, Florida (Unincorporated Areas), Washington, D.C., April 15, 1982.
47. Federal Emergency Management Agency, Flood Insurance Study, Hendry County, Florida (Unincorporated Areas), Washington, D.C., May 17, 1982.
48. Federal Emergency Management Agency, Flood Insurance Study, Miami-Dade County, Florida, and Incorporated Areas, Washington, D.C., September 11, 2009.
49. Federal Emergency Management Agency, Flood Insurance Study, Collier County, Florida and Incorporated Areas, Washington, D.C., November 17, 2005.
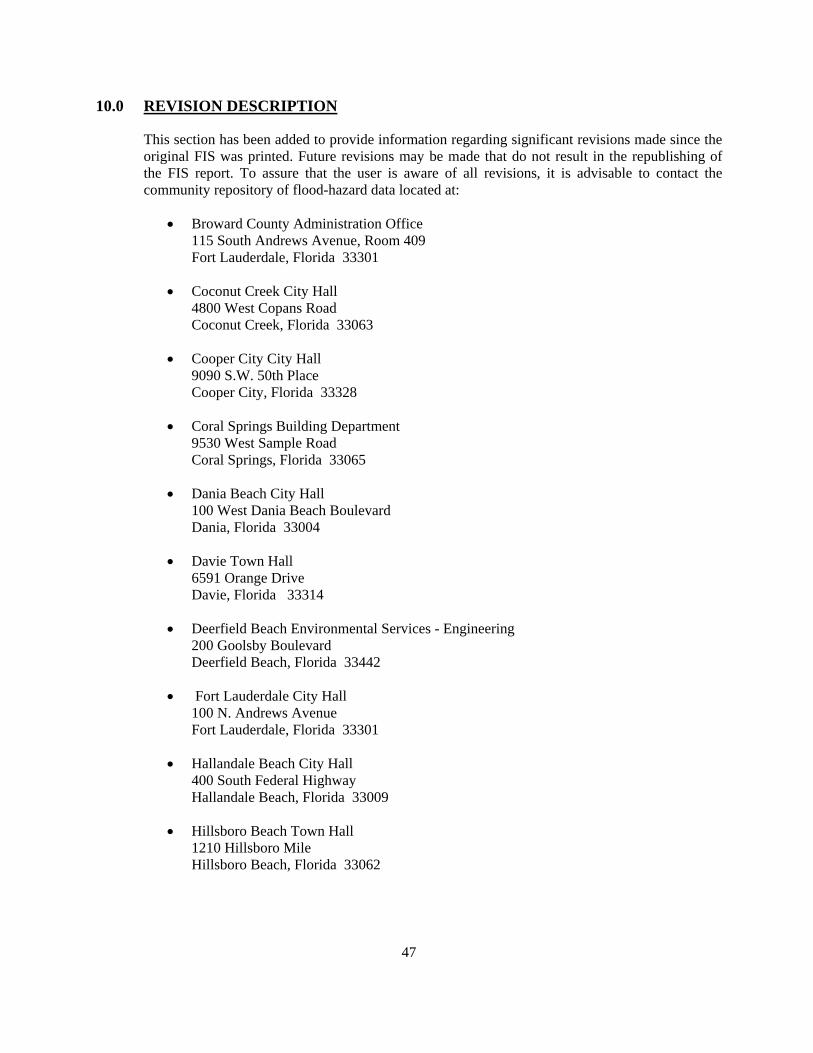
47
10.0 REVISION DESCRIPTION
This section has been added to provide information regarding significant revisions made since the original FIS was printed. Future revisions may be made that do not result in the republishing of the FIS report. To assure that the user is aware of all revisions, it is advisable to contact the community repository of flood-hazard data located at:
• Broward County Administration Office 115 South Andrews Avenue, Room 409 Fort Lauderdale, Florida 33301
• Coconut Creek City Hall 4800 West Copans Road Coconut Creek, Florida 33063
• Cooper City City Hall 9090 S.W. 50th Place Cooper City, Florida 33328
• Coral Springs Building Department 9530 West Sample Road Coral Springs, Florida 33065
• Dania Beach City Hall 100 West Dania Beach Boulevard Dania, Florida 33004
• Davie Town Hall 6591 Orange Drive Davie, Florida 33314
• Deerfield Beach Environmental Services - Engineering 200 Goolsby Boulevard Deerfield Beach, Florida 33442
• Fort Lauderdale City Hall 100 N. Andrews Avenue Fort Lauderdale, Florida 33301
• Hallandale Beach City Hall 400 South Federal Highway Hallandale Beach, Florida 33009
• Hillsboro Beach Town Hall 1210 Hillsboro Mile Hillsboro Beach, Florida 33062
48
• Hollywood City Hall 2600 Hollywood Boulevard Hollywood, Florida 33020
• Lauderdale-By-The-Sea Town Hall 4501 Ocean Drive Lauderdale-By-The-Sea, Florida 33308
• Lauderdale Lakes City Hall 4300 N.W. 36th Street Lauderdale Lakes, Florida 33319
• Lauderhill City Hall 5581 W. Oakland Park Boulevard Lauderhill, Florida 33313
• Village of Lazy Lake 2250 Lazy Lane Lazy Lake, Florida 33305
• Lighthouse Point City Hall 2200 N.E. 38th Street Lighthouse Point, Florida 33064
• Margate Department of Environmental and Engineering Services 901 NW 66th Avenue, Suite A Margate, Florida 33063
• Miramar City Hall 2300 Civic Center Place Miramar, Florida 33025
• North Lauderdale City Hall 701 S.W. 71st Avenue North Lauderdale, Florida 33068
• Oakland Park Engineering and Community Development Dept. 5399 North Dixie Highway, Suite 3 Oakland Park, Florida 33334
• Parkland City Hall 6600 University Drive Parkland, Florida 33067
• Pembroke Park Town Hall 3150 S.W. 52nd Avenue Pembroke Park, Florida 33023
49
• Pembroke Pines City Hall 10100 Pines Boulevard Pembroke Pines, Florida 33026
• Plantation City City Hall 400 N.W. 73rd Avenue Plantation, Florida 33317
• Pompano Beach City Hall 100 West Atlantic Boulevard Pompano Beach, Florida 33060
• Sea Ranch Lakes Village Hall 1 Gatehouse Road Sea Ranch Lakes, Florida 33308
• Seminole Tribe of Florida 6300 Stirling Road Hollywood, Florida 33024
• Southwest Ranches Town Hall 13400 Griffin Road Southwest Ranches, Florida 33330
• Sunrise City Hall 10770 West Oakland Park Boulevard Sunrise, Florida 33351
• Tamarac City Hall 7525 N.W. 88th Avenue Tamarac, Florida 33321
• West Park City Hall 1965 South State Road 7 West Park, Florida 33023
• Weston City Hall 1720 Royal Palm Boulevard Weston, Florida 33326
• Wilton Manors City Hall 2020 Wilton Drive Wilton Manors, Florida 33305
50
10.1 First Revision (Revised October 2, 1997)
The October 2, 1997, revision included a detailed analysis of the coastline from the Palm Beach-Broward County boundary to a point approximately 50 feet north of the intersection of South Ocean Boulevard and Pine Avenue. That revision included redelineation of all coastal high hazard areas (V Zones).
10.2 Second Revision (Revised August 18, 2014)
The August 18, 2014 revision was initiated in support of the FEMA Risk MAP Program.
This revision involved updating the mapping for the entire area of Broward County, Florida. The revision includes new detailed hydrologic and hydraulic analyses for Middle River Canal (C-13), North New River Canal, and South New River Canal (C-11). Streams that had been previously studied by detailed methods were redelineated based on more detailed and up-to-date topographic mapping. All ponding areas that had been studied by approximate methods were remapped based on new topography for this revision.
The coastal zones shown on the October 2, 1997, FIRMs for Broward County reflected the FEMA primary frontal dune policy and wave setup computation; therefore, no additional modeling or computations were performed as part of this revision. However, when a datum conversion (NGVD29 to NAVD88) was applied to the Broward County coastal flood study, the location of the VE/AE gutters and boundaries shifted. This shift is a result of how gutter locations are determined and rounded to the nearest whole foot on the FIRMs. Coastal gutters that divide the BFE are determined by locating the half foot increment between the whole foot; therefore, the range for an area of a particular BFE is between 0.4 and 0.5 below a particular whole foot BFE. In Broward County the datum conversion is approximately negative 1.5 feet. The conversion factor combined with the low flat topography along the shoreline required that all coastal gutter locations be redelineated for this revision.