Embed Size (px)
Citation preview

Federal Emergency Management Agency
FLOOD INSURANCE STUDY NUMBER
12065CV000A
JEFFERSON COUNTY, FLORIDA AND INCORPORATED AREAS
COMMUNITY NAME
COMMUNITY NUMBER JEFFERSON COUNTY (UNINCORPORATED AREAS) 120331 MONTICELLO, CITY OF 120365
EFFECTIVE:
February 5, 2014
Jefferson County

NOTICE TO FLOOD INSURANCE STUDY USERS Communities participating in the National Flood Insurance Program have established repositories of flood hazard data for floodplain management and flood insurance purposes. This Flood Insurance Study (FIS) may not contain all data available within the repository. It is advisable to contact the community repository for any additional data. Part or all of this FIS may be revised and republished at any time. In addition, part of this FIS may be revised by the Letter of Map Revision process, which does not involve republication or redistribution of the FIS. It is, therefore, the responsibility of the user to consult with community officials and to check the community repository to obtain the most current FIS components. Initial Countywide FIS Effective Date: February 5, 2014

i
TABLE OF CONTENTS
Page
1.0 INTRODUCTION 1
1.1 Purpose of Study 1
1.2 Authority and Acknowledgments 1
1.3 Coordination 2
2.0 AREA STUDIED 2
2.1 Scope of Study 2
2.2 Community Description 4
2.3 Principal Flood Problems 4
2.4 Flood Protection Measures 6
3.0 ENGINEERING METHODS 6
3.1 Riverine Hydrologic Analyses 7
3.2 Riverine Hydraulic Analyses 10
3.3 Coastal Hydrologic Analyses 13
3.4 Coastal Hydraulic Analyses 18
3.5 Vertical Datum 25
4.0 FLOODPLAIN MANAGEMENT APPLICATIONS 26
4.1 Floodplain Boundaries 26
4.2 Floodways 27
5.0 INSURANCE APPLICATIONS 34
6.0 FLOOD INSURANCE RATE MAP 35
7.0 OTHER STUDIES 36
8.0 LOCATION OF DATA 38
9.0 BIBLIOGRAPHY AND REFERENCES 38
ii
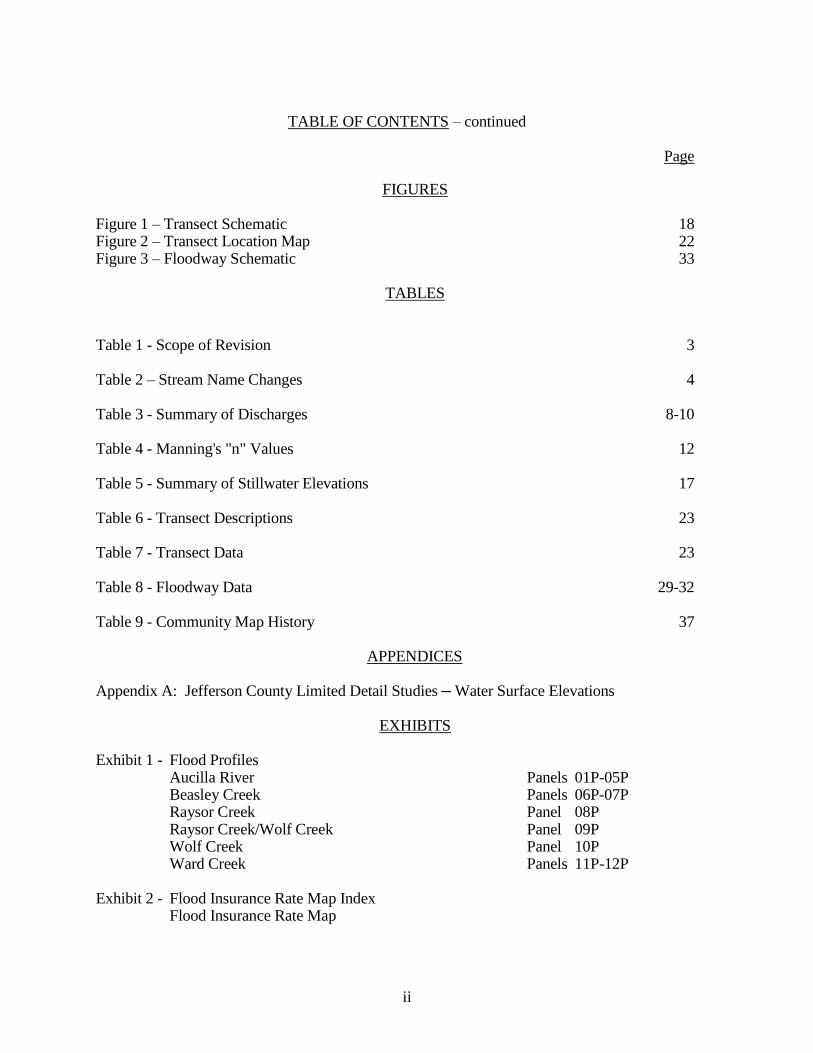
TABLE OF CONTENTS – continued
Page FIGURES Figure 1 – Transect Schematic 18 Figure 2 – Transect Location Map 22 Figure 3 – Floodway Schematic 33 TABLES Table 1 - Scope of Revision 3 Table 2 – Stream Name Changes 4 Table 3 - Summary of Discharges 8-10 Table 4 - Manning's "n" Values 12 Table 5 - Summary of Stillwater Elevations 17 Table 6 - Transect Descriptions 23 Table 7 - Transect Data 23 Table 8 - Floodway Data 29-32 Table 9 - Community Map History 37
APPENDICES Appendix A: Jefferson County Limited Detail Studies – Water Surface Elevations
EXHIBITS Exhibit 1 - Flood Profiles Aucilla River Panels 01P-05P Beasley Creek Panels 06P-07P Raysor Creek Panel 08P Raysor Creek/Wolf Creek Panel 09P Wolf Creek Panel 10P Ward Creek Panels 11P-12P Exhibit 2 - Flood Insurance Rate Map Index Flood Insurance Rate Map
1
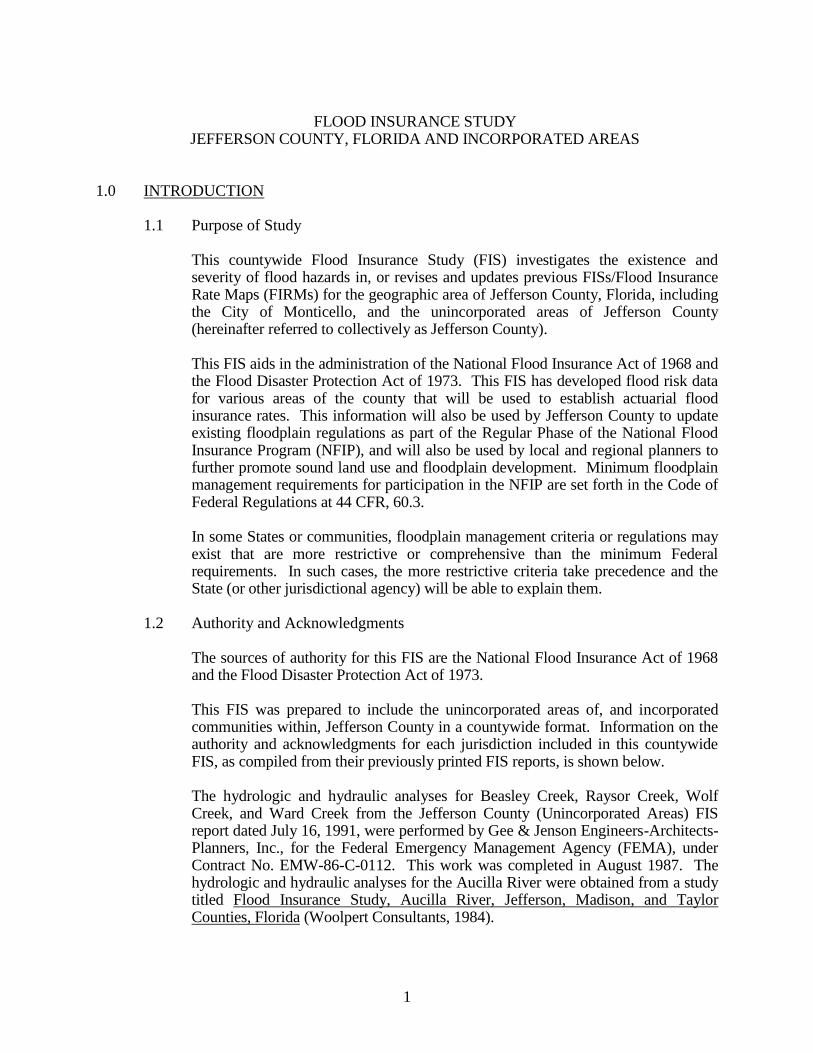
FLOOD INSURANCE STUDY JEFFERSON COUNTY, FLORIDA AND INCORPORATED AREAS 1.0 INTRODUCTION
1.1 Purpose of Study This countywide Flood Insurance Study (FIS) investigates the existence and
severity of flood hazards in, or revises and updates previous FISs/Flood Insurance Rate Maps (FIRMs) for the geographic area of Jefferson County, Florida, including the City of Monticello, and the unincorporated areas of Jefferson County (hereinafter referred to collectively as Jefferson County).
This FIS aids in the administration of the National Flood Insurance Act of 1968 and
the Flood Disaster Protection Act of 1973. This FIS has developed flood risk data for various areas of the county that will be used to establish actuarial flood insurance rates. This information will also be used by Jefferson County to update existing floodplain regulations as part of the Regular Phase of the National Flood Insurance Program (NFIP), and will also be used by local and regional planners to further promote sound land use and floodplain development. Minimum floodplain management requirements for participation in the NFIP are set forth in the Code of Federal Regulations at 44 CFR, 60.3.
In some States or communities, floodplain management criteria or regulations may
exist that are more restrictive or comprehensive than the minimum Federal requirements. In such cases, the more restrictive criteria take precedence and the State (or other jurisdictional agency) will be able to explain them.
1.2 Authority and Acknowledgments
The sources of authority for this FIS are the National Flood Insurance Act of 1968
and the Flood Disaster Protection Act of 1973. This FIS was prepared to include the unincorporated areas of, and incorporated
communities within, Jefferson County in a countywide format. Information on the authority and acknowledgments for each jurisdiction included in this countywide FIS, as compiled from their previously printed FIS reports, is shown below.
The hydrologic and hydraulic analyses for Beasley Creek, Raysor Creek, Wolf
Creek, and Ward Creek from the Jefferson County (Unincorporated Areas) FIS report dated July 16, 1991, were performed by Gee & Jenson Engineers-Architects-Planners, Inc., for the Federal Emergency Management Agency (FEMA), under Contract No. EMW-86-C-0112. This work was completed in August 1987. The hydrologic and hydraulic analyses for the Aucilla River were obtained from a study titled Flood Insurance Study, Aucilla River, Jefferson, Madison, and Taylor Counties, Florida (Woolpert Consultants, 1984).

2
The authority and acknowledgments for the City of Monticello are not available because no FIS report has been published for this community.
For this countywide FIS, revised coastal analyses for the Gulf of Mexico have been
prepared for FEMA by the Northwest Florida Water Management District under Contract No. EMA-2008-CA-5886. Additionally, several streams were studied using limited detail methods and all approximate flood hazards have been re-evaluated. All unrevised detailed studied streams have been redelineated using updated topographic data. This work was completed in 2011.
Base map information for this FIRM was developed from high resolution digital orthoimagery provided by the Florida Department of Transportation. This information was produced at a resolution of one foot in 2010. The coordinate system used for the production of this FIRM is Florida State Plane North (FIPS 0903) feet, referenced to the North American Datum of 1983 (NAD83) HARN. Corner coordinates shown on the FIRM are in latitude and longitude referenced to the State Plane projection, NAD 83 HARN. Differences in the datum and spheroid used in the production of FIRMs for adjacent counties may result in slight positional differences in map features at the county boundaries. These differences do not affect the accuracy of information shown on the FIRM.
1.3 Coordination Consultation Coordination Officer’s (CCO) meetings may be held for each
jurisdiction in this countywide FIS. An initial CCO meeting is held typically with representatives of FEMA, the community, and the study contractor to explain the nature and purpose of a FIS, and to identify the streams to be studied by detailed methods. A final CCO meeting is held typically with representatives of FEMA, the community, and the study contractor to review the results of the study.
For the FIS for the unincorporated areas of Jefferson County dated July 16, 1991,
an initial CCO meeting was held on February 7, 1986 and a final CCO meeting was held on August 22, 1990. These meetings were attended by representatives of FEMA, the community, and the study contractor.
For this countywide FIS, meetings were held on June 17, 2008 and September 11,
2012. Scoping meeting was June 17, 2008 and the CCO meeting was September 11, 2012. These meetings were announced through a letter and attended by representatives of the study contractors, the communities, the State of Florida, and/or FEMA.
2.0 AREA STUDIED
2.1 Scope of Study

3
This FIS covers the geographic area of Jefferson County, Florida. All or portions of the following flooding sources were studied by detailed methods:
Aucilla River, Beasley Creek, Gulf of Mexico, Raysor Creek, Ward Creek, Wolf Creek. Limits of detailed study for riverine flooding sources are indicated on the Flood Profiles (Exhibit 1) and on the FIRM (Exhibit 2). The areas studied by detailed methods were selected with priority given to all known flood hazard areas and areas of projected development and proposed construction.
For this countywide FIS, new limited detail hydrologic and hydraulic analyses were prepared for the flooding sources shown in Table 1, “Scope of Revision.” Section 3.2 provides a comprehensive definition of limited detail flood hazard designations. A new Zone A approximate analysis was also performed using a combination of HEC-RAS for confined and FLO-2D for unconfined flooding sources throughout the county. Updated topographic data was also used to redelineate floodplain boundaries for all unrevised detailed studied streams. Additionally, all coastal flood hazards affecting the county were restudied. The entire shoreline of Jefferson County along the Apalachee Bay was restudied with a new coastal storm surge and overland wave analysis.
TABLE 1 - SCOPE OF REVISION Stream Limits of New Limited Detail Study Buggs Creek From 18,800 feet above the mouth of Beasley Creek¹ to a point 8.32 miles upstream. Caney Branch From 1,623 feet downstream of Tram Road to a point 5.96 miles
upstream. Lloyd Creek From the railroad to a point 6.74 miles upstream. Miccosukee Lake Drain From Gamble Road to a point 6.78 miles upstream. Tributary to Wolf Creek From the confluence with Wolf Creek to a point 3.53 miles
upstream. Ward Creek From Lake Road to a point 4.77 miles upstream. Wolf Creek From Washington Highway to a point 6.03 miles upstream. ¹ Beasley Creek becomes Buggs Creek at approximately 18,800 feet above the mouth of Beasley Creek. Table 2, "Stream Name Changes," lists streams that have names in this countywide
FIS other than those used in the previously printed FISs for the communities in which they are located.

4
TABLE 2 - STREAM NAME CHANGES Community Old Name New Name Unincorporated Areas of Jefferson County
Lloyds Creek Miccosukee Lake Drain
No Letters of Map Change (LOMCs) were incorporated as part of this countywide study. All or portions of numerous flooding sources in the county were studied by
approximate methods. Approximate analyses were used to study those areas having a low development potential or minimal flood hazards. The scope and methods of study were proposed to, and agreed upon by, FEMA and Jefferson County.
2.2 Community Description
Jefferson County, in Florida’s northwest Panhandle region, encompasses an area of
approximately 637 square miles. It is bordered on the north by Thomas and Brooks Counties, Georgia; on the south by the Gulf of Mexico; on the west by Leon and Wakulla Counties, Florida; and on the east by Madison and Taylor Counties, Florida. Jefferson County is served by Interstate 10; U.S. Routes 19, 27, 90, 98; and CSX railroad. The 2010 population of Jefferson County was reported to be 14,761 (U.S. Department of Commerce, Bureau of the Census, 2010).
Jefferson County consists of uplands that are generally level to strongly sloping.
Stream valleys are narrow, and heavily wooded areas exist along the broad, flat floodplains of the Aucilla River, with other swampy lowlands scattered throughout the county (U.S. Department of Agriculture, Soil Conservation Service, undated). The climate of Jefferson County is mild year-round, although the seasonal changes are distinct. Average temperatures range from about 54 degrees Fahrenheit (°F) in January to about 81°F in August. Average annual rainfall is about 57 inches (University of Florida, Bureau of Economic Research, 1986).
2.3 Principal Flood Problems
Generally, flooding in Jefferson County stems from two sources: periods of intense rainfall causing ponding and sheet runoff in the low, poorly-drained areas and coastal flooding associated with hurricanes and tropical storms. The floodplain of the Aucilla River is also subject to flooding during high river stages.
Jefferson County is subject to coastal flooding caused by extra tropical cyclones and hurricanes. Extra tropical cyclones can occur at any time of the year but
are more prevalent in the winter. The prime hurricane season is from August to October during which time 80 percent of all hurricanes occur. September is

5
the worst month for hurricanes, during which 32 percent of the total occur. Hurricanes are of shorter duration than northeasters and generally last through
only one tidal cycle. In meteorological terms, a hurricane is defined as a tropical cyclone which has a
central barometric pressure of 29 inches or less of mercury, and wind velocities of 75 miles per hour or more. The low barometric pressures and high winds combine to produce abnormally high tides and accompanying tidal flooding. The high winds can generate large waves, provided there are no obstructions or barrier beaches to dissipate wave momentum. The winds of a hurricane in the Northern Hemisphere spiral inward in a counterclockwise direction towards the "eye" or center of low pressure. The eye of the hurricane (where winds are subdued) can vary in diameter. Normally, the "eye" can extend for 15 miles, although the eye of a mature hurricane can reach diameters of 20 to 30 miles or even greater.
A hurricane develops as a tropical storm either near the Cape Verde Islands off the African coast or in the western Caribbean Sea. Most hurricanes which reach northwestern Florida approach from a southerly direction after crossing the Florida peninsula, the island of Cuba, or the western Gulf of Mexico. These hurricanes start their journey northward with a forward speed of about 10 miles per hour.
The most destructive winds in a hurricane occur east of the eye, where the spiral wind movement and forward motion of the storm combine. Several past hurricanes have tracked over the Florida Panhandle; therefore, Jefferson County is prone to experience the full intensity of a major hurricane. In order for Jefferson County to experience the highest winds and accompanying highest tides of a hurricane, the storm would need to track west of the county.
Historical data indicates that several hurricanes have had significant impact on
Jefferson County, since 1972 – on June 19, 1972 (Agnes), on August 31, 1985 (Elena), on November 21, 1985 (Kate), on September 3, 1998 (Earl), and on July 10, 2005 (Dennis). Data provided by the Florida Department of Environmental Protection, regarding these storms, is summarized below:
Hurricane Agnes, in 1972, made landfall west of Cape San Blas, in Gulf County,
with peak winds reaching 55 mph at Apalachicola. Despite being a Category One hurricane, the storm surge affecting Franklin County is estimated to have been approximately 8 feet at St. Marks. Beach and dune erosion was significant along the entire open coast of Jefferson County, with breaches occurring on the Marsh Islands.
Hurricane Elena, in 1985, made two passes offshore of Jefferson County before
making landfall in Mississippi. Wind damage associated with Hurricane Elena was limited to shoreline areas of Jefferson County; however, the accompanying storm surge, of approximately 8 to 9 feet at St. Marks, resulted in damage to shorefront protection structures and buildings.

6
Hurricane Kate, in 1985, made landfall at Mexico Beach, in Gulf County, with peak winds reaching 85 mph at Apalachicola, just 2 months after Hurricane Elena.
The storm surge affecting Jefferson County is estimated to have been approximately 8.4 feet at Shell Point. Land falling wind and waves, associated with Hurricane Kate, resulted in the destruction of 46 buildings and damage to 15 more.
Hurricane Earl, in 1998, made landfall in Panama City Beach in Bay County. In
Jefferson County, the storm surge was approximately 8 feet at St. Marks. Shorefront erosion resulted in damage to the Marsh Islands.
Hurricane Dennis, in 2005, made landfall on Santa Rosa Island, between Navarre
Beach and Pensacola Beach, in Escambia County. Although well westward of Jefferson County, this hurricane produced a storm surge of 6 to 9 feet in Apalachee Bay and 7.5 feet at the mouth of the Aucilla River. High waves, associated with Hurricane Dennis resulted in beach erosion to open coast areas of both Franklin County and Jefferson County, with approximately 37 buildings sustaining damage in Jefferson County.
Coastal flooding is not limited to hurricane activity; in fact, extra tropical
cyclones, have resulted in significant tidal flooding along the Florida panhandle. Extra tropical cyclones can develop in the Gulf of Mexico and along strong frontal boundaries and can potentially occur at any time of year, but most frequently in the winter and spring months. Typically, these storms have centers that are colder than the surrounding air, with strongest winds in the upper atmosphere, and lower wind velocities and higher central pressures than a major hurricane; however, wind velocities associated with an extra tropical cyclone can easily reach tropical storm and Category 1 hurricane levels. In addition, the high winds of an extra tropical cyclone can last for several days, causing repeated flooding and excessive coastal erosion. The long exposure of property to high water, high winds, and pounding wave action can result severe property damage.
2.4 Flood Protection Measures The various levees, dikes, and dams located throughout Jefferson County are not
known to protect areas against the 1% annual chance flood. 3.0 ENGINEERING METHODS For the flooding sources studied in detail in the county, standard hydrologic and hydraulic
study methods were used to determine the flood hazard data required for this FIS. Flood events of a magnitude which are expected to be equaled or exceeded once on the average during any 10-, 50-, 100-, or 500-year period (recurrence interval) have been selected as having special significance for floodplain management and for flood insurance rates. These events, commonly termed the 10-, 50-, 100-, and 500-year floods, have a 10-, 2-, 1-, and 0.2-percent chance, respectively, of being equaled or exceeded during any year. Although the recurrence interval represents the long term average period between floods of

7
a specific magnitude, rare floods could occur at short intervals or even within the same year. The risk of experiencing a rare flood increases when periods greater than 1 year are considered. For example, the risk of having a flood which equals or exceeds the 100-year flood (1-percent chance of annual exceedence) in any 50-year period is approximately 40 percent (4 in 10), and, for any 90-year period, the risk increases to approximately 60 percent (6 in 10). The analyses reported herein reflect flooding potentials based on conditions existing in the county at the time of completion of this FIS. Maps and flood elevations will be amended periodically to reflect future changes.
3.1 Riverine Hydrologic Analyses
Hydrologic analyses were carried out to establish the peak discharge-frequency
relationships for the flooding sources studied in detail affecting the county. The unincorporated areas of Jefferson County have a previously printed FIS report.
The hydrologic analyses described in that report are summarized below. Pre-countywide Analyses Peak discharge frequency relationships for Ward, Wolf, Raysor, and Beasley
Creeks were calculated using U.S. Geological Survey (USGS) regression equations (U.S. Department of the Interior, 1982). Topographic maps were used in delineating drainage boundaries and in computing hydrologic parameters used in regression equations such as slopes, lake, and drainage areas (U.S. Department of the Interior, multiple years).
Peak discharge frequency relationships for the Aucilla River were based on stream
gage records taken from the Lamont gage from 1951 to 1979, a period of 29 years. Additionally, stream gage records for the Aucilla gage (no. 02326250) for the period 1965–1984 and for the Scanlon gage (no. 02326512) exist for the years 1957, 1973, and 1977–1982. The discharge data for the Lamont gage was used to determine peak discharges (U.S. Department of the Interior, 1982). The frequency rating curve was developed following the standard log-Pearson Type III distribution function (U.S. Department of the Interior, 1981).
Along the Aucilla River, between U.S. Route 98 and the confluence of Jones Mills
Creek, is a series of sinks. This area, where the Aucilla River goes underground, is described in a 1981 document (Suwannee River Water Management District, 1981). The HEC-2 backwater curves were computed using the 1957, 1973, 1977, and 1979 flood stages to their respective discharge values at the Scanlon gage. A statistical plot of these values was used to determine surface discharge rates. Because of the sinks throughout the region, the underground discharges were subtracted to determine the surface discharges.
8
Countywide Analyses Information on the methods used to determine peak discharge-frequency
relationships for the flooding sources restudied as part of this countywide FIS is shown below.
The hydrologic analyses used to determine peak discharge-frequency
relationships for flooding sources studied using limited detail methods were developed using regression equations developed by the U.S. Geological Survey (U.S. Department of the Interior, 1993).
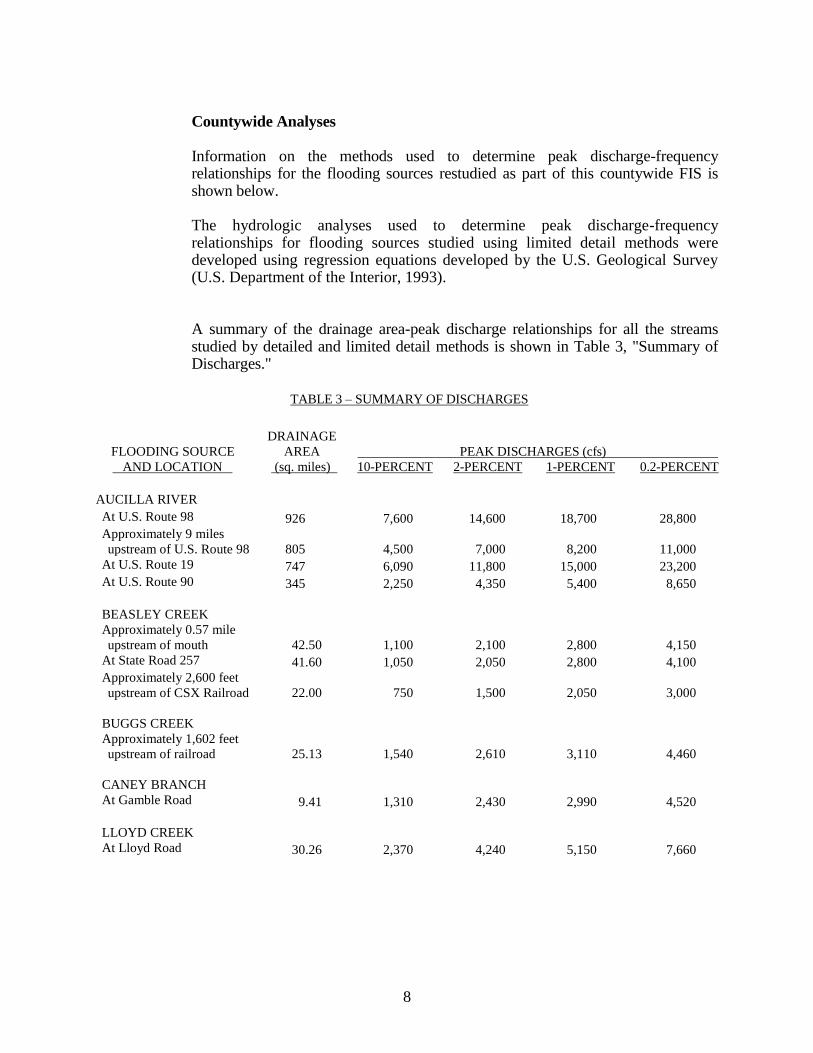
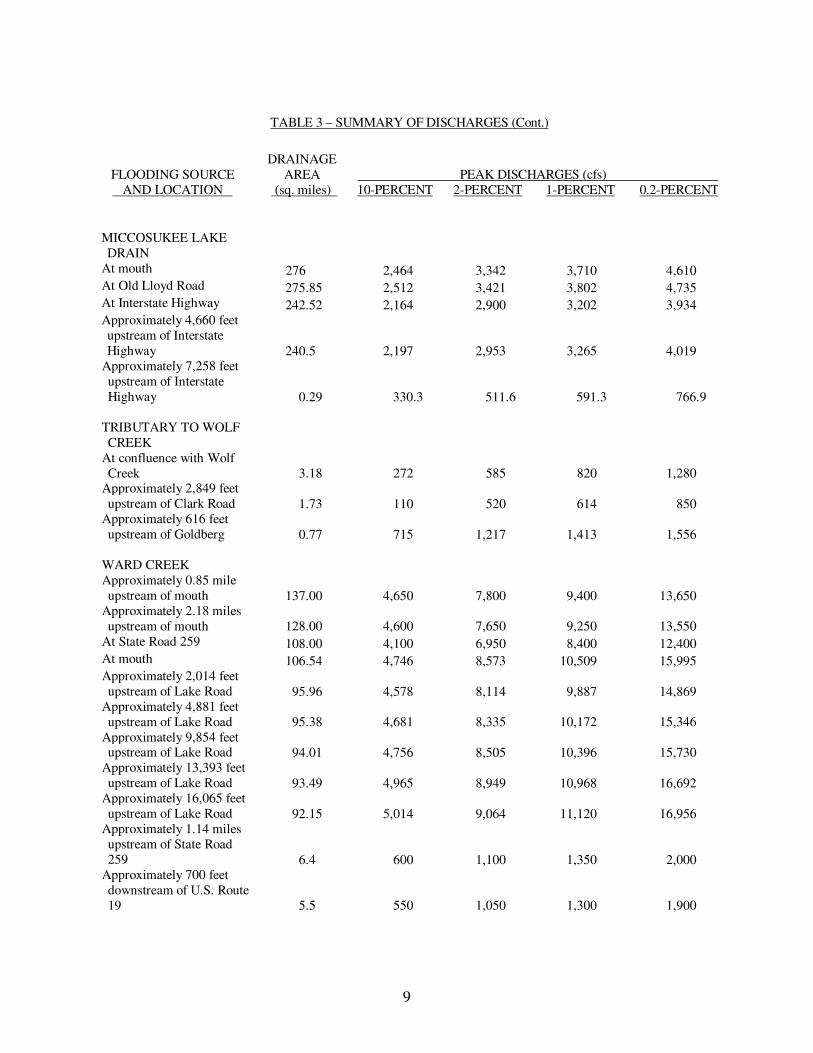
A summary of the drainage area-peak discharge relationships for all the streams
studied by detailed and limited detail methods is shown in Table 3, "Summary of Discharges."
TABLE 3 – SUMMARY OF DISCHARGES
FLOODING SOURCE
AND LOCATION
DRAINAGE
AREA
(sq. miles)
PEAK DISCHARGES (cfs)
10-PERCENT 2-PERCENT 1-PERCENT 0.2-PERCENT
AUCILLA RIVER
At U.S. Route 98 926 7,600 14,600 18,700 28,800
Approximately 9 miles
upstream of U.S. Route 98 805 4,500 7,000 8,200 11,000
At U.S. Route 19 747 6,090 11,800 15,000 23,200
At U.S. Route 90 345 2,250 4,350 5,400 8,650
BEASLEY CREEK
Approximately 0.57 mile
upstream of mouth 42.50 1,100 2,100 2,800 4,150
At State Road 257 41.60 1,050 2,050 2,800 4,100
Approximately 2,600 feet
upstream of CSX Railroad 22.00 750 1,500 2,050 3,000
BUGGS CREEK
Approximately 1,602 feet
upstream of railroad 25.13 1,540 2,610 3,110 4,460
CANEY BRANCH
At Gamble Road 9.41 1,310 2,430 2,990 4,520
LLOYD CREEK
At Lloyd Road 30.26 2,370 4,240 5,150 7,660
9
TABLE 3 – SUMMARY OF DISCHARGES (Cont.)
FLOODING SOURCE
AND LOCATION
DRAINAGE
AREA
(sq. miles)
PEAK DISCHARGES (cfs)
10-PERCENT 2-PERCENT 1-PERCENT 0.2-PERCENT
MICCOSUKEE LAKE
DRAIN At mouth 276 2,464 3,342 3,710 4,610 At Old Lloyd Road 275.85 2,512 3,421 3,802 4,735 At Interstate Highway 242.52 2,164 2,900 3,202 3,934 Approximately 4,660 feet
upstream of Interstate
Highway 240.5 2,197 2,953 3,265 4,019 Approximately 7,258 feet
upstream of Interstate
Highway 0.29 330.3 511.6 591.3 766.9
TRIBUTARY TO WOLF
CREEK
At confluence with Wolf
Creek 3.18 272 585 820 1,280 Approximately 2,849 feet
upstream of Clark Road 1.73 110 520 614 850 Approximately 616 feet
upstream of Goldberg 0.77 715 1,217 1,413 1,556
WARD CREEK Approximately 0.85 mile
upstream of mouth 137.00 4,650 7,800 9,400 13,650 Approximately 2.18 miles
upstream of mouth 128.00 4,600 7,650 9,250 13,550
At State Road 259 108.00 4,100 6,950 8,400 12,400 At mouth 106.54 4,746 8,573 10,509 15,995 Approximately 2,014 feet
upstream of Lake Road 95.96 4,578 8,114 9,887 14,869 Approximately 4,881 feet
upstream of Lake Road 95.38 4,681 8,335 10,172 15,346
Approximately 9,854 feet upstream of Lake Road 94.01 4,756 8,505 10,396 15,730
Approximately 13,393 feet
upstream of Lake Road 93.49 4,965 8,949 10,968 16,692 Approximately 16,065 feet
upstream of Lake Road 92.15 5,014 9,064 11,120 16,956 Approximately 1.14 miles
upstream of State Road
259 6.4 600 1,100 1,350 2,000 Approximately 700 feet
downstream of U.S. Route
19 5.5 550 1,050 1,300 1,900

10
TABLE 3 – SUMMARY OF DISCHARGES (Cont.)
FLOODING SOURCE
AND LOCATION
DRAINAGE
AREA
(sq. miles)
PEAK DISCHARGES (cfs)
10-PERCENT 2-PERCENT 1-PERCENT 0.2-PERCENT
WOLF CREEK At Interstate 10 46.10 1,950 3,400 4,150 6,100 At State Road 158 39.60 1,750 3,050 3,700 5,450 Approximately 1.8 miles
downstream of U.S. Route
90 35.70 1,600 2,800 3,400 5,050 At U.S. Route 90 23.50 1,200 2,100 2,550 3,750 At mouth 22.94 938.8 1441.1 1,684.7 2205.9 Approximately 3,433 feet
upstream of Washington
Road 18.01 854 1,729 2,370 3,561 Approximately 4,283 feet
downstream of Ashville
Road 14.56 715 1,457 2,001 3,012 At Ashville Road 14.37 706 1,440 1,980 2,988 At Turney Anderson 3.05 330 713 1,000 1,564 Approximately 3,758 feet
upstream of Turney
Anderson 0.76 110 248 354 570 At Dills Road 0.24 105 251 363 603
RAYSOR CREEK Approximately 1.33 miles
upstream of mouth 56.10 2,300 4,000 4,850 7,200 Approximately 0.63 mile
downstream of State Road
257 54.20 2,250 3,900 4,750 7,000 At State Road 257 52.90 2,200 3,850 4,650 6,900
Approximately 1.7 miles
upstream of State Road 257 48.40 2,050 3,600 4,350 6,400
3.2 Riverine Hydraulic Analyses
Analyses of the hydraulic characteristics of flooding from the source studied were carried out to provide estimates of the elevations of floods of the selected recurrence intervals. Users should be aware that flood elevations shown on the FIRM represent rounded whole-foot elevations and may not exactly reflect the elevations shown on the Flood Profiles or in the Floodway Data tables in the FIS report. For construction and/or floodplain management purposes, users are encouraged to use the flood elevation data presented in this FIS in conjunction with the data shown on the FIRM.
11
Cross sections were determined from topographic maps and field surveys. All bridges, dams, and culverts were field surveyed to obtain elevation data and structural geometry.
Locations of selected cross sections used in the hydraulic analyses are shown on the
Flood Profiles (Exhibit 1). For stream segments for which a floodway was computed (Section 4.2), selected cross section locations are also shown on the FIRM (Exhibit 2). Flood profiles were drawn showing computed water-surface elevations for floods of the selected recurrence intervals.
The hydraulic analyses for this FIS were based on unobstructed flow. The flood
elevations shown on the profiles are thus considered valid only if hydraulic structures remain unobstructed, operate properly, and do not fail.
The unincorporated areas of Jefferson County have a previously printed FIS report. The hydraulic analyses described in that report are summarized below.
Pre-countywide Analyses
Water-surface elevations of floods of the selected recurrence intervals for the Aucilla River and Ward, Wolf, Raysor, and Beasley Creeks, were computed using the U.S. Army Corps of Engineers’ HEC-2 step-backwater computer program (USACE, 1984). Starting water-surface elevations for all streams studied in detail were based on slope-area computations.
Cross sections for Ward, Wolf, Raysor, and Beasley Creeks were obtained from
field surveys and topographic maps (U.S. Geological Survey, multiple years, and U.S. Department of the Interior, 1981). Cross sections for the Aucilla River were obtained photogrammetrically from aerial photographs (Woolpert Consultants, 1984).
Roughness factors (Manning's "n") used in the hydraulic computations for Ward,
Wolf, Raysor, and Beasley Creeks were chosen by engineering judgment and were based on field observations of the streams and floodplain areas (Chow, 1959) (U.S. Department of Transportation, 1984) (U.S. Geological Survey, 1967). Roughness coefficients for the Aucilla River were determined by computer modeling of the backwater curves to match the historical flood marks of the September 1957 and April 1973 floods. Roughness factors for all streams studied by detailed methods are shown in Table 4, "Manning's "n" Values."
Countywide Analyses For this countywide FIS, the following flooding sources were studied using limited
detail methods: Buggs Creek, Caney Branch, Lloyd Creek, Miccosukee Lake Drain,Tributary to Wolf Creek, and portions of Ward Creek and Wolf Creek. Limited detail methods are typically used for flooding sources previously designated as approximate 1% annual chance flood zones where communities have requested upgraded flood hazard analyses, but due to the low level of

12
projected development or budget limitations, a detailed study was not performed. It is also applied to lakes that do not have level gauge data.
HEC-RAS models were developed to simulate flood elevations. Each model
included details of natural channel geometry and considered all structures which potentially impact flood levels such as bridges and culverts. Channel cross sections were obtained from LiDAR topographic data. Bridge and culvert structures were field reviewed to obtain estimated elevation data and structural geometry. Available bridge and culvert structure data were also obtained from the Florida Department of Transportation (FDOT).
Roughness coefficients (Manning’s “n”) for overbank areas were estimated using the Florida Land Use Category Classification System Level 1 (FLUCCS). Channel roughness coefficients were chosen by engineering judgment and were based on field observations. Roughness values are listed in Table 4. Starting water surface elevations for the streams studied in limited detail were determined using normal depth calculations or known water surface elevations for areas that were a continuation of the previous FIS. No floodways or flood profiles were determined for the streams studied in limited detail.
Elevations for floods of the selected recurrence intervals for the limited detail-studied streams are shown in Appendix A of this FIS report.
TABLE 4 - MANNING'S "n" VALUES
Stream Ward Creek Wolf/Raysor Creek Beasley Creek Aucilla River
Channel “n”
0.05 0.04–0.07
0.06 0.07
Overbank “n”
0.13 0.09–0.15
0.12 0.12
All qualifying bench marks within a given jurisdiction that are cataloged by the National Geodetic Survey (NGS) and entered into the National Spatial Reference System (NSRS) as First or Second Order Vertical and have a vertical stability classification of A, B, or C are shown and labeled on the FIRM with their 6-character NSRS Permanent Identifier. Bench marks cataloged by the NGS and entered into the NSRS vary widely in vertical stability classification. NSRS vertical stability classifications are as follows:
Stability A: Monuments of the most reliable nature, expected to hold
position/elevation well (e.g., mounted in bedrock)

13
Stability B: Monuments which generally hold their position/elevation well (e.g., concrete bridge abutment)
Stability C: Monuments which may be affected by surface ground
movements (e.g., concrete monument below frost line) Stability D: Mark of questionable or unknown vertical stability (e.g.,
concrete monument above frost line, or steel witness post) In addition to NSRS bench marks, the FIRM may also show vertical control monuments established by a local jurisdiction; these monuments will be shown on the FIRM with the appropriate designations. Local monuments will only be placed on the FIRM if the community has requested that they be included, and if the monuments meet the aforementioned NSRS inclusion criteria. To obtain current elevation, description, and/or location information for bench marks shown on the FIRM for this jurisdiction, please contact the Information Services Branch of the NGS at (301) 713-3242, or visit their Web site at www.ngs.noaa.gov. It is important to note that temporary vertical monuments are often established during the preparation of a flood hazard analysis for the purpose of establishing local vertical control. Although these monuments are not shown on the FIRM, they may be found in the Technical Support Data Notebook associated with this FIS and FIRM. Interested individuals may contact FEMA to access this data.
3.3 Coastal Hydrologic Analyses
Storm Surge Analysis and Modeling
For areas subject to tidal inundation, the 10-, 2-, 1-, and 0.2-percent-annual-chance stillwater elevations and delineations were taken directly from a detailed storm surge study documented in the Technical Support Data Notebook (TSDN) for the Northwest Florida Water Management District coastal flood hazard study for Franklin, Wakulla, and Jefferson Counties.
The Advanced Circulation model for Coastal Ocean Hydrodynamics (ADCIRC), (Luettich, 1992), developed by the U.S. Army Corps of Engineers (USACE) was selected to develop the stillwater elevations or storm surge for northwest Florida’s Franklin, Wakulla, and Jefferson Counties. ADCIRC uses an unstructured grid and is a finite-element long wave model. ADCIRC has the capability to simulate tidal circulation and storm surge propagation over large areas and is able to provide highly detailed resolution along the shorelines and areas of interest along the open coast and inland bays. It solves three dimensional equations of motion, including tidal potential, Coriolis, and nonlinear terms of the governing equations. The model is formulated from the depth averaged shallow water equations for conservation of mass and momentum which results in the generalized wave continuity equation. The model has the capability to simulate tidal circulation and

14
storm surge propagation over large domains and is able to provide highly detailed resolution along the shoreline and other areas of interest.
The coastal wave model Simulating Waves Nearshore (SWAN) developed by Delft University in the Netherlands is used to calculate the nearshore wave fields required for the addition of wave setup effects. This numerical model is a third-generation (phase-averaged) wave model for the simulation of waves in waters of extreme, intermediate, and finite depths. Model characteristics include the capping of the atmospheric drag coefficient, dynamic adjustment of bathymetry for changing water levels, and specification of the required save points. Three nested grids are used to obtain sufficient nearshore resolution to represent the radiation stress gradients required as ADCIRC inputs. Radiation stress fields output from the SWAN inner grids are used by ADCIRC to estimate the contribution of breaking waves (wave setup effects) to the total storm surge water level.
In order to model storm surge and wave fields using ADCIRC and SWAN, wind and pressure fields are required for input. A model called the Planetary Boundary Layer model (PBL) (Cardone, 1992), uses the parameters from a hurricane or storm to simulate the event and develop wind and pressure fields. The PBL model simulates hurricane induced wind and pressure fields by applying the vertically integrated equations of motion. Oceanweather Inc. provided support to run the PBL model and provide wind and pressure fields for each of the selected storms events.
The Joint Probability Method (JPM) was used to develop the stillwater frequency curves for the 10-, 2-, 1-, and 0.2-percent-annual-chance stillwater elevations. The JPM application was not originally named as such (Russell, 1968). The JPM approach is a simulation methodology that relies on the development of statistical distributions of key hurricane input variables such as central pressure, radius to maximum wind speed, maximum wind speed, translation speed, track heading, and sampling from these distributions to develop model hurricanes. The resulting simulation results in a family of modeled storms that preserve the relationships between the various input model components, but provides a means to model the effects and probabilities of storms that historically have not occurred.
An ADCIRC finite element mesh was created to determine inundation extents and depths due to hurricane storm surge in Northwest Florida’s Franklin, Wakulla, and Jefferson Counties. The offshore portion of the mesh covers the Atlantic Ocean, Caribbean Sea, and Gulf of Mexico west of 60
o West Longitude. This
offshore portion is adapted from a proven existing mesh (Hagen, 2006). The inland portion of the mesh was extended to floodplain areas of Franklin, Wakulla, and Jefferson Counties and refined with node spacing ranging from 40-50 meters to 250-300 meters. The inland bathymetry portion of the ADCIRC mesh was populated with datasets taken from National Ocean Service (NOS) and USACE Surveys, HEC-RAS one-dimensional river cross-sections, NOAA nautical charts, and Northwest Florida Water Management District (NWFWMD) field knowledge. Bathymetry for most of the bays and northeastern Gulf of Mexico

15
was constructed from the National Geophysical Data Center's (NGDC) Coastal Relief Model and USACE channel surveys. A portion of the northern Apalachee Bay was constructed from NOS Surveys, NOAA nautical chart data, and USACE channel surveys. Further offshore, the mesh restrains its original node elevations as detailed in Hagen, 2006.
The topographic portion of the ADCIRC mesh was populated with topographic LiDAR (Light Detection and Ranging) data along with five non-LiDAR terrain datasets. LiDAR data was available for most of the study area and all of the subject counties with the exception of small portions on the western boundary of Franklin County and the eastern boundary of Jefferson County. LiDAR data for Franklin, Wakulla, and Jefferson Counties was collected between July and December of 2007 as part of the Florida Department of Emergency Management's mapping update program. For all other areas, non-LiDAR terrain datasets were downloaded from the USGS National Map Seamless Server, National Elevation Dataset. A shoreline was manually digitized referencing the LiDAR data and 2007 aerial photos to define the change between water and land elements.
The ADCIRC model mesh includes other features, such as rivers, roads, ridges and valleys. The final mesh includes approximately 2,250 square miles of floodplain area with 869,000 total computational nodes. The horizontal datum for the mesh is North American Datum (NAD) 1983, Geographic Coordinate System. The vertical datum is referenced to the North American Vertical Datum 1988 (NAVD 88) in units of meters. A land cover dataset assembled by the Florida Fish and Wildlife Commission (FWC) specifically to describe the diversity and distribution of vegetation within the state of Florida was used to define Manning’s n values for bottom roughness coefficients input at each node in the mesh. Model validation, which tests the model hydraulics and ability to reproduce events, was performed against Hurricanes Agnes (1972), Kate (1985), Opal (1995) and Dennis (2005). Simulated water levels for each event were compared to High Water Mark (HWM) data supplied by FEMA and historic reports and hydrograph data supplied by NWFWMD and NOAA.
The SWAN model, used to calculate the wave setup component, uses ocean bathymetry and coastal topography taken from two sources, the National Geophysical Data Center (NGDC – GEODAS data set) and the NWFWMD ADCIRC Grid, which incorporated the high resolution LiDAR survey data reported on elsewhere. The Coastal bathymetry data merged both the NGDC and ADCIRC Grid data to more accurately represent the topography over the land. The topography data was interpolated from the LiDAR data used to form the ADCIRC grid. At locations farther inland than ADCIRC grid, the NGDC dataset was used. The SWAN model was implemented on a set of nested grids, with resolutions ranging from 10 kilometers down to approximately 160 meters. The model is forced with the same wind and pressure fields from Oceanweather Inc. Hurricanes Kate (1986), Opal (1995), and Dennis (2005) were used to validate the SWAN model. Modeled wave heights were compared to available historic wave data from NOAA wave buoys.

16
Statistical Analyses
Due to the excessive number of simulations required for the traditional JPM method, the Joint Probability Method-Optimum Sampling (JPM-OS) was utilized to determine the stillwater elevations associated with tropical events. JPM-OS is a modification of the JPM method developed cooperatively by FEMA and the USACE for Mississippi and Louisiana coastal flood studies that were being performed simultaneously, and is intended to minimize the number of synthetic storms that are needed as input to the ADCIRC model. The methodology entails sampling from a distribution of model storm parameters (e.g., central pressure, radius to maximum wind speed, maximum wind speed, translation speed, and track heading) whose statistical properties are consistent with historical storms impacting the region, but whose detailed tracks differ.
Production runs were carried out with SWAN and ADCIRC on a set of hypothetical storm tracks and storm parameters in order to obtain the maximum water levels for input to the statistical analysis. A total of 159 individual storms with different tracks and various combinations of the storm parameters were chosen for the production run set of synthetic hurricane simulations. Each storm was run for at least 4 days of simulation and did not include tidal forcing. Wind and pressure fields obtained from the PBL model and wave radiation stress from the SWAN model were input to the ADCIRC model for each production storm. All stillwater results for this study include the effects of wave setup.
Stillwater Elevations The results of the ADCIRC model, as described above, provided stillwater elevations, including wave setup effects that are statistically analyzed to produce probability curves. The JPM-OS is applied to obtain the return periods associated with tropical storm events. The approach involves assigning statistical weights to each of the simulated storms and generating the flood hazard curves using these statistical weights. The statistical weights are chosen so that the effective probability distributions associated with the selected greater and lesser storm populations reproduce the modeled statistical distributions derived from all historical storms. All of the 869,000 ADCIRC nodes were used as JPM output points. This provided the maximum resolution and provided detailed coverage in Jefferson County. At each JPM point, the surge elevations obtained from the standard ADCIRC output files for each of the 159 storms and the annual recurrence rates for each storm were used as input of JPM-OS method. The final result was surge elevations at each JPM point for each recurrence rate.
The stillwater elevations have been determined for the 10-, 2-, 1-, and 0.2-
percent annual chance floods for the flooding sources studied by detailed methods and are summarized in Table 5, "Summary of Stillwater Elevations."

17
TABLE 5 - SUMMARY OF STILLWATER ELEVATIONS
FLOODING SOURCE
AND LOCATION
ELEVATION (feet1 NAVD88*)
10-PERCENT
2-PERCENT 1-PERCENT
0.2-PERCENT
APPALACHEE BAY/GULF
OF MEXICO
South shoreline from Little
Porpoise Creek to Black
Rock Creek 7.9 14.8-14.9 16.7-16.9 20.5-20.6
South shoreline from Black
Rock Creek to Pinhook
River 7.8-7.9 14.8-14.9 16.9-17.0 20.6-20.7
Southwest shoreline from
Pinhook River to Aucilla
River 7.7-7.8 14.5-14.8 16.6-16.8 20.3-20.6
*North American Vertical Datum of 1988 1 Includes wave setup

18
3.4 Coastal Hydraulic Analyses
Areas of coastline subject to significant wave attack are referred to as coastal high hazard zones. The USACE has established the 3.0-foot breaking wave as the criterion for identifying the limit of coastal high hazard zones (USACE, 1975). The 3.0-foot wave has been determined as the minimum size wave capable of causing major damage to conventional wood frame and brick veneer structures. Figure 1, “Transect Schematic,” illustrates a profile for a typical transect along with the effects of energy dissipation and regeneration on a wave as it moves inland. This figure shows the wave crest elevations being decreased by obstructions, such as buildings, vegetation, and rising ground elevations, and being increased by open, unobstructed wind fetches. The figure also illustrates the relationship between the local still water elevation, the ground profile and the location of the V/A boundary. This inland limit of the coastal high hazard area is delineated to ensure that adequate insurance rates apply and appropriate construction standards are imposed, should local agencies permit building in this coastal high hazard area.
Figure 1: Transect Schematic For Jefferson County the deepwater wave conditions associated with the 1-percent annual chance storm were developed using the Simulating WAves Nearshore (SWAN) model results. The outputs from the model production runs provided wave heights and periods to determine the wave heights associated with the 1-percent annual chance flood level. For each of the production runs, the maximum wave heights achieved at each grid point were put into files, as well as the average wave periods associated with the time when the maximum waves occurred. Then the wave heights at each of 596,000 coastal wave grid points were rank ordered. Using the probability of each storm, the 1-percent annual chance flood thresholds were determined, so the wave periods associated with the wave heights were determined afterwards. This technique gave a least squares best fit linear relationship between the flood levels from each storm and the wave heights for each storm.

19
FEMA guidelines for V Zone mapping define sH as the significant wave height or the average over the highest one third of waves and sT as the significant wave period associated with the significant wave height. Mean wave conditions are described as:
H = sH 0.626 T = sT 0.85
where H is the average wave height of all waves and T is the average wave period.
The transects were located with consideration given to the physical and cultural characteristics of the land so that they would closely represent conditions in their locality. Transects were spaced close together in areas of complex topography and dense development. In areas having more uniform characteristics, transects were spaced at larger intervals. It was also necessary to locate transects in areas where unique flooding existed and in areas where computed wave heights varied significantly between adjacent transects. Transects are shown on the FIRM panels for Jefferson County. The transect profiles were obtained using bathymetric and topographic data from various sources. The topographic dataset was comprised of LiDAR data provided by the Northwest Florida Water Management District (NWFWMD). LiDAR data was collected in July 2007 in leaf-off conditions, and delivered in ESRI multipoint format in November 2008. Data, as delivered, was in the North American Datum (NAD) of 1983, projected to Florida HARN State Plane coordinates, North Zone, in units of feet. The vertical datum was relative to North American Vertical Datum (NAVD) of 1988 in units of feet. The LiDAR mass point dataset had a nominal point spacing of 0.7 meters (2.3 feet), with a horizontal accuracy of 3.8-foot, and a vertical accuracy of 9.45 cm RMSEz. This data fully meets and exceeds the accuracy standards of FEMA specifications, and should meet the expectations for an accurate, high quality digital terrain product. The bathymetric dataset for Jefferson County was processed and provided by the University of Central Florida during April 2009. Bathymetry for most of the bays and northeastern Gulf of Mexico consisted of NOAA National Ocean Service (NOS) hydrographic surveys, NOAA National Geophysical Data Center (NGDC) Coastal Relief Model, NOAA nautical chart data, and USACE navigation channel surveys. Data, as delivered, were in grid format with various grid spacing, in the NAD of 1983, projected to Florida State Plane coordinates, North Zone, in units of feet. The vertical datum was relative to NAVD of 1988 in units of meters. The inland bathymetry in the Apalachicola and Carabelle/Ochlockonee areas consisted of NOS Surveys, USACE navigation channel surveys, HEC-RAS one-dimensional river cross-sections, NOAA nautical charts, and NWFWMD field knowledge. Data, as delivered, were in grid format with various grid spacing, in the NAD of 1983, projected to Florida State Plane coordinates, North Zone, in

20
units of feet. The vertical datum was relative to NAVD of 1988 in units of meters. The bathymetric dataset’s depths were converted from meters to feet using a factor of 3.2808. Data were then reprojected to the NAD83 FL HARN State Plane North zone coordinate system in units of feet, in agreement with the topographic dataset. Where surveys overlapped, the older survey data were removed. To facilitate use of the bathymetric data to build a seamless digital elevation model, the ESRI shapefile-format point data were converted to three-dimensional feature class, and then to ASCII format dataset. Finally, the bathymetric data were ready to be merged with the topographic data-multipoint feature class. To facilitate floodplain analysis, the provided datasets were processed into a digital elevation model (DEM). The recently developed ESRI Terrain modeling framework is considered to be the most efficient data format to create terrain, and was utilized for this study. First, a file geodatabase was created to contain the topographic and bathymetric dataset and allow generation of the terrain model. A pre-determined coverage shapefile was loaded into the database to serve as the study area boundary. Next, a shoreline vector was also loaded as a hard line feature class with an assigned zero-elevation, in order to enforce the shoreline feature in the terrain dataset. The terrain was then created by combining the topographic and bathymetric multipoint files, zero-elevation shoreline vector and study-area boundary. The completed terrain dataset was generated with an average point spacing of 10 feet. The terrain was then converted directly to the final seamless DEM in order to support the overland wave modeling and coastal hazard mapping. Storm-induced beach erosion is not applicable to Jefferson County as the shorelines are low estuarine marsh areas. Also, since no consistent sandy beaches exist in Jefferson County no Primary Frontal Dunes (PFD) were identified and delineated, the VE Zone boundary was mapped up to the extent of the results from the overland wave modeling. Nearshore wave-induced processes, such as wave setup and wave runup, constitute a greater part of the combined wave envelope than storm surge due to the coast exposure to ocean waves. For this study the wave setup was included in the storm surge modeling results. Wave runup was not applicable to Jefferson County as the shoreline is a low marsh environment with very gentle broad slopes. Wave height calculation used in this study follows the methodology described in FEMA’s Guidelines and Specifications for Flood Hazard Mapping Partners (2003 and 2007). The Wave Height Analysis for Flood Insurance Studies (WHAFIS) was used to propagate wave heights over land and to define the base flood elevations for mapping. The starting wave conditions were obtained just offshore of the shoreline from the 2D wave model SWAN as described previously. Local land use field reconnaissance data and aerial photography were used to define the overland wave obstruction coefficients for input to WHAFIS. The 1% stillwater elevations were extracted from the storm surge modeling results to define a stillwater profile along each transect.

21
Figure 2, “Transect Location Map,” illustrates the location of each transect. Along each transect, wave envelopes were computed considering the combined effects of changes in ground elevation, vegetation and physical features. Between transects, elevations were interpolated using topographic maps, land-use and land-cover data, and engineering judgment to determine the aerial extent of flooding. The results of the calculations are accurate until local topography, vegetation, or cultural development within the community undergo major changes. The transect data for the county are presented in Table 6, “Transect Descriptions,” which describes the location of each transect. In addition, Table 6, provides the 1-percent annual chance stillwater with wave setup and the maximum wave crest elevations for each transect along coastline. In Table 7, “Transect Data,” the flood hazard zone and base flood elevations for each transect flooding source is provided, along with the 10-, 2-, 1-, and 0.2-percent annual chance stillwater elevations for the respective flooding source.

22
AN
D IN
CO
RP
OR
AT
ED
AR
EA
S

23
TABLE 6 - TRANSECT DESCRIPTIONS
ELEVATION (ft NAVD 88*)
MAXIMUM
1-PERCENT 1-PERCENT
ANNUAL CHANCE ANNUAL CHANCE
TRANSECT LOCATION STILLWATER WAVE CREST
1 On the Gulf of Mexico coastline, approximately
700 feet west of the mouth of Black Rock Creek,
at N 30.102638°, W -84.046943°
16.91
20.1
2 On the Gulf of Mexico coastline, approximately
300 feet west of the mouth of Catfish Creek and
1500 feet east of the mouth of Little Redfish
Creek, at N 30.103239°, W -84.021181°
16.91
20.1
3 On the Gulf of Mexico coastline at the southeast
side of the mouth of the Pinhook River, at N
30.099192°, W-83.999691°
16.81
20.0
*North American Vertical Datum of 1988 1Includes wave setup
TABLE 7 - TRANSECT DATA
BASE FLOOD
FLOODING STILLWATER ELEVATION (feet1 NAVD88*) ELEVATION
SOURCE TRANSECT 10-PERCENT 2-PERCENT 1-PERCENT 0.2-PERCENT ZONE (feet NAVD88*)
Jefferson County
Gulf of Mexico 1 8.0 14.9 17.0 20.5 VE 20-21
7.7 14.2 16.1 19.7 VE 18-19
7.5 13.6 15.4 19.0 AE 15-18
7.0 11.4 12.8 16.8 AE 13-14
Gulf of Mexico 2 7.9 14.9 17.0 20.7 VE 20-21
7.6 14.1 16.0 19.6 VE 18-19
7.3 13.4 15.1 18.7 AE 14-18
6.8 10.7 12.4
15.1 AE 12-13
Gulf of Mexico 3 7.8 14.9 16.8 20.7 VE 20-22
7.3 13.8 15.7 19.4 VE 17-19
7.0 12.9 14.7 18.2 AE 14-17
4.5 10.4 11.9 15.5 AE 11-13
*North American Vertical Datum of 1988
1Includes wave setup

24
Users of the FIRM should also be aware that coastal flood elevations are provided in the Summary of Stillwater Elevations (Table 5) in this report. If the elevation on the FIRM is higher than the elevation shown in this table, a wave height, wave runup, and/or wave setup component likely exists, in which case, the higher elevation should be used for construction and/or floodplain management purposes. As identified in FEMA’s Guidelines and Specifications for Flood Hazard Mapping Partners (FEMA 2003 and 2007), the coastal high hazard area (Zone VE) is the area where wave action and/or high velocity water can cause structural damage. It is designated on the FIRM as the most landward of the following three points:
1) The point where the 3.0 feet or greater wave height could occur; 2) The point where the eroded ground profile is 3.0 feet or more below the
maximum runup elevation; and 3) The primary frontal dune as defined in the NFIP regulations. These three points are used to locate the inland limit of the coastal high hazard
area to ensure that adequate insurance rates apply and appropriate construction standards are imposed, should local agencies permit building in this area.
Along each transect, wave heights and wave crest elevations were
computed considering the combined effects of changes in ground elevation, vegetation, and physical features. Wave heights were calculated to the nearest 0.1 foot, and wave crest elevations were determined at whole-foot increments along the transects. The calculations were carried inland along the transect until the wave crest elevation was permanently less than 0.5 foot above the stillwater-surge elevation or the coastal flooding met another flooding source (i.e., riverine) with an equal water-surface elevation. The results of the calculations are accurate until local topography, vegetation, or cultural development of the community undergo any major changes.
It has been shown in laboratory tests and observed in field investigations that wave heights as little as 1.5 feet can cause damage to and failure of typical Zone AE construction. Therefore, for advisory purposes only, a Limit of Moderate Wave Action (LiMWA) boundary has been added in coastal areas subject to wave action. The LiMWA represents the approximate landward limit of the 1.5-foot breaking wave. The effects of wave hazards in the Zone AE flood zone between the Zone VE boundary (or shoreline in areas where VE Zones are not identified) and the limit of the LiMWA boundary are similar to, but less severe than, those in Zone VE where 3-foot breaking waves are projected during a 1-percent annual chance flooding event. In areas where wave runup elevations dominate over wave heights, such as areas with steeply sloped beaches, bluffs, and/or shore-parallel flood protection

25
structures, there is no evidence to date of significant damage to residential structures by runup depths less than 3 feet. However, to simplify representation, the LiMWA is continued immediately landward of the VE/AE boundary in areas where wave runup elevations dominate. Similarly, in areas where the Zone VE designation is based on the presence of a primary frontal dune or wave overtopping, the LiMWA is also delineated immediately landward of the Zone VE/AE boundary.
3.5 Vertical Datum
All FISs and FIRMs are referenced to a specific vertical datum. The vertical datum provides a starting point against which flood, ground, and structure elevations can be referenced and compared. Until recently, the standard vertical datum in use for newly created or revised FISs and FIRMs was the National Geodetic Vertical Datum of 1929 (NGVD 29). With the finalization of the North American Vertical Datum of 1988 (NAVD 88), many FIS reports and FIRMs are being prepared using NAVD 88 as the referenced vertical datum. All flood elevations shown in this FIS report and on the FIRM are referenced to NAVD 88. Structure and ground elevations in the community must, therefore, be referenced to NAVD 88. It is important to note that adjacent communities may be referenced to NGVD 29. This may result in differences in base flood elevations across the corporate limits between the communities. Prior versions of the FIS report and FIRM were referenced to NGVD 29. When a datum conversion is effected for an FIS report and FIRM, the Flood Profiles, and base flood elevations (BFEs) reflect the new datum values. To compare structure and ground elevations to 1-percent annual chance flood elevations shown in the FIS and on the FIRM, the subject structure and ground elevations must be referenced to the new datum values. As noted above, the elevations shown in the FIS report and on the FIRM for Jefferson County are referenced to NAVD 88. Ground, structure, and flood elevations may be compared and/or referenced to NGVD 29 by applying a standard conversion factor. The conversion factor to NGVD 29 is + 0.68. The conversion between the datums may be expressed as an equation:
NGVD 29 = NAVD 88 + 0.68 feet
The BFEs shown on the FIRM represent whole-foot rounded values. For example, a BFE of 102.4 will appear as 102 on the FIRM and 102.6 will appear as 103. Therefore, users that wish to convert the elevations in the FIS to NGVD 29 should apply the stated conversion factor(s) to elevations shown on the Flood Profiles and supporting data tables in the FIS report, which are shown at a minimum to the nearest 0.1 foot.
26
For more information on NAVD 88, see Converting the National Flood Insurance Program to the North American Vertical Datum of 1988, FEMA Publication FIA-20/June 1992, or contact the Vertical Network Branch, National Geodetic Survey, Coast and Geodetic Survey, National Oceanic and Atmospheric Administration, Rockville, Maryland 20910 (Internet address http://www.ngs.noaa.gov).
4.0 FLOODPLAIN MANAGEMENT APPLICATIONS The NFIP encourages State and local governments to adopt sound floodplain management
programs. To assist in this endeavor, each FIS provides 1-percent annual chance floodplain data, which may include a combination of the following: 10-, 2-, 1-, and 0.2-percent annual chance flood elevations; delineations of the 1- and 0.2-percent annual chance floodplains; and 1-percent annual chance floodway. This information is presented on the FIRM and in many components of the FIS, including Flood Profiles, Floodway Data tables, and Summary of Stillwater Elevation tables. Users should reference the data presented in the FIS as well as additional information that may be available at the local community map repository before making flood elevation and/or floodplain boundary determinations.
4.1 Floodplain Boundaries To provide a national standard without regional discrimination, the 1-percent
annual chance flood has been adopted by FEMA as the base flood for floodplain management purposes. The 0.2-percent annual chance flood is employed to indicate additional areas of flood risk in the county. For the streams studied in detail, the 1- and 0.2-percent annual chance floodplain boundaries have been delineated using the flood elevations determined at each cross section.
LiDAR data is remotely sensed high resolution elevation data collected by an
airborne collection platform. The LiDAR data used to delineate floodplain boundaries for the countywide analysis was collected from two separate projects. The first project collected LiDAR data from Feb 22, 2007 to March 13, 2007 for the northern portion of the county. The average point spacing for this data is 0.7 m and vertical accuracy is 11.12 cm RMSEz. The second project collected LiDAR from July 18, 2007 to July 20, 2007 for the southern portion of the county. The average point spacing for this data is 0.7 m and vertical accuracy is 9.45 cm RMSEz.
Additionally, for multiple ponding/wetland areas in the southern portion of the
county, the approximate 1% annual chance floodplain boundary delineation was taken from the effective FIRM for the unincorporated areas of Jefferson County (FEMA, 1991). This delineation was supplemented with digital wetland data provided by the Northwest Florida Water Management District, dated October 14, 2008.
The 1- and 0.2-percent annual chance floodplain boundaries are shown on the
FIRM (Exhibit 2). On this map, the 1-percent annual chance floodplain boundary

27
corresponds to the boundary of the areas of special flood hazards (Zones A, VE and AE), and the 0.2-percent annual chance floodplain boundary corresponds to the boundary of areas of moderate flood hazards. In cases where the 1- and 0.2-percent annual chance floodplain boundaries are close together, only the 1-percent annual chance floodplain boundary has been shown. Small areas within the floodplain boundaries may lie above the flood elevations but cannot be shown due to limitations of the map scale and/or lack of detailed topographic data.
In areas where a wave height analysis was performed, the A and V zones were
divided into whole-foot elevation zones based on the average wave crest elevation in that zone. Where the map scale did not permit delineating zones at 1 foot intervals, larger increments were used.
For the streams studied by approximate methods, only the 1-percent annual chance
floodplain boundary is shown on the FIRM (Exhibit 2).
4.2 Floodways Encroachment on floodplains, such as structures and fill, reduces flood-carrying
capacity, increases flood heights and velocities, and increases flood hazards in areas beyond the encroachment itself. One aspect of floodplain management involves balancing the economic gain from floodplain development against the resulting increase in flood hazard. For purposes of the NFIP, a floodway is used as a tool to assist local communities in this aspect of floodplain management. Under this concept, the area of the 1-percent annual chance floodplain is divided into a floodway and a floodway fringe. The floodway is the channel of a stream, plus any adjacent floodplain areas, that must be kept free of encroachment so that the 1-percent annual chance flood can be carried without substantial increases in flood heights. Minimum federal standards limit such increases to 1.0 foot, provided that hazardous velocities are not produced. The floodways in this FIS are presented to local agencies as minimum standards that can be adopted directly or that can be used as a basis for additional floodway studies.
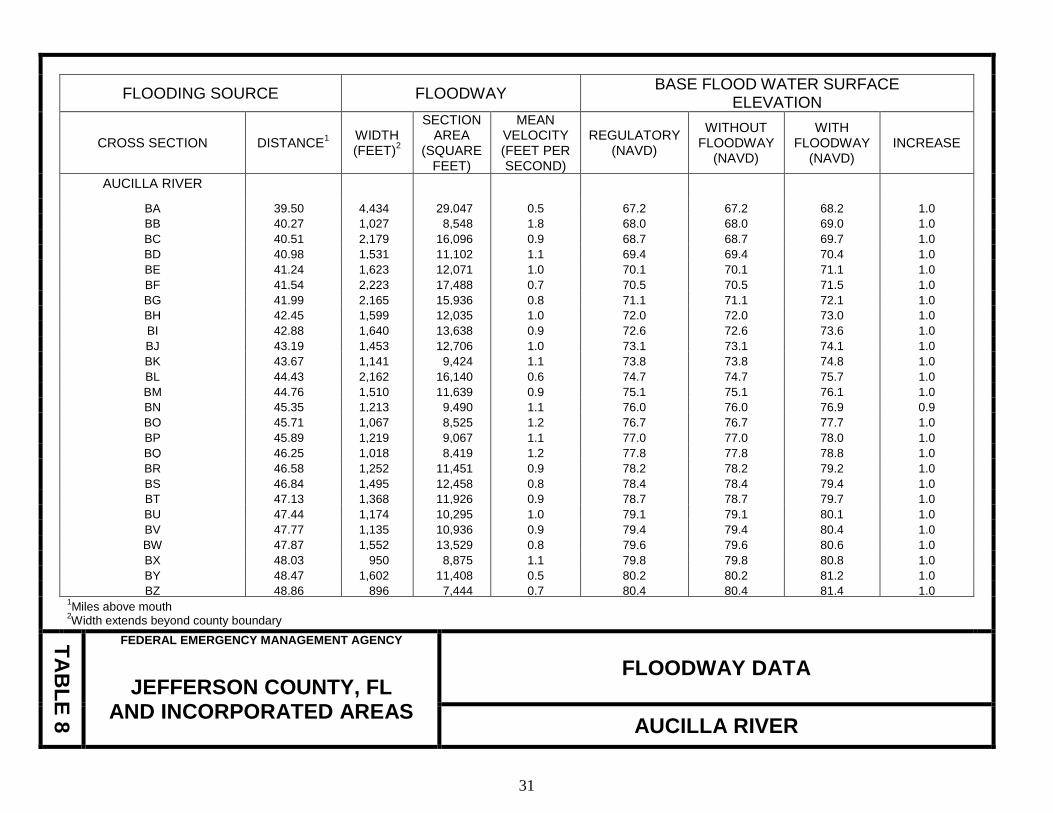
The floodways presented in this FIS were computed for certain stream segments on
the basis of equal conveyance reduction from each side of the floodplain. Floodway widths were computed at cross sections. Between cross sections, the
floodway boundaries were interpolated. The results of the floodway computations are tabulated for selected cross sections (Table 8). The computed floodways are shown on the FIRM (Exhibit 2). In cases where the floodway and 1-percent annual chance floodplain boundaries are either close together or collinear, only the floodway boundary is shown.
Portions of the floodway for the Aucilla River extend beyond the county boundary.
No floodways were computed for Beasley, Ward, Wolf and Raysor Creeks or for the streams studied in limited detail.

28
Near the mouths of streams studied in detail, floodway computations are made without regard to flood elevations on the receiving water body. Therefore, "Without Floodway" elevations presented in Table 8 for certain downstream cross sections of the Aucilla River are lower than the regulatory flood elevations in that area, which must take into account the 1-percent annual chance flooding due to backwater from other sources.
Encroachment into areas subject to inundation by floodwaters having hazardous
velocities aggravates the risk of flood damage, and heightens potential flood hazards by further increasing velocities. A listing of stream velocities at selected cross sections is provided in Table 8, "Floodway Data." In order to reduce the risk of property damage in areas where the stream velocities are high, the community may wish to restrict development in areas outside the floodway.

29
FLOODING SOURCE FLOODWAY
BASE FLOOD WATER SURFACE ELEVATION
CROSS SECTION DISTANCE1 WIDTH
(FEET)2
SECTION AREA
(SQUARE FEET)
MEAN VELOCITY (FEET PER SECOND)
REGULATORY (NAVD)
WITHOUT FLOODWAY
(NAVD)
WITH FLOODWAY
(NAVD) INCREASE
AUCILLA RIVER
A 5.18 3,513 24,114 0.8 15.0 8.73
9.7 1.0 B 5.42 4,752 26,960 0.7 15.0 8.9
3 9.9 1.0
C 5.73 4,954 26,411 0.7 14.0 9.23
10.2 1.0 D 5.95 4,119 21,768 0.9 14.0 9.4
3 10.4 1.0
E 6.34 4,632 23,812 0.2 14.0 9.53
10.5 1.0 F 8.60 4,500 7,991 0.5 13.0 9.9
3 10.8 0.9
G 12.63 1,974 4,395 0.9 17.7 17.7 18.7 1.0 H 13.19 1,999 2,905 2.1 20.7 20.7 21.6 0.9 I 14.23 1,863 8,810 0.9 23.6 23.6 24.5 0.9 J 14.35 1,436 8,828 0.9 23.7 23.7 24.6 0.9 K 14.62 764 5,746 1.5 24.1 24.1 25.0 0.9 L 15.03 2,296 10,842 0.9 24.7 24.7 25.6 0.9 M 15.25 2,106 11,072 0.9 25.0 25.0 25.9 0.9 N 15.52 2,115 9,719 1.1 25.4 25.4 26.3 0.9 O 16.43 2,141 10,773 1.1 27.3 27.3 28.2 0.9 P 16.97 1,960 11,164 1.2 28.5 28.5 29.5 1.0 Q 17.39 3,318 15,799 0.9 29.4 29.4 30.4 1.0 R 17.95 4,850 23,239 0.6 30.1 30.1 31.1 1.0 S 18.35 3,721 15,095 1.0 30.9 30.9 31.9 1.0 T 18.74 2,106 11,326 1.3 32.2 32.2 33.2 1.0 U 19.38 3,037 16,587 0.9 33.6 33.6 34.6 1.0 V 19.77 3,999 16,495 0.9 34.3 34.3 35.3 1.0 W 20.08 2,740 13,514 1.1 34.9 34.9 35.9 1.0 X 20.32 2,707 14,351 1.0 35.4 35.4 36.4 1.0 Y 20.59 2,192 12,159 1.2 36.0 36.0 37.0 1.0 Z 21.88 3,069 15,093 1.0 39.2 39.2 40.2 1.0
1Miles above mouth
2Width extends beyond county boundary
3Elevations computed without consideration of storm surge effects from Gulf of Mexico
TA
BL
E 8
FEDERAL EMERGENCY MANAGEMENT AGENCY
JEFFERSON COUNTY, FL AND INCORPORATED AREAS
FLOODWAY DATA
AUCILLA RIVER

30
FLOODING SOURCE FLOODWAY BASE FLOOD WATER SURFACE
ELEVATION
CROSS SECTION DISTANCE1 WIDTH
(FEET)2
SECTION AREA
(SQUARE FEET)
MEAN VELOCITY (FEET PER SECOND)
REGULATORY (NAVD)
WITHOUT FLOODWAY
(NAVD)
WITH FLOODWAY
(NAVD) INCREASE
AUCILLA RIVER
AA 22.46 3,715 14,319 1.0 40.4 40.4 41.4 1.0 AB 23.23 4,076 23,880 0.6 41.3 41.3 42.3 1.0 AC 25.20 2,610 20,436 0.7 44.7 44.7 45.6 0.9 AD 25.81 2,117 14,651 1.0 45.4 45.4 46.3 0.9 AE 26.80 2,006 12,333 1.2 47.4 47.4 48.4 1.0 AF 27.47 1,755 13,359 1.1 49.1 49.1 50.1 1.0 AG 28.11 3,800 23,711 0.6 49.7 49.7 50.7 1.0 AH 28.48 3,305 19,630 0.8 49.9 49.9 50.9 1.0 AI 29.36 2,773 17,020 0.9 50.4 50.4 51.4 1.0 AJ 29.95 1,517 11,135 1.3 51.3 51.3 52.3 1.0 AK 30.48 829 7,075 2.1 52.8 52.8 53.8 1.0 AL 30.75 1,767 14,857 1.0 53.6 53.6 54.6 1.0 AM 31.42 1,644 13,292 1.1 54.8 54.8 55.8 1.0 AN 31.70 767 6,810 2.2 55.8 55.8 56.8 1.0 AO 32.34 1,177 11,883 1.3 58.0 58.0 59.0 1.0 AP 32.57 751 8,245 1.8 58.5 58.5 59.5 1.0 AQ 32.81 1,108 12,898 1.2 59.0 59.0 60.0 1.0 AR 33.33 1,362 14,022 1.1 59.5 59.5 60.5 1.0 AS 33.61 1,948 20,240 0.7 59.8 59.8 60.8 1.0 AT 33.97 2,028 18,179 0.8 61.2 61.2 62.2 1.0 AU 34.81 1,955 19,530 0.8 62.0 62.0 63.0 1.0 AV 36.18 1,504 13,292 1.1 63.3 63.3 64.3 1.0 AW 37.21 1,098 10,218 1.5 65.0 65.0 66.0 1.0 AX 37.73 960 10,405 1.4 66.5 66.5 67.5 1.0 AY 38.53 3,726 31,686 0.5 66.9 66.9 67.9 1.0 AZ 39.15 2,905 27,146 0.6 67.1 67.1 68.1 1.0
1Miles above mouth
2Width extends beyond county boundary
TA
BL
E 8
FEDERAL EMERGENCY MANAGEMENT AGENCY
JEFFERSON COUNTY, FL AND INCORPORATED AREAS
FLOODWAY DATA
AUCILLA RIVER
31
FLOODING SOURCE FLOODWAY BASE FLOOD WATER SURFACE
ELEVATION
CROSS SECTION DISTANCE1 WIDTH
(FEET)2
SECTION AREA
(SQUARE FEET)
MEAN VELOCITY (FEET PER SECOND)
REGULATORY (NAVD)
WITHOUT FLOODWAY
(NAVD)
WITH FLOODWAY
(NAVD) INCREASE
AUCILLA RIVER
BA 39.50 4,434 29,047 0.5 67.2 67.2 68.2 1.0 BB 40.27 1,027 8,548 1.8 68.0 68.0 69.0 1.0 BC 40.51 2,179 16,096 0.9 68.7 68.7 69.7 1.0 BD 40.98 1,531 11,102 1.1 69.4 69.4 70.4 1.0 BE 41.24 1,623 12,071 1.0 70.1 70.1 71.1 1.0 BF 41.54 2,223 17,488 0.7 70.5 70.5 71.5 1.0 BG 41.99 2,165 15,936 0.8 71.1 71.1 72.1 1.0 BH 42.45 1,599 12,035 1.0 72.0 72.0 73.0 1.0 BI 42.88 1,640 13,638 0.9 72.6 72.6 73.6 1.0 BJ 43.19 1,453 12,706 1.0 73.1 73.1 74.1 1.0 BK 43.67 1,141 9,424 1.1 73.8 73.8 74.8 1.0 BL 44.43 2,162 16,140 0.6 74.7 74.7 75.7 1.0 BM 44.76 1,510 11,639 0.9 75.1 75.1 76.1 1.0 BN 45.35 1,213 9,490 1.1 76.0 76.0 76.9 0.9 BO 45.71 1,067 8,525 1.2 76.7 76.7 77.7 1.0 BP 45.89 1,219 9,067 1.1 77.0 77.0 78.0 1.0 BQ 46.25 1,018 8,419 1.2 77.8 77.8 78.8 1.0 BR 46.58 1,252 11,451 0.9 78.2 78.2 79.2 1.0 BS 46.84 1,495 12,458 0.8 78.4 78.4 79.4 1.0 BT 47.13 1,368 11,926 0.9 78.7 78.7 79.7 1.0 BU 47.44 1,174 10,295 1.0 79.1 79.1 80.1 1.0 BV 47.77 1,135 10,936 0.9 79.4 79.4 80.4 1.0 BW 47.87 1,552 13,529 0.8 79.6 79.6 80.6 1.0 BX 48.03 950 8,875 1.1 79.8 79.8 80.8 1.0 BY 48.47 1,602 11,408 0.5 80.2 80.2 81.2 1.0 BZ 48.86 896 7,444 0.7 80.4 80.4 81.4 1.0
1Miles above mouth
2Width extends beyond county boundary
TA
BL
E 8
FEDERAL EMERGENCY MANAGEMENT AGENCY
JEFFERSON COUNTY, FL AND INCORPORATED AREAS
FLOODWAY DATA
AUCILLA RIVER

32
FLOODING SOURCE FLOODWAY BASE FLOOD WATER SURFACE
ELEVATION
CROSS SECTION DISTANCE1 WIDTH
(FEET)
SECTION AREA
(SQUARE FEET)
MEAN VELOCITY (FEET PER SECOND)
REGULATORY (NAVD)
WITHOUT FLOODWAY
(NAVD)
WITH FLOODWAY
(NAVD) INCREASE
AUCILLA RIVER
CA 49.32 6192 4,959 1.1 81.2 81.2 82.1 0.9
CB 49.53 1,3822 8,659 0.6 81.4 81.4 82.3 0.9
CC 49.63 1,5142 11,647 0.5 81.4 81.4 82.3 0.9
CD 49.77 2,5402 19,754 0.3 81.5 81.5 82.4 0.9
CE 50.05 1,8732 14,645 0.4 81.6 81.6 82.5 0.9
CF 50.43 2,5812 18,858 0.3 81.6 81.6 82.5 0.9
CG 50.78 2,8232 19,341 0.3 81.7 81.7 82.6 0.9
CH 51.20 2,7152 15,288 0.4 81.8 81.8 82.7 0.9
CI 51.56 1,9012 12,403 0.4 81.9 81.9 82.8 0.9
CJ 51.88 1,421 974 0.6 82.0 82.0 82.9 0.9 CK 52.24 779 5,622 1.0 82.4 82.4 83.3 0.9 CL 52.59 1,182 8,417 0.6 82.7 82.7 83.7 1.0 CM 53.29 1,508 10,977 0.5 83.1 83.1 84.1 1.0 CN 53.75 2,781 15,097 0.4 83.3 83.3 84.3 1.0 CO 54.07 2,802 16,407 0.3 83.4 83.4 84.4 1.0 CP 54.45 1,612 10,079 0.5 83.6 83.6 84.6 1.0 CQ 54.98 1,920 9,701 0.6 84.0 84.0 85.0 1.0 CR 55.49 2,597 12,272 0.4 84.5 84.5 85.5 1.0 CS 55.88 2,437 14,248 0.4 84.7 84.7 85.7 1.0 CT 56.07 2,399 12,184 0.4 84.7 84.7 85.7 1.0 CU 56.29 2,536 13,019 0.4 84.8 84.8 85.8 1.0 CV 56.90 2,415 13,517 0.4 85.0 85.0 86.0 1.0 1
Miles above mouth 2Width extends beyond county boundary
TA
BL
E 8
FEDERAL EMERGENCY MANAGEMENT AGENCY
JEFFERSON COUNTY, FL AND INCORPORATED AREAS
FLOODWAY DATA
AUCILLA RIVER

33
The area between the floodway and 1-percent annual chance floodplain boundaries is termed the floodway fringe. The floodway fringe encompasses the portion of the floodplain that could be completely obstructed without increasing the water-surface elevation of the 1-percent annual chance flood by more than 1.0 foot at any point. Typical relationships between the floodway and the floodway fringe and their significance to floodplain development are shown in Figure 3.
Figure 3: Floodway Schematic

34
5.0 INSURANCE APPLICATIONS For flood insurance rating purposes, flood insurance zone designations are assigned to a
community based on the results of the engineering analyses. The zones are as follows: Zone A Zone A is the flood insurance rate zone that corresponds to the 1-percent annual
chance floodplains that are determined in the FIS by approximate methods. Because detailed hydraulic analyses are not performed for such areas, no base flood elevations or depths are shown within this zone.
Zone AE Zone AE is the flood insurance rate zone that corresponds to the 1-percent annual
chance floodplains that are determined in the FIS by detailed methods. In most instances, whole-foot base flood elevations derived from the detailed hydraulic analyses are shown at selected intervals within this zone.
Zone AH Zone AH is the flood insurance rate zone that corresponds to the areas of 1-percent
annual chance shallow flooding (usually areas of ponding) where average depths are between 1 and 3 feet. Whole-foot base flood elevations derived from the detailed hydraulic analyses are shown at selected intervals within this zone.
Zone AO Zone AO is the flood insurance rate zone that corresponds to the areas of 1-percent
annual chance shallow flooding (usually sheet flow on sloping terrain) where average depths are between 1 and 3 feet. Average whole-foot depths derived from the detailed hydraulic analyses are shown within this zone.
Zone AR
Area of special flood hazard formerly protected from the 1-percent annual chance flood event by a flood control system that was subsequently decertified. Zone AR indicates that the former flood control system is being restored to provide protection from the 1-percent annual chance or greater flood event.
Zone A99 Zone A99 is the flood insurance rate zone that corresponds to areas of the 1-percent
annual chance floodplain that will be protected by a Federal flood protection system where construction has reached specified statutory milestones. No base flood elevations or depths are shown within this zone.
Zone V

35
Zone V is the flood insurance rate zone that corresponds to the 1-percent annual chance coastal floodplains that have additional hazards associated with storm waves. Because approximate hydraulic analyses are performed for such areas, no base flood elevations are shown within this zone.
Zone VE Zone VE is the flood insurance rate zone that corresponds to the 1-percent annual
chance coastal floodplains that have additional hazards associated with storm waves. Whole-foot base flood elevations derived from the detailed hydraulic analyses are shown at selected intervals within this zone.
Zone X Zone X is the flood insurance rate zone that corresponds to areas outside the 0.2-
percent annual chance floodplain, areas within the 0.2-percent annual chance floodplain, and to areas of 1-percent annual chance flooding where average depths are less than 1 foot, areas of 1-percent annual chance flooding where the contributing drainage area is less than 1 square mile, and areas protected from the 1-percent annual chance flood by levees. No base flood elevations or depths are shown within this zone.
Zone D Zone D is the flood insurance rate zone that corresponds to unstudied areas where
flood hazards are undetermined, but possible. 6.0 FLOOD INSURANCE RATE MAP The FIRM is designed for flood insurance and floodplain management applications. For flood insurance applications, the map designates flood insurance rate zones as
described in Section 5.0 and, in the 1-percent annual chance floodplains that were studied by detailed methods, shows selected whole-foot base flood elevations or average depths. Insurance agents use the zones and base flood elevations in conjunction with information on structures and their contents to assign premium rates for flood insurance policies.
For floodplain management applications, the map shows by tints, screens, and symbols, the
1- and 0.2-percent annual chance floodplains. Floodways and the locations of selected cross sections used in the hydraulic analyses and floodway computations are shown where applicable.
The current FIRM presents flooding information for the entire geographic area of Jefferson
County. Previously, separate FIRMs were prepared for each identified flood-prone incorporated community and the unincorporated areas of the county. Historical data relating to the maps prepared for each community are presented in Table 9, "Community Map History."

36
7.0 OTHER STUDIES Information pertaining to revised and unrevised flood hazards for the unincorporated and
incorporated areas of Jefferson County has been compiled into this FIS. Therefore, this FIS supersedes all previously printed FISs and FIRMs for the unincorporated and incorporated areas of Jefferson County.

37
COMMUNITY
NAME
INITIAL
IDENTIFICATION
FLOOD HAZARD
BOUNDARY MAP
REVISIONS DATE
FIRM
EFFECTIVE DATE
FIRM
REVISIONS DATE
Jefferson County
(Unincorporated Areas) December 2, 1977 None July 16, 1991 None
Monticello, City of July 23, 1976 None June 3, 1986 None
TA
BL
E 9
FEDERAL EMERGENCY MANAGEMENT AGENCY
JEFFERSON COUNTY, FL
AND INCORPORATED AREAS
COMMUNITY MAP HISTORY

38
8.0 LOCATION OF DATA
Information concerning the pertinent data used in preparation of this FIS can be obtained by contacting FEMA, Mitigation Division, Koger Center – Rutgers Building, 3003 Chamblee Tucker Road, Atlanta, Georgia 30341.
9.0 BIBLIOGRAPHY AND REFERENCES
Cardone, V. J., Greenwood, C. V., and Greenwood, J. A. (1992). “Unified Program for the Specification of Hurricane Boundary Layer Winds Over Surfaces of Specified Roughness,” Contract Report CERC-92-1, U. S. Army Engineer Waterways Experiment Station, Vicksburg, MS. Federal Emergency Management Agency. (July 16, 1991, Flood Insurance Rate Map; July 16, 1991, Flood Insurance Study report). Flood Insurance Study, Jefferson County, Florida (Unincorporated Areas). Washington, D.C. Federal Emergency Management Agency. (Revised February 1981). Users Manual for Wave Height Analysis. Washington, D.C. Federal Emergency Management Agency. (Revised January 1981). Computer Model for Determining Wave Height Elevations for Flood Insurance Studies. Washington, D.C. Federal Emergency Management Agency. (April 2003). Guidelines and Specifications for Flood Hazard Mapping Partners. Appendix D: Guidance for Coastal Flooding Analysis and Mapping. Washington, D.C. Federal Emergency Management Agency. (August 2005). Procedure Memorandum #37, Protocol for Atlantic and Gulf Coast Coastal Flood Insurance Studies in FY05. Washington, D.C. Federal Emergency Management Agency. (February 2007). Atlantic Ocean and Gulf of Mexico Coastal Guidelines update, Final Draft. Washington, D.C. Hagen, S.C., A. Zundel, and S. Kojima (2006), “Automatic, Unstructured Mesh Generation for Tidal Calculations in a Large Domain”, International Journal of Computational Fluid Dynamics, 20 (8), 593-608. Luettich, R.A., J.J. Westerink, and N.W. Scheffner. (1992). “ADCIRC: An Advanced Three-dimensional Circulation Model for Shelves, Coasts and Estuaries, Report 1: Theory and Methodology of ADCIRC-2DDI and ADCIRC-3DL.” Tech. Rep. DRP-92-6, U.S. Army Corps of Engineers. Available at: ERDC Vicksburg (WES), U.S. Army Engineer Waterways Experiment Station (WES), ATTN: ERDC-ITL-K, 3909 Halls Ferry Road, Vicksburg, Mississippi, 39180-6199.
Russell, L. R. (1968). Probability Distribution for Texas Gulf Coast Hurricane Effects of Engineering Interest. Ph.D. Thesis, Stanford University.
Suwannee River Water Management District. (1981). “Interviews with Residents and Department of Transportation Officials.” Terry Burnson.

39
University of Florida, Bureau of Economic and Business Research. (1986). Florida Statistical Abstract. U.S. Army Corps of Engineers, Hydrologic Engineering Center. (April 1984). HEC-2 Water Surface Profiles, Computer Program. Davis, California. U.S. Army Corps of Engineers, Galveston District. (June 1975). Guidelines for Identifying Coastal Hazard Areas. U.S. Department of Agriculture, Soil Conservation Service. (Undated). Aucilla River Watershed Pre-authorization Report (Revised), Jefferson County, Florida, Brooks and Thomas Counties, Georgia. U.S. Department of Commerce, Bureau of the Census. (2010). 2010 Census of Population. Washington, D.C. U.S. Department of the Interior, Geological Survey, Interagency Advisory Committee on Water Data, Office of Water Data Coordination, Hydrology Subcommittee. (September 1981). Bulletin No. 17B: Guidelines for Determining Flood Flow Frequency. U.S. Department of the Interior, Geological Survey. (1967). Roughness Characteristics of Natural Channels. Washington, D.C. U.S. Department of the Interior, Geological Survey. (1954–1956; 1962–1963; 1974; 1981–1982). 7.5 Minute Series Topographic Maps, Scale 1:24000, contour intervals of 5 and 10 feet: Ashville, Florida, 1962; Grooverville, Georgia-Florida; 1956; Baden, Georgia-Florida, 1956, photorevised 1974; Hamburg, Florida, 1962; Monticello NE, Georgia-Florida, 1956; Metcalf, Georgia-Florida; 1956; Waukeenan Florida, 1955; Lake Miccosukee, Florida, 1963; Miccosukee NE, Florida-Georgia, 1982; Lloyd, Florida, 1982; Cody, Florida, 1981; Wacissa, Florida, 1955; Monticello, Florida; 1963; Lamont, Florida, 1955; Greenville, Florida, 1954; Lamont SE, Florida, 1955; St. Marks NE, Florida, 1954; Nutall Rise, Florida, 1955; Cobb Rocks, Florida, 1954; Snipe Island, Florida, 1955. U.S. Department of the Interior, Geological Survey. (1982). Water Resources Investigation Report 82-4012, Techniques for Estimating Magnitude and Frequency of Floods on Natural-Flow Streams in Florida. Wayne C. Bridges. U.S. Department of the Interior, Geological Survey. (1993). Water Resources Investigation Report 94-4002, Nationwide Summary of U.S. Geological Survey Regional Regression Equations for Estimating Magnitude and Frequency of Floods for Ungaged Sites. U.S. Department of Transportation, Highway Administration. (April, 1984). Guide for Selecting Manning’s Roughness Coefficients for Nature Channels and Flood Plains. Washington, D.C. Ven T. Chow. (1959). Open-Channel Hydraulics. New York. McGraw-Hill. Woolpert Consultants. (February 1984). Aerial Photographs, Scale 1:9600.

40
Woolpert Consultants. (December 1984). Flood Insurance Study, Aucilla River, Jefferson, Madison and Taylor Counties, Florida. Dayton, Ohio.

���
��� ���
��� ���
�� ��
��� ���
��� ���
��� ���
��� ���
��� ���
��� ��� ��� ��� �� ��� ��� �� ���� ���� ���� ���� ���� ����
���������������������������
�����������������������������������
������������!���"�����!�������!���"
#��������������"�$��������
���������%������������
������%�������
�������������
��%
�
�
�
�
� �
! �
#
&
��������� �
����������
!�����%�����������
��!���
��'��������� ����������
�'��������� ����������
�'��������� ����������
��'��������� ����������
����������
����������������������
�������!���(������������ ���%����
������������"�!���������)��� !���������)�������������!��������

��
��� ���
��� ���
��� ���
��� ���
��� ���
��� ���
�� ��
�� ��
����� ���� ���� ����� ����� ����� ����� ����� ����� ����� ����� ���� ����
� ����������� ���������
��� ���������� ������� ������ ������
� � ���� � � ��!����� � ���� ��!
" �� ����������!�#��������
���������$���� ���� ��
������$����� �
����������� �
��$
�
�
�
� $ % � � � � � &
'
!
( �� ��
�� �� � ��
������ �� ����"�� ��������� )
���� ��������
� ��
���*������������� ������
�*������������� ������
�*������������� ������
��*������������� ������
��� ���� �
������� ��������������
�����
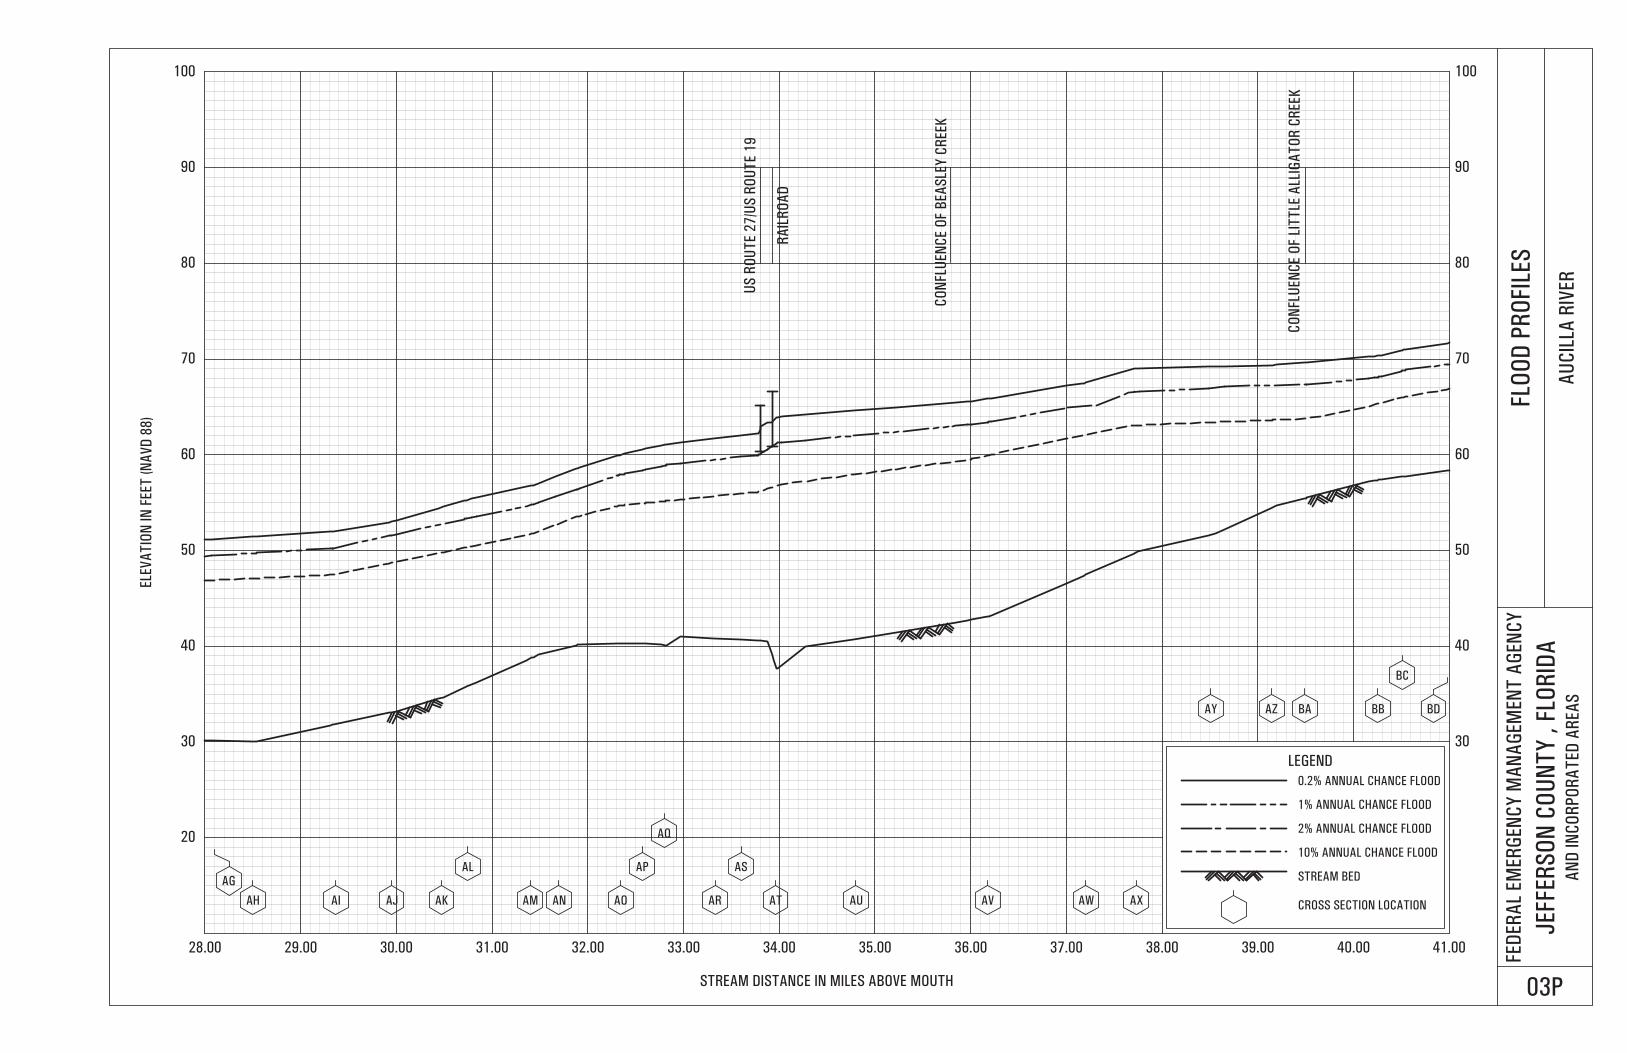
���
��� ���
��� ���
��� ���
��� ���
��� ���
�� ��
�� ��
���� ����
���� ���� ����� ����� ����� ����� ����� ����� ����� ����� ���� ���� ����� �����
� ����������� ���������
��� ���������� ������� ������ ������
� � ���� � � ��!����� � ���� ��!
" �� ����������!�#��������
���������$���� ���� ��
������$����� �
����������� �
��$
�
�� �� �" �%
��
�� �� ��
�$
�&
��
��
�� �� �� �' �(
�! �) �� ��
��
��
������� ���*������� ��
��������
������ �� ����� ��� !��� %
������ �� ��������� ����� ������� %
� ��
���+������������� ������
�+������������� ������
�+������������� ������
��+������������� ������
��� ���� �
������� ��������������

���
��� ���
��� ���
��� ���
��� ���
���� ����
���� ����
��� ���
��� ���
����� ���� ���� ����� ����� ����� ����� ����� ����� ����� ����� ���� ���� �����
� ����������� �����������
��� ���������� ������� ������ ������
� � ���� � � ��!����� � ���� ��!
" �� ����������!�#��������
���������$���� ���� ��
������$����� �
����������� �
��$
� �� � �� ��
�"
�% �� �� �� ��
�$
�& ��
��
��
�� ��
�'
�(
�! �) ��
��
��
��
�
�� �
�� �� �" �% �� �� ��
��� �'��� ������ ������
��� ����� ���
������� ���
������ �� ������!������ %
������ �� ����'������ %
��������
������ �� ���� ����� %
� ��
��*������������� ������
�*������������� ������
*������������� ������
��*������������� ������
��� ���� �
������� ��������������

���
��� ���
��� ���
��� ���
���� ����
���� ����
���� ����
��� ���
��� ���
���� ����� ����� ����� ����� ����� ����� ����� ����� ���� ���� ����� ����� �����
� ����������� �����������
��� ���������� ������� ������ ������
� � ���� � � ��!����� � ���� ��!
" �� ����������!�#��������
���������$���� ���� ��
������$����� �
����������� �
��$
��
�$ �% �� ��
��
��
��
���� ��������
���������� ���� ������!
� ��
���&������������� ������
�&������������� ������
�&������������� ������
��&������������� ������
��� ���� �
������� ��������������

���
���
��� ���
��� ���
��� ���
��� ���
��� ���
��� ���
��� ���
��� ���
� ���� ��� ��� ���� ���� ���� ���� ���� ���� ����� ����� ���� ����
� �������������������������
�����������������������������������
������ ��������� �����������������
!�������������� "�� �����
���������#������������
� ����#���� ��
���� � �����$
��#
� � �
�������������
������������
�����
�%&������ ��������� ���
�&������ ��������� ���
&������ ��������� ���
��&������ ��������� ���
����������
�������������� �������
������������� �������
���$'���������������������� �������

���
���
��� ���
��� ���
��� ���
��� ���
��� ���
��� ���
��� ���
��� ���
��� ���� ���� ���� ���� ���� ���� ����� ���� ����� ���� ����� ����� �����
� �������������������������
�����������������������������������
������ ��������� �����������������
!�������������� "�� �����
���������#������������
� ����#���� ��
���� � �����$
��#
�
��� ����
��� ����
������������� �������
�����
�%�&������ ��������� ���
&������ ��������� ���
�&������ ��������� ���
�&������ ��������� ���
����������
�������������� �������

���
��� ���
��� ���
��� ���
��� ���
��� ���
��� ���
��� ���
��� ���
� ���� ��� ���� ���� ���� ���� ��� ���� ���� ����� ����� ���� �����
��� ����������������� �����
��������������������������� �������
�������������������
����������������
���������������!����
����
���������"������������
������"�������
�����������#
��"
� � �
�
��������"�����
��������������
����������������
��� ��
������
�$�%��������������������
%��������������������
�%��������������������
�%��������������������
����������
����������������������
���#&���������������������������� ��

���
��� ���
��� ���
��� ���
��� ���
��� ���
��� ���
���� ����
���� ����
���� ���� ���� ��� ���� ���� ���� ����� ���� ����� ����� ����� ����� ����
� �������������������������
��������������������������������������������������
������ �����!���������!�������!����
"���������������#�� �����
���������$������������
� ����$���� ��
������� ���� �%�&� ������
��$
� � !
�������������
��� ����
���� ������
�����!�����&����&� ������
�!���
�'(������ ��������� ���
�(������ ��������� ���
(������ ��������� ���
��(������ ��������� ���
����������
�������������� �������
&� ������ �����������

���
��� ���
��� ���
��� ���
��� ���
��� ���
���� ����
���� ����
���� ����
����� ���� ���� ����� ���� ���� ��� ��� ���� ����� ����� ���� ���� �����
��� ����������������� �����
��������������������������� �����������������������
������������ ��������� ������� ����
!���������������"��������
���������#������������
������#�������
$���������
��#
� �
�� �!�������
�����������
�����������������������
�� ���
�%�&��������������������
�&��������������������
�&��������������������
��&��������������������
����������
����������������������

���
���
��� ���
��� ���
��� ���
��� ���
��� ���
���� ����
���� ����
���� ����
� ��� ��� ���� ���� ����� ���� ���� ����� ����� ���� ���
��� ����������������� �����
��������������������������� �������
�������������������
����������������
���������������!����
����
���������"������������
������"�������
#��������$
��"
� �
#������$������
�����������������������
������
�%&��������������������
�&��������������������
&��������������������
��&��������������������
����������
����������������������

���
���
��� ���
��� ���
��� ���
��� ���
��� ���
���� ����
���� ����
���� ����
��� ��� ���� ���� ����� ���� ���� ����� ����� ���� ��� ��� ���� ����
� �������������������������
�����������������������������������
������ ��������� �����������������
!�������������� "�� �����
���������#������������
� ����#���� ��
$��������%
�#
�
��� ����
�������������
������������� �������
�����
�&'������ ��������� ���
�'������ ��������� ���
'������ ��������� ���
��'������ ��������� ���
����������
�������������� �������

APPENDIX A Jefferson County
Limited Detail Studies – Water Surface Elevations

APPENDIX A
JEFFERSON COUNTY LIMITED DETAIL STUDIES – WATER SURFACE ELEVATIONS
A-1
Cross Section Letter1
Stream Station (feet)
Flood Discharge (cfs)
1% Annual Chance Water Surface
Elevation (feet NAVD 88)
Buggs Creek
19,0942 3,110 73.7
E 19,3992 2,980 73.8
20,3992 2,980 73.9
21,3992 2,980 73.9
22,3992 2,980 73.9
F 23,3992 2,980 73.9
24,3992 2,980 73.9
24,6512 2,980 73.9
25,1802 2,980 73.9
25,5182 2,980 73.9
26,3362 2,980 74.0
G 27,3992 2,980 74.0
28,3992 2,980 74.0
29,3992 2,980 74.0
30,3992 2,980 74.1
H 31,3992 2,980 74.1
32,3992 2,980 74.1
33,3992 2,980 74.2
I 33,8722 2,980 74.4
33,9322 2,980 74.6
34,3992 2,980 75.4
J 35,3992 2,980 76.0
36,3992 2,980 76.4
37,1322 2,980 76.6
37,3992 2,330 76.6
K 38,0642 2,040 76.6
39,3992 2,040 76.8
40,3992 2,040 76.9
41,3992 2,040 77.0
L 42,3992 2,040 77.1
43,3992 2,040 77.3
M 44,3992 2,040 78.1

APPENDIX A
JEFFERSON COUNTY LIMITED DETAIL STUDIES – WATER SURFACE ELEVATIONS
A-2
Cross Section Letter1
Stream Station (feet)
Flood Discharge (cfs)
1% Annual Chance Water Surface
Elevation (feet NAVD 88)
Buggs Creek
45,3992 2,040 78.5
46,3992 1,930 79.0
47,3992 1,930 79.4
N 48,3992 1,930 79.9
O 49,3992 1,930 81.8
49,8912 1,930 82.0
P 50,3992 1,930 82.1
50,9232 1,930 86.8
51,1332 1,930 91.0
Q 51,3992 1,930 91.0
51,8532 1,930 91.0
52,4202 1,930 91.0
52,4972 1,930 91.0
52,7982 1,930 91.0
53,3992 1,930 91.0
54,3992 1,930 91.0
R 55,3992 1,930 90.9
56,4212 1,930 94.0
56,7112 1,930 94.3
57,0852 1,930 95.0
S 57,3992 1,930 96.0
T 58,3992 1,930 97.7
59,3992 1,930 99.9
59,7842 1,930 101.6
59,8612 1,930 102.7
U 60,3992 1,930 102.9
V 61,3992 1,930 103.8
62,3992 1,900 107.5
W 62,7112 1,900 108.0
Caney Branch
A 03 3,070 39.4
1,4483 3,070 39.7
1,8353 3,070 41.2
B 2,6323 3,070 41.6

APPENDIX A
JEFFERSON COUNTY LIMITED DETAIL STUDIES – WATER SURFACE ELEVATIONS
A-3
Cross Section Letter1
Stream Station (feet)
Flood Discharge (cfs)
1% Annual Chance Water Surface
Elevation (feet NAVD 88)
Caney Branch
2,9583 3,070 42.7
3,9703 3,070 46.2
5,1673 3,070 47.8
C 5,4783 3,070 48.9
5,8943 3,070 50.1
D 6,4783 3,070 53.6
7,4783 3,070 56.6
E 8,4783 3,070 60.3
9,2773 3,070 61.9
10,0723 3,070 64.0
F 10,6253 3,070 66.5
11,4783 3,070 69.5
12,4783 3,070 72.9
G 13,4693 3,070 76.5
H 13,6903 3,070 83.1
14,4783 3,070 83.1
15,4783 2,730 83.2
I 16,2833 2,730 83.4
J 16,3713 1,770 85.5
16,8723 1,090 85.6
17,4803 1,090 85.7
K 18,4783 1,090 86.1
19,4783 1,090 89.0
20,4783 1,090 94.0
L 21,7223 1,090 97.6
22,1733 1,090 99.5
23,4783 1,090 105.9
M 24,8033 1,090 113.0
25,4783 1,090 115.3
26,0323 1,090 120.1
N 26,4783 1,090 125.8
27,1633 1,090 131.6
27,3223 1,090 134.2
O 28,0993 1,090 142.6

APPENDIX A
JEFFERSON COUNTY LIMITED DETAIL STUDIES – WATER SURFACE ELEVATIONS
A-4
Cross Section Letter1
Stream Station (feet)
Flood Discharge (cfs)
1% Annual Chance Water Surface
Elevation (feet NAVD 88)
Caney Branch
29,4783 1,090 165.5
P 30,4983 1,090 184.1
Lloyd Creek
354 5,150 798
4514 4,410 798
A 1,0134 4,410 798
1,6844 4,410 798
2,6214 4,410 798
3,4244 4,410 798
3,7354 4,410 798
4,6224 4,410 79.5
B 5,0014 4,410 79.8
5,9224 4,410 80.5
6,1224 4,410 80.8
7,1494 4,410 81.7
7,7334 4,410 82.1
9,1114 4,410 83.3
C 10,6734 4,410 84.8
12,1214 4,410 85.9
13,7194 4,410 87.2
15,1224 4,410 88.7
D 16,6224 4,410 90.7
18,0644 2,840 91.6
19,3444 2,830 92.2
20,1454 2,830 92.5
21,0604 2,830 93.0
E 22,6224 2,830 94.1
24,1224 2,830 95.7
25,0214 2,830 96.7
25,6224 2,830 97.4
F 27,1224 2,830 99.3
28,6224 1,650 100.5
30,1224 1,650 102.5
G 31,6224 1,650 104.4

APPENDIX A
JEFFERSON COUNTY LIMITED DETAIL STUDIES – WATER SURFACE ELEVATIONS
A-5
Cross Section Letter1
Stream Station (feet)
Flood Discharge (cfs)
1% Annual Chance Water Surface
Elevation (feet NAVD 88)
Lloyd Creek
32,9814 1,650 105.7
34,6224 1,650 108.4
H 35,5274 1,650 109.8
Miccosukee Lake Drain
A 3315 3,710 71.9
B 1,4745 3,710 72.6
2,4735 3,710 73.0
C 3,1875 3,802 73.4
3,2815 3,802 78.9
3,2975 3,802 78.9
D 3,4175 3,802 79.0
4,2075 3,802 79.0
6,0115 3,152 79.0
6,6565 3,152 79.0
7,2715 3,152 79.0
E 7,6405 3,152 79.0
9,1685 3,152 79.0
9,9715 3,152 79.0
10,4865 3,152 79.0
F 10,9425 3,203 79.0
11,0885 3,203 79.0
11,2525 3,203 79.3
G 11,4305 3,203 79.3
12,0855 3,203 79.3
13,0735 3,203 79.3
13,7675 3,284 79.3
14,9845 3,284 79.3
H 15,5005 3,284 79.3
16,0225 3,284 79.3
16,6405 3,284 79.3
17,2155 3,284 79.3
17,6775 3,265 79.3
18,4185 3,265 79.3
19,1845 3,265 79.3

APPENDIX A
JEFFERSON COUNTY LIMITED DETAIL STUDIES – WATER SURFACE ELEVATIONS
A-6
Cross Section Letter1
Stream Station (feet)
Flood Discharge (cfs)
1% Annual Chance Water Surface
Elevation (feet NAVD 88)
Miccosukee Lake Drain
19,7595 3,201 79.3
I 20,1295 3,201 79.3
20,5685 3,201 79.3
21,3675 3,215 79.4
22,5025 3,215 79.4
23,6615 3,221 79.4
25,0645 3,221 79.4
J 26,3795 3,216 79.4
27,7455 3,216 79.4
29,6955 3,330 79.4
K 31,8855 3,330 79.5
33,4095 3,386 79.6
34,5875 3,386 79.7
L 35,7155 3,386 79.8
Ward Creek
D 30,7366 9,974 92.2
30,9236 9,747 92.2
31,8206 9,747 92.2
E 32,5496 9,775 92.2
33,1356 9,887 92.3
F 34,9276 9,887 92.3
35,8436 10,173 92.3
36,8986 10,173 92.3
G 38,6426 10,335 92.4
40,4756 10,335 92.5
H 41,9236 10,396 92.5
43,2136 10,837 92.5
43,9896 10,837 92.5
I 45,6876 11,041 92.5
46,7696 11,200 92.6
J 47,8306 11,120 92.6
48,5326 10,527 92.6
K 52,5066 10,705 92.6
53,1086 10,552 92.6

APPENDIX A
JEFFERSON COUNTY LIMITED DETAIL STUDIES – WATER SURFACE ELEVATIONS
A-7
Cross Section Letter1
Stream Station (feet)
Flood Discharge (cfs)
1% Annual Chance Water Surface
Elevation (feet NAVD 88)
Ward Creek
54,0236 10,510 92.6
L 55,2456 10,510 92.6
55,8016 10,510 92.6
Wolf Creek
61,4667 2,815 89.0
61,5707 2,815 89.0
62,2257 2,727 89.0
63,0387 2,727 89.0
J 64,4437 2,656 89.0
65,9137 2,370 89.0
66,0737 2,370 89.0
66,8367 2,070 89.0
67,8517 2,070 89.0
68,9967 2,003 89.0
70,7167 2,003 89.0
71,6947 2,003 89.0
K 72,6407 1,979 89.1
72,7447 1,979 89.3
L 73,5257 1,979 89.9
74,4827 1,979 89.9
75,0827 1,736 89.9
75,8517 1,736 89.9
76,4987 1,221 89.9
79,0807 1,221 89.9
79,8117 1,098 89.9
80,9077 1,098 89.9
M 81,3387 1,098 89.9
81,4057 1,098 89.9
N 82,0777 1,000 93.0
O 82,1407 1,000 96.9
82,6507 1,000 96.9
P 83,1217 1,000 96.9
83,3487 528 98.0
83,9507 528 102.5

APPENDIX A
JEFFERSON COUNTY LIMITED DETAIL STUDIES – WATER SURFACE ELEVATIONS
A-8
Cross Section Letter1
Stream Station (feet)
Flood Discharge (cfs)
1% Annual Chance Water Surface
Elevation (feet NAVD 88)
Wolf Creek
84,4557 528 105.4
84,7837 528 107.5
85,2697 528 112.4
Q 85,3377 528 112.6
85,6757 528 113.3
86,2427 354 118.5
86,5847 354 121.0
87,1157 354 125.9
87,5427 354 129.7
R 87,8217 354 133.9
S 87,8967 278 145.0
88,2437 278 145.0
88,7267 278 145.0
89,3257 278 145.0
T 89,8037 278 145.0
90,2897 278 150.9
U 90,5697 364 153.6
V 90,6517 364 157.1
90,7537 364 157.1
91,0907 364 157.1
91,4327 364 157.1
91,7587 364 157.1
W 92,0917 364 157.2
X 92,4987 364 160.6
92,7547 364 166.5
Y 92,8747 364 168.3
92,9307 364 169.4
93,0567 364 169.5
Z 93,2167 364 169.5
Tributary to Wolf Creek
1,1196 705 89.7
A 2,2776 705 92.0
B 2,8416 705 96.5
3,0806 705 96.9

APPENDIX A
JEFFERSON COUNTY LIMITED DETAIL STUDIES – WATER SURFACE ELEVATIONS
A-9
Cross Section Letter1
Stream Station (feet)
Flood Discharge (cfs)
1% Annual Chance Water Surface
Elevation (feet NAVD 88)
Tributary to Wolf Creek
3,5646 705 97.0
C 3,9546 705 97.9
D 4,0306 705 101.8
4,5586 705 101.9
4,9896 705 104.1
5,5056 705 105.5
5,9586 705 107.4
E 6,5186 705 108.6
F 6,5916 705 116.3
7,1946 614 116.4
7,9056 614 117.2
G 8,4756 614 118.6
H 8,6016 614 129.2
9,1356 614 129.2
9,8796 614 129.2
I 10,5446 614 129.3
11,3576 614 131.4
11,8036 614 133.7
12,1076 614 134.8
J 12,5426 614 138.4
K 12,5936 614 141.8
13,0956 614 141.9
13,6326 677 142.1
L 14,1756 677 143.0
14,6186 677 146.5
M 14,6616 677 147.5
14,9936 677 148.3
N 15,2246 677 148.6
O 15,2926 677 150.7
15,5606 677 151.2
15,8796 677 151.3
P 16,1926 677 151.3
16,6636 677 153.5
16,9846 297 155.4

APPENDIX A
JEFFERSON COUNTY LIMITED DETAIL STUDIES – WATER SURFACE ELEVATIONS
A-10
Cross Section Letter1
Stream Station (feet)
Flood Discharge (cfs)
1% Annual Chance Water Surface
Elevation (feet NAVD 88)
Tributary to Wolf Creek
17,4046 297 159.3
17,8236 297 165.0
Q 18,1376 297 169.4
R 18,2426 297 175.7
S 18,6346 297 175.8 1
= This table reflects all modeled cross sections. Some cross sections in this table may not
appear on the map.
2 = Feet above mouth of Beasley Creek.
3 = In feet above 1,623 feet downstream of Tram Road.
4 = In feet above railroad.
5 = In feet above 160 feet upstream of Gamble Road.
6 = In feet above mouth.
7 = In feet above mouth of Raysor Creek.
8 = Elevation includes backwater effects.