Embed Size (px)
DESCRIPTION
Business Diploma Evaluate the marketing mix lecture slides.
Citation preview

BSBMKG507A Interpret market trends and developments
Session 1
© 2012 Innovation and Business Industry Skills Council Ltd.

Purpose of this presentation At the end of this session, you should know how to:
use statistical analysis of market data to interpret market trends and developments
analyse market trends and developments to determine impact on the business
analyse and interpret quantitative and qualitative data to analysis comparative market information
analyse market performance of potential competitors.
© 2012 Innovation and Business Industry Skills Council Ltd.

Group activity – research and discussion
Company annual report for statistical analysis of data:
use the internet to access company annual reports
for example: National Australia Bank (NAB) <http://www.nab.com.au/wps/wcm/connect/ nab/nab/home/About_Us/20/3/>.
© 2012 Innovation and Business Industry Skills Council Ltd.

Activity – research and discussion
WeCare case study:
central tendency
dispersion.
© 2012 Innovation and Business Industry Skills Council Ltd.

Activity – research and discussion
Study statistical analysis – vehicle industry:
Access Federal Chamber of Automotive Industries (FCAI) <http://www.fcai.com.au/sales>.
© 2012 Innovation and Business Industry Skills Council Ltd.
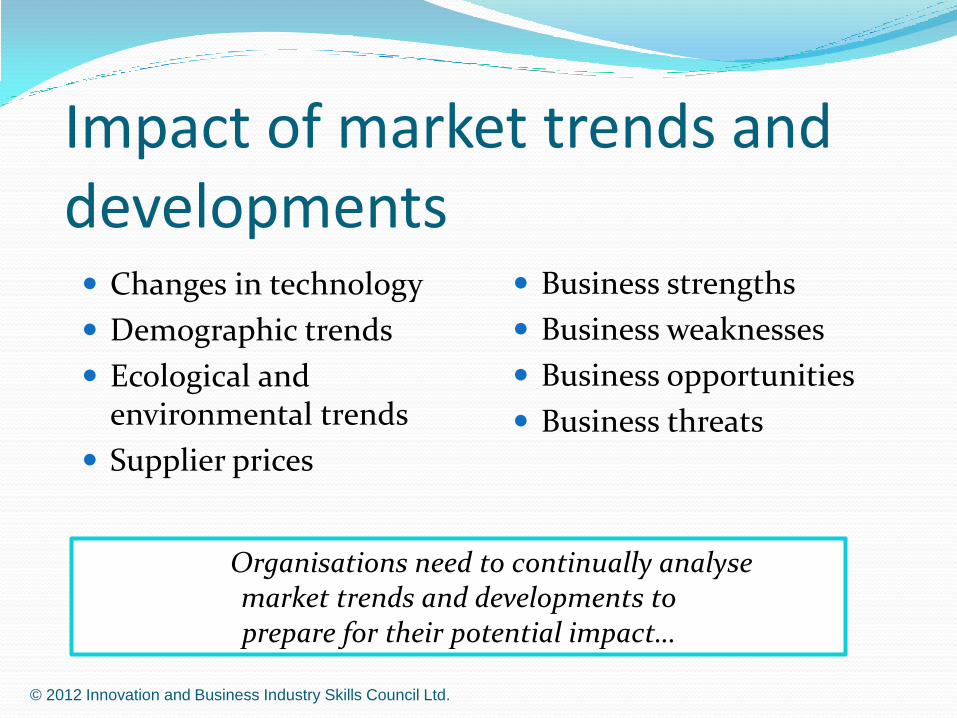
Impact of market trends and developments Changes in technology
Demographic trends
Ecological and environmental trends
Supplier prices
Business strengths
Business weaknesses
Business opportunities
Business threats
Organisations need to continually analyse market trends and developments to prepare for their potential impact…
© 2012 Innovation and Business Industry Skills Council Ltd.

Identify potential opportunities or threats
Analysing the market performance of existing and potential competitors and their products or services, can identify potential opportunities or threats.
SWOT analysis.
Understanding competitors and their performance enables our organisation to stay ahead of the game…
© 2012 Innovation and Business Industry Skills Council Ltd.

Activity – research and discussion
Market trends and developments – vehicle industry
Access Federal Chamber of Automotive Industries (FCAI) <http://www.fcai.com.au/sales>.
© 2012 Innovation and Business Industry Skills Council Ltd.

Comparative market data
Quantitative interpretation of comparative market data includes:
conversion rate of leads to sales
mean, mode, median
average order value
average response rate.
Data analysis and interpretation provide
essential information for organisations to plan strategies for viability and success…
© 2012 Innovation and Business Industry Skills Council Ltd.

Qualitative analysis of comparative market information
Comparative market analysis provides insight into the market.
What are our competitors doing?
How are we positioned within the market?
How do our products and service compare?
Understanding our competitors is important to increase our business strength…
© 2012 Innovation and Business Industry Skills Council Ltd.

Progress check You should now know how to:
use statistical analysis of market data to interpret market trends and developments
analyse market trends and developments to determine impact on the business
analyse and interpret quantitative and qualitative data to analysis comparative market information
analyse market performance of potential competitors.
© 2012 Innovation and Business Industry Skills Council Ltd.

Activity – research and discussion
Data to understand impact of competition: Wecare case study.
Comparative market data – existing and potential customers: Newell Rubbermaid & Tupperware.
© 2012 Innovation and Business Industry Skills Council Ltd.

Discussion
What questions do you have?
© 2012 Innovation and Business Industry Skills Council Ltd.

BSBMKG507A Interpret market trends and developments
Session 2
© 2012 Innovation and Business Industry Skills Council Ltd.

Purpose of this presentation At the end of this session, you should know how to:
analyse performance data to determine success of marketing activities
identify over-performing and under-performing products and services
forecast existing and emerging market needs.
© 2012 Innovation and Business Industry Skills Council Ltd.

Analyse performance data When analysing performance data we need to consider all areas of the business to determine success of marketing activities.
Qualitative data consists of:
interview and observation notes
written documents and reports.
Analysing qualitative data is a subjective process...
© 2012 Innovation and Business Industry Skills Council Ltd.

Redevelop or withdrawal
Indentifying over-performing and under-performing products and services presents valuable information for consideration of:
redevelopment of product or service
withdrawal of product or service.
An organisation needs to offer customers the products and services they expect…
© 2012 Innovation and Business Industry Skills Council Ltd.

Activity – research and discussion McDonald’s: identify underperforming products and services.
Access McDonald’s annual report – 2008.
<http://en.wikipedia.org/wiki/McDonald's>.
© 2012 Innovation and Business Industry Skills Council Ltd.
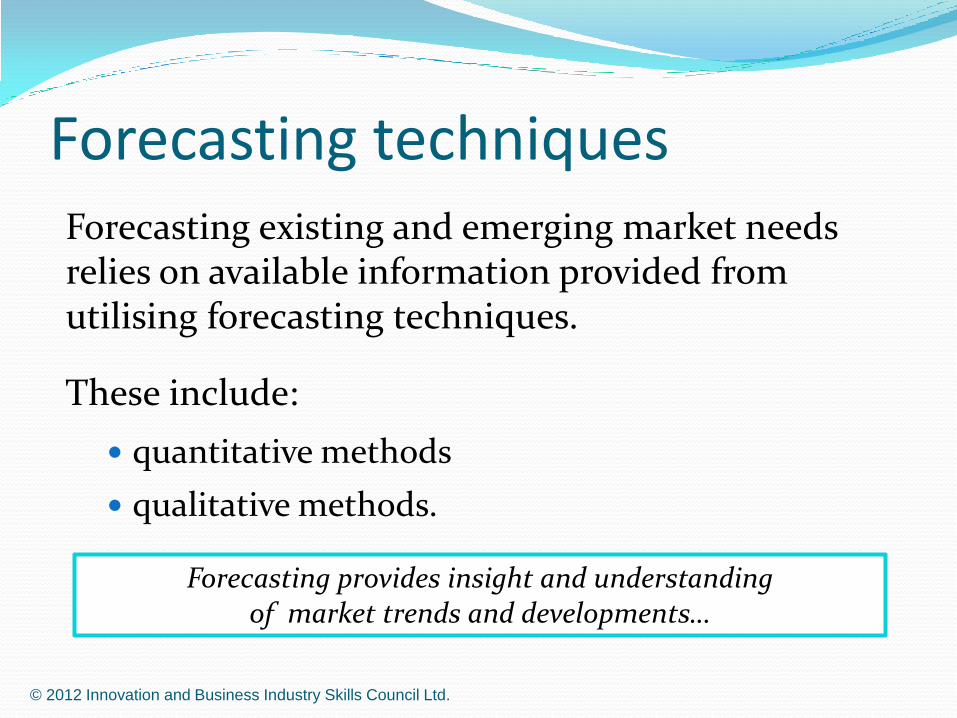
Forecasting techniques Forecasting existing and emerging market needs relies on available information provided from utilising forecasting techniques.
These include:
quantitative methods
qualitative methods.
Forecasting provides insight and understanding
of market trends and developments…
© 2012 Innovation and Business Industry Skills Council Ltd.

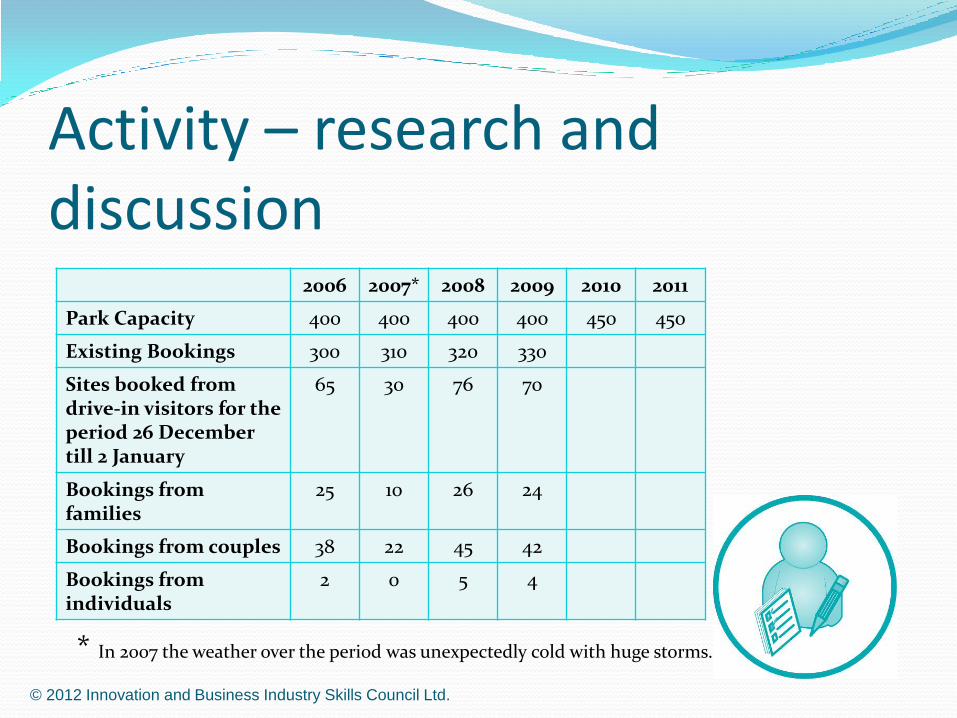
Activity – research and discussion
Forecasting techniques – Seaside Caravan Park:
Assess data supplied.
© 2012 Innovation and Business Industry Skills Council Ltd.
Activity – research and discussion
2006 2007* 2008 2009 2010 2011
Park Capacity 400 400 400 400 450 450
Existing Bookings 300 310 320 330
Sites booked from drive-in visitors for the period 26 December till 2 January
65 30 76 70
Bookings from families
25 10 26 24
Bookings from couples 38 22 45 42
Bookings from individuals
2 0 5 4
* In 2007 the weather over the period was unexpectedly cold with huge storms.
© 2012 Innovation and Business Industry Skills Council Ltd.

Discussion
As a group discuss the content of this session.
What questions do you have?
© 2012 Innovation and Business Industry Skills Council Ltd.

Progress check
You should now know how to:
analyse performance data to determine success of marketing activities
identify over-performing and under-performing products and services
forecast existing and emerging market needs.
© 2012 Innovation and Business Industry Skills Council Ltd.

BSBMKG507A Interpret market trends and developments
Session 3
© 2012 Innovation and Business Industry Skills Council Ltd.

Purpose of this presentation At the end of this session, you should know how to:
prepare, plot and interpret data for visual presentation
assess visual presentation for potential problems and implement corrective action
report on analysis of market data.
© 2012 Innovation and Business Industry Skills Council Ltd.

Interpret data for visual presentation The visual presentation of data needs to ensure your information is easily understood and clearly conveys the results of your analysis.
tables
charts
graphs.
Data needs to be clear and correct; effective visual presentation will ensure the meaning of the data is communicated…
© 2012 Innovation and Business Industry Skills Council Ltd.

Activity – research and discussion
Interpret data:
Access the NAB 2009 annual shareholder report <http://www.nab.com.au/NABGroup/archives/ annual-reports/Shareholder-Review-2009.pdf>.
© 2012 Innovation and Business Industry Skills Council Ltd.

Assess visual presentation It is imperative to assess visual presentation for potential problems and take any necessary corrective action.
Review visual presentation.
Clarify and correct confusing or incorrect visual presentation.
Visual presentation of market data can effectively communicate report conclusions and recommendations…
© 2012 Innovation and Business Industry Skills Council Ltd.

Activity – research and discussion
Good and bad visual presentations.
Research and comment.
© 2012 Innovation and Business Industry Skills Council Ltd.
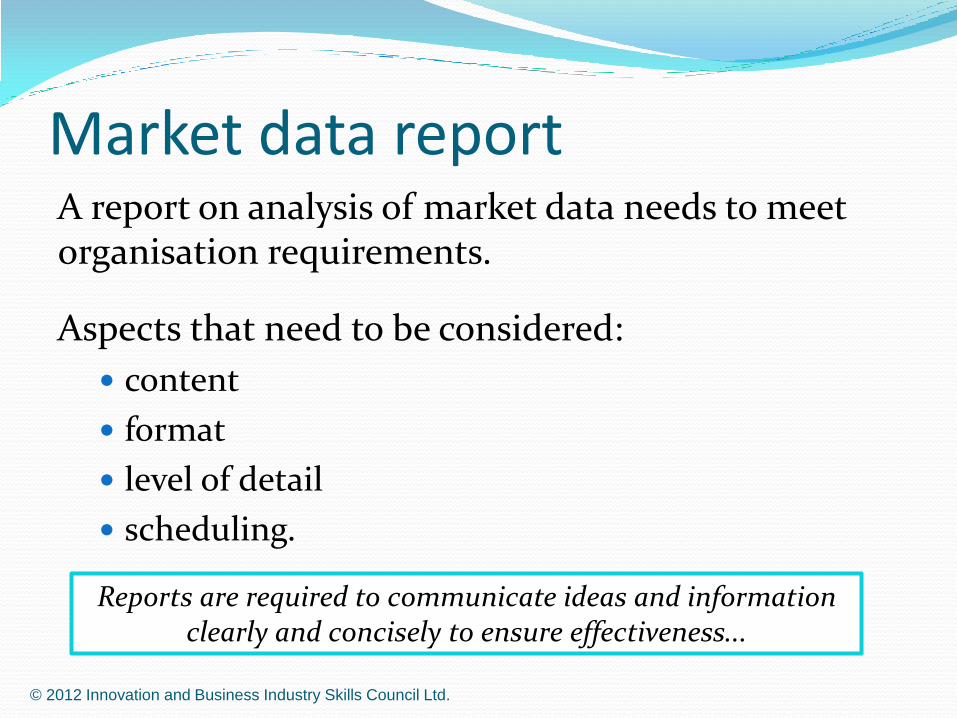
Market data report A report on analysis of market data needs to meet organisation requirements.
Aspects that need to be considered:
content
format
level of detail
scheduling.
Reports are required to communicate ideas and information
clearly and concisely to ensure effectiveness...
© 2012 Innovation and Business Industry Skills Council Ltd.

Activity – research and discussion
Discuss purpose of report.
Report structure – standard business format.
© 2012 Innovation and Business Industry Skills Council Ltd.

Activity – research and discussion
Title Page
Executive Summary
Acknowledgements
Introduction and Terms of Reference
Methodology
Results
Discussion and Analysis
Conclusions
Recommendations
Appendices
© 2012 Innovation and Business Industry Skills Council Ltd.

Discussion
As a group discuss the content of this section
What questions do you have?
© 2012 Innovation and Business Industry Skills Council Ltd.

Progress check You should now know how to:
prepare, plot and interpret data for visual presentation
assess visual presentation for potential problems and implement corrective action
report on analysis of market data.
© 2012 Innovation and Business Industry Skills Council Ltd.