Embed Size (px)
Citation preview

Appendix A8.3
Utilities ES Highways Assessment


Bank Station Capacity Upgrade Project Appendix A8.3 - Utilities ES Highways Assessment
London Underground Limited September 2014 Page 1
Introduction
A8.3.1 This appendix presents an assessment of the impact of general utilities works, including road strengthening at Monument Junction, on the surface transport network. This note describes the assumptions and the method of the assessment undertaken, which is reported in Chapter 8: Transport and Movement of the Environmental Statement.
Description of Proposed Works
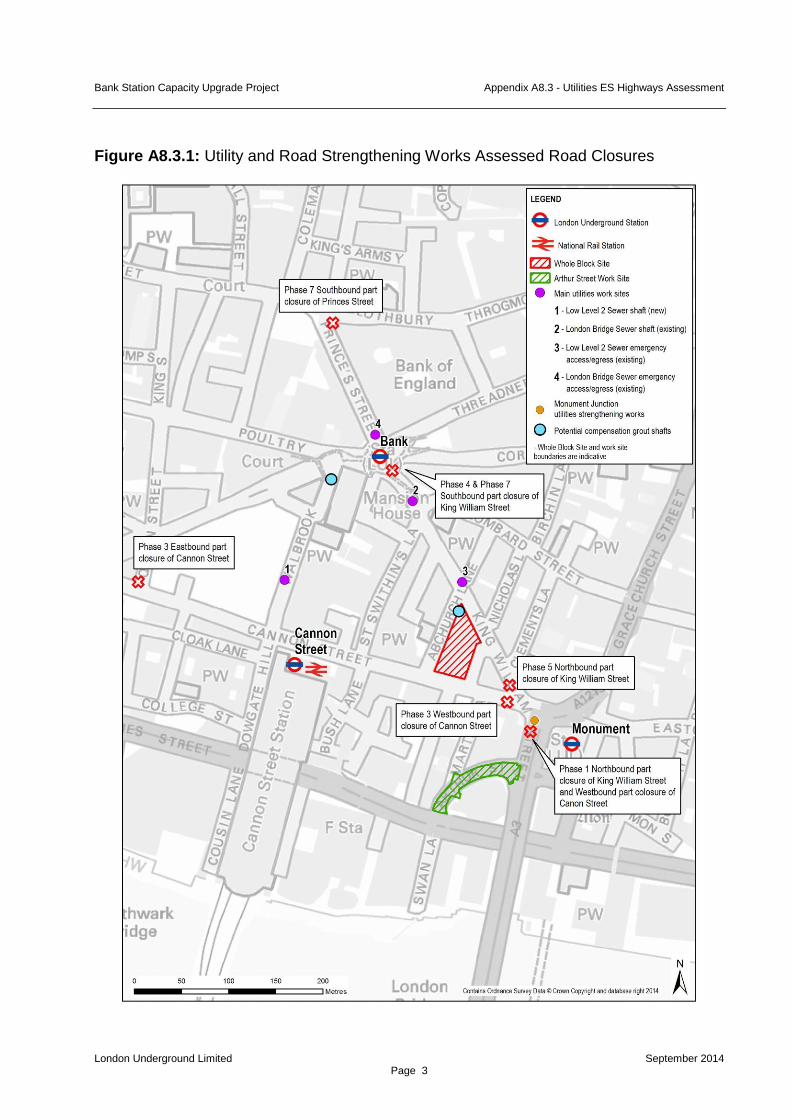
A8.3.2 The broad phasing and programme of utilities strengthening work is shown in Table A8.3.1. This has subsequently been illustrated as the drawing in Figure A8.3.1.
A8.3.3 The durations of all phases will vary, but will individually be longer than 4 weeks (the temporal threshold used to determine significant effects) - typically 3-6 months. The exception to this is for the road strengthening works at Monument Junction (in Phase 1) which is expected to require two weekend closures or 15 night-time closures from 20:00 to 06:00 hours.
Scope, Method & Assumptions
Scope
A8.3.4 The scope of this assessment includes partial closures of the following principal roads only (on the basis that the effects on minor roads will not be significant):
Cannon Street;
Gresham Street;
King William Street; and
Prince’s Street.
A8.3.5 The resulting changes to traffic flows on the wider highways network have been assessed. To supplement this, the impact on the local bus network and on walking and cycling have also been considered.
A8.3.6 As traffic flows are highest during the peak hours on weekdays, these have been assessed quantitatively. To minimise disruption some of the works will be programmed to occur either overnight (from 20:00 to 06:00 hours), or at weekends, when the baseline traffic flows will be much lower, and these are described qualitatively.
A8.3.7 The impacts from the closure of Arthur Street are considered as part of the main construction assessment reported in the Transport Assessment (Appendix A8.1 to the ES) and Chapter 8: Transport and Movement of the ES.
A8.3.8 A quantified assessment of the closures of Nicholas Lane and Abchurch Lane has been provided in the 10 King William Street Over Site Development Transport Assessment (URS, February 2014), which found there to be no significant impacts associated with the closures.

Bank Station Capacity Upgrade Project Appendix A8.3 - Utilities ES Highways Assessment
London Underground Limited September 2014 Page 2
Table A8.3.1: Phases of potential work to inform the assessment
Phase Assets Affected Notes and Road Closure
Required
Phase 1
Arthur Street - All utilities diverted to allow build of shaft. Shaft will provide access to King William Street station for the main tunnel build.
Closure of Arthur Street.
Low Level No 2 Sewer - All utilities diverted to allow build of shaft. Shaft will provide access to sewer.
Closure of Walbrook (currently closed long-term).
Monument Junction - Road strengthening works to protect a BT chamber (telecoms).
Part closure of Cannon Street westbound and King William Street northbound (between Arthur Street and Monument).
Phase 2 Sewer Reline Closure of Nicholas Lane.
Phase 3
Sewer Reline Closure of Abchurch Lane.
UKPN; Gas Main Replacement; Water Main Replacement
Closure of Abchurch Lane.
Gas Main Replacement Eastbound part closure of Cannon Street and Westbound part closure of Cannon Street to occur consecutively.
Phase 4 Access/emergency egress to Low Level No 2 Sewer via manhole on southbound King William Street carriageway
Narrowing of King William Street. Worksite will require suspension of bus stop and cycle lanes, and will block exit on Abchurch Lane onto King William Street and therefore Abchurch Lane (south side) requires a full closure too.
Phase 5
Water Main Replacement/Repair Northbound part closure of King William Street.
Gas Main Replacement/Repair and Water Main Pipe Replacement
Full closure of Nicholas Lane.
Phase 6
Gas: Joint repair/encapsulation Westbound and Eastbound part closure of Gresham Street to occur consecutively.
Gas: Joint repair/encapsulation and Water Main Repair
Queen Victoria Street closure - phased to allow one lane maintained, with one lane closed.
Phase 7 London Bridge Sewer Reline Night time full closure of King William Street and night time Southbound part closure of Prince’s Street to access the Sewer.
Phase 8 Prince’s Street Water Main Replacement Southbound part closure of Prince’s Street.
Bank Station Capacity Upgrade Project Appendix A8.3 - Utilities ES Highways Assessment
London Underground Limited September 2014 Page 3
Figure A8.3.1: Utility and Road Strengthening Works Assessed Road Closures

Bank Station Capacity Upgrade Project Appendix A8.3 - Utilities ES Highways Assessment
London Underground Limited September 2014 Page 4
General Assumptions
A8.3.9 There are a number of instances when there may be an overlap between phases:
King William Street southbound and Gresham Street eastbound and westbound; and
King William Street southbound and Prince’s Street southbound.
A8.3.10 LUL has confirmed that there will be no daytime (week day) two-way closures of any roads considered in this assessment.
A8.3.11 Traffic management assumptions have been devised in response to comments from the City of London Corporation and TfL Surface Transport.
A8.3.12 A westbound diversion of Cannon Street is preferable to an eastbound diversion because it is easier to manage. It is therefore assumed that although works are required to both sides of Cannon Street, eastbound traffic will continue to use this road while a westbound diversion remains in place throughout Phase 3. This will be achieved by directing eastbound traffic onto the westbound side of the carriageway when necessary.
A8.3.13 Similarly a southbound diversion on King William Street is preferable to a northbound diversion, when this can be achieved.
A8.3.14 Shuttle working around utilities works is unlikely to be acceptable because of the risk of blocking back to key junctions such as Cannon Street/ King William Street/ Gracechurch Street.
A8.3.15 Works associated with the road strengthening of A3 King William Street at Monument Junction could be completed over two weekend closures or 15 night-time closures from 20:00 to 06:00 hours. Traffic management options include a contraflow on the southbound carriageway of A3 King William Street or a diversion of all traffic. The preferred approach is night-time closures with the implementation of a contraflow.
A8.3.16 Total closures to footways on individual roads are not anticipated as a result of the proposed works.
Assessed Scenarios
A8.3.17 The phasing of the utilities works therefore generates five scenarios for assessment:
Cannon Street closed westbound;
King William Street southbound;
King William Street southbound closed with the closure of Gresham Street eastbound;
King William Street southbound closed with the closure of Gresham Street westbound; and
King William Street southbound closed with the closure of Prince’s Street southbound.

Bank Station Capacity Upgrade Project Appendix A8.3 - Utilities ES Highways Assessment
London Underground Limited September 2014 Page 5
Assessed Diversion Routes
A8.3.18 The City of London Corporation was approached to establish approved diversion routes for the road closures indicated in Table A8.3.1 and Figure A8.3.1. The routes in Table A8.3.2 were confirmed, which are illustrated in Figure A8.3.2. Based upon the scope of works indicated in Figure A8.3.1 the King William Street and Lothbury diversion is assumed in both directions for Gresham Street.
Table A8.3.2: City of London Approved Diversion Routes
Diversion Route
Cannon Street WB between King William Street & Queen Victoria Street -
King William Street, Lombard Street, Mansion House Street,
Queen Victoria Street, Cannon Street, Friday Street, Queen
Victoria Street & Cannon Street
King William Street SB between Cannon Street & Bank Junction - Mansion House Street, Threadneedle Street, Gracechurch Street & King William Street
King William Street NB between Bank Junction & Cannon Street - King William Street, Gracechurch Street
Gresham Street EB between King St & Lothbury – King Street, Poultry,
Mansion House Street, Prince’s Street & Lothbury
between Wood Street & King Street – Gresham St, Wood
Street, Love Lane, Aldermanbury & Basinghall Street
between St Martins Le Grand & Wood Street – St Martins Le Grand, Newgate Street, Cheapside & Wood Street
Gresham Street WB between Lothbury & King Street – Prince’s Street, Mansion House Street, Poultry & King Street & Moorgate, London Wall, Aldersgate St & Gresham Street
between King Street & St Martins Le Grand – Gresham Street, Moorgate, London Wall, Aldersgate St & Gresham St
Prince’s Street SB between Lothbury & Bank Junction – FOR GENERAL
TRAFFIC – Lothbury, Gresham Street, King Street, Poultry
& Mansion House Street. Please note that buses will have
to be diverted via South Place & Eldon Street

Bank Station Capacity Upgrade Project Appendix A8.3 - Utilities ES Highways Assessment
London Underground Limited September 2014 Page 6
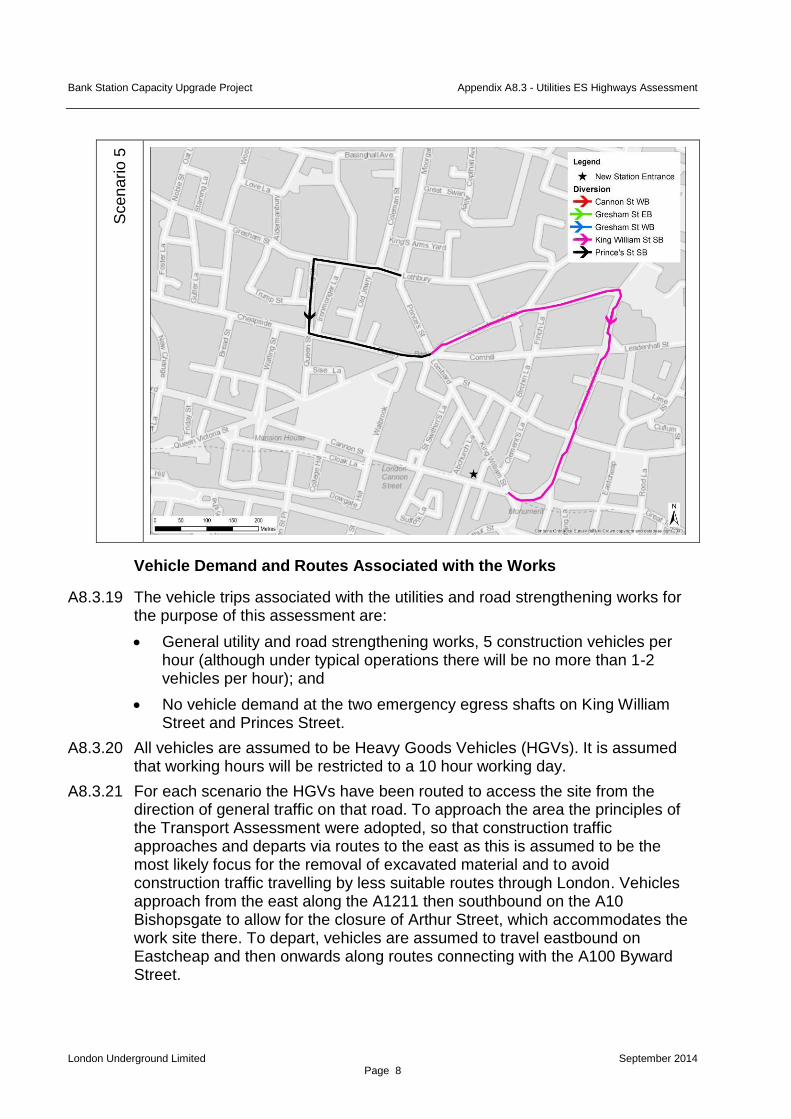
Figure A8.3.2: Summary of Diversion Routes for Scenarios 1-5
Sce
na
rio 1
Sce
na
rio 2

Bank Station Capacity Upgrade Project Appendix A8.3 - Utilities ES Highways Assessment
London Underground Limited September 2014 Page 7
Sce
na
rio 3
Sce
na
rio 4
Bank Station Capacity Upgrade Project Appendix A8.3 - Utilities ES Highways Assessment
London Underground Limited September 2014 Page 8
Sce
na
rio 5
Vehicle Demand and Routes Associated with the Works
A8.3.19 The vehicle trips associated with the utilities and road strengthening works for the purpose of this assessment are:
General utility and road strengthening works, 5 construction vehicles per hour (although under typical operations there will be no more than 1-2 vehicles per hour); and
No vehicle demand at the two emergency egress shafts on King William Street and Princes Street.
A8.3.20 All vehicles are assumed to be Heavy Goods Vehicles (HGVs). It is assumed that working hours will be restricted to a 10 hour working day.
A8.3.21 For each scenario the HGVs have been routed to access the site from the direction of general traffic on that road. To approach the area the principles of the Transport Assessment were adopted, so that construction traffic approaches and departs via routes to the east as this is assumed to be the most likely focus for the removal of excavated material and to avoid construction traffic travelling by less suitable routes through London. Vehicles approach from the east along the A1211 then southbound on the A10 Bishopsgate to allow for the closure of Arthur Street, which accommodates the work site there. To depart, vehicles are assumed to travel eastbound on Eastcheap and then onwards along routes connecting with the A100 Byward Street.

Bank Station Capacity Upgrade Project Appendix A8.3 - Utilities ES Highways Assessment
London Underground Limited September 2014 Page 9
Traffic Data and Background Growth
A8.3.22 Locations of traffic count data used to inform the assessment is provided as Figure A8.3.3 overlaid on the diversion routes described in Table A8.3.2. Sites 3OSD and 1ES were collected in October 2013 to inform the Transport Assessment. Data for all other sites were obtained from TfL from its traffic count database. Data collected for the Transport Assessment cover a 12-hour period of analysis and therefore provides factors to calculate 12-hour flows from the TfL counts. The calculation of 16, 18 and 24 hour flows required for noise and air quality assessments used ATC data to factor up to these periods. The ATCs were collected in October 2013 and are described in more detail in the Transport Assessment (Appendix A8.1 of the ES). Junction throughput for 3OSD was required to factor up TfL counts to 12-hour as they are only available for selected hours of the day compared with 3OSD and 1ES. 3OSD was chosen as the most representative site for factoring because it falls approximately central to counts available from TfL and is located more closely to them than 1ES. Not all diversion routes have complete traffic count data available.
A8.3.23 Consistent with the Transport Assessment it is assumed that there is no growth in background traffic. This assumption is in contrast to the 25 per cent reduction forecast by the Mayor’s Vision for Cycling – Central London Grid to provide a robust assessment.

Bank Station Capacity Upgrade Project Appendix A8.3 - Utilities ES Highways Assessment
London Underground Limited September 2014 Page 10
Figure A8.3.3: Traffic Count Sites Used for the Utilities Assessment
Bank Station Capacity Upgrade Project Appendix A8.3 - Utilities ES Highways Assessment
London Underground Limited September 2014 Page 11
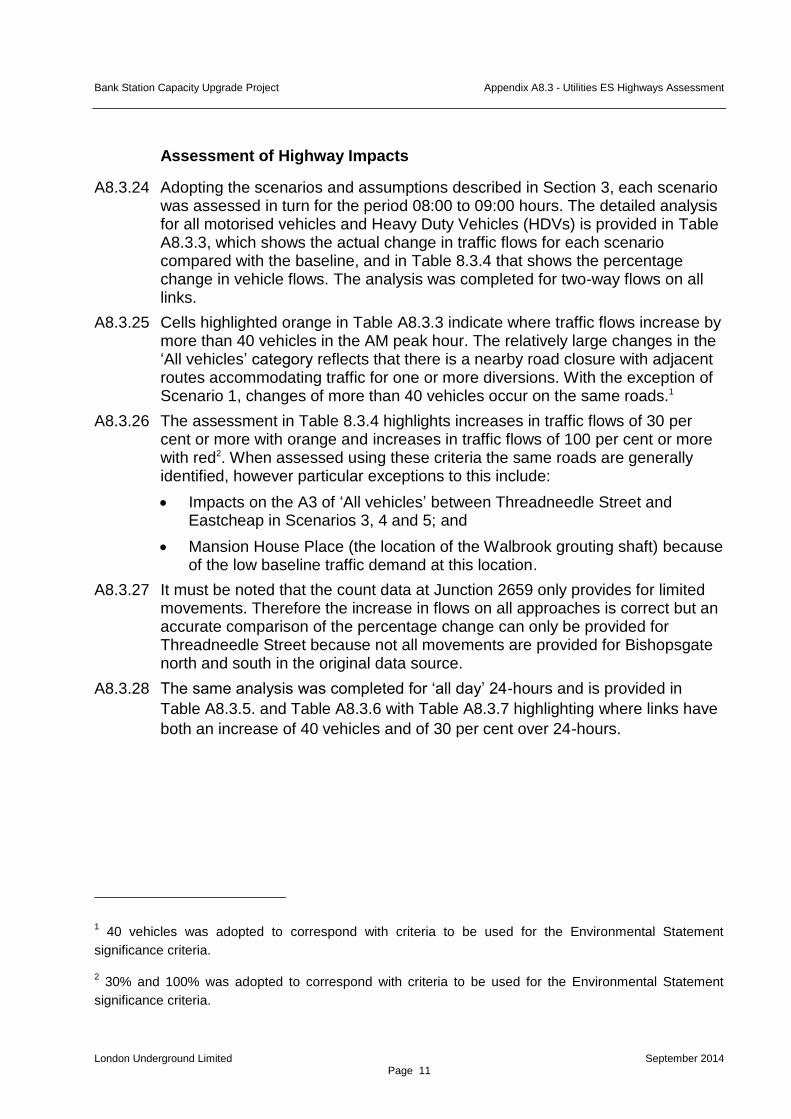
Assessment of Highway Impacts
A8.3.24 Adopting the scenarios and assumptions described in Section 3, each scenario was assessed in turn for the period 08:00 to 09:00 hours. The detailed analysis for all motorised vehicles and Heavy Duty Vehicles (HDVs) is provided in Table A8.3.3, which shows the actual change in traffic flows for each scenario compared with the baseline, and in Table 8.3.4 that shows the percentage change in vehicle flows. The analysis was completed for two-way flows on all links.
A8.3.25 Cells highlighted orange in Table A8.3.3 indicate where traffic flows increase by more than 40 vehicles in the AM peak hour. The relatively large changes in the ‘All vehicles’ category reflects that there is a nearby road closure with adjacent routes accommodating traffic for one or more diversions. With the exception of Scenario 1, changes of more than 40 vehicles occur on the same roads.1
A8.3.26 The assessment in Table 8.3.4 highlights increases in traffic flows of 30 per cent or more with orange and increases in traffic flows of 100 per cent or more with red2. When assessed using these criteria the same roads are generally identified, however particular exceptions to this include:
Impacts on the A3 of ‘All vehicles’ between Threadneedle Street and Eastcheap in Scenarios 3, 4 and 5; and
Mansion House Place (the location of the Walbrook grouting shaft) because of the low baseline traffic demand at this location.
A8.3.27 It must be noted that the count data at Junction 2659 only provides for limited movements. Therefore the increase in flows on all approaches is correct but an accurate comparison of the percentage change can only be provided for Threadneedle Street because not all movements are provided for Bishopsgate north and south in the original data source.
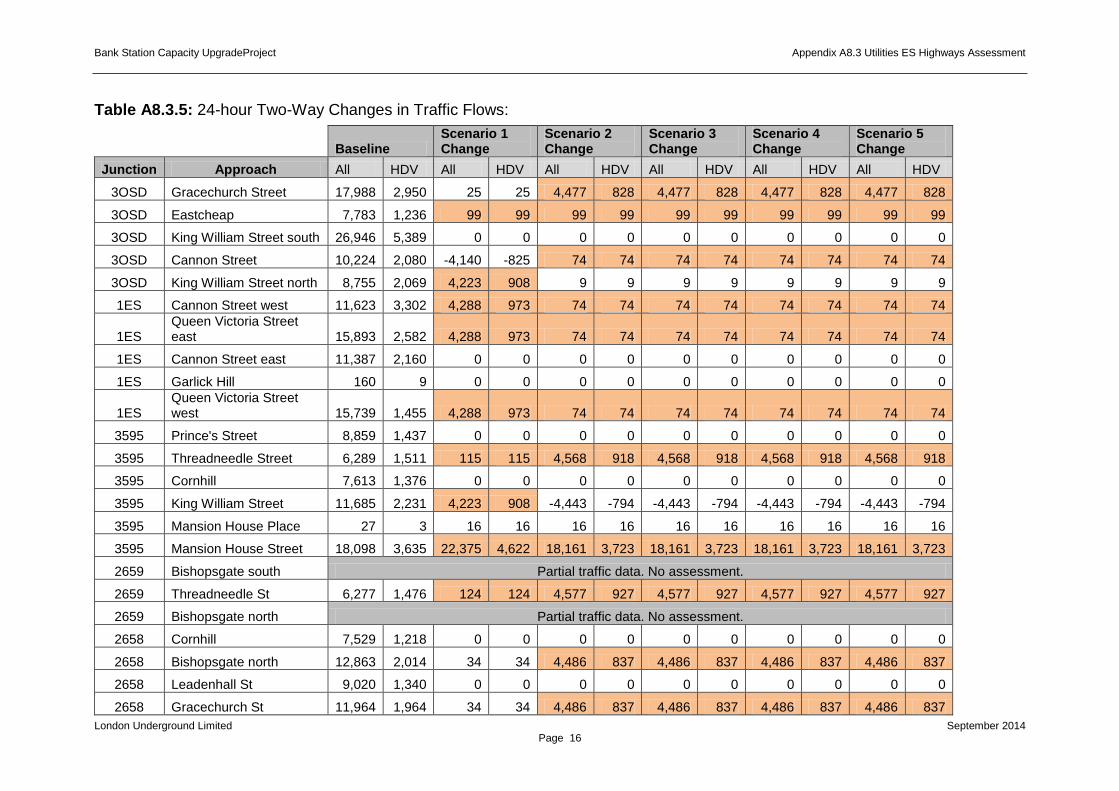
A8.3.28 The same analysis was completed for ‘all day’ 24-hours and is provided in
Table A8.3.5. and Table A8.3.6 with Table A8.3.7 highlighting where links have
both an increase of 40 vehicles and of 30 per cent over 24-hours.
1 40 vehicles was adopted to correspond with criteria to be used for the Environmental Statement
significance criteria.
2 30% and 100% was adopted to correspond with criteria to be used for the Environmental Statement
significance criteria.

Bank Station Capacity UpgradeProject Appendix A8.3 Utilities ES Highways Assessment
London Underground Limited September 2014 Page 12
Table A8.3.3: 08:00-09:00 Two-Way Changes in Traffic Flows:
Baseline
Scenario 1 Change
Scenario 2 Change
Scenario 3 Change
Scenario 4 Change
Scenario 5 Change
Junction Approach All HDV All HDV All HDV All HDV All HDV All HDV
3OSD Gracechurch Street 1,039 191 3 3 220 43 220 43 220 43 220 43
3OSD Eastcheap 341 53 8 8 8 8 8 8 8 8 8 8
3OSD King William Street south 1,597 325 0 0 0 0 0 0 0 0 0 0
3OSD Cannon Street 544 145 -242 -76 5 5 5 5 5 5 5 5
3OSD King William Street north 513 124 248 82 1 1 1 1 1 1 1 1
1ES Cannon Street west 580 197 252 86 5 5 5 5 5 5 5 5
1ES Queen Victoria Street east 971 156 252 86 5 5 5 5 5 5 5 5
1ES Cannon Street east 614 161 0 0 0 0 0 0 0 0 0 0
1ES Garlick Hill 10 2 0 0 0 0 0 0 0 0 0 0
1ES Queen Victoria Street west 1,009 122 252 86 5 5 5 5 5 5 5 5
3595 Prince's Street 496 83 0 0 0 0 0 0 0 0 0 0
3595 Threadneedle Street 396 90 10 10 227 50 227 50 227 50 227 50
3595 Cornhill 415 75 0 0 0 0 0 0 0 0 0 0
3595 King William Street 610 119 248 82 -216 -39 -216 -39 -216 -39 -216 -39
3595 Mansion House Place 1 0 2 2 2 2 2 2 2 2 2 2
3595 Mansion House Street 1,038 213 1,291 301 1,044 220 1,044 220 1,044 220 1,044 220
2659 Bishopsgate south Partial traffic data. No assessment.
2659 Threadneedle St 298 67 11 11 228 51 228 51 228 51 228 51
2659 Bishopsgate north Partial traffic data. No assessment.
2658 Cornhill 396 64 0 0 0 0 0 0 0 0 0 0
2658 Bishopsgate north 838 123 4 4 221 44 221 44 221 44 221 44
2658 Leadenhall St 478 73 0 0 0 0 0 0 0 0 0 0
2658 Gracechurch St 772 120 4 4 221 44 221 44 221 44 221 44

Bank Station Capacity UpgradeProject Appendix A8.3 Utilities ES Highways Assessment
London Underground Limited September 2014 Page 13
Baseline
Scenario 1 Change
Scenario 2 Change
Scenario 3 Change
Scenario 4 Change
Scenario 5 Change
Junction Approach All HDV All HDV All HDV All HDV All HDV All HDV
2657 Lombard St 102 7 0 0 0 0 0 0 0 0 0 0
2657 Gracechurch St north 623 112 4 4 221 44 221 44 221 44 221 44
2657 Fenchurch St 553 93 0 0 0 0 0 0 0 0 0 0
2657 Gracechurch St south 946 174 4 4 221 44 221 44 221 44 221 44

Bank Station Capacity UpgradeProject Appendix A8.3 Utilities ES Highways Assessment
London Underground Limited September 2014 Page 14
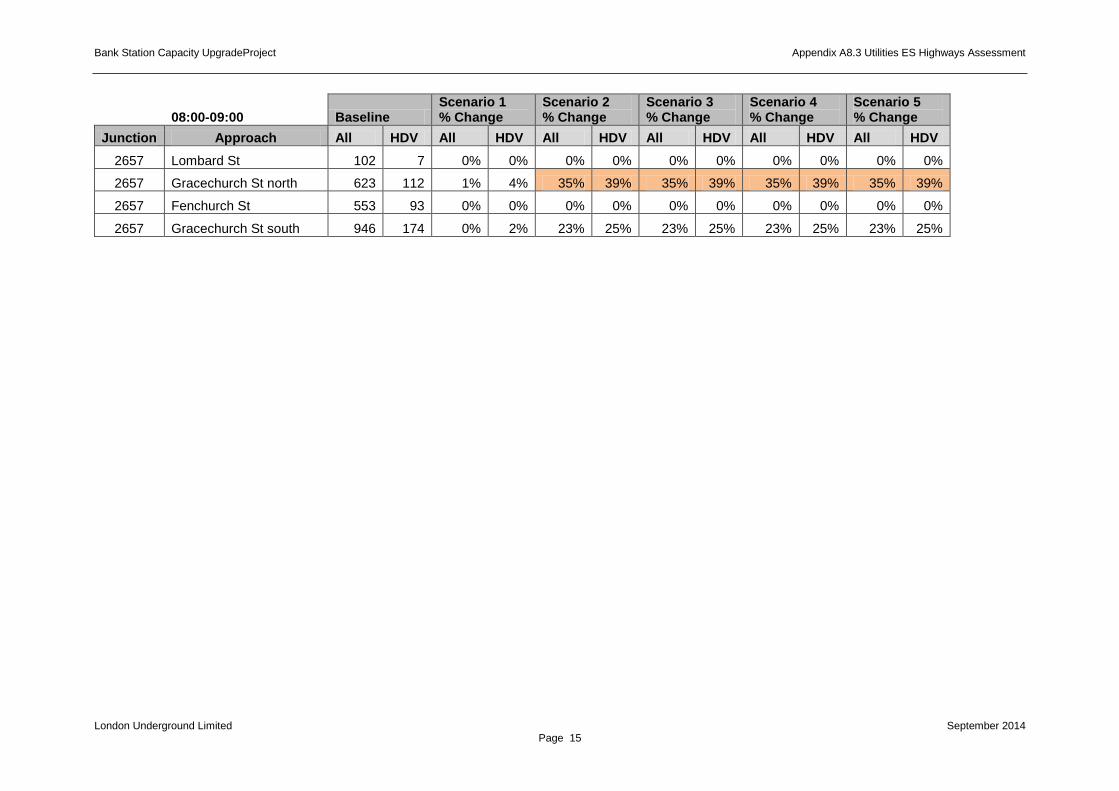
Table A8.3.4: 08:00-09:00 Percentage Change in Traffic Flows:
08:00-09:00 Baseline
Scenario 1 % Change
Scenario 2 % Change
Scenario 3 % Change
Scenario 4 % Change
Scenario 5 % Change
Junction Approach All HDV All HDV All HDV All HDV All HDV All HDV
3OSD Gracechurch Street 1,039 191 0% 2% 21% 23% 21% 23% 21% 23% 21% 23%
3OSD Eastcheap 341 53 2% 15% 2% 15% 2% 15% 2% 15% 2% 15%
3OSD King William Street south 1,597 325 0% 0% 0% 0% 0% 0% 0% 0% 0% 0%
3OSD Cannon Street 544 145 -44% -52% 1% 3% 1% 3% 1% 3% 1% 3%
3OSD King William Street north 513 124 48% 66% 0% 1% 0% 1% 0% 1% 0% 1%
1ES Cannon Street west 580 197 43% 44% 1% 3% 1% 3% 1% 3% 1% 3%
1ES Queen Victoria Street east 971 156 26% 55% 1% 3% 1% 3% 1% 3% 1% 3%
1ES Cannon Street east 614 161 0% 0% 0% 0% 0% 0% 0% 0% 0% 0%
1ES Garlick Hill 10 2 0% 0% 0% 0% 0% 0% 0% 0% 0% 0%
1ES Queen Victoria Street west 1,009 122 25% 70% 0% 4% 0% 4% 0% 4% 0% 4%
3595 Prince's Street 496 83 0% 0% 0% 0% 0% 0% 0% 0% 0% 0%
3595 Threadneedle Street 396 90 3% 11% 57% 56% 57% 56% 57% 56% 57% 56%
3595 Cornhill 415 75 0% 0% 0% 0% 0% 0% 0% 0% 0% 0%
3595 King William Street 610 119 41% 69% -35% -33% -35% -33% -35% -33% -35% -33%
3595 Mansion House Place 1 0 200% 100% 200% 100% 200% 100% 200% 100% 200% 100%
3595 Mansion House Street 1 0 200% - 200% - 200% - 200% - 200% -
2659 Bishopsgate south Partial traffic data. No assessment.
2659 Threadneedle St 298 67 4% 16% 77% 76% 77% 76% 77% 76% 77% 76%
2659 Bishopsgate north Partial traffic data. No assessment.
2658 Cornhill 396 64 0% 0% 0% 0% 0% 0% 0% 0% 0% 0%
2658 Bishopsgate north 838 123 0% 3% 26% 36% 26% 36% 26% 36% 26% 36%
2658 Leadenhall St 478 73 0% 0% 0% 0% 0% 0% 0% 0% 0% 0%
2658 Gracechurch St 772 120 1% 3% 29% 37% 29% 37% 29% 37% 29% 37%
Bank Station Capacity UpgradeProject Appendix A8.3 Utilities ES Highways Assessment
London Underground Limited September 2014 Page 15
08:00-09:00 Baseline Scenario 1 % Change
Scenario 2 % Change
Scenario 3 % Change
Scenario 4 % Change
Scenario 5 % Change
Junction Approach All HDV All HDV All HDV All HDV All HDV All HDV
2657 Lombard St 102 7 0% 0% 0% 0% 0% 0% 0% 0% 0% 0%
2657 Gracechurch St north 623 112 1% 4% 35% 39% 35% 39% 35% 39% 35% 39%
2657 Fenchurch St 553 93 0% 0% 0% 0% 0% 0% 0% 0% 0% 0%
2657 Gracechurch St south 946 174 0% 2% 23% 25% 23% 25% 23% 25% 23% 25%
Bank Station Capacity UpgradeProject Appendix A8.3 Utilities ES Highways Assessment
London Underground Limited September 2014 Page 16
Table A8.3.5: 24-hour Two-Way Changes in Traffic Flows:
Baseline Scenario 1 Change
Scenario 2 Change
Scenario 3 Change
Scenario 4 Change
Scenario 5 Change
Junction Approach All HDV All HDV All HDV All HDV All HDV All HDV
3OSD Gracechurch Street 17,988 2,950 25 25 4,477 828 4,477 828 4,477 828 4,477 828
3OSD Eastcheap 7,783 1,236 99 99 99 99 99 99 99 99 99 99
3OSD King William Street south 26,946 5,389 0 0 0 0 0 0 0 0 0 0
3OSD Cannon Street 10,224 2,080 -4,140 -825 74 74 74 74 74 74 74 74
3OSD King William Street north 8,755 2,069 4,223 908 9 9 9 9 9 9 9 9
1ES Cannon Street west 11,623 3,302 4,288 973 74 74 74 74 74 74 74 74
1ES Queen Victoria Street east 15,893 2,582 4,288 973 74 74 74 74 74 74 74 74
1ES Cannon Street east 11,387 2,160 0 0 0 0 0 0 0 0 0 0
1ES Garlick Hill 160 9 0 0 0 0 0 0 0 0 0 0
1ES Queen Victoria Street west 15,739 1,455 4,288 973 74 74 74 74 74 74 74 74
3595 Prince's Street 8,859 1,437 0 0 0 0 0 0 0 0 0 0
3595 Threadneedle Street 6,289 1,511 115 115 4,568 918 4,568 918 4,568 918 4,568 918
3595 Cornhill 7,613 1,376 0 0 0 0 0 0 0 0 0 0
3595 King William Street 11,685 2,231 4,223 908 -4,443 -794 -4,443 -794 -4,443 -794 -4,443 -794
3595 Mansion House Place 27 3 16 16 16 16 16 16 16 16 16 16
3595 Mansion House Street 18,098 3,635 22,375 4,622 18,161 3,723 18,161 3,723 18,161 3,723 18,161 3,723
2659 Bishopsgate south Partial traffic data. No assessment.
2659 Threadneedle St 6,277 1,476 124 124 4,577 927 4,577 927 4,577 927 4,577 927
2659 Bishopsgate north Partial traffic data. No assessment.
2658 Cornhill 7,529 1,218 0 0 0 0 0 0 0 0 0 0
2658 Bishopsgate north 12,863 2,014 34 34 4,486 837 4,486 837 4,486 837 4,486 837
2658 Leadenhall St 9,020 1,340 0 0 0 0 0 0 0 0 0 0
2658 Gracechurch St 11,964 1,964 34 34 4,486 837 4,486 837 4,486 837 4,486 837

Bank Station Capacity UpgradeProject Appendix A8.3 Utilities ES Highways Assessment
London Underground Limited September 2014 Page 17
Baseline Scenario 1 Change
Scenario 2 Change
Scenario 3 Change
Scenario 4 Change
Scenario 5 Change
Junction Approach All HDV All HDV All HDV All HDV All HDV All HDV
2657 Lombard St 1,881 81 0 0 0 0 0 0 0 0 0 0
2657 Gracechurch St north 10,382 1,792 34 34 4,486 837 4,486 837 4,486 837 4,486 837
2657 Fenchurch St 10,070 1,145 0 0 0 0 0 0 0 0 0 0
2657 Gracechurch St south 16,309 2,639 34 34 4,486 837 4,486 837 4,486 837 4,486 837

Bank Station Capacity UpgradeProject Appendix A8.3 Utilities ES Highways Assessment
London Underground Limited September 2014 Page 18
Table A8.3.6: 24-hour Percentage Change in Traffic Flows:
Baseline Scenario 1 % Change
Scenario 2 % Change
Scenario 3 % Change
Scenario 4 % Change
Scenario 5 % Change
Junction Approach All HDV All HDV All HDV All HDV All HDV All HDV
3OSD Gracechurch Street 17,988 2,950 0% 1% 25% 28% 25% 28% 25% 28% 25% 28%
3OSD Eastcheap 7,783 1,236 1% 8% 1% 8% 1% 8% 1% 8% 1% 8%
3OSD King William Street south 26,946 5,389 0% 0% 0% 0% 0% 0% 0% 0% 0% 0%
3OSD Cannon Street 10,224 2,080 -40% -40% 1% 4% 1% 4% 1% 4% 1% 4%
3OSD King William Street north 8,755 2,069 48% 44% 0% 0% 0% 0% 0% 0% 0% 0%
1ES Cannon Street west 11,623 3,302 37% 29% 1% 2% 1% 2% 1% 2% 1% 2%
1ES Queen Victoria Street east 15,893 2,582 27% 38% 0% 3% 0% 3% 0% 3% 0% 3%
1ES Cannon Street east 11,387 2,160 0% 0% 0% 0% 0% 0% 0% 0% 0% 0%
1ES Garlick Hill 160 9 0% 0% 0% 0% 0% 0% 0% 0% 0% 0%
1ES Queen Victoria Street west 15,739 1,455 27% 67% 0% 5% 0% 5% 0% 5% 0% 5%
3595 Prince's Street 8,859 1,437 0% 0% 0% 0% 0% 0% 0% 0% 0% 0%
3595 Threadneedle Street 6,289 1,511 2% 8% 73% 61% 73% 61% 73% 61% 73% 61%
3595 Cornhill 7,613 1,376 0% 0% 0% 0% 0% 0% 0% 0% 0% 0%
3595 King William Street 11,685 2,231 36% 41% -38% -36% -38% -36% -38% -36% -38% -36%
3595 Mansion House Place 27 3 60% 100% 60% 100% 60% 100% 60% 100% 60% 100%
3595 Mansion House Street 27 3 60% 590% 60% 590% 60% 590% 60% 590% 60% 590%
2659 Bishopsgate south Partial traffic data. No assessment.
2659 Threadneedle St 6,277 1,476 2% 8% 73% 63% 73% 63% 73% 63% 73% 63%
2659 Bishopsgate north Partial traffic data. No assessment.
2658 Cornhill 7,529 1,218 0% 0% 0% 0% 0% 0% 0% 0% 0% 0%
2658 Bishopsgate north 12,863 2,014 0% 2% 35% 42% 35% 42% 35% 42% 35% 42%
2658 Leadenhall St 9,020 1,340 0% 0% 0% 0% 0% 0% 0% 0% 0% 0%
2658 Gracechurch St 11,964 1,964 0% 2% 37% 43% 37% 43% 37% 43% 37% 43%

Bank Station Capacity UpgradeProject Appendix A8.3 Utilities ES Highways Assessment
London Underground Limited September 2014 Page 19
Baseline Scenario 1 % Change
Scenario 2 % Change
Scenario 3 % Change
Scenario 4 % Change
Scenario 5 % Change
Junction Approach All HDV All HDV All HDV All HDV All HDV All HDV
2657 Lombard St 1,881 81 0% 0% 0% 0% 0% 0% 0% 0% 0% 0%
2657 Gracechurch St north 10,382 1,792 0% 2% 43% 47% 43% 47% 43% 47% 43% 47%
2657 Fenchurch St 10,070 1,145 0% 0% 0% 0% 0% 0% 0% 0% 0% 0%
2657 Gracechurch St south 16,309 2,639 0% 1% 28% 32% 28% 32% 28% 32% 28% 32%

Bank Station Capacity UpgradeProject Appendix A8.3 Utilities ES Highways Assessment
London Underground Limited September 2014 Page 20
Table A8.3.7: 24 Hour Correlation of Increase in 40 Vehicles with Increase of 30%:
Scenario 1 Change Scenario 2 Change Scenario 3 Change Scenario 4 Change Scenario 5 Change
All HDV All HDV All HDV All HDV All HDV
+40 +30% +40 +30% +40 +30% +40 +30% +40 +30% +40 +30% +40 +30% +40 +30% +40 +30% +40 +30%
3OSD Gracechurch Street - - - - YES - YES - YES - YES - YES - YES - YES - YES -
3OSD Eastcheap YES - YES - YES - YES - YES - YES - YES - YES - YES - YES -
3OSD King William Street south - - - - - - - - - - - - - - - - - - - -
3OSD Cannon Street - - - - YES - YES - YES - YES - YES - YES - YES - YES -
3OSD King William Street north YES YES YES YES - - - - - - - - - - - - - - - -
1ES Cannon Street west YES YES YES - YES - YES - YES - YES - YES - YES - YES - YES -
1ES Queen Victoria Street east YES - YES YES YES - YES - YES - YES - YES - YES - YES - YES -
1ES Cannon Street east - - - - - - - - - - - - - - - - - - - -
1ES Garlick Hill - - - - - - - - - - - - - - - - - - - -
1ES Queen Victoria Street west YES - YES YES YES - YES - YES - YES - YES - YES - YES - YES -
3595 Prince's Street - - - - - - - - - - - - - - - - - - - -
3595 Threadneedle Street YES - YES - YES YES YES YES YES YES YES YES YES YES YES YES YES YES YES YES
3595 Cornhill - - - - - - - - - - - - - - - - - - - -
3595 King William Street YES YES YES YES - - - - - - - - - - - - - - - -
3595 Mansion House Place - YES - YES - YES - YES - YES - YES - YES - YES - YES - YES
3595 Mansion House Street YES YES YES YES YES YES YES YES YES YES YES YES YES YES YES YES YES YES YES YES
2659 Bishopsgate south Partial traffic data. No assessment.
2659 Threadneedle St YES - YES - YES YES YES YES YES YES YES YES YES YES YES YES YES YES YES YES
2659 Bishopsgate north Partial traffic data. No assessment.
2658 Cornhill - - - - - - - - - - - - - - - - - - - -
2658 Bishopsgate north - - - - YES YES YES YES YES YES YES YES YES YES YES YES YES YES YES YES
2658 Leadenhall St - - - - - - - - - - - - - - - - - - - -
2658 Gracechurch St - - - - YES YES YES YES YES YES YES YES YES YES YES YES YES YES YES YES

Bank Station Capacity UpgradeProject Appendix A8.3 Utilities ES Highways Assessment
London Underground Limited September 2014 Page 21
Scenario 1 Change Scenario 2 Change Scenario 3 Change Scenario 4 Change Scenario 5 Change
All HDV All HDV All HDV All HDV All HDV
+40 +30% +40 +30% +40 +30% +40 +30% +40 +30% +40 +30% +40 +30% +40 +30% +40 +30% +40 +30%
2657 Lombard St - - - - - - - - - - - - - - - - - - - -
2657 Gracechurch St north - - - - YES YES YES YES YES YES YES YES YES YES YES YES YES YES YES YES
2657 Fenchurch St - - - - - - - - - - - - - - - - - - - -
2657 Gracechurch St south - - - - YES - YES YES YES - YES YES YES - YES YES YES - YES YES
Bank Station Capacity UpgradeProject Appendix A8.3 Utilities ES Highways Assessment
London Underground Limited September 2014 Page 22
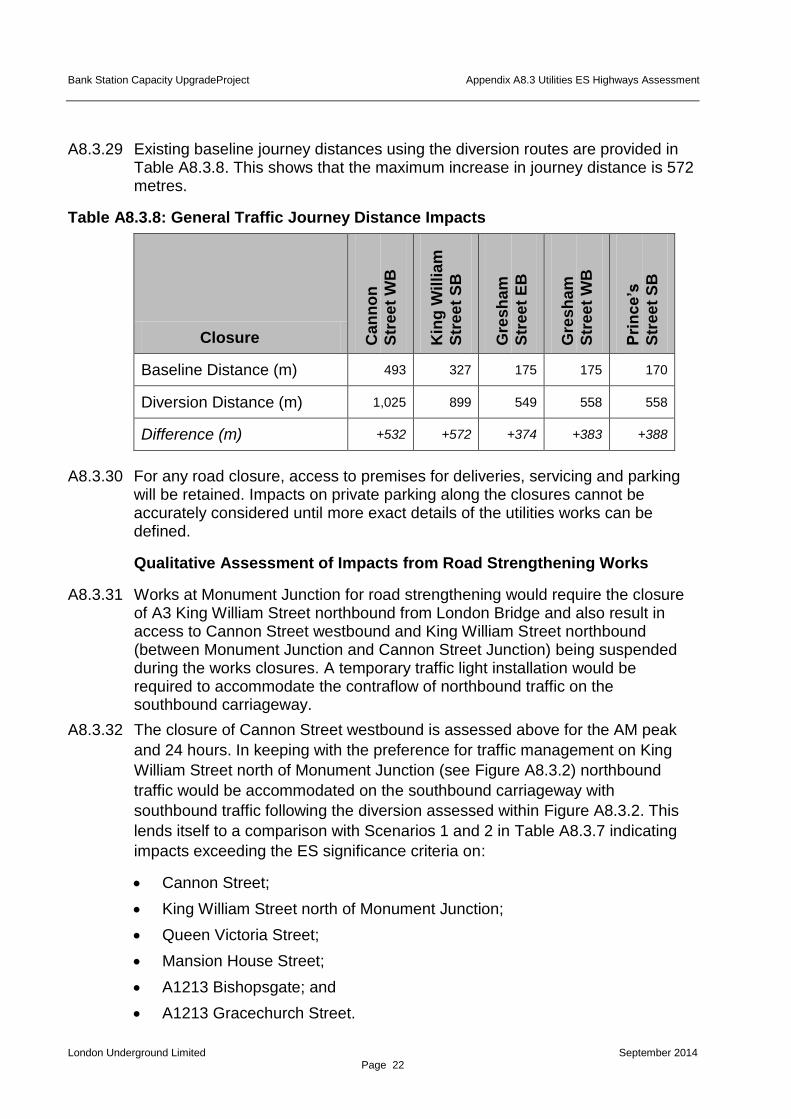
A8.3.29 Existing baseline journey distances using the diversion routes are provided in Table A8.3.8. This shows that the maximum increase in journey distance is 572 metres.
Table A8.3.8: General Traffic Journey Distance Impacts
Closure Can
no
n
Str
ee
t W
B
Kin
g W
illi
am
Str
ee
t S
B
Gre
sh
am
Str
ee
t E
B
Gre
sh
am
Str
ee
t W
B
Pri
nc
e’s
Str
ee
t S
B
Baseline Distance (m) 493 327 175 175 170
Diversion Distance (m) 1,025 899 549 558 558
Difference (m) +532 +572 +374 +383 +388
A8.3.30 For any road closure, access to premises for deliveries, servicing and parking will be retained. Impacts on private parking along the closures cannot be accurately considered until more exact details of the utilities works can be defined.
Qualitative Assessment of Impacts from Road Strengthening Works
A8.3.31 Works at Monument Junction for road strengthening would require the closure of A3 King William Street northbound from London Bridge and also result in access to Cannon Street westbound and King William Street northbound (between Monument Junction and Cannon Street Junction) being suspended during the works closures. A temporary traffic light installation would be required to accommodate the contraflow of northbound traffic on the southbound carriageway.
A8.3.32 The closure of Cannon Street westbound is assessed above for the AM peak
and 24 hours. In keeping with the preference for traffic management on King
William Street north of Monument Junction (see Figure A8.3.2) northbound
traffic would be accommodated on the southbound carriageway with
southbound traffic following the diversion assessed within Figure A8.3.2. This
lends itself to a comparison with Scenarios 1 and 2 in Table A8.3.7 indicating
impacts exceeding the ES significance criteria on:
Cannon Street;
King William Street north of Monument Junction;
Queen Victoria Street;
Mansion House Street;
A1213 Bishopsgate; and
A1213 Gracechurch Street.

Bank Station Capacity UpgradeProject Appendix A8.3 Utilities ES Highways Assessment
London Underground Limited September 2014 Page 23
A8.3.33 A contraflow solution on A3 King William Street would allow all vehicles currently travelling north along A3 King William Street to continue to do so. The existing 18 tonne weight restriction would continue to require vehicles exceeding this maximum gross weight to avoid routes requiring passage through Monument Junction via A3 King William Street. Following completion of the road strengthening works the 18 tonne gross vehicle weight restriction for movements from A3 King William Street northbound can be revoked.
Bus Impacts
A8.3.34 During the general utility works and road strengthening, bus diversions will be of the same length as those for general traffic with the exception of the diversion for Prince’s Street. This diversion would be South Place, Eldon Street, A1211 London Wall, A10 Bishopsgate and Threadneedle to reflect the diversion routes provided by the City of London Corporation, listed in Table A8.3.2.
A8.3.35 With the exception of both Gresham Street closures, all diversions are in excess of 400m longer than the closed route.
Table A8.3.9: Bus Journey Distance Impacts
Closure Can
no
n
Str
ee
t W
B
Kin
g W
illi
am
S
tree
t S
B
Gre
sh
am
Str
ee
t E
B
Gre
sh
am
Str
ee
t W
B
Pri
nc
e’s
Str
ee
t S
B
Baseline Distance (m) 493 327 175 175 684
Diversion Distance (m) 1,025 899 549 558 1,350
Difference (m) +532 +572 +374 +383 +666
A8.3.36 To consider how bus routes may be affected by diversions, Figure A8.3.4 shows roads where bus routes are present along roads affected by diversions (traffic routed away from and onto) or roads approaching diversions. Percentage traffic changes on the roads that are affected by diversions are given in Table A8.3.3.

Bank Station Capacity UpgradeProject Appendix A8.3 Utilities ES Highways Assessment
London Underground Limited September 2014 Page 24
Figure A8.3.4: Roads with Bus Routes on or Approaching Road Diversions
A8.3.37 Along roads where closures are required bus stops will need to be suspended for the duration of the works. Buses will be re-routed to re-join their original route as soon as practicable based upon the stated diversions and in consultation with London Buses. Buses will be able to use alternative stops at Bank and Monument junctions, which provide the key opportunities for interchange from bus to bus and between bus and London Underground/ Docklands Light Rail services in the vicinity of the diversions.
Cycling Impacts
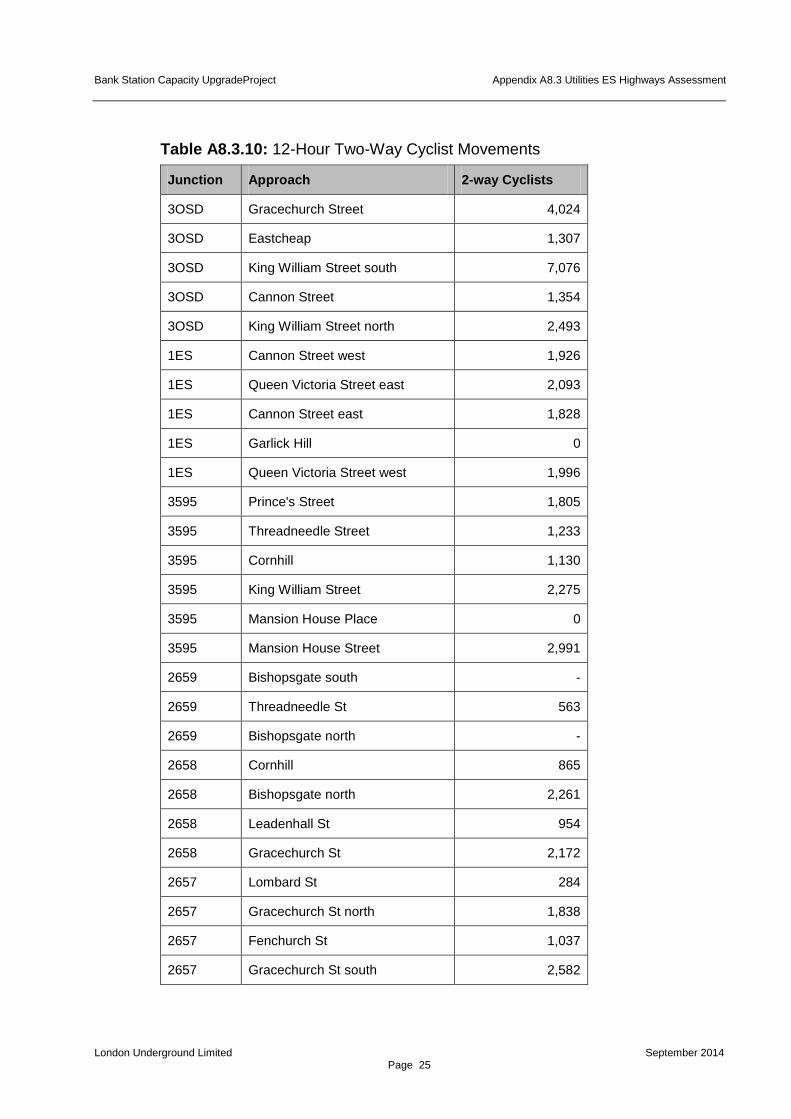
A8.3.38 12-hour two-way cyclist movements are summarised in Table A8.3.10. With the exception of the following locations all roads have a two-way flow in excess of 100 cyclists:
Garlick Hill; and
Mansion House Place.
A8.3.39 Similar to the highway assessment the analysis at Junction 2659 can only be completed accurately for Threadneedle Street because of incomplete information in the source data for Bishopgate.
A8.3.40 The daily change in traffic flow at the locations included in Table A8.3.10 is
provided in Table A8.3.5 and Table A8.3.6.
Bank Station Capacity UpgradeProject Appendix A8.3 Utilities ES Highways Assessment
London Underground Limited September 2014 Page 25
Table A8.3.10: 12-Hour Two-Way Cyclist Movements
Junction Approach 2-way Cyclists
3OSD Gracechurch Street 4,024
3OSD Eastcheap 1,307
3OSD King William Street south 7,076
3OSD Cannon Street 1,354
3OSD King William Street north 2,493
1ES Cannon Street west 1,926
1ES Queen Victoria Street east 2,093
1ES Cannon Street east 1,828
1ES Garlick Hill 0
1ES Queen Victoria Street west 1,996
3595 Prince's Street 1,805
3595 Threadneedle Street 1,233
3595 Cornhill 1,130
3595 King William Street 2,275
3595 Mansion House Place 0
3595 Mansion House Street 2,991
2659 Bishopsgate south -
2659 Threadneedle St 563
2659 Bishopsgate north -
2658 Cornhill 865
2658 Bishopsgate north 2,261
2658 Leadenhall St 954
2658 Gracechurch St 2,172
2657 Lombard St 284
2657 Gracechurch St north 1,838
2657 Fenchurch St 1,037
2657 Gracechurch St south 2,582

Bank Station Capacity UpgradeProject Appendix A8.3 Utilities ES Highways Assessment
London Underground Limited September 2014 Page 26
A8.3.41 Cyclists benefit from much greater flexibility in route choice compared with motorised vehicles. Consequently any diversions will be small and are all expected to be below 1.5 kilometres.
Walking Impacts
A8.3.42 Pedestrian surveys were completed for the Transport Assessment. These are illustrated in Figure A8.3.5 for 12 hours, from 07:00 to 19:00. Closures to footways are not anticipated and if this should become necessary footways on the opposite side of the road provide an alternative with negligible change in journey distance.
A8.3.43 Total closures, however could have a greater impact because of the inconvenience that may be required to travel along an alternative route. The additional footfall along alternative routes may adversely impact the journey experience for existing pedestrians and those diverting as footways may become increasingly crowded.
Summary of Impacts
A8.3.44 The assessment shows there are large increases in traffic flows along the diversion routes as a result of the general utility and road strengthening works. This is to be expected given location of the road closures in Central London. Three out of the five diversion routes will require an increase in journey distance in excess of 400 metres.
A8.3.45 Bus route journey distances will experience the same increases as general traffic with the exception of Scenario 5 (Prince’s Street southbound) where an alternative longer diversion is required following information received from the City of London Corporation. Although the closure of roads will require route diversions and the suspension of bus stops the key interchange locations for bus at Monument and Bank junctions will be largely unaffected, ensuring that a good level of interchange is maintained both with other bus services and with London Underground and Docklands Light Rail services.
A8.3.46 In common with many locations in Central London there is a high use of pedal cycle, with two-way 12-hour flows generally ranging between 1,000 and 3,000 cyclists on the diversion routes where data exists. Cyclists benefit from greater flexibility in route choice, including the opportunity to use routes closed to general traffic. This helps to mitigate the impact to cyclists to some extent.
A8.3.47 Pedestrians may be diverted onto alternative routes of pavements, which will not result in significant changes in journey times, but may increasingly lead to crowding on footways, with an adverse impact on journey experience.

Bank Station Capacity UpgradeProject Appendix A8.3 Utilities ES Highways Assessment
London Underground Limited September 2014 Page 27
Figure A8.3.5: 12-Hour Pedestrian Movements Baseline Data Collection