Embed Size (px)
Citation preview
Budget Planning, Implementation and Monitoring First Step: Understanding Financial Statements – Corporate Approach
Chris DroussiotisSeptember 2011
Lecture Series #1
2
Table of Contents
Accounting Definitions, Terms and Concepts Using Financial Statements Financial Ratio Analysis
These slides could be obtain via the Instructor’s Web page at www.celeritymoment.com
3
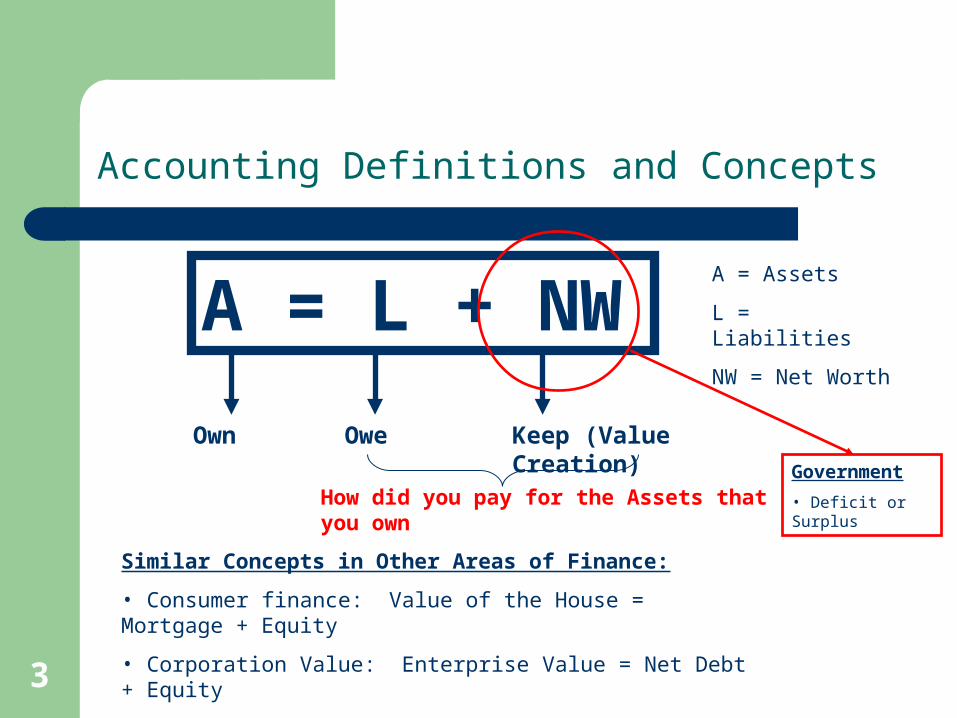
Accounting Definitions and Concepts
A = L + NWA = Assets
L = Liabilities
NW = Net Worth
Own Owe Keep (Value Creation)
Similar Concepts in Other Areas of Finance:
• Consumer finance: Value of the House = Mortgage + Equity
• Corporation Value: Enterprise Value = Net Debt + Equity
• Investments: Value of the Investment: Margin Loan + Equity
How did you pay for the Assets that you ownGovernment
• Deficit or Surplus
4
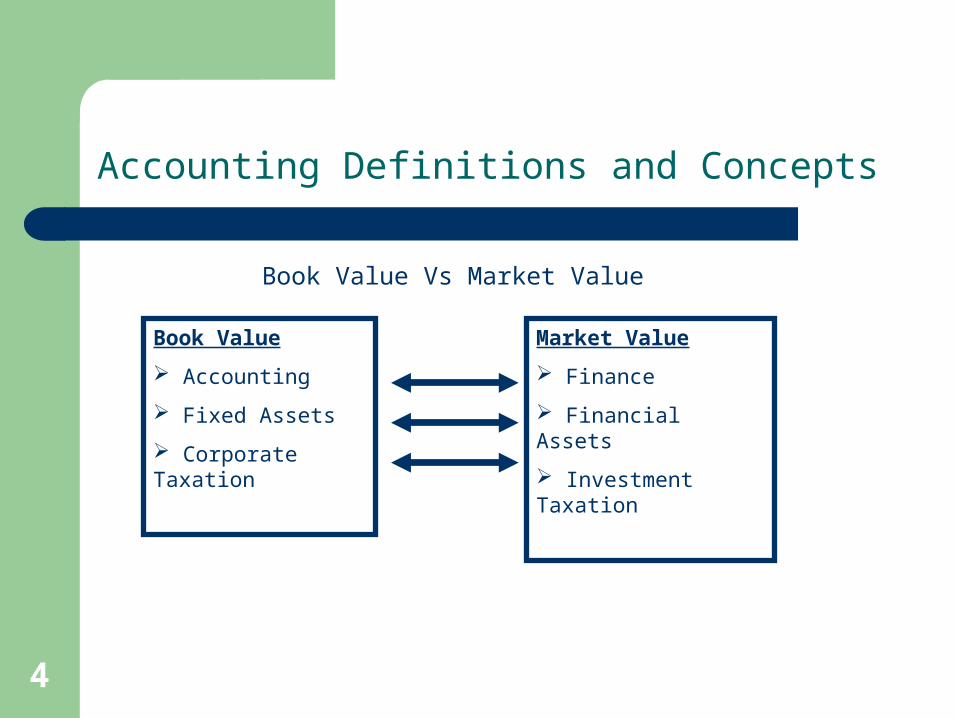
Accounting Definitions and Concepts
Book Value Vs Market Value
Book Value
Accounting
Fixed Assets
Corporate Taxation
Market Value
Finance
Financial Assets
Investment Taxation
5
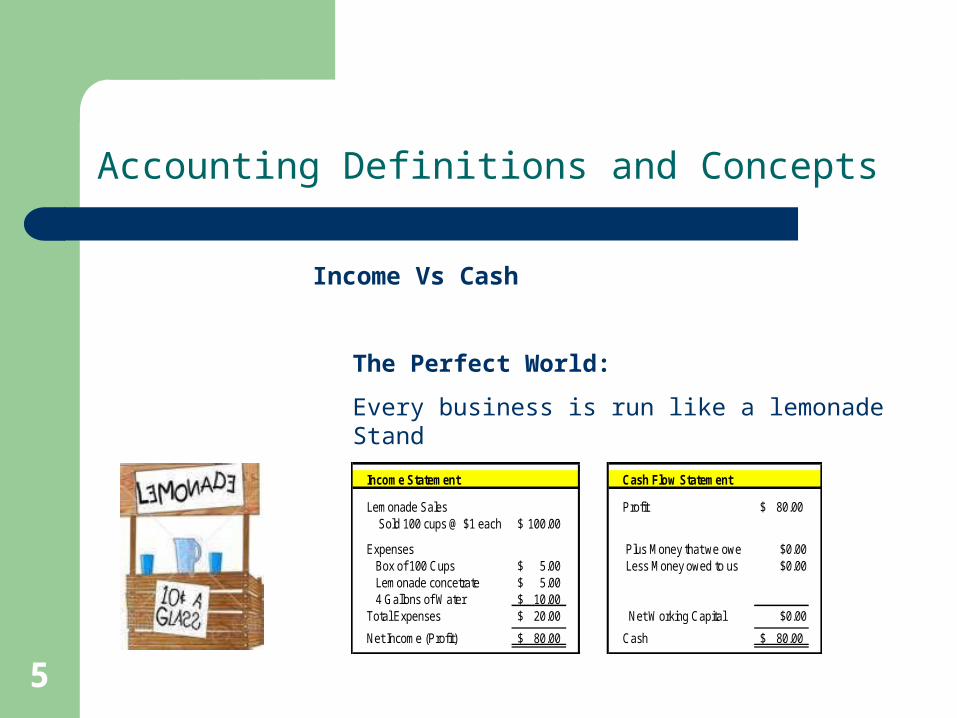
Accounting Definitions and Concepts
Income Vs Cash
The Perfect World:
Every business is run like a lemonade Stand
Income Statement Cash Flow Statement
Lemonade Sales Profit 80.00$ Sold 100 cups @ $1 each 100.00$
Expenses Plus Money that we owe $0.00 Box of 100 Cups 5.00$ Less Money owed to us $0.00 Lemonade concetrate 5.00$ 4 Gallons of Water 10.00$ Total Expenses 20.00$ Net Working Capital $0.00
Net Income (Profit) 80.00$ Cash 80.00$
6
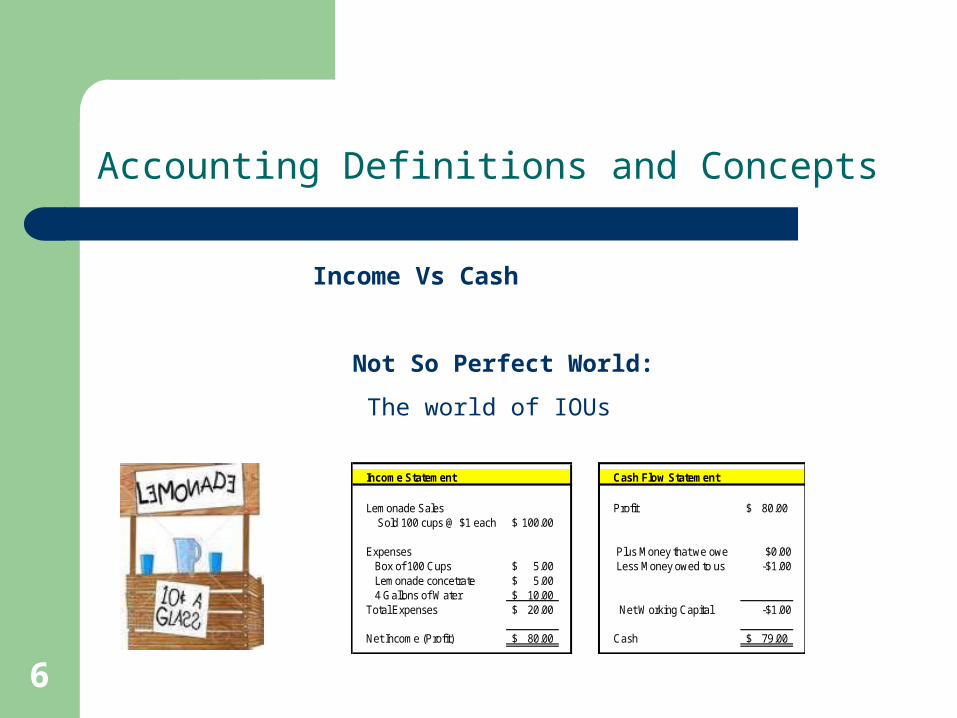
Accounting Definitions and Concepts
Income Vs Cash
Not So Perfect World:
The world of IOUs
Income Statement Cash Flow Statement
Lemonade Sales Profit 80.00$ Sold 100 cups @ $1 each 100.00$
Expenses Plus Money that we owe $0.00 Box of 100 Cups 5.00$ Less Money owed to us -$1.00 Lemonade concetrate 5.00$ 4 Gallons of Water 10.00$ Total Expenses 20.00$ Net Working Capital -$1.00
Net Income (Profit) 80.00$ Cash 79.00$
7
Income Statement
Measurement of Profit and Loss over a Period of Time Top Line to Bottom Line Revenue (Sales) Less Expenses = Profit or Loss
8
Income Statement
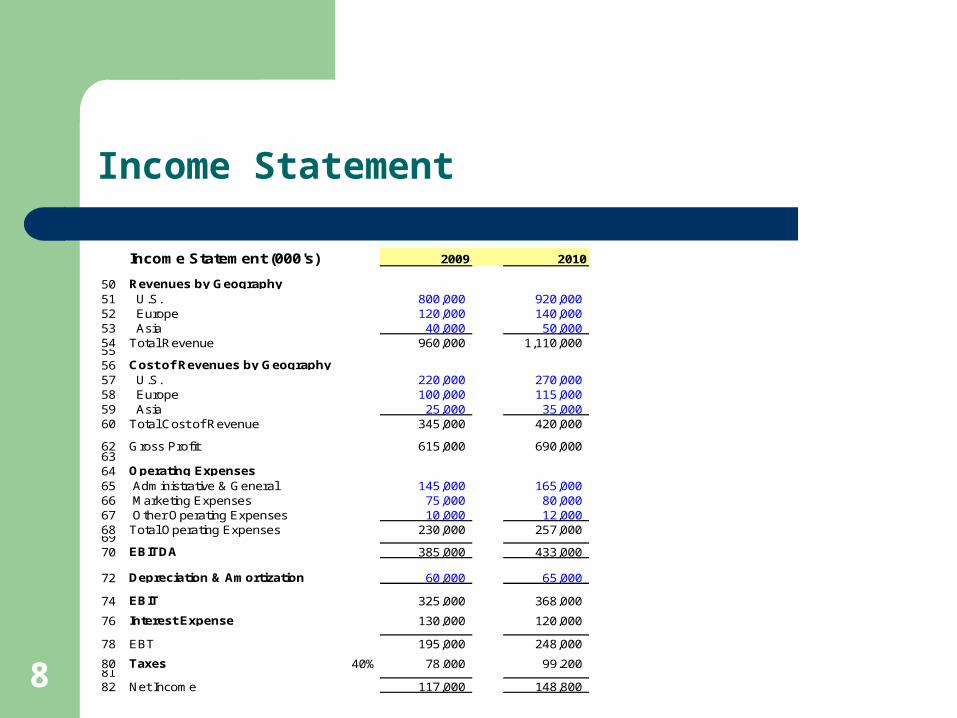
Income Statement (000's) 2009 2010
50 Revenues by Geography51 U.S. 800,000 920,000 52 Europe 120,000 140,000 53 Asia 40,000 50,000 54 Total Revenue 960,000 1,110,000 5556 Cost of Revenues by Geography57 U.S. 220,000 270,000 58 Europe 100,000 115,000 59 Asia 25,000 35,000 60 Total Cost of Revenue 345,000 420,000
62 Gross Profit 615,000 690,000 6364 Operating Expenses65 Administrative & General 145,000 165,000 66 Marketing Expenses 75,000 80,000 67 Other Operating Expenses 10,000 12,000 68 Total Operating Expenses 230,000 257,000 6970 EBITDA 385,000 433,000
72 Depreciation & Amortization 60,000 65,000
74 EBIT 325,000 368,000
76 Interest Expense 130,000 120,000
78 EBT 195,000 248,000
80 Taxes 40% 78,000 99,200 8182 Net Income 117,000 148,800
9
Balance Sheet Statement
It shows us on a snap shot the Wealth of the Company The statement is set-up in Order of Liquidity
10
Balance Sheet Statement
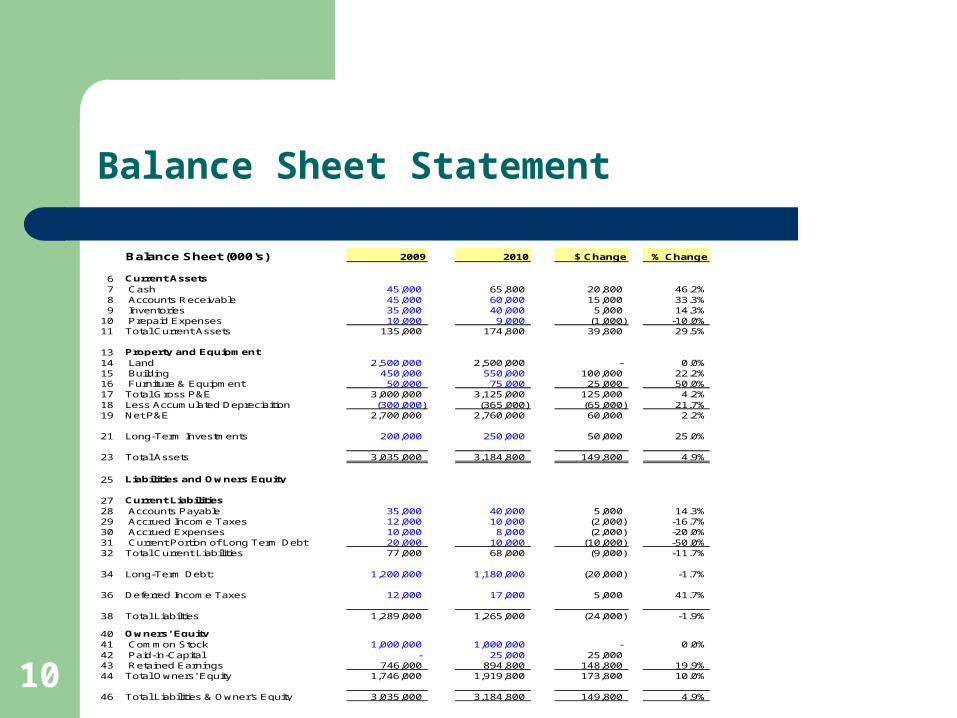
Balance Sheet (000's) 2009 2010 $ Change % Change
6 Current Assets7 Cash 45,000 65,800 20,800 46.2%8 Accounts Receivable 45,000 60,000 15,000 33.3%9 Inventories 35,000 40,000 5,000 14.3%
10 Prepaid Expenses 10,000 9,000 (1,000) -10.0%11 Total Current Assets 135,000 174,800 39,800 29.5%
13 Property and Equipment14 Land 2,500,000 2,500,000 - 0.0%15 Building 450,000 550,000 100,000 22.2%16 Furniture & Equipment 50,000 75,000 25,000 50.0%17 Total Gross P&E 3,000,000 3,125,000 125,000 4.2%18 Less Accumulated Depreciaition (300,000) (365,000) (65,000) 21.7%19 Net P&E 2,700,000 2,760,000 60,000 2.2%
21 Long-Term Investments 200,000 250,000 50,000 25.0%
23 Total Assets 3,035,000 3,184,800 149,800 4.9%
25 Liabilities and Owners Equity
27 Current Liabilities28 Accounts Payable 35,000 40,000 5,000 14.3%29 Accrued Income Taxes 12,000 10,000 (2,000) -16.7%30 Accrued Expenses 10,000 8,000 (2,000) -20.0%31 Current Portion of Long Term Debt 20,000 10,000 (10,000) -50.0%32 Total Current Liabilities 77,000 68,000 (9,000) -11.7%
34 Long-Term Debt: 1,200,000 1,180,000 (20,000) -1.7%
36 Deferred Income Taxes 12,000 17,000 5,000 41.7%
38 Total Liabilties 1,289,000 1,265,000 (24,000) -1.9%
40 Owners' Equity41 Common Stock 1,000,000 1,000,000 - 0.0%42 Paid-in-Capital - 25,000 25,000 43 Retained Earnings 746,000 894,800 148,800 19.9%44 Total Owners' Equity 1,746,000 1,919,800 173,800 10.0%
46 Total Liabilities & Owner's Equity 3,035,000 3,184,800 149,800 4.9%
11
Cash Flow Statement
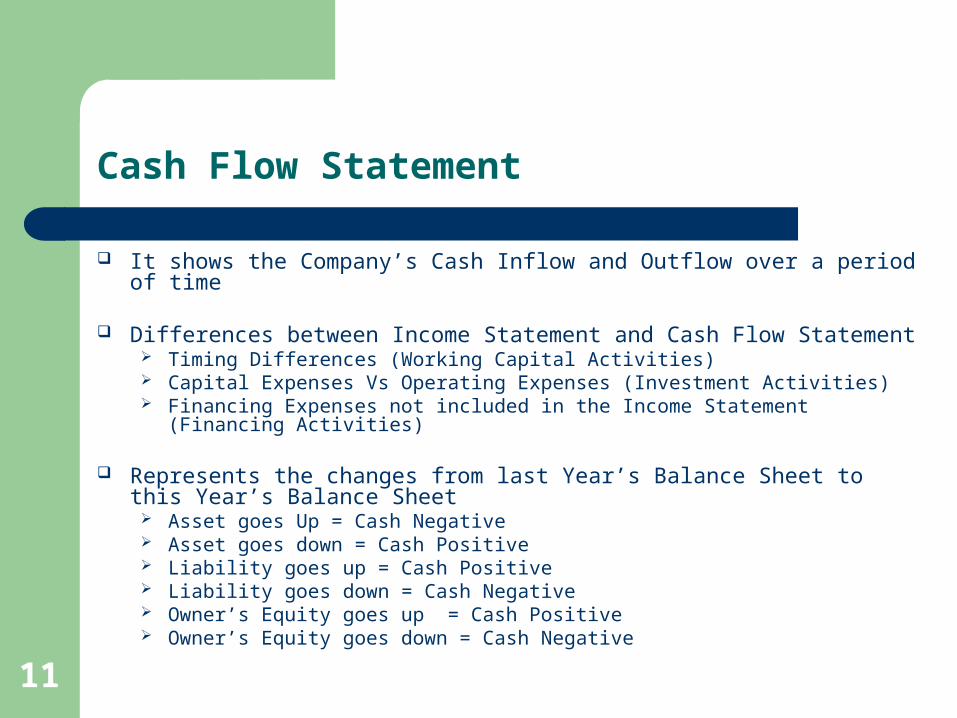
It shows the Company’s Cash Inflow and Outflow over a period of time
Differences between Income Statement and Cash Flow Statement Timing Differences (Working Capital Activities) Capital Expenses Vs Operating Expenses (Investment Activities) Financing Expenses not included in the Income Statement (Financing
Activities)
Represents the changes from last Year’s Balance Sheet to this Year’s Balance Sheet
Asset goes Up = Cash Negative Asset goes down = Cash Positive Liability goes up = Cash Positive Liability goes down = Cash Negative Owner’s Equity goes up = Cash Positive Owner’s Equity goes down = Cash Negative
12
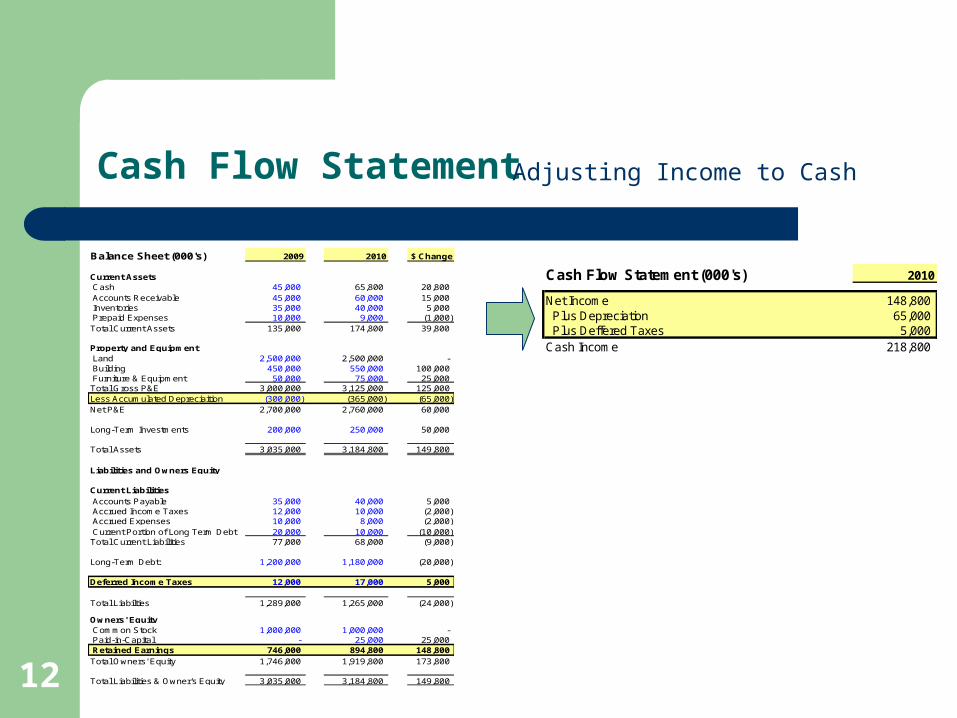
Cash Flow Statement Adjusting Income to Cash
Balance Sheet (000's) 2009 2010 $ Change
Current Assets Cash 45,000 65,800 20,800 Accounts Receivable 45,000 60,000 15,000 Inventories 35,000 40,000 5,000 Prepaid Expenses 10,000 9,000 (1,000) Total Current Assets 135,000 174,800 39,800
Property and Equipment Land 2,500,000 2,500,000 - Building 450,000 550,000 100,000 Furniture & Equipment 50,000 75,000 25,000 Total Gross P&E 3,000,000 3,125,000 125,000 Less Accumulated Depreciaition (300,000) (365,000) (65,000) Net P&E 2,700,000 2,760,000 60,000
Long-Term Investments 200,000 250,000 50,000
Total Assets 3,035,000 3,184,800 149,800
Liabilities and Owners Equity
Current Liabilities Accounts Payable 35,000 40,000 5,000 Accrued Income Taxes 12,000 10,000 (2,000) Accrued Expenses 10,000 8,000 (2,000) Current Portion of Long Term Debt 20,000 10,000 (10,000) Total Current Liabilities 77,000 68,000 (9,000)
Long-Term Debt: 1,200,000 1,180,000 (20,000)
Deferred Income Taxes 12,000 17,000 5,000
Total Liabilties 1,289,000 1,265,000 (24,000)
Owners' Equity Common Stock 1,000,000 1,000,000 - Paid-in-Capital - 25,000 25,000 Retained Earnings 746,000 894,800 148,800 Total Owners' Equity 1,746,000 1,919,800 173,800
Total Liabilities & Owner's Equity 3,035,000 3,184,800 149,800
Cash Flow Statement (000's) 2010
Net Income 148,800 Plus Depreciation 65,000 Plus Deffered Taxes 5,000 Cash Income 218,800
13
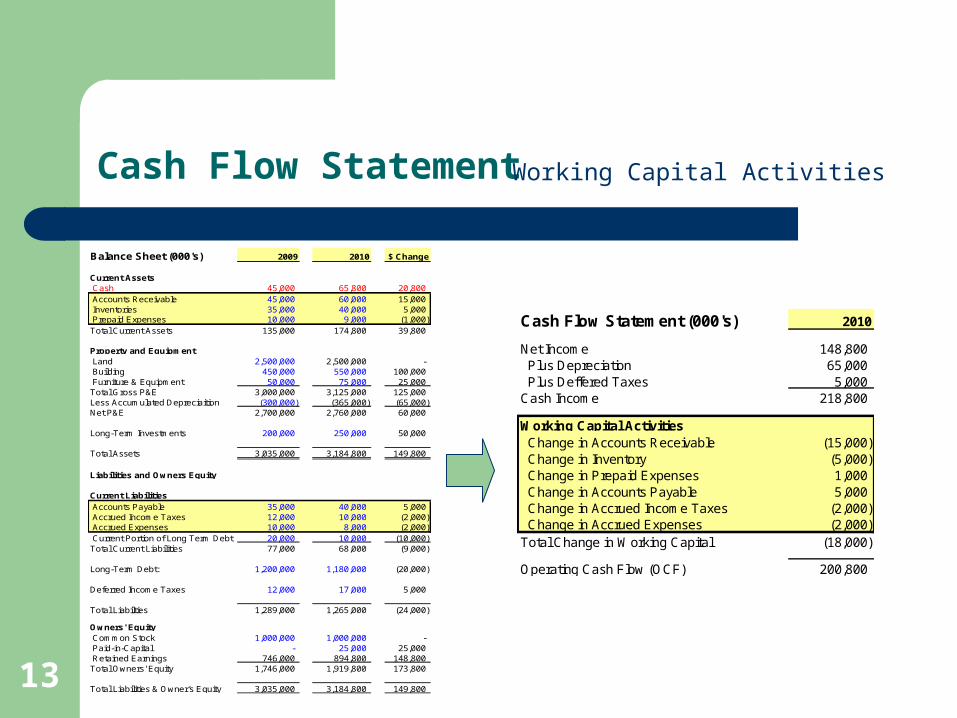
Cash Flow Statement
Balance Sheet (000's) 2009 2010 $ Change
Current Assets Cash 45,000 65,800 20,800 Accounts Receivable 45,000 60,000 15,000 Inventories 35,000 40,000 5,000 Prepaid Expenses 10,000 9,000 (1,000) Total Current Assets 135,000 174,800 39,800
Property and Equipment Land 2,500,000 2,500,000 - Building 450,000 550,000 100,000 Furniture & Equipment 50,000 75,000 25,000 Total Gross P&E 3,000,000 3,125,000 125,000 Less Accumulated Depreciaition (300,000) (365,000) (65,000) Net P&E 2,700,000 2,760,000 60,000
Long-Term Investments 200,000 250,000 50,000
Total Assets 3,035,000 3,184,800 149,800
Liabilities and Owners Equity
Current Liabilities Accounts Payable 35,000 40,000 5,000 Accrued Income Taxes 12,000 10,000 (2,000) Accrued Expenses 10,000 8,000 (2,000) Current Portion of Long Term Debt 20,000 10,000 (10,000) Total Current Liabilities 77,000 68,000 (9,000)
Long-Term Debt: 1,200,000 1,180,000 (20,000)
Deferred Income Taxes 12,000 17,000 5,000
Total Liabilties 1,289,000 1,265,000 (24,000)
Owners' Equity Common Stock 1,000,000 1,000,000 - Paid-in-Capital - 25,000 25,000 Retained Earnings 746,000 894,800 148,800 Total Owners' Equity 1,746,000 1,919,800 173,800
Total Liabilities & Owner's Equity 3,035,000 3,184,800 149,800
Cash Flow Statement (000's) 2010
Net Income 148,800 Plus Depreciation 65,000 Plus Deffered Taxes 5,000 Cash Income 218,800
Working Capital Activities Change in Accounts Receivable (15,000) Change in Inventory (5,000) Change in Prepaid Expenses 1,000 Change in Accounts Payable 5,000 Change in Accrued Income Taxes (2,000) Change in Accrued Expenses (2,000) Total Change in Working Capital (18,000)
Operating Cash Flow (OCF) 200,800
Working Capital Activities
14
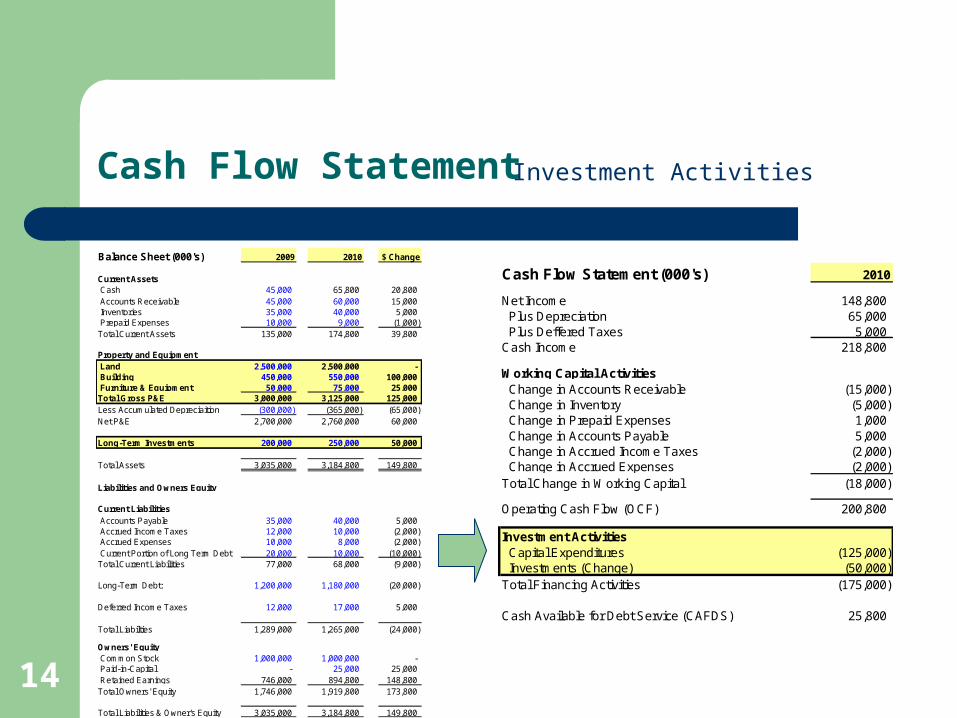
Cash Flow Statement Investment Activities
Cash Flow Statement (000's) 2010
Net Income 148,800 Plus Depreciation 65,000 Plus Deffered Taxes 5,000 Cash Income 218,800
Working Capital Activities Change in Accounts Receivable (15,000) Change in Inventory (5,000) Change in Prepaid Expenses 1,000 Change in Accounts Payable 5,000 Change in Accrued Income Taxes (2,000) Change in Accrued Expenses (2,000) Total Change in Working Capital (18,000)
Operating Cash Flow (OCF) 200,800
Investment Activities Capital Expenditures (125,000) Investments (Change) (50,000) Total Financing Activities (175,000)
Cash Available for Debt Service (CAFDS) 25,800
Balance Sheet (000's) 2009 2010 $ Change
Current Assets Cash 45,000 65,800 20,800 Accounts Receivable 45,000 60,000 15,000 Inventories 35,000 40,000 5,000 Prepaid Expenses 10,000 9,000 (1,000) Total Current Assets 135,000 174,800 39,800
Property and Equipment Land 2,500,000 2,500,000 - Building 450,000 550,000 100,000 Furniture & Equipment 50,000 75,000 25,000 Total Gross P&E 3,000,000 3,125,000 125,000 Less Accumulated Depreciaition (300,000) (365,000) (65,000) Net P&E 2,700,000 2,760,000 60,000
Long-Term Investments 200,000 250,000 50,000
Total Assets 3,035,000 3,184,800 149,800
Liabilities and Owners Equity
Current Liabilities Accounts Payable 35,000 40,000 5,000 Accrued Income Taxes 12,000 10,000 (2,000) Accrued Expenses 10,000 8,000 (2,000) Current Portion of Long Term Debt 20,000 10,000 (10,000) Total Current Liabilities 77,000 68,000 (9,000)
Long-Term Debt: 1,200,000 1,180,000 (20,000)
Deferred Income Taxes 12,000 17,000 5,000
Total Liabilties 1,289,000 1,265,000 (24,000)
Owners' Equity Common Stock 1,000,000 1,000,000 - Paid-in-Capital - 25,000 25,000 Retained Earnings 746,000 894,800 148,800 Total Owners' Equity 1,746,000 1,919,800 173,800
Total Liabilities & Owner's Equity 3,035,000 3,184,800 149,800
15
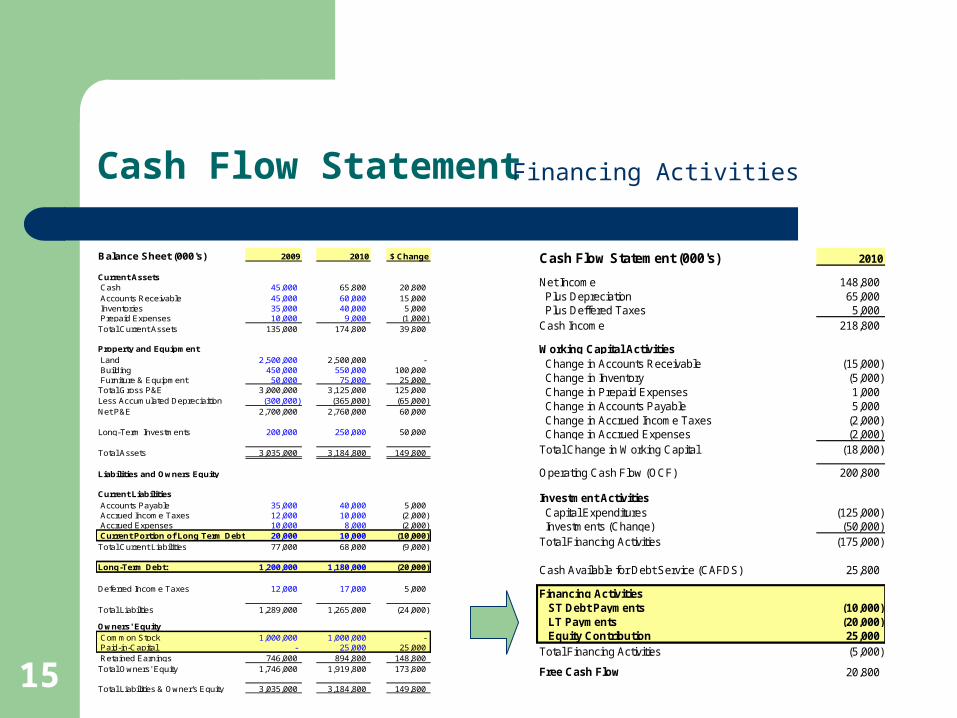
Cash Flow Statement Financing Activities
Balance Sheet (000's) 2009 2010 $ Change
Current Assets Cash 45,000 65,800 20,800 Accounts Receivable 45,000 60,000 15,000 Inventories 35,000 40,000 5,000 Prepaid Expenses 10,000 9,000 (1,000) Total Current Assets 135,000 174,800 39,800
Property and Equipment Land 2,500,000 2,500,000 - Building 450,000 550,000 100,000 Furniture & Equipment 50,000 75,000 25,000 Total Gross P&E 3,000,000 3,125,000 125,000 Less Accumulated Depreciaition (300,000) (365,000) (65,000) Net P&E 2,700,000 2,760,000 60,000
Long-Term Investments 200,000 250,000 50,000
Total Assets 3,035,000 3,184,800 149,800
Liabilities and Owners Equity
Current Liabilities Accounts Payable 35,000 40,000 5,000 Accrued Income Taxes 12,000 10,000 (2,000) Accrued Expenses 10,000 8,000 (2,000) Current Portion of Long Term Debt 20,000 10,000 (10,000) Total Current Liabilities 77,000 68,000 (9,000)
Long-Term Debt: 1,200,000 1,180,000 (20,000)
Deferred Income Taxes 12,000 17,000 5,000
Total Liabilties 1,289,000 1,265,000 (24,000)
Owners' Equity Common Stock 1,000,000 1,000,000 - Paid-in-Capital - 25,000 25,000 Retained Earnings 746,000 894,800 148,800 Total Owners' Equity 1,746,000 1,919,800 173,800
Total Liabilities & Owner's Equity 3,035,000 3,184,800 149,800
Cash Flow Statement (000's) 2010
Net Income 148,800 Plus Depreciation 65,000 Plus Deffered Taxes 5,000 Cash Income 218,800
Working Capital Activities Change in Accounts Receivable (15,000) Change in Inventory (5,000) Change in Prepaid Expenses 1,000 Change in Accounts Payable 5,000 Change in Accrued Income Taxes (2,000) Change in Accrued Expenses (2,000) Total Change in Working Capital (18,000)
Operating Cash Flow (OCF) 200,800
Investment Activities Capital Expenditures (125,000) Investments (Change) (50,000) Total Financing Activities (175,000)
Cash Available for Debt Service (CAFDS) 25,800
Financing Activities ST Debt Payments (10,000) LT Payments (20,000) Equity Contribution 25,000 Total Financing Activities (5,000)
Free Cash Flow 20,800
16
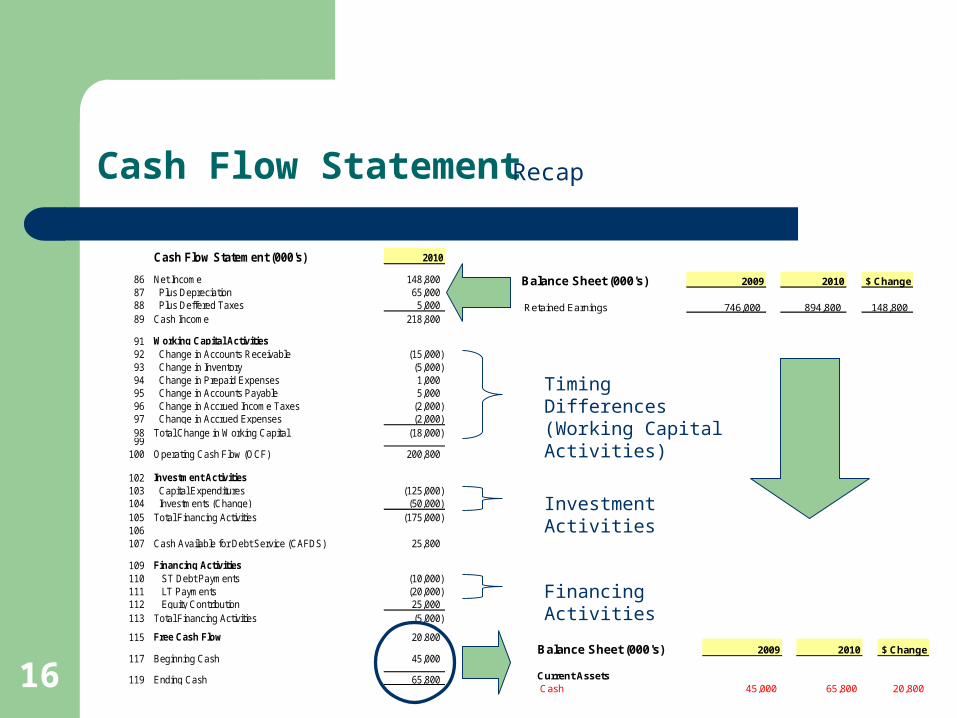
Cash Flow Statement
Cash Flow Statement (000's) 2010
86 Net Income 148,800 87 Plus Depreciation 65,000 88 Plus Deffered Taxes 5,000 89 Cash Income 218,800
91 Working Capital Activities92 Change in Accounts Receivable (15,000) 93 Change in Inventory (5,000) 94 Change in Prepaid Expenses 1,000 95 Change in Accounts Payable 5,000 96 Change in Accrued Income Taxes (2,000) 97 Change in Accrued Expenses (2,000) 98 Total Change in Working Capital (18,000) 99
100 Operating Cash Flow (OCF) 200,800
102 Investment Activities103 Capital Expenditures (125,000) 104 Investments (Change) (50,000) 105 Total Financing Activities (175,000) 106107 Cash Available for Debt Service (CAFDS) 25,800
109 Financing Activities110 ST Debt Payments (10,000) 111 LT Payments (20,000) 112 Equity Contribution 25,000 113 Total Financing Activities (5,000)
115 Free Cash Flow 20,800
117 Beginning Cash 45,000
119 Ending Cash 65,800
Balance Sheet (000's) 2009 2010 $ Change
Current Assets Cash 45,000 65,800 20,800
Balance Sheet (000's) 2009 2010 $ Change
Retained Earnings 746,000 894,800 148,800
Timing Differences (Working Capital Activities)
Investment Activities
Recap
Financing Activities
17
Financial Analysis
Management Discussion and Analysis (MD&A)
Equity & Bond Research – Wall Street Analysts
The Financial Statements could be used by analysts to project the Company’s performance and valuation
For an effective performance of the Company, you need to ask the three following questions:1. How is the Company doing versus Last Year2. How is the Company doing versus its competitors / piers/ market3. How is the Company doing versus expectations
18
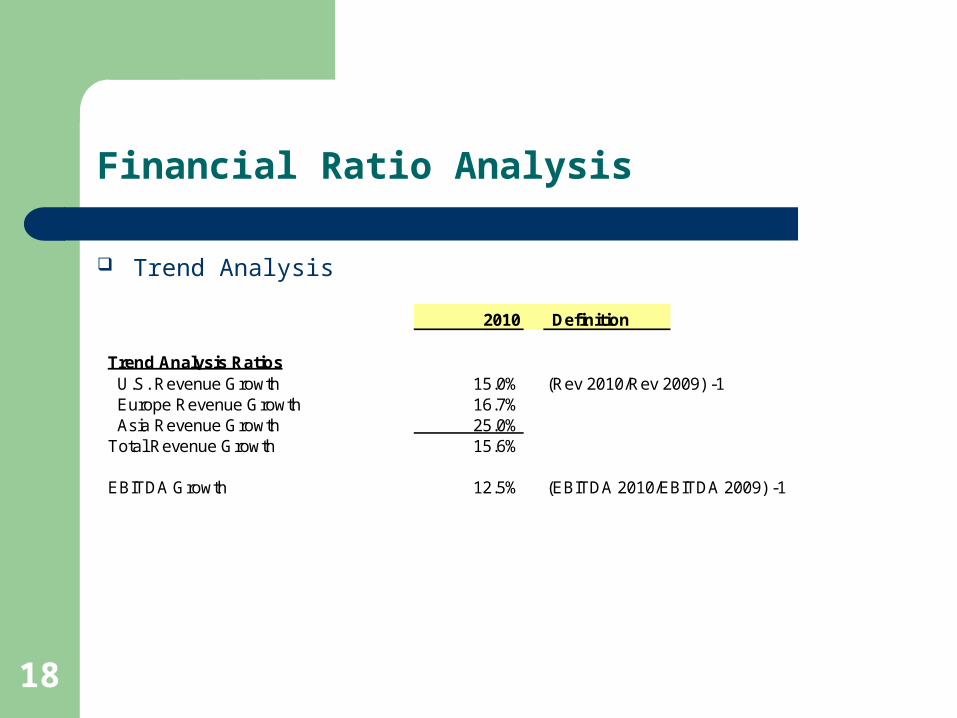
Financial Ratio Analysis
Trend Analysis
2010 Definition
Trend Analysis Ratios U.S. Revenue Growth 15.0% (Rev 2010/Rev 2009) -1 Europe Revenue Growth 16.7% Asia Revenue Growth 25.0%Total Revenue Growth 15.6%
EBITDA Growth 12.5% (EBITDA 2010/EBITDA 2009) -1
19
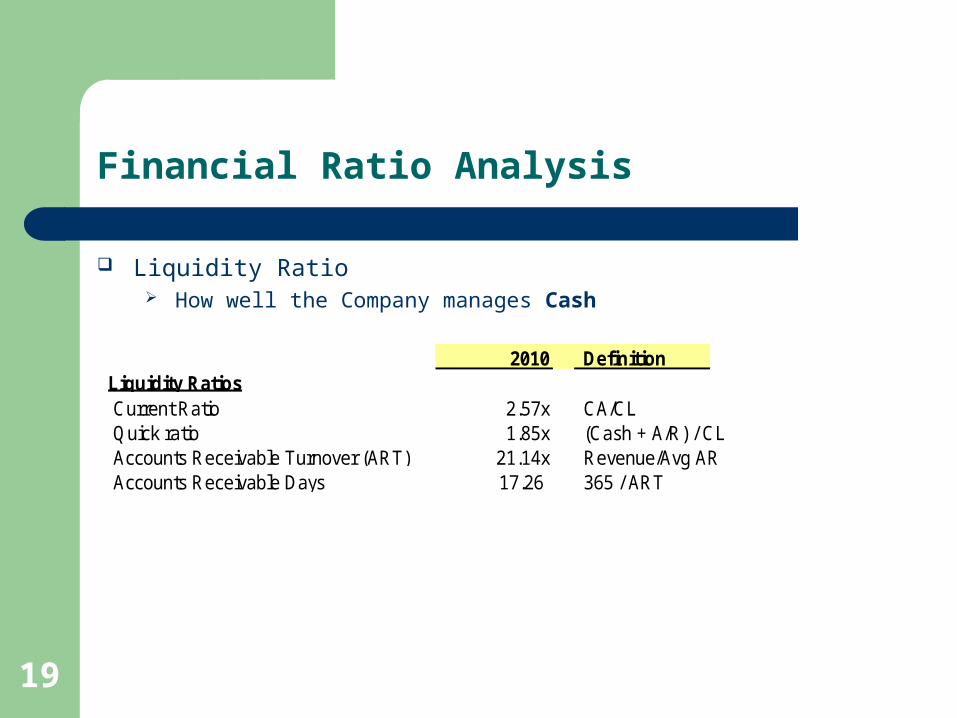
Financial Ratio Analysis
Liquidity Ratio How well the Company manages Cash
2010 DefinitionLiquidity Ratios Current Ratio 2.57x CA/CL Quick ratio 1.85x (Cash + A/R) / CL Accounts Receivable Turnover (ART) 21.14x Revenue/Avg AR Accounts Receivable Days 17.26 365 / ART
20
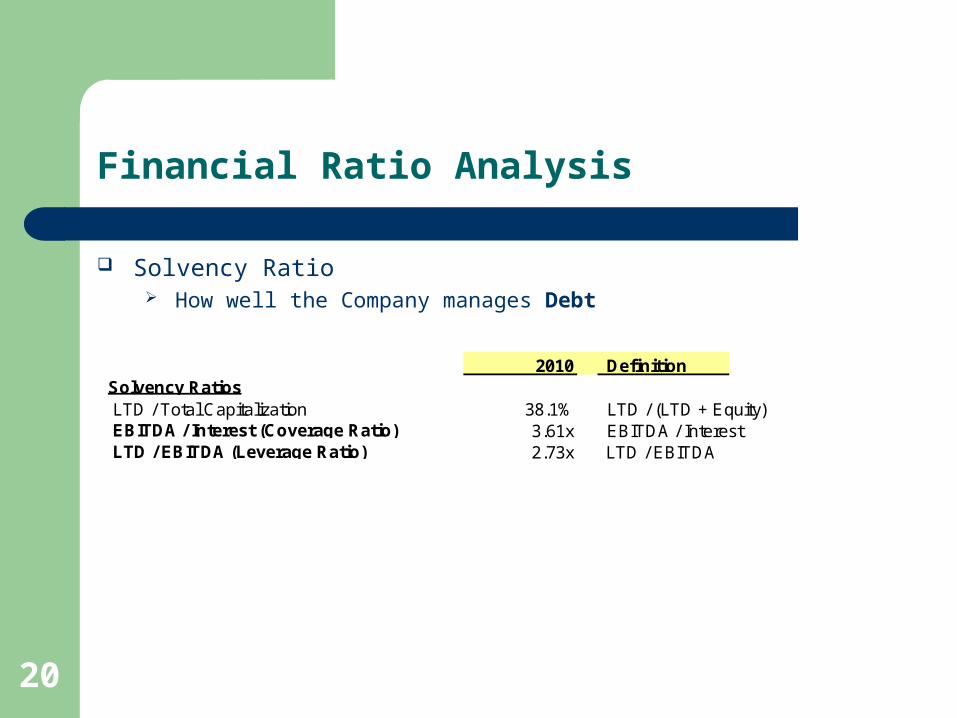
Financial Ratio Analysis
Solvency Ratio How well the Company manages Debt
2010 DefinitionSolvency Ratios LTD / Total Capitalization 38.1% LTD / (LTD + Equity) EBITDA / Interest (Coverage Ratio) 3.61x EBITDA / Interest LTD / EBITDA (Leverage Ratio) 2.73x LTD / EBITDA
21
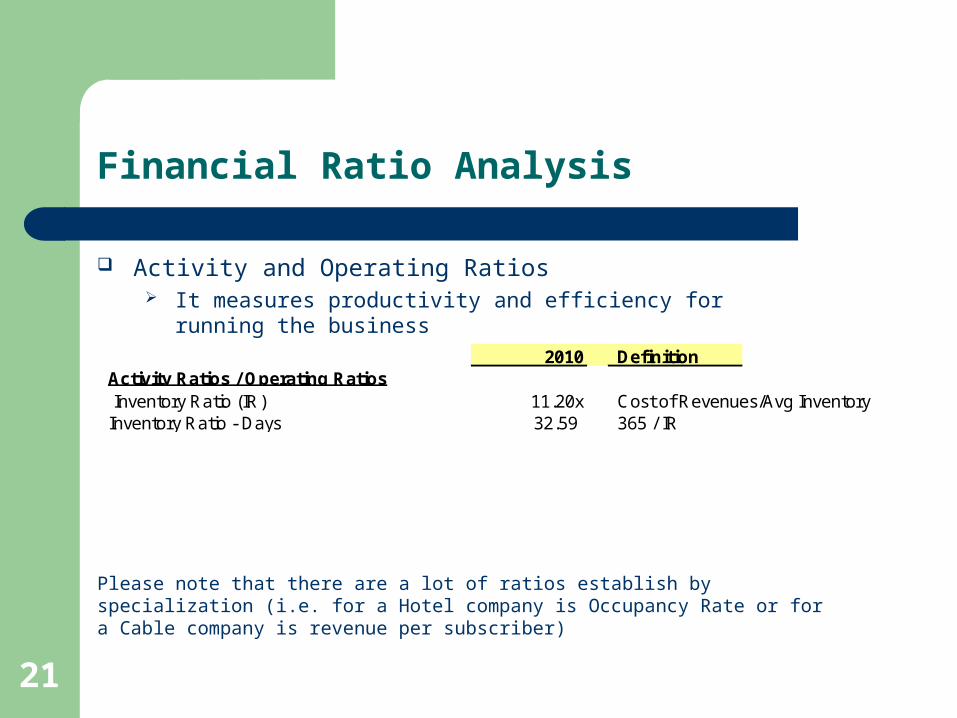
Financial Ratio Analysis
Activity and Operating Ratios It measures productivity and efficiency for running the business
2010 DefinitionActivity Ratios / Operating Ratios Inventory Ratio (IR) 11.20x Cost of Revenues/Avg InventoryInventory Ratio - Days 32.59 365 / IR
Please note that there are a lot of ratios establish by specialization (i.e. for a Hotel company is Occupancy Rate or for a Cable company is revenue per subscriber)
22
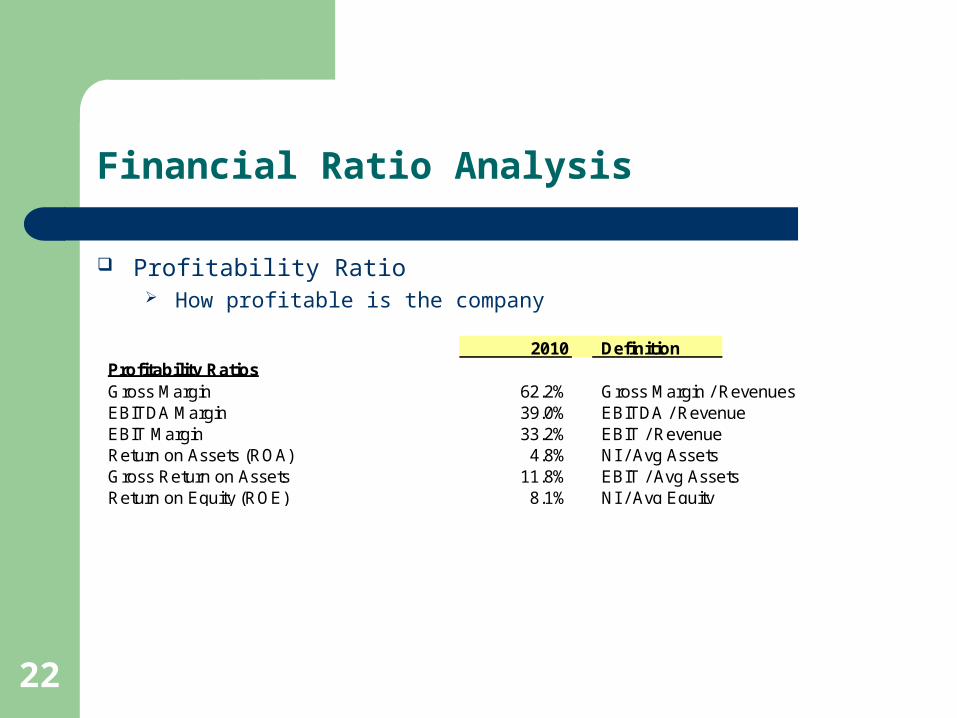
Financial Ratio Analysis
Profitability Ratio How profitable is the company
2010 DefinitionProfitability RatiosGross Margin 62.2% Gross Margin / RevenuesEBITDA Margin 39.0% EBITDA / RevenueEBIT Margin 33.2% EBIT / RevenueReturn on Assets (ROA) 4.8% NI / Avg AssetsGross Return on Assets 11.8% EBIT / Avg AssetsReturn on Equity (ROE) 8.1% NI / Avg Equity