Embed Size (px)
Citation preview
Budget StatementBudget Paper 3
Acknowledgements
Content from this publication may be reproduced with appropriate acknowledgement, as permitted under the Copyright Act 1968.
© Government of South Australia 2017
Budget Paper 1: Budget Overview A summary publication capturing all highlights from the 2017-18 Budget.
Budget Paper 2: Budget Speech
A copy of the Treasurer’s speech, delivered to Parliament.
Budget Paper 3: Budget Statement
A financial report presenting the state government’s current and estimated
future economic performance, fiscal strategy, budget priorities, expenditure,
revenue, assets, liabilities, risks and government business.
Budget Paper 4: Agency Statements | Volumes 1, 2, 3, 4 Various financial reports presenting the state government’s current and
estimated revenue, expenses and performance by agency.
Budget Paper 5: Budget Measures Statement A financial report detailing the state government’s expenditure,
savings and revenue initiatives.
Budget Paper 3
2017–18 Budget Statement
Presented by The Honourable Tom Koutsantonis MP
Treasurer of South Australia on the Occasion of the Budget
for 2017–18
General enquiries regarding budget papers should be directed to:
The Chief Executive Department of Treasury and Finance State Administration Centre 200 Victoria Square Adelaide SA 5000
Copies may be obtained from:
SERVICE SA Government Legislation Outlet Ground Floor EDS Centre 108 North Terrace Adelaide SA 5000
Website: www.treasury.sa.gov.au www.statebudget.sa.gov.au
Published 22 June 2017 ISSN 1440-8589
Contents
Chapter 1: Budget context and overview Budget context ................................................................................................................................... 3 Budget overview ................................................................................................................................ 4 Attachment: Variations since the 2016–17 Budget and the 2016–17 MYBR ............................... 14
Chapter 2: Expenditure New initiatives .................................................................................................................................. 21 General government operating expenditure ................................................................................... 27 General government investing expenditure .................................................................................... 36
Chapter 3: Revenue Overview .......................................................................................................................................... 39 General government sector revenue............................................................................................... 42 Taxation ........................................................................................................................................... 43 South Australia’s relative tax effort .................................................................................................. 50 Grant revenue .................................................................................................................................. 51 Sales of goods and services ........................................................................................................... 56 Interest income ................................................................................................................................ 57 Dividend and income tax equivalent income ................................................................................... 58 Other revenue .................................................................................................................................. 59 Annual fee and rate setting ............................................................................................................. 60 Developments in Commonwealth–state relations ........................................................................... 61
Chapter 4: Managing the state’s assets and liabilities Overview .......................................................................................................................................... 63 General government sector financial position ................................................................................. 63 Non-financial public sector financial position .................................................................................. 70 Debt management ........................................................................................................................... 72
Chapter 5: Government businesses Overview .......................................................................................................................................... 75 Financial arrangements and policy framework ............................................................................... 76 Public non-financial corporations — operating performance .......................................................... 77 Net debt ........................................................................................................................................... 82 Public financial corporations............................................................................................................ 84 Full-time equivalents ....................................................................................................................... 86
2017–18 Budget Statement 1
Chapter 6: Risk statement Overview .......................................................................................................................................... 87 Revenue risks .................................................................................................................................. 87 Expenditure risks ............................................................................................................................. 93 Contingent liabilities ........................................................................................................................ 97
Chapter 7: South Australian economy Overview ........................................................................................................................................ 101 South Australia’s recent economic performance .......................................................................... 101 Economic outlook .......................................................................................................................... 106
Chapter 8: Regional South Australia Overview ........................................................................................................................................ 109 Regional economic conditions ...................................................................................................... 109 South Australia’s economic priorities ............................................................................................ 112 Charter for stronger regional policy ............................................................................................... 116 Regional South Australia cabinet committee ................................................................................ 116 Regions South Australia ................................................................................................................ 117 Regional development portfolio programs .................................................................................... 118 Regional Enablers ......................................................................................................................... 119 Regional development Australia ................................................................................................... 121 2017–18 Budget — new initiatives ................................................................................................ 121 Regional investing expenditure ..................................................................................................... 123
Appendices Appendix A: Uniform presentation framework ............................................................................. 127 Appendix B: General government and non-financial public sector financial
statistics time series ................................................................................................ 151 Appendix C: Consolidated Account ............................................................................................. 161 Appendix D: South Australian state public sector organisations ................................................. 169 Appendix E: Tax expenditure statement ...................................................................................... 173 Glossary of terms used in the budget statement .......................................................................... 179
2 2017–18 Budget Statement
Chapter 1: Budget context and overview
Budget context
The 2017–18 Budget is about putting South Australians first. It focuses on creating jobs for the future, building energy security, modernising our health system and investing in our communities.
It builds on the foundations of the previous budgets which included tax cuts for businesses looking to invest in South Australia, assistance to firms that are looking to hire more people, and targeted support to attract new firms and industries to the state. Businesses will continue to benefit from these measures in 2017–18, with another instalment of stamp duty cuts delivered from 1 July 2017 and businesses who have applied for the Job Accelerator Grants starting to receive their payments on the first anniversary of employing additional workers.
We are building our future sustainable, long term industries. The $50 billion Future Submarines build at Techport will support thousands of jobs over the next three decades. The success of the government’s economic plan is being realised in the growth of our tourism and food industries, and the emergence of an invigorated health research industry.
The 2017–18 Budget provides further support for new industries through a $200 million Future Jobs Fund. As our car industry closes in October 2017, the Future Jobs Fund will help secure the jobs of the future in industries such as shipbuilding and defence, renewable energy and mining, tourism, food and wine, health and biomedical research and information technology and advanced manufacturing. The budget also provides additional payroll tax relief for small business, extra support for businesses to take on more apprentices and a record $2.2 billion infrastructure spend in 2017–18, creating construction jobs.
In response to the failure of national energy market policies, the government is investing $550 million to secure our energy future. This includes building a 250 megawatt back-up gas power plant owned by the state, building a 100 megawatt grid-connected battery and establishing a Renewable Technology Fund to facilitate investment in new low carbon energy technologies.
The 2017–18 Budget makes significant investments in our communities through modernising our health infrastructure, building new schools and continuing to invest in improving our transport infrastructure. It also delivers back to South Australians with one of the world’s biggest participatory budgeting initiatives, Fund My Neighbourhood, which allows the community to direct how public funds are spent.
These measures are possible because of the flexibility afforded by the sustainable budget position the government has maintained in recent years. The government is expecting to deliver a second successive operating surplus in 2016–17 and maintain operating surpluses across the forward estimates.
2017–18 Budget Statement 3
Budget overview
Supporting our economy
The government is creating a $200 million Future Jobs Fund to support business and create jobs across the following five sectors:
• shipbuilding and defence
• renewable energy and mining
• tourism, food and wine
• health and biomedical research
• information technology and advanced manufacturing.
The fund includes $100 million in grants and $100 million in loans.
Specific Future Jobs Fund measures announced in the 2017–18 Budget include:
• additional funding to support the attraction of business and industry to the state to promote job creation ($30 million in grants and $30 million in loans)
• additional funding to secure additional major events and conventions for South Australia ($14.5 million over four years)
• funding for the automotive supplier transformation initiative ($5 million over two years) to support automotive supply chain businesses in the transition from motor vehicle parts manufacturing
• extension of the I Choose SA campaign to 30 June 2018 ($2 million in 2017–18) to encourage South Australians to support local products and services to create and sustain jobs.
After funding these specific initiatives, the remainder of the $200 million Future Jobs Fund ($50 million in grants and $70 million in loans) is available for businesses and organisations to bid for grants or low cost loans to create jobs in the target industry sectors. The government will be seeking the Commonwealth Government to match the state’s commitment to the Fund to help more businesses build key industries in South Australia.
The government will also increase the Jobs Accelerator Grant by up to $5000 for each eligible new apprentice or trainee employed. This means businesses with payrolls between $600 000 and $5 million will receive up to $15 000 for each new apprentice and trainee, while small businesses with payrolls up to $600 000 will receive up to $9000, providing additional funding for an estimated 2000 apprentice and trainee positions.
Building on the business tax cuts of almost $700 million announced in the state tax reform package included in the 2015–16 Budget, the 2017–18 Budget includes further payroll tax relief ($45 million over four years) for small businesses. The previous small business payroll tax rebate will be replaced by reduced payroll tax rates for small business and the concessional arrangements extended to businesses with an annual payroll of up to $1.5 million. It is estimated that around 1300 employers will benefit by up to $8820 from this initiative each year compared with the prior small business payroll tax rebate.
The government will extend off-the-plan apartment assistance at a cost of $8.4 million over three years with the state-wide stamp duty concession extended for a further year until 30 June 2018. An additional $10 000 pre-construction grant will be available for off-the-plan contracts entered into from budget day to 30 September 2017 for apartment purchases where construction is yet to commence.
Chapter 1: Budget context and overview
4 2017–18 Budget Statement
The government is contributing towards the $156 million stage 1 Northern Adelaide Irrigation Scheme (NAIS) project, if the Commonwealth contributes $46 million towards the project. NAIS will increase horticultural activity with the expansion of irrigated food production in the Northern Adelaide Plains.
Investing in our health system
The opening of the new Royal Adelaide Hospital represents a milestone in the delivery of a modern health system, and will provide a capacity of 800 beds and provide care for an estimated 85 000 inpatients and 400 000 outpatients each year.
As the new Royal Adelaide Hospital opens, the 2017–18 Budget provides a further $1.1 billion for the health sector including for further investment and modernisation of our health infrastructure through:
• the construction of a new Adelaide Women’s Hospital ($528 million in total including $30 million over the forward estimates) adjoining the new Royal Adelaide Hospital, to be completed in 2024
• the redevelopment of the Queen Elizabeth Hospital ($251 million in total including $198 million over the forward estimates) for a new clinical building which includes the emergency department, outpatient services, operating theatres, clinical support and brain and spinal injury rehabilitation
• the expansion of the Lyell McEwin Hospital emergency department ($53 million over four years) to address ongoing patient demand
• $44 million over three years towards a second SAHMRI building within South Australia’s world class Health and Biomedical Precinct to house a national centre for proton therapy and research. This includes shifting the existing train operation control centre off the site
• $24 million over the forward estimates for the maintenance and improvement of facilities at the existing Women’s and Children’s Hospital
• the establishment of an eight-bed emergency extended care unit adjacent the emergency department at Modbury Hospital ($9 million over three years)
• the provision of 24 hour emergency care ($7 million over four years) at the Mount Barker District and Soldiers’ Memorial Hospital, providing people living in Mount Barker and surrounding communities, such as Strathalbyn, with access to a fully staffed accident and emergency department
• the fit out of two existing cold shell operating theatres at Flinders Medical Centre ($3.5 million in 2017–18) increasing the number of operating theatres to a total of 12.
This budget also provides $195 million in extra resources for our health system over three years to fund additional hospital services to South Australians.
The creation of the Stop the Hurt Strategy ($8 million over four years) will tackle crystal methamphetamine use through measures to address prevention, early intervention, treatment and law enforcement outcomes for the community.
The government will commit $15 million over two years towards the development of alternative accommodation to relocate patients from the Oakden Older Persons Mental Health Service and to support the development of a contemporary model of care and longer term service planning for older patients who suffer from acute dementia and other mental illness.
Investing in our communities
Last year’s budget committed $250 million to build STEM classrooms in 139 of the state’s public schools. The 2017–18 Budget announces two new birth to Year 12 schools in the northern and southern regions of Adelaide to be built as public-private partnerships. Each school will accommodate 1400 R–12 students, 100 special school students and a 55-place children’s centre.
Chapter 1: Budget context and overview
2017–18 Budget Statement 5
The government has also dedicated $40 million towards the Fund My Neighbourhood program to allow the community to decide what projects should be funded within their neighbourhood, from small infrastructure upgrades such as playgrounds and parks to initiatives designed to strengthen community cohesion.
Additional new measures that focus on building our communities include:
• grant funding for sporting clubs ($20 million over two years) to upgrade or replace synthetic playing surfaces across South Australia
• marine facility infrastructure ($9 million over two years) to ensure the ongoing safety and longevity of jetties at Henley Beach, Port Noarlunga, Semaphore, Whyalla and Port Bonython
• creation of a Community Infrastructure Investment Fund ($5 million in 2017–18) to provide funding for multicultural and community organisations to purchase or upgrade equipment and infrastructure.
The 2017–18 Budget also provides $14 million for the Women’s Sporting Facilities Fund to support sport and recreation organisations in addressing barriers to female participation and $4.5 million for stage one of the upgrade of Priceline Stadium, the home of Netball SA.
Investing in transport
The 2017–18 Budget includes a record $2.2 billion infrastructure program in 2017–18 and $674 million in new measures as part of South Australia's Transport Plan (which are subject to Commonwealth Government funding contributions):
• the next stage of the North-South Corridor ($415 million over three years) from Regency Road to Pym Street to provide the final part of the continuous motorway from the Northern Expressway to the River Torrens
• Gawler rail line electrification ($243 million over the forward estimates for a total project cost of $463 million) to continue the existing electrification works by extending it from Salisbury to Gawler including replacement of the signalling system, provision of automatic track protection and the acquisition of 15 additional three car electric trains
The government is also providing $174 million over three years (including $95 million from the Commonwealth Government) to upgrade the Oaklands Crossing with a rail underpass under Diagonal Road.
In addition, the government will provide $305 million (with $100 million across the forward estimates) to duplicate Main South Road from Seaford to Aldinga as the first stage of the Main South Road Duplication project. The second stage will continue the duplication works from Aldinga to Sellicks Beach.
Further investments in improving our public transport system include $15 million over two years for the construction of new, multi-level Park 'n' Ride facilities at the Klemzig and Tea Tree Plaza interchanges, and an additional $22 million over four years to increase train service frequency on the Gawler, Outer Harbor, Belair and Seaford lines, including on nights, weekends and public holidays.
Taking charge of our energy future
The government released Our Energy Plan in March 2017 in response to the failure of the national energy market in providing energy security for South Australians.
Chapter 1: Budget context and overview
6 2017–18 Budget Statement
The government is investing $550 million across five years to secure South Australia’s energy supply, which includes the following measures:
• $360 million for a state-owned gas power plant to provide up to 250 megawatts of stand-by generation which can be switched on in times of emergency
• $150 million Renewable Technology Fund which will help build Australia’s largest grid-connected battery to provide the state with 100 megawatts of storage, and also provide loans to private companies and entrepreneurs for eligible projects such as large-scale solar thermal, biomass, hydrogen energy and pumped hydro project
• $24 million for Plan for Accelerating Exploration (PACE) for a second round of funding to incentivise companies to increase the supply of South Australian gas into the local energy market.
In addition to Our Energy Plan, the government is announcing in this budget:
• the first stage of the hydrogen roadmap — a hydrogen production facility and vehicle refuelling station ($8 million over four years) supplying a fleet of at least six hydrogen buses
• funding for a mineral drilling program ($5 million over four years) to deliver ground-breaking data and information through new drilling technologies, innovations in geophysics and modelling and the mapping of geochemistry in 3D.
Managing our budget
The 2017–18 Commonwealth Budget introduced a major bank levy imposing a levy at a rate of 0.015 per cent per quarter on certain liabilities of authorised deposit-taking institutions with total liabilities greater than $100 billion.
From 1 July 2017, the government will introduce a South Australian major bank levy.
Authorised deposit-taking institutions that are liable for the Commonwealth Government’s major bank levy and operate in South Australia will be liable for the state levy. An identical rate of 0.015 per cent per quarter will be charged on South Australia’s share of liabilities subject to the Commonwealth Government’s major bank levy. This share will be determined by South Australia’s share of the national economy, which currently is around 6 per cent.
This measure is expected to raise $370 million across four years.
The government will also introduce a conveyance duty surcharge on foreign buyers of residential property in South Australia.
From 1 January 2018, a surcharge of 4 per cent will apply to all residential property purchases by foreign buyers and temporary residents. This measure is consistent with similar surcharges levied on foreign buyers of certain property in New South Wales, Victoria and Queensland, and Western Australia has also indicated that it will introduce a surcharge from 2019. This measure is expected to raise $49 million across four years.
Chapter 1: Budget context and overview
2017–18 Budget Statement 7
Fiscal targets
Delivering the measures that support the government’s economic and community priorities while maintaining a sustainable fiscal position requires the government to operate within a well-defined fiscal strategy. The government’s fiscal targets are set out in table 1.1 below.
Table 1.1: Fiscal targets
Target 1 Achieve a net operating surplus in the general government sector every year.
Target 2 Limit general government operating expenditure growth to trend growth in household income.
Target 3 Achieve a level of general government net debt that remains affordable over the forward estimates — a maximum ratio of net debt to revenue of 35 per cent.
Underpinning the three main fiscal targets, the government also continues its commitments that:
• the operations of public corporations that cannot be paid for from their own revenue streams will be funded from the budget (consistent with the government’s obligations under the Competition Principles Agreement)
• the defined benefit unfunded superannuation liability will be fully funded by 2034.
Table 1.2 shows that the 2017–18 Budget meets the government’s fiscal targets.
Table 1.2: Fiscal targets outcomes — 2017–18 Budget estimates
2017–18 Budget
2018–19 Estimate
2019–20 Estimate
2020–21 Estimate
Target 1: net operating balance surplus Target Achieve a net operating surplus every year 2017–18 Budget estimate ($m) 72 132 193 462
Target 2: operating expenditure growth
Target (%) Average growth limited to trend growth in household income (4.5% per annum)
2017–18 Budget estimate (%)
– Annual (%) 5.8% 0.5% 1.0% 1.9%
– Average (%) Average growth of 2.3% per annum
Target 3: net debt to revenue ratio Target (%) Less than 35% 2017–18 Budget estimate (%) 31.7% 34.9% 34.8% 33.1%
Target 1 reflects the government’s commitment to funding operating expenditures from operating revenues. The 2017–18 Budget projects a surplus in 2017–18 and in each year across the forward estimates. Compared with last year’s budget, the surplus outlook reflects the use of fiscal buffers to support the economy and take charge of our energy security.
Target 2 limits the growth in operating expenditure in order to maintain a pattern of sustainable growth having regard to trend income growth, irrespective of the annual growth in revenues, including during the expansionary phase of the cycle. The 2017–18 Budget continues the emphasis on expenditure restraint to maintain the overall fiscal position. Average operating expenditure growth over four years is constrained to 2.3 per cent per annum, well below expected trend household income growth of 4.5 per cent per annum. In 2017–18, operating expenditure growth of 5.8 per cent reflects the impact of one-off items such as the commencement of service payments (including associated interest charges and amortisation) for the new Royal Adelaide Hospital and additional resources provided for child protection in response to the Child Protection Systems Royal Commission. Without these one-off
Chapter 1: Budget context and overview
8 2017–18 Budget Statement
factors, growth in expenses would be 3.2 per cent in 2017–18. Refer to chapter 2 for more details on expenditure.
Target 3 requires the maintenance of reasonable debt levels that allows for sustainable borrowings for investment in key infrastructure without placing undue burdens on future generations. This target is met across all forward estimate years.
The government is also on target to fully fund the state’s defined benefit superannuation liability by 2034. Further information on the state’s unfunded superannuation liability can be found in chapter 4.
Summary of key fiscal indicators
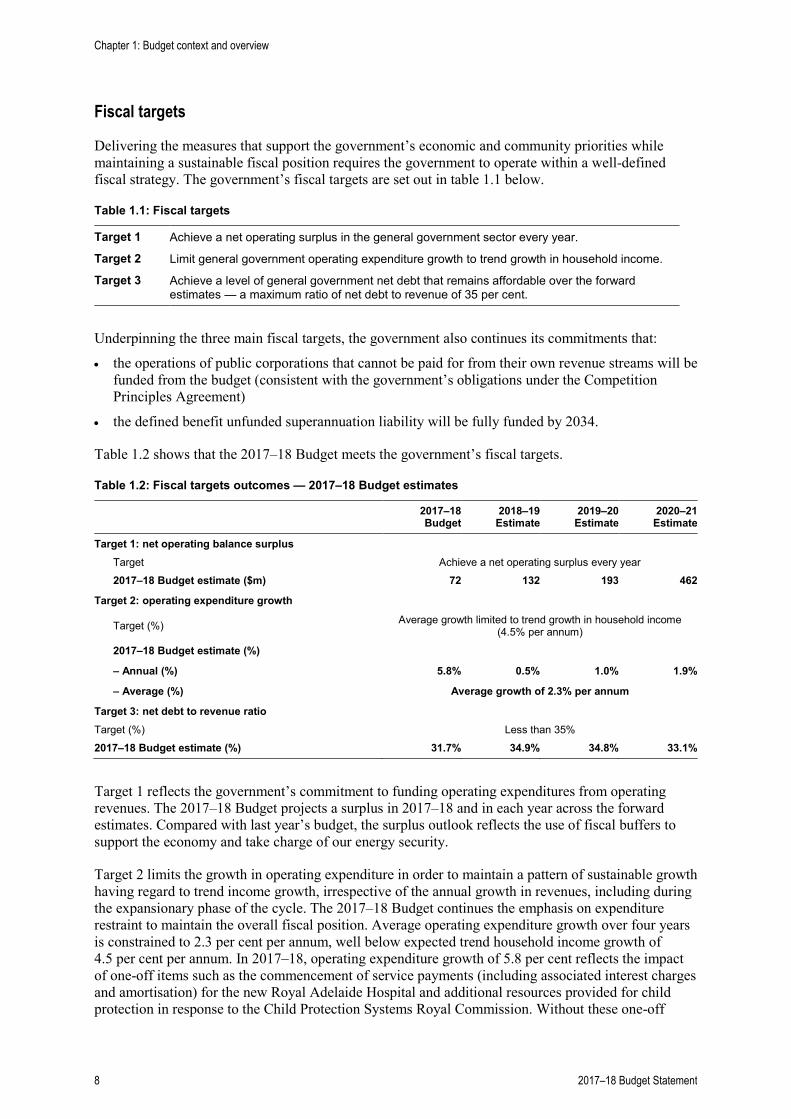
Table 1.3 sets out the expected budget outcomes for 2016–17 and across the forward estimates for a number of key fiscal indicators.
Table 1.3: Summary of key general government sector budget indicators
2016–17 Estimated
Result
2017–18 Budget
2018–19
Estimate
2019–20
Estimate
2020–21
Estimate
Operating statement Net operating balance ($m) 239 72 132 193 462 Net lending ($m) -2 595 228 -685 -203 72 Revenue and expenses
Revenue real growth (%) 3.7 2.8 -1.4 -1.2 0.8 Expenses real growth (%) 4.1 3.7 -1.7 -1.5 -0.5 Balance sheet
Net debt ($m) 6 297 6 072 6 733 6 808 6 687 Net debt to revenue (%) 34.5 31.7 34.9 34.8 33.1 Unfunded superannuation ($m) 11 217 10 898 10 547 10 164 9 748
Note: Adelaide Consumer Price Index used for real-terms calculations.
Operating statement
Net operating balance A net operating surplus is forecast in 2016–17 and each year across the forward estimates with projected cumulative net operating surpluses of $1.1 billion over the five years.
Figure 1.1 illustrates the general government sector net operating balance and net lending position from 1998–99 to 2020–21. The 2016–17 estimated result represents a second successive surplus following five years of deficits post the global financial crisis.
Chapter 1: Budget context and overview
2017–18 Budget Statement 9
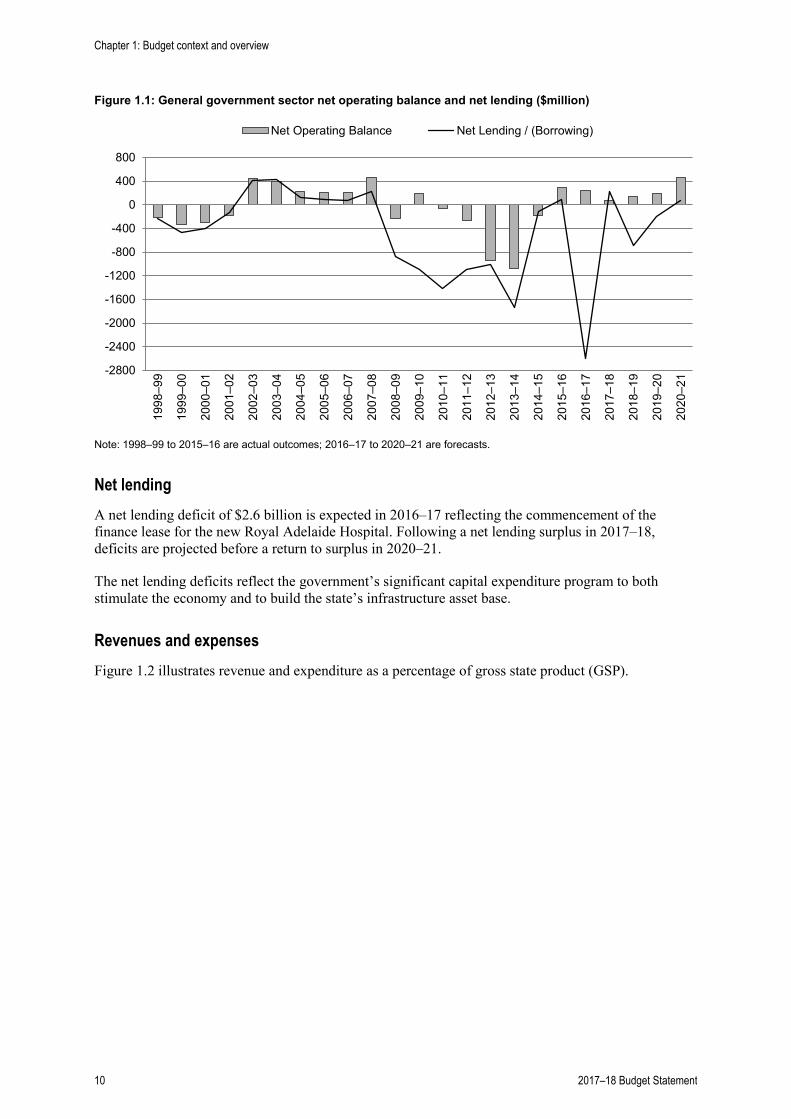
Figure 1.1: General government sector net operating balance and net lending ($million)
Note: 1998–99 to 2015–16 are actual outcomes; 2016–17 to 2020–21 are forecasts.
Net lending A net lending deficit of $2.6 billion is expected in 2016–17 reflecting the commencement of the finance lease for the new Royal Adelaide Hospital. Following a net lending surplus in 2017–18, deficits are projected before a return to surplus in 2020–21.
The net lending deficits reflect the government’s significant capital expenditure program to both stimulate the economy and to build the state’s infrastructure asset base.
Revenues and expenses Figure 1.2 illustrates revenue and expenditure as a percentage of gross state product (GSP).
-2800
-2400
-2000
-1600
-1200
-800
-400
0
400
80019
98–9
9
1999
–00
2000
–01
2001
–02
2002
–03
2003
–04
2004
–05
2005
–06
2006
–07
2007
–08
2008
–09
2009
–10
2010
–11
2011
–12
2012
–13
2013
–14
2014
–15
2015
–16
2016
–17
2017
–18
2018
–19
2019
–20
2020
–21
Net Operating Balance Net Lending / (Borrowing)
Chapter 1: Budget context and overview
10 2017–18 Budget Statement
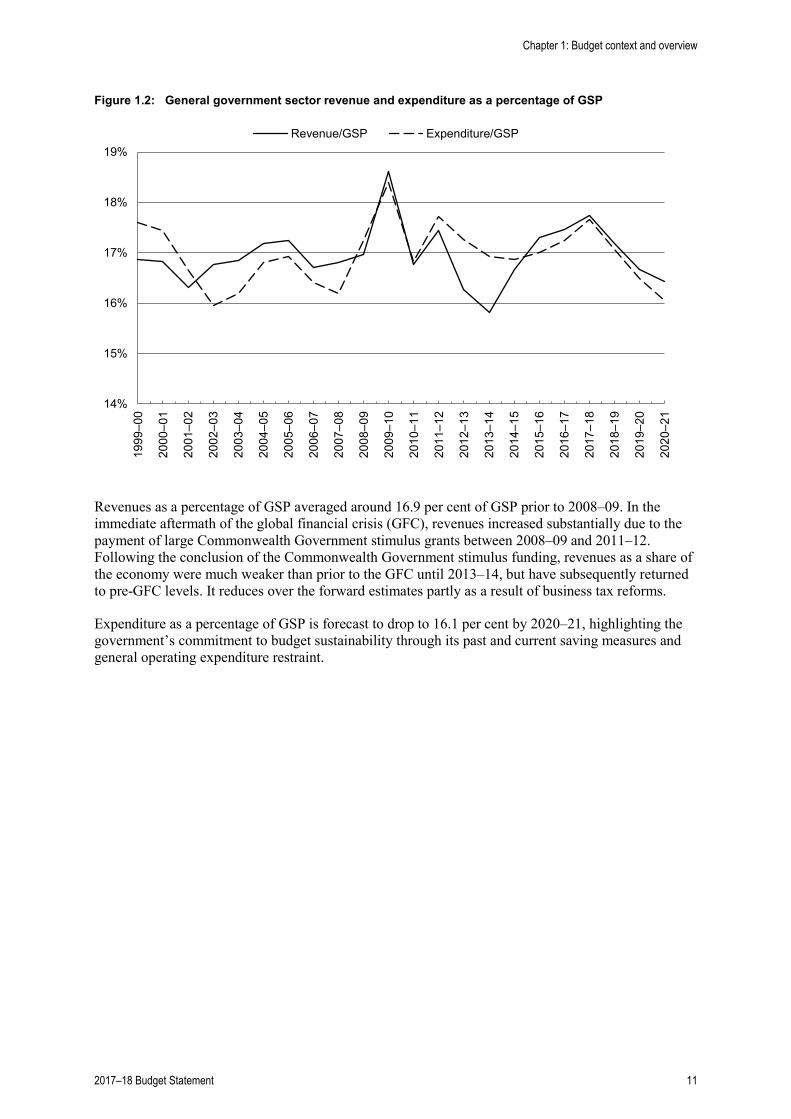
Figure 1.2: General government sector revenue and expenditure as a percentage of GSP
Revenues as a percentage of GSP averaged around 16.9 per cent of GSP prior to 2008–09. In the immediate aftermath of the global financial crisis (GFC), revenues increased substantially due to the payment of large Commonwealth Government stimulus grants between 2008–09 and 2011–12. Following the conclusion of the Commonwealth Government stimulus funding, revenues as a share of the economy were much weaker than prior to the GFC until 2013–14, but have subsequently returned to pre-GFC levels. It reduces over the forward estimates partly as a result of business tax reforms.
Expenditure as a percentage of GSP is forecast to drop to 16.1 per cent by 2020–21, highlighting the government’s commitment to budget sustainability through its past and current saving measures and general operating expenditure restraint.
14%
15%
16%
17%
18%
19%19
99–0
0
2000
–01
2001
–02
2002
–03
2003
–04
2004
–05
2005
–06
2006
–07
2007
–08
2008
–09
2009
–10
2010
–11
2011
–12
2012
–13
2013
–14
2014
–15
2015
–16
2016
–17
2017
–18
2018
–19
2019
–20
2020
–21
Revenue/GSP Expenditure/GSP
Chapter 1: Budget context and overview
2017–18 Budget Statement 11
Balance sheet
Net debt Net debt is expected to increase moderately over the forward estimates from $6.3 billion as at 30 June 2017 to $6.7 billion at 30 June 2021. This increase in net debt reflects the government’s decision to invest in infrastructure to support improved services to the community, create jobs and secure our energy future.
As a percentage of revenue, net debt is expected to increase from 31.7 per cent at 30 June 2018 to a peak of 34.9 per cent at 30 June 2019, before reducing to 33.1 per cent by the end of the forward estimates at 30 June 2021, within the government’s fiscal target of a maximum ratio of 35 per cent.
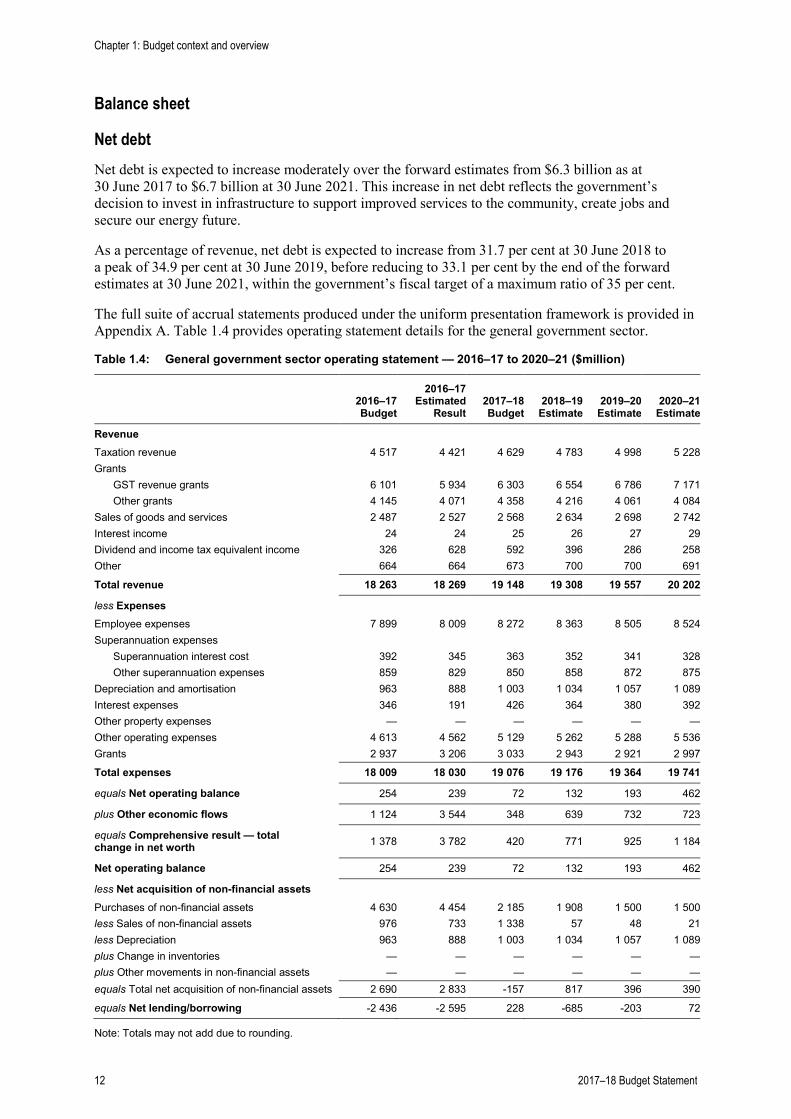
The full suite of accrual statements produced under the uniform presentation framework is provided in Appendix A. Table 1.4 provides operating statement details for the general government sector.
Table 1.4: General government sector operating statement — 2016–17 to 2020–21 ($million)
2016–17 Budget
2016–17 Estimated
Result
2017–18 Budget
2018–19
Estimate
2019–20
Estimate
2020–21
Estimate
Revenue Taxation revenue 4 517 4 421 4 629 4 783 4 998 5 228 Grants GST revenue grants 6 101 5 934 6 303 6 554 6 786 7 171 Other grants 4 145 4 071 4 358 4 216 4 061 4 084 Sales of goods and services 2 487 2 527 2 568 2 634 2 698 2 742 Interest income 24 24 25 26 27 29 Dividend and income tax equivalent income 326 628 592 396 286 258 Other 664 664 673 700 700 691
Total revenue 18 263 18 269 19 148 19 308 19 557 20 202
less Expenses Employee expenses 7 899 8 009 8 272 8 363 8 505 8 524 Superannuation expenses Superannuation interest cost 392 345 363 352 341 328 Other superannuation expenses 859 829 850 858 872 875 Depreciation and amortisation 963 888 1 003 1 034 1 057 1 089 Interest expenses 346 191 426 364 380 392 Other property expenses — — — — — — Other operating expenses 4 613 4 562 5 129 5 262 5 288 5 536 Grants 2 937 3 206 3 033 2 943 2 921 2 997
Total expenses 18 009 18 030 19 076 19 176 19 364 19 741
equals Net operating balance 254 239 72 132 193 462
plus Other economic flows 1 124 3 544 348 639 732 723
equals Comprehensive result — total change in net worth 1 378 3 782 420 771 925 1 184
Net operating balance 254 239 72 132 193 462
less Net acquisition of non-financial assets Purchases of non-financial assets 4 630 4 454 2 185 1 908 1 500 1 500 less Sales of non-financial assets 976 733 1 338 57 48 21 less Depreciation 963 888 1 003 1 034 1 057 1 089 plus Change in inventories — — — — — — plus Other movements in non-financial assets — — — — — — equals Total net acquisition of non-financial assets 2 690 2 833 -157 817 396 390
equals Net lending/borrowing -2 436 -2 595 228 -685 -203 72
Note: Totals may not add due to rounding.
Chapter 1: Budget context and overview
12 2017–18 Budget Statement
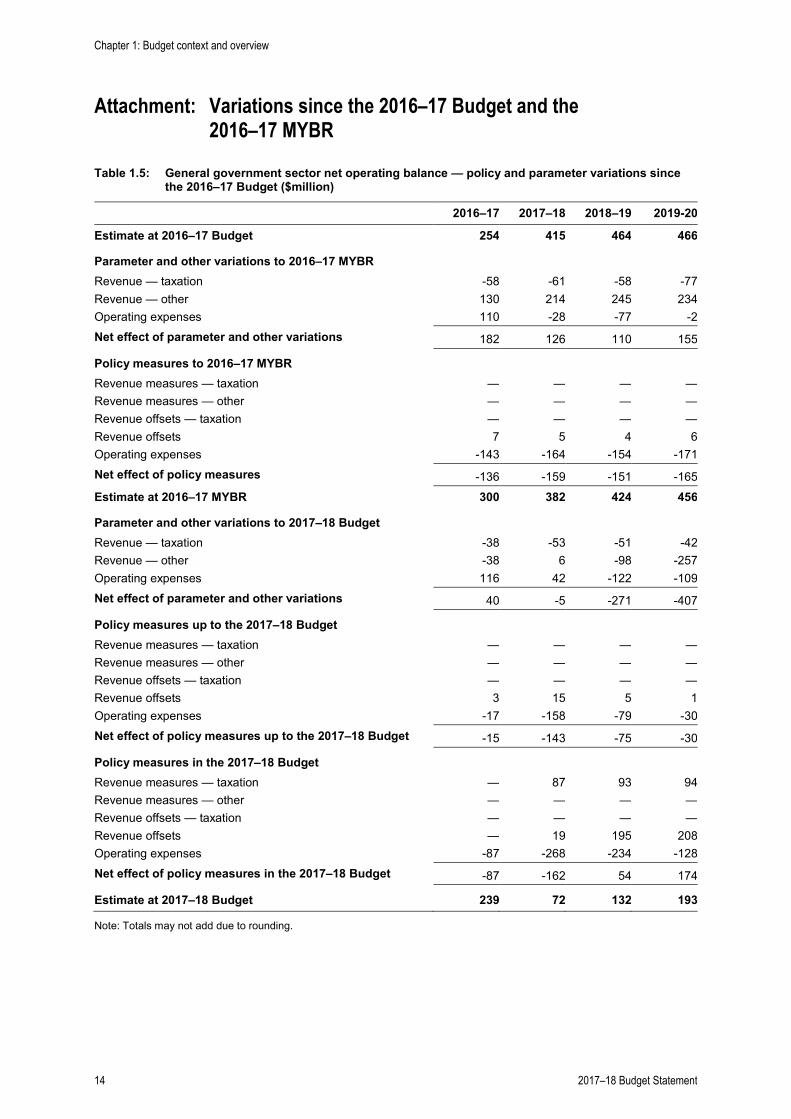
The attachment to this chapter summarises the variations since the 2016–17 Budget to the general government net operating balance (table 1.5) and net lending estimates (table 1.6).
The attachment also summarises the variations to revenue, expenses and capital investment expenditure since the 2016–17 Mid-Year Budget Review (MYBR) (table 1.7), together with some commentary on those variations.
Chapter 1: Budget context and overview
2017–18 Budget Statement 13
Attachment: Variations since the 2016–17 Budget and the 2016–17 MYBR
Table 1.5: General government sector net operating balance — policy and parameter variations since the 2016–17 Budget ($million)
2016–17 2017–18 2018–19 2019-20
Estimate at 2016–17 Budget 254 415 464 466
Parameter and other variations to 2016–17 MYBR Revenue — taxation -58 -61 -58 -77
Revenue — other 130 214 245 234 Operating expenses 110 -28 -77 -2 Net effect of parameter and other variations 182 126 110 155
Policy measures to 2016–17 MYBR Revenue measures — taxation — — — —
Revenue measures — other — — — — Revenue offsets — taxation — — — — Revenue offsets 7 5 4 6 Operating expenses -143 -164 -154 -171 Net effect of policy measures -136 -159 -151 -165 Estimate at 2016–17 MYBR 300 382 424 456
Parameter and other variations to 2017–18 Budget Revenue — taxation -38 -53 -51 -42
Revenue — other -38 6 -98 -257 Operating expenses 116 42 -122 -109 Net effect of parameter and other variations 40 -5 -271 -407
Policy measures up to the 2017–18 Budget Revenue measures — taxation — — — —
Revenue measures — other — — — — Revenue offsets — taxation — — — — Revenue offsets 3 15 5 1 Operating expenses -17 -158 -79 -30 Net effect of policy measures up to the 2017–18 Budget -15 -143 -75 -30
Policy measures in the 2017–18 Budget Revenue measures — taxation — 87 93 94
Revenue measures — other — — — — Revenue offsets — taxation — — — — Revenue offsets — 19 195 208 Operating expenses -87 -268 -234 -128 Net effect of policy measures in the 2017–18 Budget -87 -162 54 174
Estimate at 2017–18 Budget 239 72 132 193
Note: Totals may not add due to rounding.
Chapter 1: Budget context and overview
14 2017–18 Budget Statement
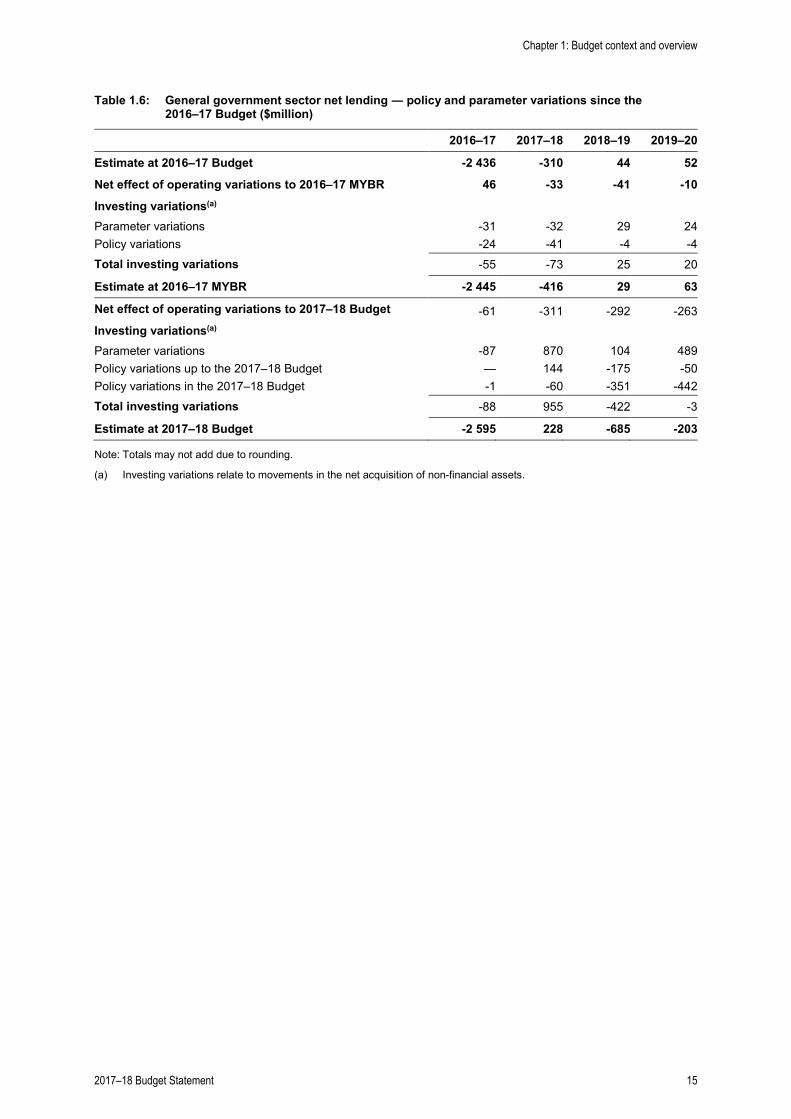
Table 1.6: General government sector net lending ― policy and parameter variations since the 2016–17 Budget ($million)
2016–17 2017–18 2018–19 2019–20
Estimate at 2016–17 Budget -2 436 -310 44 52
Net effect of operating variations to 2016–17 MYBR 46 -33 -41 -10
Investing variations(a) Parameter variations -31 -32 29 24 Policy variations -24 -41 -4 -4 Total investing variations -55 -73 25 20
Estimate at 2016–17 MYBR -2 445 -416 29 63
Net effect of operating variations to 2017–18 Budget -61 -311 -292 -263 Investing variations(a)
Parameter variations -87 870 104 489 Policy variations up to the 2017–18 Budget — 144 -175 -50 Policy variations in the 2017–18 Budget -1 -60 -351 -442 Total investing variations -88 955 -422 -3
Estimate at 2017–18 Budget -2 595 228 -685 -203
Note: Totals may not add due to rounding.
(a) Investing variations relate to movements in the net acquisition of non-financial assets.
Chapter 1: Budget context and overview
2017–18 Budget Statement 15
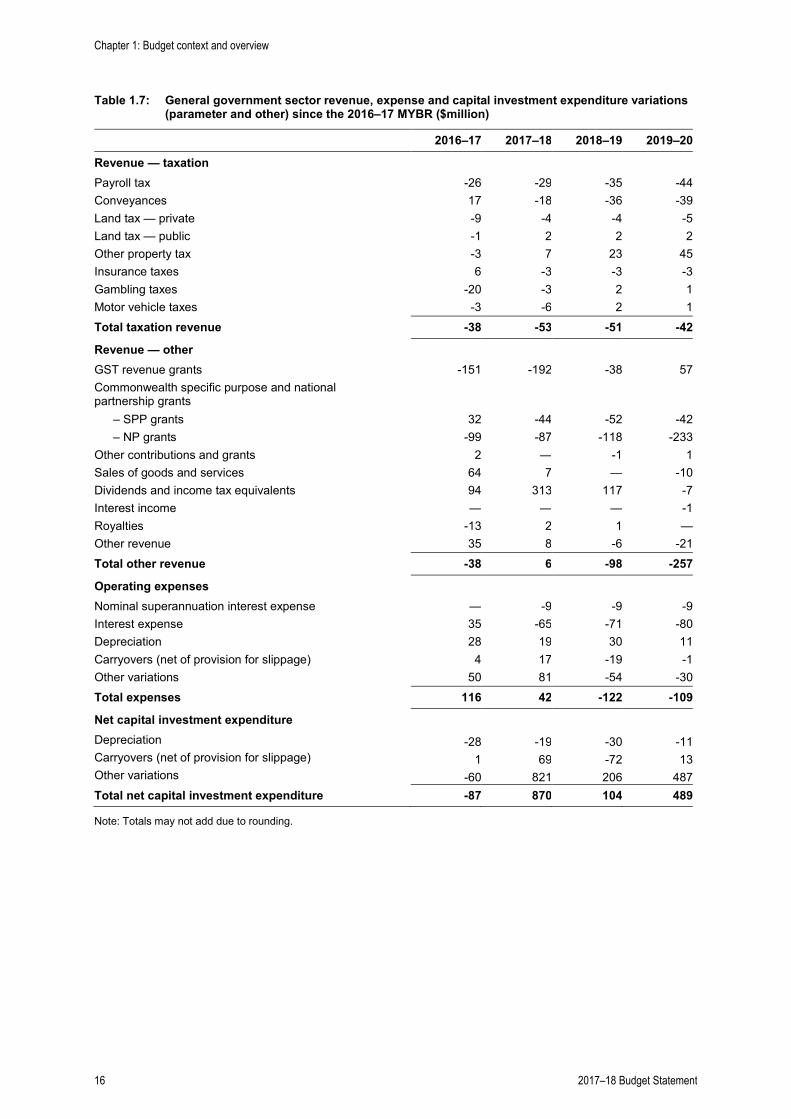
Table 1.7: General government sector revenue, expense and capital investment expenditure variations (parameter and other) since the 2016–17 MYBR ($million)
2016–17 2017–18 2018–19 2019–20
Revenue — taxation Payroll tax -26 -29 -35 -44
Conveyances 17 -18 -36 -39 Land tax — private -9 -4 -4 -5 Land tax — public -1 2 2 2 Other property tax -3 7 23 45 Insurance taxes 6 -3 -3 -3 Gambling taxes -20 -3 2 1 Motor vehicle taxes -3 -6 2 1 Total taxation revenue -38 -53 -51 -42
Revenue — other
GST revenue grants -151 -192 -38 57 Commonwealth specific purpose and national partnership grants
– SPP grants 32 -44 -52 -42 – NP grants -99 -87 -118 -233 Other contributions and grants 2 — -1 1 Sales of goods and services 64 7 — -10 Dividends and income tax equivalents 94 313 117 -7 Interest income — — — -1 Royalties -13 2 1 — Other revenue 35 8 -6 -21 Total other revenue -38 6 -98 -257
Operating expenses
Nominal superannuation interest expense — -9 -9 -9 Interest expense 35 -65 -71 -80 Depreciation 28 19 30 11 Carryovers (net of provision for slippage) 4 17 -19 -1 Other variations 50 81 -54 -30 Total expenses 116 42 -122 -109
Net capital investment expenditure
Depreciation -28 -19 -30 -11 Carryovers (net of provision for slippage) 1 69 -72 13 Other variations -60 821 206 487 Total net capital investment expenditure -87 870 104 489
Note: Totals may not add due to rounding.
Chapter 1: Budget context and overview
16 2017–18 Budget Statement
Variations in revenue estimates (parameter and other)
Since the 2016–17 Mid-Year Budget Review (MYBR), taxation revenues have been revised down in all years.
Payroll tax revenues have been revised down from 2016–17 onwards reflecting lower than budgeted collections year to date as a result of compositional factors including differential growth rates between small and large employers.
Underlying conveyance duty revenue has been revised down in all years. The upward revision in 2016–17 reflects a once-off large transaction and stronger growth in underlying non-residential real property prices, partially offset by softer than expected transactions levels. The downward revisions from 2017–18 mainly reflect the flow through impact of lower transaction levels in 2016–17, which are only partially offset by higher non-residential real property prices due to the phased abolition of duty on non-residential real property transfers. Underlying real property transactions are still expected to grow over the forward estimates period returning to longer term levels.
Land tax revenue has been revised down in all years primarily reflecting year to date experience, with marginally weaker than expected land tax collections for 2016–17 flowing through to future years.
Other property taxes have been revised up from 2017–18 primarily due to an increase in guarantee fee revenue reflecting changes in market conditions.
Gambling tax revenue has been revised down in 2016–17 primarily reflecting lower than expected year to date growth in net gaming revenue from gaming machines in hotels and clubs, which flows through to future years. Contributions from SA Lotteries have also been revised down across the forward estimates in all years reflecting revised projections for growth in net gambling revenue. Collections under the Betting Operations Tax have been reflected on a gross basis to include amounts collected from UBet SA’s wagering revenue related to racing. There is no net impact on the budget position as they are paid onto the racing industry as grants.
Insurance tax revenue has been revised down in all years primarily reflecting year to date experience. This is offset in 2016–17 by the receipt of additional back payments associated with the treatment of life insurance riders.
South Australia’s Goods and Services Tax (GST) revenue grants have been revised down from 2016–17 to 2018–19, and up in 2019–20. This primarily reflects the Commonwealth’s 2017–18 Budget downward revision of national GST pool estimates from 2016–17 to 2019–20. In addition, South Australia’s relative population growth is now expected to be slower than forecast in the 2016–17 MYBR which results in a further deterioration to South Australia’s GST grants to 2019–20. In 2019–20, these downward revisions are more than offset by an increase in South Australia’s share of GST grants. This reflects the combined impact of the Commonwealth Grants Commission (CGC) 2017 Update, a deterioration in South Australia’s relative revenue raising capacity and a lower projected share of Specific Purpose and National Partnership payments.
Commonwealth Government specific purpose payment (SPP) grants have been revised up in 2016–17 primarily due to a payment following the finalisation of National Health Reform funding relating to 2015–16 activity levels. Future years have been revised down primarily due to a decrease in funding expected to be received under the National Health Reform Agreement and the Commonwealth’s Quality Schools reforms. The overall decrease in Commonwealth Government funding for schools is primarily the result of proposed changes to the structure of the Commonwealth’s education funding model, which will be subject to the passage of Commonwealth legislation.
Commonwealth Government national partnership (NP) grants have been revised down in all years. The downward revisions in 2016–17 and 2017–18 mainly reflect the deferral of funding into later
Chapter 1: Budget contextand overview
2017–18 Budget Statement 17
years and are partially offset by an overall increase in local government grant funding through the state. Decreases in 2018–19 and 2019–20 are primarily due to amounts previously provisioned to reflect updated estimates of Commonwealth Government transport funding, which are now shown as specific policy measures that will proceed where the Commonwealth partners with the state government on transport infrastructure. These revisions appear as reductions in tables 1.6 and 1.7 and are now shown as revenue offsets in table 1.5.
Sales of goods and services revenue has been revised up in 2016–17 and 2017–18 but down in 2019–20. The increase in 2016–17 mainly reflects additional Commonwealth Government contributions under the Pharmaceutical Benefits Scheme (PBS). This is partially offset by a change to the timing of Commonwealth Government funding to the Department of Environment, Water and Natural Resources for various projects. From 2017–18, revisions primarily reflect the net impact of higher revenue associated with the Child Dental Benefit Scheme and drivers licence fees as well as lower revenue from Land Titles Office fees and Metroticket sales.
Dividend and income tax equivalent revenue has been revised up from 2016–17 to 2018–19 and revised down in 2019–20. The upward revisions reflect an income tax equivalent payment from ReturnToWorkSA in 2016–17 and additional dividend payments from the Motor Accident Commission (MAC) from 2017–18 following the transition to the new CTP arrangements. The downward revision in 2019–20 mainly reflects lower distributions from SA Water, partially offset by a dividend payment from MAC.
Royalties have been revised down in 2016–17 mainly due to lower minerals production, partially offset by improved production and pricing forecasts for petroleum.
Other revenues have been revised up in 2016–17 and 2017–18 and down from 2018–19. The upward revision in 2016–17 mainly reflects revenue received as part of the National Heavy Vehicle Regulator arrangements as well as a contribution from SA Water associated with the Darlington and Torrens to Torrens South Road projects. The downward revisions from 2018–19 are mainly due to lower fine and penalties revenue due to lower detections from fixed cameras, partially offset by contributed assets revenue associated with the Commonwealth’s Essential Vaccines Program.
Variations in expense and capital investment expenditure estimates (parameter and other)
Operating Expenses The nominal superannuation interest expense in 2017–18 is expected to be $363 million, $9 million higher than forecasts in the 2016–17 MYBR. Across the forward estimates expenses are also around $9 million higher in each year due to an increase in the interest rate used to calculate the expense since the 2016–17 MYBR, being the long-dated Commonwealth Government bond rate used to value the liability.
Interest expenses for 2016–17 has been revised down since the 2016–17 MYBR by $35 million due to a change in timing of the commencement of the new Royal Adelaide Hospital finance lease agreement. Across the forward estimates there is an increase in interest expenses since the 2016–17 MYBR due to an increase in the finance lease expense for the new Royal Adelaide Hospital.
Depreciation in 2016–17 is lower than forecast at the 2016–17 MYBR due to delays in capital projects resulting in later commencement of associated depreciation. Across the forward estimates depreciation expenditure has been revised down largely due to the sale of land and assets at the Techport site (including the Common User Facility, Shipbuilding Expansion Area and Maritime Skills Centre) to the Commonwealth Government and subsequent removal of associated depreciation expenses, and a revision of the profile of amortisation for the new Royal Adelaide Hospital across the forward estimates.
Chapter 1: Budget context and overview
18 2017–18 Budget Statement
Carryover expenditure reflects expenditure to be undertaken by agencies in 2016–17, which will now be incurred in later years. Operating carryovers from 2016–17 to 2017–18 and future years are $84 million. The 2017–18 Budget also includes adjustments to the provision for operating slippage over the forward estimates based on the recent average level of carryovers applied to the revised operating expenditure budget in each year.
The movements in the ‘other variations’ category across the forward estimates includes transactions that have no net budget impact but in which both expenses and revenue vary, and the reclassification of some transactions in accordance with accounting standards. It also includes the re-profiling of expenditure between budget years, including for timing changes under Commonwealth funded programs as well as changes to expenditures reflecting demand for government services. The impact in 2016–17 is largely due to the reduced costs associated with the delay in commercial acceptance of the new Royal Adelaide Hospital.
Net Capital Investment Expenditure The carryover of investing expenditure in 2016–17 reflects delays in project expenditure. Where appropriate, an estimate of expenditure for these projects has been carried forward into future years. Investing carryovers from 2016–17 to 2017–18 and future years are $231 million. The 2017–18 Budget also includes a provision for project slippage over the forward estimates based on the recent average level of carryovers applied to the revised investing expenditure budget in each year.
The movements in the Net Capital Investment Expenditure ‘other variations’ category are primarily due to re-profiles of capital project expenditure across the forward estimates and revised timing of asset sales, as well as adjustments to the major project contingency provision as it is replaced by specific new investing initiatives. The impact in 2017–18 is particularly large due to the recognition of returns associated with the separation and outsourcing of the transactional/service delivery activity provided by the land services group and the sale of land and assets at the Techport site to the Commonwealth Government.
Chapter 1: Budget context and overview
2017–18 Budget Statement 19

Chapter 1: Budget context and overview
20 2017–18 Budget Statement
Chapter 2: Expenditure
This chapter provides an overview of new expenditure initiatives in the 2017–18 Budget and describes the trends in aggregate general government expenditure over the forward estimates period. Full details of all budget initiatives are provided in the 2017–18 Budget Measures Statement. This chapter also provides a summary of the general government capital program and the major capital projects that are being undertaken.
New expenditure is focussed on measures designed to build our economy and create jobs, take charge of our energy future, invest in our community and support our core services.
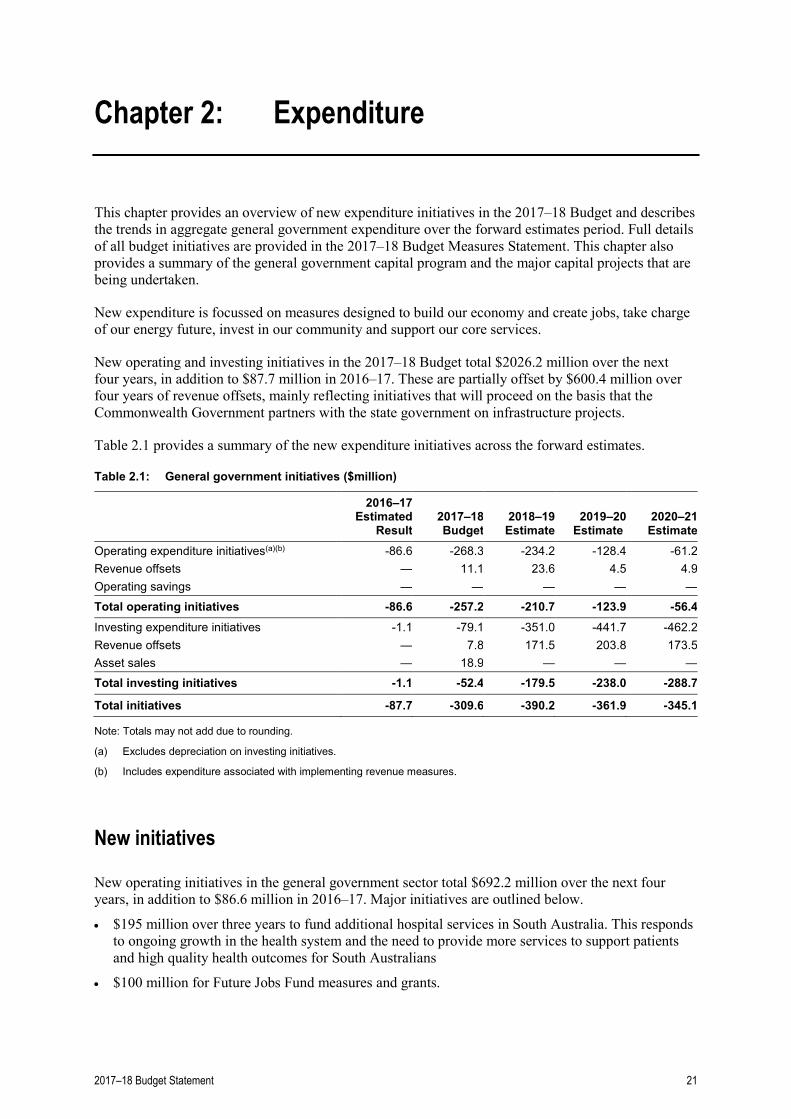
New operating and investing initiatives in the 2017–18 Budget total $2026.2 million over the next four years, in addition to $87.7 million in 2016–17. These are partially offset by $600.4 million over four years of revenue offsets, mainly reflecting initiatives that will proceed on the basis that the Commonwealth Government partners with the state government on infrastructure projects.
Table 2.1 provides a summary of the new expenditure initiatives across the forward estimates.
Table 2.1: General government initiatives ($million)
2016–17 Estimated
Result 2017–18 Budget
2018–19 Estimate
2019–20 Estimate
2020–21 Estimate
Operating expenditure initiatives(a)(b) -86.6 -268.3 -234.2 -128.4 -61.2 Revenue offsets — 11.1 23.6 4.5 4.9 Operating savings — — — — — Total operating initiatives -86.6 -257.2 -210.7 -123.9 -56.4 Investing expenditure initiatives -1.1 -79.1 -351.0 -441.7 -462.2 Revenue offsets — 7.8 171.5 203.8 173.5 Asset sales — 18.9 — — — Total investing initiatives -1.1 -52.4 -179.5 -238.0 -288.7
Total initiatives -87.7 -309.6 -390.2 -361.9 -345.1
Note: Totals may not add due to rounding.
(a) Excludes depreciation on investing initiatives.
(b) Includes expenditure associated with implementing revenue measures.
New initiatives
New operating initiatives in the general government sector total $692.2 million over the next four years, in addition to $86.6 million in 2016–17. Major initiatives are outlined below.
• $195 million over three years to fund additional hospital services in South Australia. This responds to ongoing growth in the health system and the need to provide more services to support patients and high quality health outcomes for South Australians
• $100 million for Future Jobs Fund measures and grants.
2017–18 Budget Statement 21
Specific measures included in the 2017–18 Budget as part of the Future Jobs Fund are:
– $30.0 million over two years in grants to further support and secure new investment in South Australia through the attraction of appropriate business projects to the state in key target industries. The investment will promote job creation, capital investment, and increased economic activity
– $14.5 million over four years to secure additional major events and conventions to further drive visitation and economic development of the state
– $5.0 million over two years for the automotive supplier transformation initiative, which continues support for South Australian companies in the automotive supply chain ahead of the cessation of motor vehicle manufacturing activities in Australia
– $2.0 million in 2017–18 to extend the I Choose SA campaign to encourage consumers to actively look for South Australian products and services when buying. The campaign enables the public to identify and purchase local products and services that support the South Australian economy.
In addition to these specific measures, $50 million in grants will be available to support job creation in the five industry focus areas, namely: shipbuilding and defence, renewable energy and mining, tourism, food and wine, health and biomedical research, and information technology and advanced manufacturing.
Low interest loans of $100 million will also be available through the Future Jobs Fund to support job creation. An amount of $30 million will be allocated through the Industry Attraction Agency. The remaining $70 million of low interest loans will be available to support other job creation projects.
The government is inviting the Commonwealth Government to partner with the state and match our $200 million commitment to the Future Jobs Fund.
• $40.0 million over two years for the Fund My Neighbourhood program which allows the community to decide what projects should be funded within their neighbourhood
• $22.4 million over four years to increase the frequency of train services on the Gawler, Outer Harbor, Belair and Seaford lines, including nights and weekends
• $20.0 million over two years for grants to establish or replace artificial playing surfaces that will improve programming for sports like soccer, hockey, tennis and bowls as well as wooden and hardcourt surfaces for sports such as basketball, volleyball, netball and tennis
• $18.9 million over four years for the New Foundations initiative which will provide housing and support services to offenders who are eligible for release from prison or being considered for a community based order but do not have access to suitable housing
• $18.2 million in 2017–18, in addition to $68.3 million in 2016–17 to meet additional costs for children in care. This is in addition to the $432 million provided in the 2016–17 Mid-Year Budget Review to reform the state’s child protection system in response to the Child Protection Systems Royal Commission report
• $17.5 million over four years for the extension of the community wastewater management system funding agreement, which provides funding to councils to support the installation of communal wastewater treatment systems where sewer system are not provided by SA Water or other major water industry authorities
• $14.0 million over two years for the Women's Sporting Facilities Fund to continue to support sport and recreation organisations implementing projects addressing the barriers to female participation. This lifts the fund to $10 million per annum in 2017–18 and 2018–19
• $13.6 million, in addition to $0.6 million in 2016–17 to reflect a greater than anticipated take up of court-ordered home detention, including the cost of electronic monitoring devices
Chapter 2: Expenditure
22 2017–18 Budget Statement
• $8.5 million over four years, in addition to $0.7 million investing expenditure, for the Work Ready, Release Ready program to prepare prisoners for a successful return to the community and reduce the likelihood of reoffending
• $8.1 million over three years, in addition to $0.1 million investing expenditure, to increase the Job Accelerator Grant by up to $5000 for each eligible new apprentice or trainee employed and eligible for an existing Job Accelerator Grant.
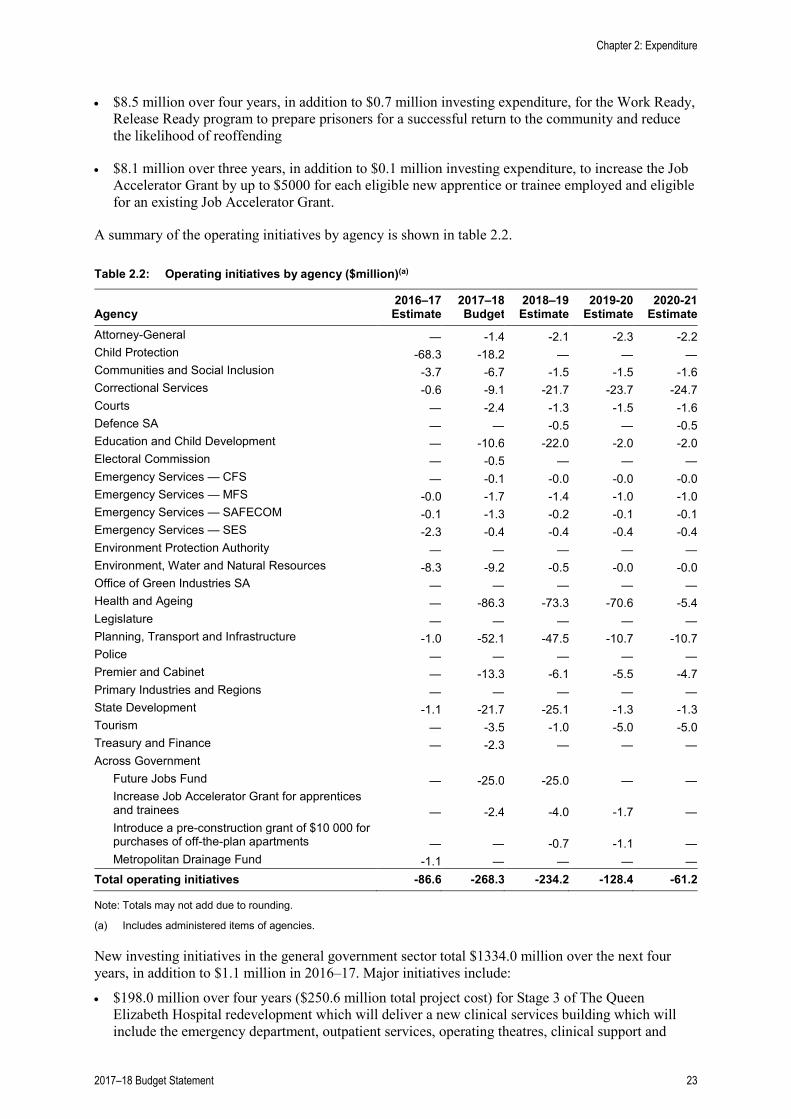
A summary of the operating initiatives by agency is shown in table 2.2.
Table 2.2: Operating initiatives by agency ($million)(a)
Agency 2016–17 Estimate
2017–18 Budget
2018–19 Estimate
2019-20 Estimate
2020-21 Estimate
Attorney-General — -1.4 -2.1 -2.3 -2.2 Child Protection -68.3 -18.2 — — — Communities and Social Inclusion -3.7 -6.7 -1.5 -1.5 -1.6 Correctional Services -0.6 -9.1 -21.7 -23.7 -24.7 Courts — -2.4 -1.3 -1.5 -1.6 Defence SA — — -0.5 — -0.5 Education and Child Development — -10.6 -22.0 -2.0 -2.0 Electoral Commission — -0.5 — — — Emergency Services — CFS — -0.1 -0.0 -0.0 -0.0 Emergency Services — MFS -0.0 -1.7 -1.4 -1.0 -1.0 Emergency Services — SAFECOM -0.1 -1.3 -0.2 -0.1 -0.1 Emergency Services — SES -2.3 -0.4 -0.4 -0.4 -0.4 Environment Protection Authority — — — — — Environment, Water and Natural Resources -8.3 -9.2 -0.5 -0.0 -0.0 Office of Green Industries SA — — — — — Health and Ageing — -86.3 -73.3 -70.6 -5.4 Legislature — — — — — Planning, Transport and Infrastructure -1.0 -52.1 -47.5 -10.7 -10.7 Police — — — — — Premier and Cabinet — -13.3 -6.1 -5.5 -4.7 Primary Industries and Regions — — — — — State Development -1.1 -21.7 -25.1 -1.3 -1.3 Tourism — -3.5 -1.0 -5.0 -5.0 Treasury and Finance — -2.3 — — — Across Government
Future Jobs Fund — -25.0 -25.0 — — Increase Job Accelerator Grant for apprentices and trainees — -2.4 -4.0 -1.7 — Introduce a pre-construction grant of $10 000 for purchases of off-the-plan apartments — — -0.7 -1.1 — Metropolitan Drainage Fund -1.1 — — — —
Total operating initiatives -86.6 -268.3 -234.2 -128.4 -61.2
Note: Totals may not add due to rounding.
(a) Includes administered items of agencies.
New investing initiatives in the general government sector total $1334.0 million over the next four years, in addition to $1.1 million in 2016–17. Major initiatives include:
• $198.0 million over four years ($250.6 million total project cost) for Stage 3 of The Queen Elizabeth Hospital redevelopment which will deliver a new clinical services building which will include the emergency department, outpatient services, operating theatres, clinical support and
Chapter 2: Expenditure
2017–18 Budget Statement 23
brain and spinal injury rehabilitation. This will ensure the continued delivery of specialised inpatient and outpatient medical services such as cancer, respiratory and cardiology at the site, and the retention of emergency cardiac services via the decision not to close the catheterisation labs.
• $173.8 million over two years, in addition to $0.5 million in 2016–17 to upgrade the Oaklands crossing to separate rail and road traffic by implementing a rail underpass. The rail underpass will improve the traffic flow along both Morphett Road and Diagonal Road, improve safety of pedestrians and cyclists, improve rail operations and also provide better rail-bus integration
• $100.0 million over two years from 2019–20 ($305.0 million total project cost) to duplicate Main South Road from Seaford to Old Coach Road, Aldinga. This is stage 1 of a project that will duplicate Main South Road from Seaford to Sellicks Beach
• $52.5 million over four years for the expansion of the Lyell McEwin Hospital emergency department to address growing demand. The expansion includes a new build over two levels and the redevelopment of the existing emergency department and other facilities
• $31.3 million over two years, in addition to $0.2 million in 2016–17, to relocate the Train Control Centre from the Adelaide railyard to the Dry Creek Railcar Depot. This is part of a $44.0 million commitment towards the construction of a second South Australian Health and Medical Research Institute (SAHMRI) building within the health and biomedical precinct
• $30.5 million over two years, in addition to $0.5 million in 2016–17, to redevelop the Sir Samuel Way Building to increase the number of jury court rooms from 11 to 13 and refurbish existing Supreme Court buildings
• $24.0 million over two years for the maintenance and improvement of facilities at the existing Women’s and Children’s Hospital
• $23.0 million over three years, in addition to $7.3 million operating expenditure over four years, for the construction of the Adelaide Women’s Hospital (to be completed in 2024 at a total project cost of $528.0 million) next to, and adjoining with the new Royal Adelaide Hospital
• $15.0 million over two years for additional park n ride facilities at the Tea Tree Plaza and Klemzig interchanges
• $13.7 million over two years for the development of appropriate alternative accommodation to support patients relocating from the Oakden Older Person Mental Health Service
• $9.2 million over three years for the establishment of an eight bed emergency extended care unit adjacent to the emergency department at the Modbury Hospital to enable further treatment and evaluation of patients who may benefit from an extended observation period but do not require further emergency department services.
In addition, the state will enter a public private partnership to oversee construction of two additional birth to Year 12 schools, one in the Northern Adelaide region and one in the Southern Adelaide region to meet projected enrolment demand arising from strong population growth in these areas. The facilities will accommodate reception to year 12 students, special school students and a children’s centre and offer an integrated approach to the provision of education and care for students with special needs, children from birth to school age and allied health care for young children and families.
The budget also continues the government’s support for the redevelopment of Her Majesty's Theatre (HMT). The existing HMT land and building currently owned by Arts SA will be purchased by the Adelaide Festival Centre Trust (AFCT) to enable the Trust to undertake the redevelopment of HMT. The AFCT will incur additional expenditure of $31.0 million for the upgrade as a result of the expansion in the scope of the project and a more complicated build. The revised capital cost of the project is $66.2 million.
The budget includes the following projects on the basis that they will only progress upon a commitment from the Commonwealth Government to partner with the state.
Chapter 2: Expenditure
24 2017–18 Budget Statement
• North South Corridor — $415.0 million over three years to upgrade the section of South Road from Regency Road to Pym Street. This will provide a continuous journey motorway from the Northern Expressway to the River Torrens.
• Gawler Electrification — $242.5 million over two years ($462.5 million total project cost) to continue the electrification of the Gawler rail line from Salisbury to Gawler, replacement of the signalling system, and the acquisition of 15 additional three car electric trains.
The government has committed to fund comprehensive works to improve traffic flows and reduce delays at the Springbank, Daws and Goodwood road intersection. In 2017–18 the Department of Planning, Transport and Infrastructure will commence detailed design to re-align the intersection to create a standard cross intersection, which will create a more efficient intersection and eliminate much of the blocking of through traffic that causes significant congestion.
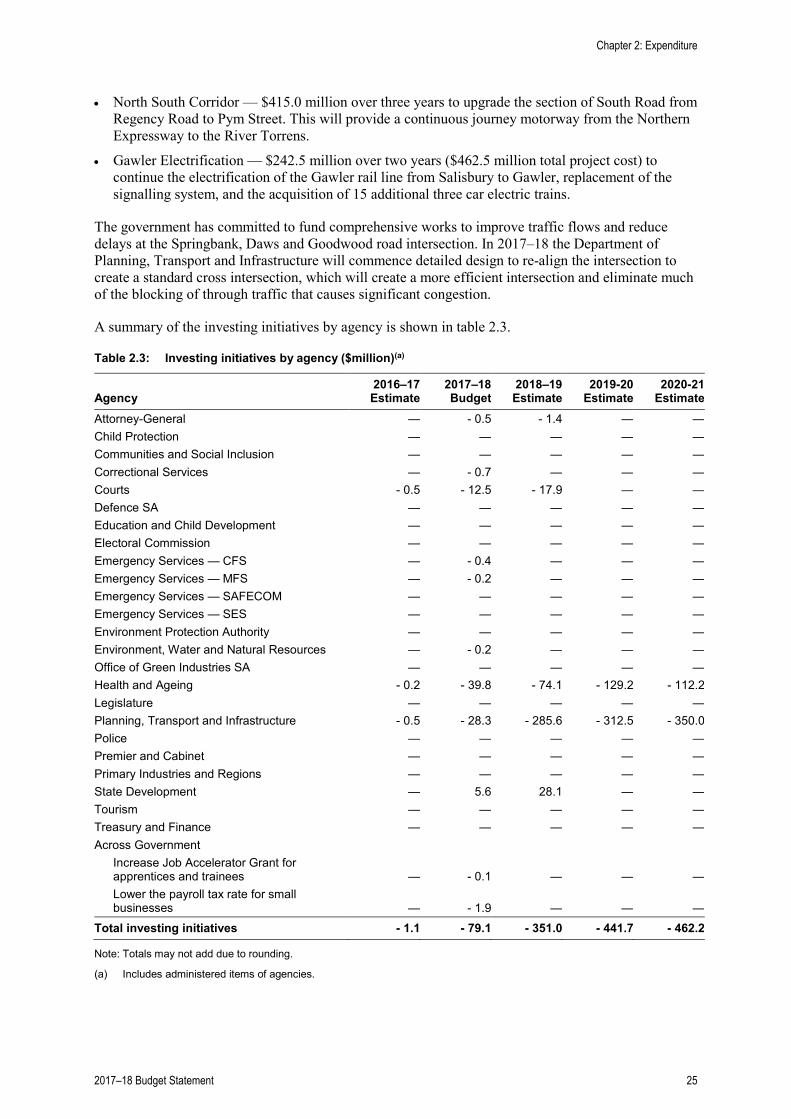
A summary of the investing initiatives by agency is shown in table 2.3.
Table 2.3: Investing initiatives by agency ($million)(a)
Agency 2016–17 Estimate
2017–18 Budget
2018–19 Estimate
2019-20 Estimate
2020-21 Estimate
Attorney-General — - 0.5 - 1.4 — — Child Protection — — — — — Communities and Social Inclusion — — — — — Correctional Services — - 0.7 — — — Courts - 0.5 - 12.5 - 17.9 — — Defence SA — — — — — Education and Child Development — — — — — Electoral Commission — — — — — Emergency Services — CFS — - 0.4 — — — Emergency Services — MFS — - 0.2 — — — Emergency Services — SAFECOM — — — — — Emergency Services — SES — — — — — Environment Protection Authority — — — — — Environment, Water and Natural Resources — - 0.2 — — — Office of Green Industries SA — — — — — Health and Ageing - 0.2 - 39.8 - 74.1 - 129.2 - 112.2 Legislature — — — — — Planning, Transport and Infrastructure - 0.5 - 28.3 - 285.6 - 312.5 - 350.0 Police — — — — — Premier and Cabinet — — — — — Primary Industries and Regions — — — — — State Development — 5.6 28.1 — — Tourism — — — — — Treasury and Finance — — — — — Across Government
Increase Job Accelerator Grant for apprentices and trainees — - 0.1 — — — Lower the payroll tax rate for small businesses — - 1.9 — — —
Total investing initiatives - 1.1 - 79.1 - 351.0 - 441.7 - 462.2
Note: Totals may not add due to rounding.
(a) Includes administered items of agencies.
Chapter 2: Expenditure
2017–18 Budget Statement 25
Measures approved after the 2016–17 Mid-Year Budget Review
In addition to measures approved in the 2017–18 Budget, some initiatives were approved in the period following the 2016–17 MYBR and are shown as memorandum items in the 2017–18 Budget Measures Statement.
Major initiatives include:
• $550.0 million (operating and investing expenditure) over four years for the implementation of Our Energy Plan which includes:
– $360 million towards building a 250 megawatt gas fired power plant to provide emergency back-up power and system stability services
– $150 million to a Renewable Technology Fund, part of which will be used to build Australia’s largest battery to store energy from the wind and sun
– $24 million towards new Plan for Accelerating Exploration grants to incentivise gas production
– additional funding for the implementation of the energy plan
• The Government of South Australia and the Commonwealth Government have agreed to a strategic consolidation of critical assets of the Osborne Naval Shipyard, to enable the Commonwealth's continuous build programs including the submarine, frigate and patrol vessel programs. Under this agreement the Commonwealth Government will provide consideration of $230 million and the state will transfer the Techport Common User Facility land and assets. The state will also fund infrastructure works at an estimated cost of up to $18.3 million for a Pedestrian Rail Overpass, relocation of a SA Water wastewater pumping station and roadworks at Osborne.
Savings
Since the 2010–11 Budget the government has implemented significant savings measures each year. These savings have been substantially delivered and have largely been responsible for the restrained growth in general government operating expenses evident since 2012–13. Operating expenses declined by 0.3 per cent in real terms from 2012–13 to 2015–16. Expenditure continues to be restrained over the forward estimates, with a real decline in spending of 0.1 per cent budgeted from 2016–17 to 2020–21.
While no new savings are included in the 2017–18 Budget, agency budgets include a continuation of the existing efficiency dividend policy as well as some specific measures including efficiencies in the health system as a result of continued improvements in the way services are delivered, which will also help to ensure the financial sustainability of the health services into the future.
The majority of ongoing savings for agencies relate to a continuation of the existing efficiency dividend policy of 1.0 per cent of the agency employee expenses budget per annum and a 1.0 per cent reduction in their net cost of services per annum. The efficiency dividend on net cost of services excludes the judicial areas of courts, police officers (with only 0.5 per cent applied to the remainder of Police) and frontline emergency services staff, prison operations, disabilities and schools. The policy allows the flexibility to tailor savings to their particular operating structures to ensure more efficient ways of conducting business are pursued, without reducing the quality or level of services provided. Agencies will be required to continue to find expenditure efficiencies to deliver these savings.
Chapter 2: Expenditure
26 2017–18 Budget Statement
A summary of the operating savings to be achieved over the forward estimates is shown in table 2.4.
Table 2.4: Operating expenditure savings ($million)
$million To commence in 2017–18 161 To commence in 2018–19 167 To commence in 2019–20 141 To commence in 2020–21 197
To continue to assist agencies in the delivery of their budgetary targets, a targeted voluntary separation package (TVSP) scheme, which has been in operation since November 2010, remains in place. Since 1 July 2014 the maximum TVSP payout has been 52 weeks’ pay, calculated as 10 weeks base plus two weeks per year of service.
TVSPs are available at the discretion of Chief Executives to persons whose positions are abolished as part of savings measures and organisational restructures. Unless otherwise approved by the government, from 1 July 2015 agencies have been responsible for managing costs associated with TVSPs or separation payments.
General government operating expenditure
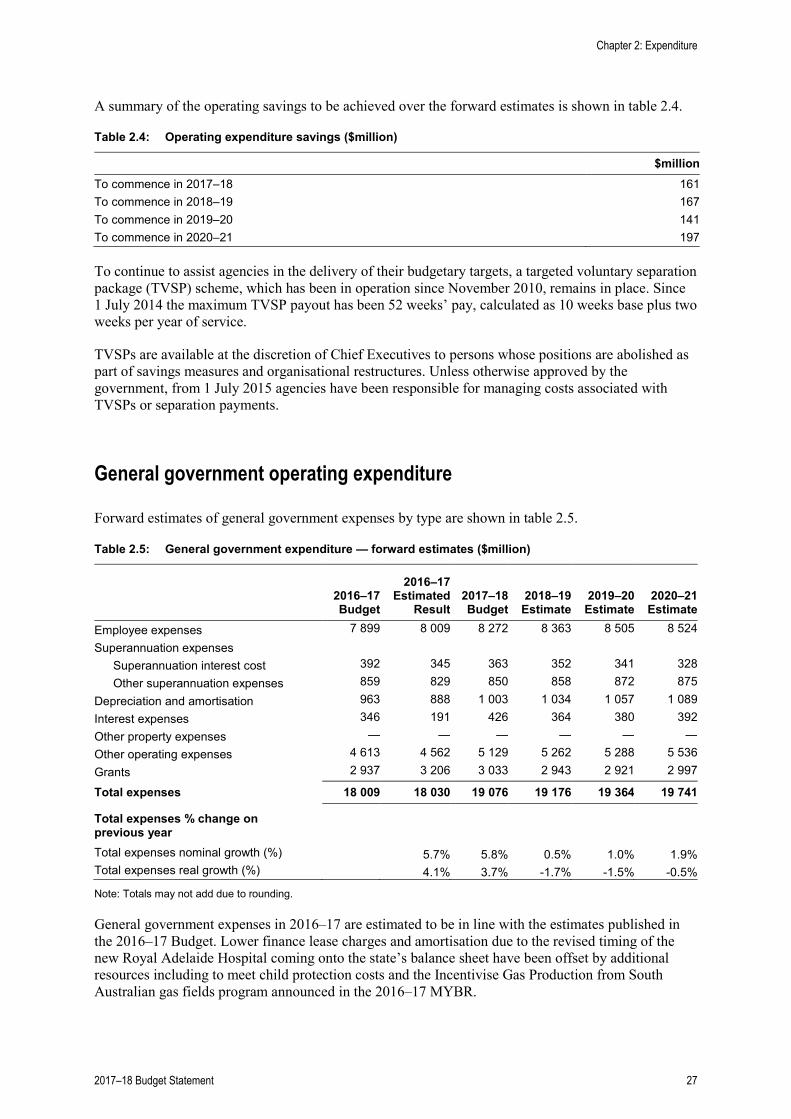
Forward estimates of general government expenses by type are shown in table 2.5.
Table 2.5: General government expenditure — forward estimates ($million)
2016–17 Budget
2016–17 Estimated
Result 2017–18 Budget
2018–19 Estimate
2019–20 Estimate
2020–21 Estimate
Employee expenses 7 899 8 009 8 272 8 363 8 505 8 524 Superannuation expenses
Superannuation interest cost 392 345 363 352 341 328 Other superannuation expenses 859 829 850 858 872 875
Depreciation and amortisation 963 888 1 003 1 034 1 057 1 089 Interest expenses 346 191 426 364 380 392 Other property expenses — — — — — — Other operating expenses 4 613 4 562 5 129 5 262 5 288 5 536 Grants 2 937 3 206 3 033 2 943 2 921 2 997
Total expenses 18 009 18 030 19 076 19 176 19 364 19 741
Total expenses % change on previous year
Total expenses nominal growth (%) 5.7% 5.8% 0.5% 1.0% 1.9% Total expenses real growth (%) 4.1% 3.7% -1.7% -1.5% -0.5%
Note: Totals may not add due to rounding.
General government expenses in 2016–17 are estimated to be in line with the estimates published in the 2016–17 Budget. Lower finance lease charges and amortisation due to the revised timing of the new Royal Adelaide Hospital coming onto the state’s balance sheet have been offset by additional resources including to meet child protection costs and the Incentivise Gas Production from South Australian gas fields program announced in the 2016–17 MYBR.
Chapter 2: Expenditure
2017–18 Budget Statement 27
Growth in expenses is estimated to remain below trend growth in household income (4.5 per cent per annum) over the forward estimates on average, consistent with the government’s fiscal target. Growth in operating expenses are projected to decrease by 0.1 per cent in real terms from 2016–17 to 2020–21.
The higher growth in 2016–17 expenses of 5.7 per cent is a result of a number of one-off factors, including:
• additional expenses in the general government sector as a result of lease payments for TAFE SA assets that were transferred to Renewal SA
• the timing of expenditure associated with the on-passing of Commonwealth Government funding to local government in 2014–15 instead of 2015–16 and in 2016–17 instead of 2017–18
• additional resources to address continued reform of the state’s child protection systems in response to the Child Protection Systems Royal Commission as announced in the 2016–17 MYBR.
In the absence of the above once-off factors, growth in expenses in 2016–17 would be approximately 4.4 per cent.
The higher growth in 2017–18 expenses of 5.8 per cent is a result of a number of one-off factors, including:
• the commencement of service payments, including associated interest expenditure charges and amortisation associated with the new Royal Adelaide Hospital. These payments all commence at commercial acceptance of the new hospital, rather than staged over the life of the project with a traditional building project
• additional resources to address continual reform of the state’s child protection system in response to the Child Protection Systems Royal Commission, as announced in the 2016–17 MYBR, which increases significantly from 2016–17 to 2017–18, reflecting the first year of full implementation
• commencing the implementation of Our Energy Plan (including $103 million operating in 2017–18) including building Australia’s largest battery storage and gas production incentives.
In the absence of the above once-off factors, growth in expenses in 2017–18 would be approximately 3.2 per cent.
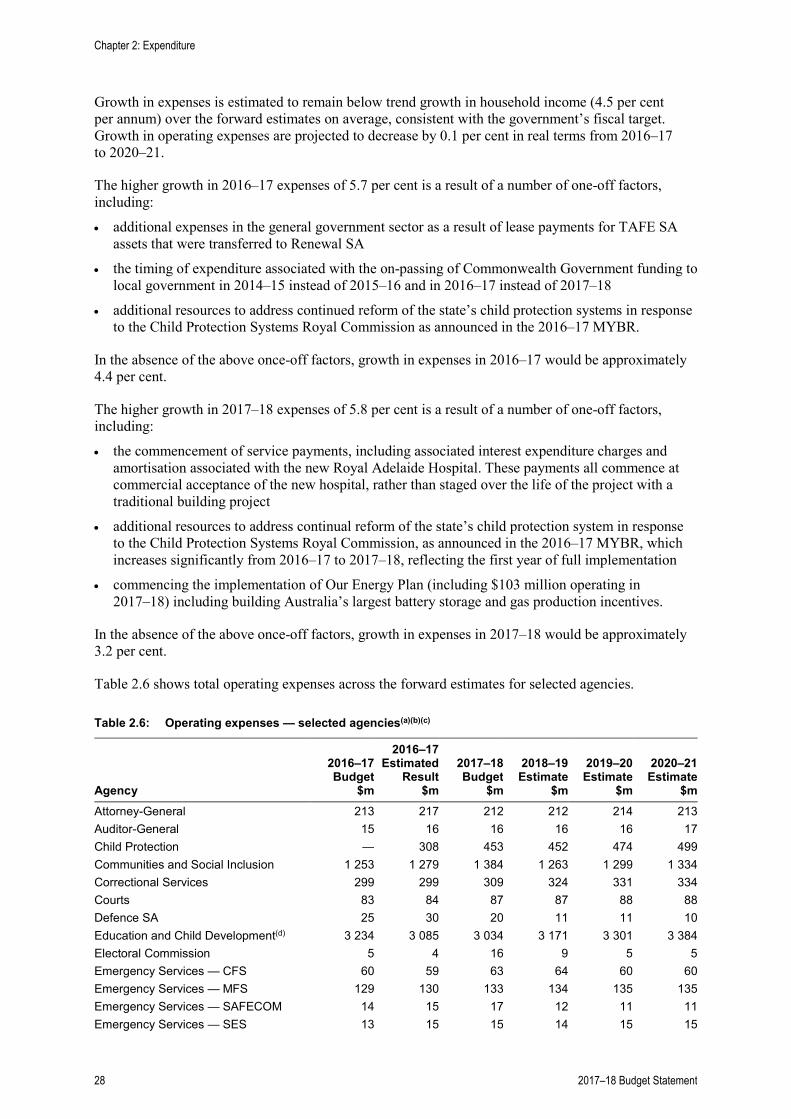
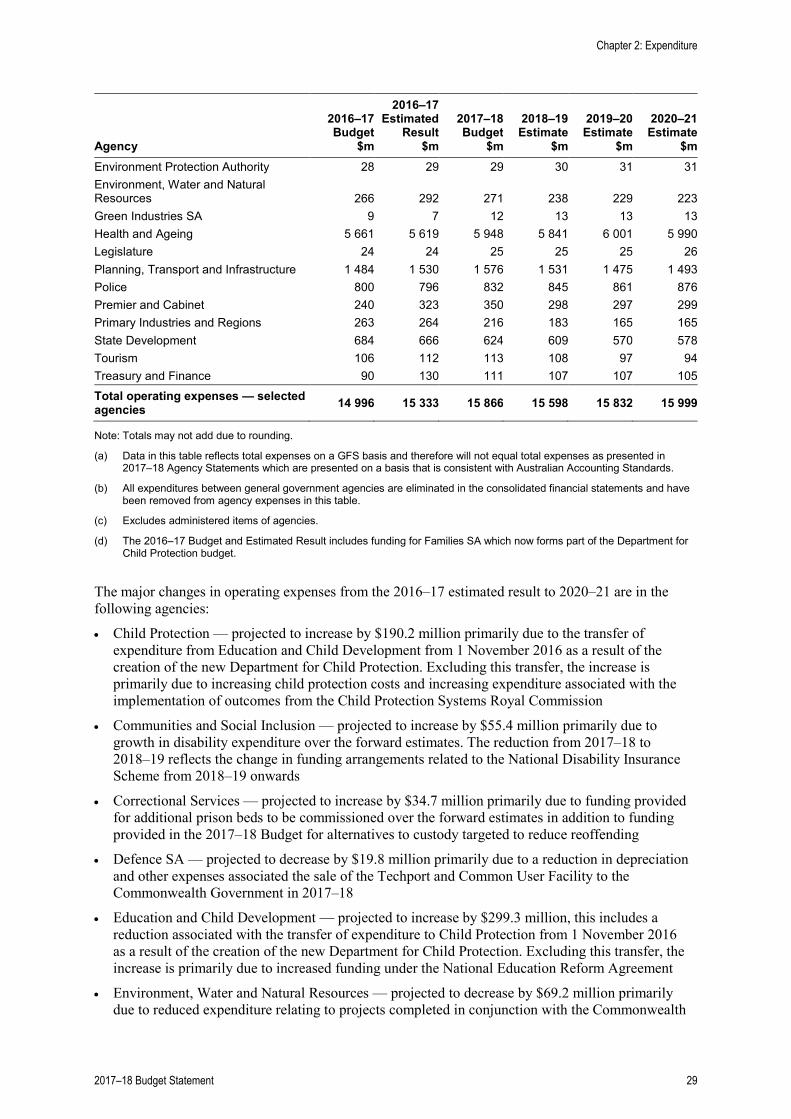
Table 2.6 shows total operating expenses across the forward estimates for selected agencies.
Table 2.6: Operating expenses — selected agencies(a)(b)(c)
Agency
2016–17 Budget
$m
2016–17 Estimated
Result $m
2017–18 Budget
$m
2018–19 Estimate
$m
2019–20 Estimate
$m
2020–21 Estimate
$m Attorney-General 213 217 212 212 214 213 Auditor-General 15 16 16 16 16 17 Child Protection — 308 453 452 474 499 Communities and Social Inclusion 1 253 1 279 1 384 1 263 1 299 1 334 Correctional Services 299 299 309 324 331 334 Courts 83 84 87 87 88 88 Defence SA 25 30 20 11 11 10 Education and Child Development(d) 3 234 3 085 3 034 3 171 3 301 3 384 Electoral Commission 5 4 16 9 5 5 Emergency Services — CFS 60 59 63 64 60 60 Emergency Services — MFS 129 130 133 134 135 135 Emergency Services — SAFECOM 14 15 17 12 11 11 Emergency Services — SES 13 15 15 14 15 15
Chapter 2: Expenditure
28 2017–18 Budget Statement
Agency
2016–17 Budget
$m
2016–17 Estimated
Result $m
2017–18 Budget
$m
2018–19 Estimate
$m
2019–20 Estimate
$m
2020–21 Estimate
$m Environment Protection Authority 28 29 29 30 31 31 Environment, Water and Natural Resources 266 292 271 238 229 223 Green Industries SA 9 7 12 13 13 13 Health and Ageing 5 661 5 619 5 948 5 841 6 001 5 990 Legislature 24 24 25 25 25 26 Planning, Transport and Infrastructure 1 484 1 530 1 576 1 531 1 475 1 493 Police 800 796 832 845 861 876 Premier and Cabinet 240 323 350 298 297 299 Primary Industries and Regions 263 264 216 183 165 165 State Development 684 666 624 609 570 578 Tourism 106 112 113 108 97 94 Treasury and Finance 90 130 111 107 107 105 Total operating expenses — selected agencies 14 996 15 333 15 866 15 598 15 832 15 999
Note: Totals may not add due to rounding.
(a) Data in this table reflects total expenses on a GFS basis and therefore will not equal total expenses as presented in 2017–18 Agency Statements which are presented on a basis that is consistent with Australian Accounting Standards.
(b) All expenditures between general government agencies are eliminated in the consolidated financial statements and have been removed from agency expenses in this table.
(c) Excludes administered items of agencies.
(d) The 2016–17 Budget and Estimated Result includes funding for Families SA which now forms part of the Department for Child Protection budget.
The major changes in operating expenses from the 2016–17 estimated result to 2020–21 are in the following agencies:
• Child Protection — projected to increase by $190.2 million primarily due to the transfer of expenditure from Education and Child Development from 1 November 2016 as a result of the creation of the new Department for Child Protection. Excluding this transfer, the increase is primarily due to increasing child protection costs and increasing expenditure associated with the implementation of outcomes from the Child Protection Systems Royal Commission
• Communities and Social Inclusion — projected to increase by $55.4 million primarily due to growth in disability expenditure over the forward estimates. The reduction from 2017–18 to 2018–19 reflects the change in funding arrangements related to the National Disability Insurance Scheme from 2018–19 onwards
• Correctional Services — projected to increase by $34.7 million primarily due to funding provided for additional prison beds to be commissioned over the forward estimates in addition to funding provided in the 2017–18 Budget for alternatives to custody targeted to reduce reoffending
• Defence SA — projected to decrease by $19.8 million primarily due to a reduction in depreciation and other expenses associated the sale of the Techport and Common User Facility to the Commonwealth Government in 2017–18
• Education and Child Development — projected to increase by $299.3 million, this includes a reduction associated with the transfer of expenditure to Child Protection from 1 November 2016 as a result of the creation of the new Department for Child Protection. Excluding this transfer, the increase is primarily due to increased funding under the National Education Reform Agreement
• Environment, Water and Natural Resources — projected to decrease by $69.2 million primarily due to reduced expenditure relating to projects completed in conjunction with the Commonwealth
Chapter 2: Expenditure
2017–18 Budget Statement 29
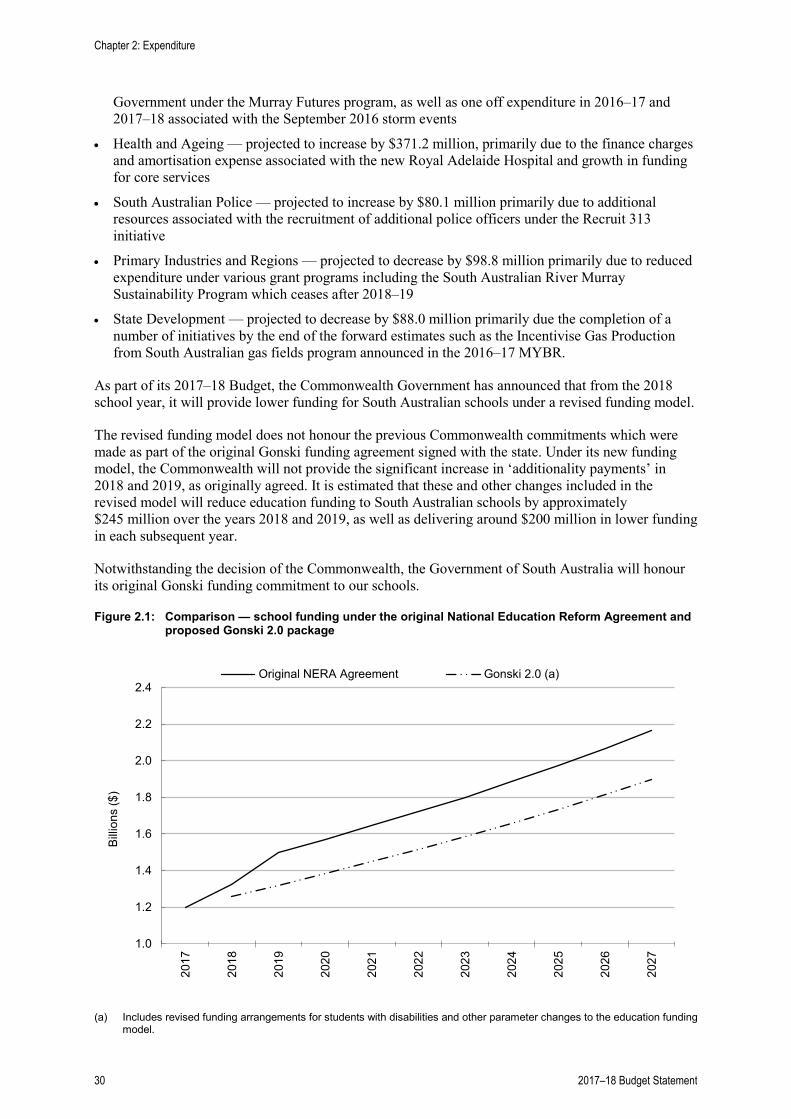
Government under the Murray Futures program, as well as one off expenditure in 2016–17 and 2017–18 associated with the September 2016 storm events
• Health and Ageing — projected to increase by $371.2 million, primarily due to the finance charges and amortisation expense associated with the new Royal Adelaide Hospital and growth in funding for core services
• South Australian Police — projected to increase by $80.1 million primarily due to additional resources associated with the recruitment of additional police officers under the Recruit 313 initiative
• Primary Industries and Regions — projected to decrease by $98.8 million primarily due to reduced expenditure under various grant programs including the South Australian River Murray Sustainability Program which ceases after 2018–19
• State Development — projected to decrease by $88.0 million primarily due the completion of a number of initiatives by the end of the forward estimates such as the Incentivise Gas Production from South Australian gas fields program announced in the 2016–17 MYBR.
As part of its 2017–18 Budget, the Commonwealth Government has announced that from the 2018 school year, it will provide lower funding for South Australian schools under a revised funding model.
The revised funding model does not honour the previous Commonwealth commitments which were made as part of the original Gonski funding agreement signed with the state. Under its new funding model, the Commonwealth will not provide the significant increase in ‘additionality payments’ in 2018 and 2019, as originally agreed. It is estimated that these and other changes included in the revised model will reduce education funding to South Australian schools by approximately $245 million over the years 2018 and 2019, as well as delivering around $200 million in lower funding in each subsequent year.
Notwithstanding the decision of the Commonwealth, the Government of South Australia will honour its original Gonski funding commitment to our schools.
Figure 2.1: Comparison — school funding under the original National Education Reform Agreement and proposed Gonski 2.0 package
(a) Includes revised funding arrangements for students with disabilities and other parameter changes to the education funding model.
1.0
1.2
1.4
1.6
1.8
2.0
2.2
2.4
2017
2018
2019
2020
2021
2022
2023
2024
2025
2026
2027
Billio
ns ($
)
Original NERA Agreement Gonski 2.0 (a)
Chapter 2: Expenditure
30 2017–18 Budget Statement
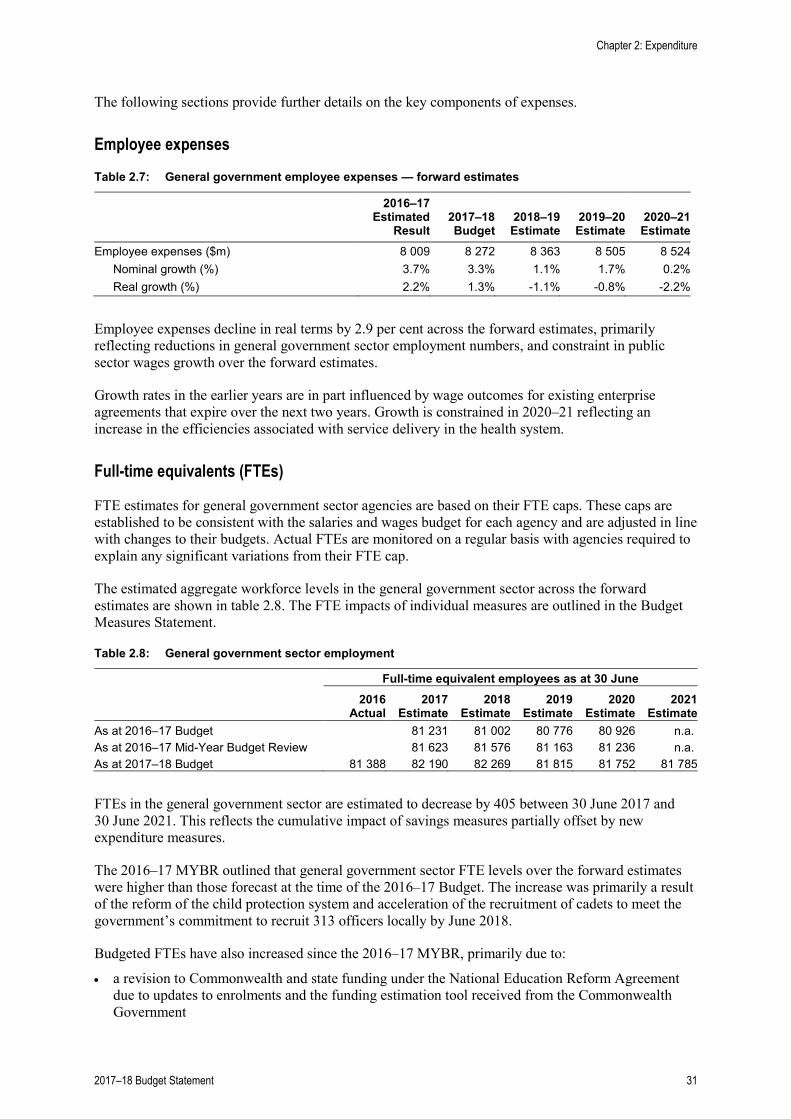
The following sections provide further details on the key components of expenses.
Employee expenses
Table 2.7: General government employee expenses — forward estimates
2016–17 Estimated
Result 2017–18 Budget
2018–19 Estimate
2019–20 Estimate
2020–21 Estimate
Employee expenses ($m) 8 009 8 272 8 363 8 505 8 524 Nominal growth (%) 3.7% 3.3% 1.1% 1.7% 0.2% Real growth (%) 2.2% 1.3% -1.1% -0.8% -2.2%
Employee expenses decline in real terms by 2.9 per cent across the forward estimates, primarily reflecting reductions in general government sector employment numbers, and constraint in public sector wages growth over the forward estimates.
Growth rates in the earlier years are in part influenced by wage outcomes for existing enterprise agreements that expire over the next two years. Growth is constrained in 2020–21 reflecting an increase in the efficiencies associated with service delivery in the health system.
Full-time equivalents (FTEs)
FTE estimates for general government sector agencies are based on their FTE caps. These caps are established to be consistent with the salaries and wages budget for each agency and are adjusted in line with changes to their budgets. Actual FTEs are monitored on a regular basis with agencies required to explain any significant variations from their FTE cap.
The estimated aggregate workforce levels in the general government sector across the forward estimates are shown in table 2.8. The FTE impacts of individual measures are outlined in the Budget Measures Statement.
Table 2.8: General government sector employment
Full-time equivalent employees as at 30 June
2016
Actual 2017
Estimate 2018
Estimate 2019
Estimate 2020
Estimate 2021
Estimate As at 2016–17 Budget 81 231 81 002 80 776 80 926 n.a. As at 2016–17 Mid-Year Budget Review 81 623 81 576 81 163 81 236 n.a. As at 2017–18 Budget 81 388 82 190 82 269 81 815 81 752 81 785
FTEs in the general government sector are estimated to decrease by 405 between 30 June 2017 and 30 June 2021. This reflects the cumulative impact of savings measures partially offset by new expenditure measures.
The 2016–17 MYBR outlined that general government sector FTE levels over the forward estimates were higher than those forecast at the time of the 2016–17 Budget. The increase was primarily a result of the reform of the child protection system and acceleration of the recruitment of cadets to meet the government’s commitment to recruit 313 officers locally by June 2018.
Budgeted FTEs have also increased since the 2016–17 MYBR, primarily due to:
• a revision to Commonwealth and state funding under the National Education Reform Agreement due to updates to enrolments and the funding estimation tool received from the Commonwealth Government
Chapter 2: Expenditure
2017–18 Budget Statement 31
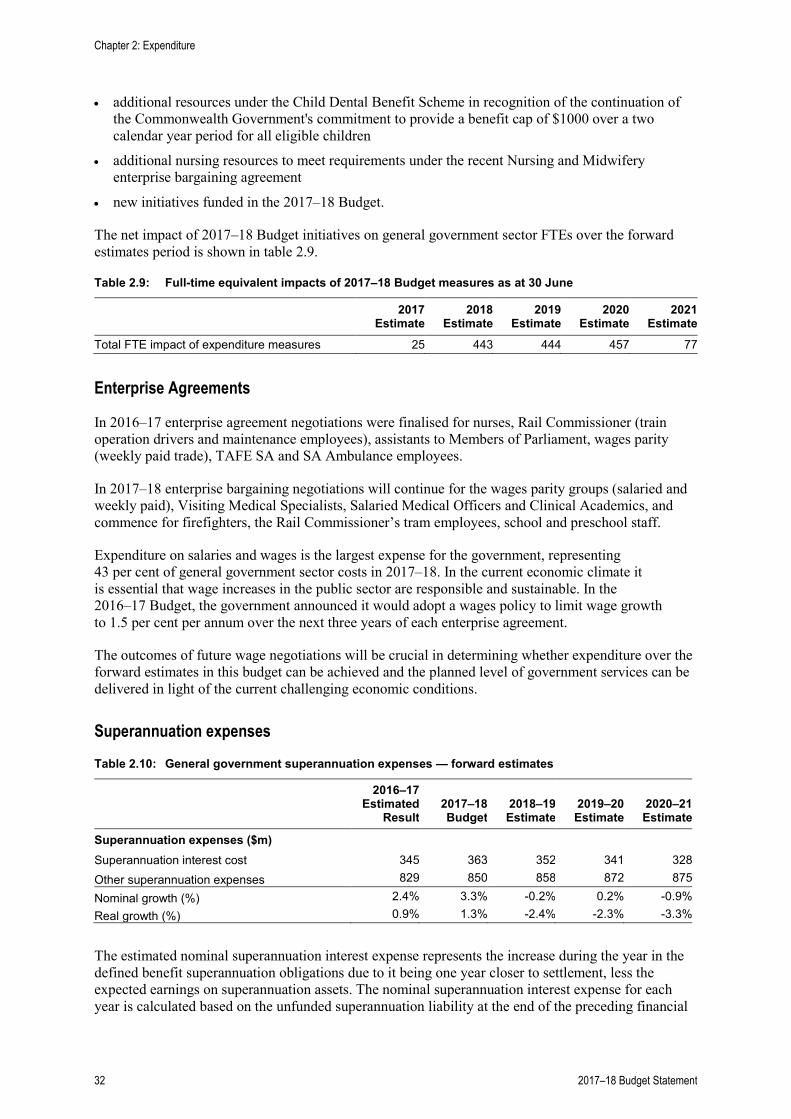
• additional resources under the Child Dental Benefit Scheme in recognition of the continuation of the Commonwealth Government's commitment to provide a benefit cap of $1000 over a two calendar year period for all eligible children
• additional nursing resources to meet requirements under the recent Nursing and Midwifery enterprise bargaining agreement
• new initiatives funded in the 2017–18 Budget.
The net impact of 2017–18 Budget initiatives on general government sector FTEs over the forward estimates period is shown in table 2.9.
Table 2.9: Full-time equivalent impacts of 2017–18 Budget measures as at 30 June
2017
Estimate 2018
Estimate 2019
Estimate 2020
Estimate 2021
Estimate Total FTE impact of expenditure measures 25 443 444 457 77
Enterprise Agreements
In 2016–17 enterprise agreement negotiations were finalised for nurses, Rail Commissioner (train operation drivers and maintenance employees), assistants to Members of Parliament, wages parity (weekly paid trade), TAFE SA and SA Ambulance employees.
In 2017–18 enterprise bargaining negotiations will continue for the wages parity groups (salaried and weekly paid), Visiting Medical Specialists, Salaried Medical Officers and Clinical Academics, and commence for firefighters, the Rail Commissioner’s tram employees, school and preschool staff.
Expenditure on salaries and wages is the largest expense for the government, representing 43 per cent of general government sector costs in 2017–18. In the current economic climate it is essential that wage increases in the public sector are responsible and sustainable. In the 2016–17 Budget, the government announced it would adopt a wages policy to limit wage growth to 1.5 per cent per annum over the next three years of each enterprise agreement.
The outcomes of future wage negotiations will be crucial in determining whether expenditure over the forward estimates in this budget can be achieved and the planned level of government services can be delivered in light of the current challenging economic conditions.
Superannuation expenses
Table 2.10: General government superannuation expenses — forward estimates
2016–17 Estimated
Result 2017–18 Budget
2018–19 Estimate
2019–20 Estimate
2020–21 Estimate
Superannuation expenses ($m) Superannuation interest cost 345 363 352 341 328 Other superannuation expenses 829 850 858 872 875
Nominal growth (%) 2.4% 3.3% -0.2% 0.2% -0.9% Real growth (%) 0.9% 1.3% -2.4% -2.3% -3.3%
The estimated nominal superannuation interest expense represents the increase during the year in the defined benefit superannuation obligations due to it being one year closer to settlement, less the expected earnings on superannuation assets. The nominal superannuation interest expense for each year is calculated based on the unfunded superannuation liability at the end of the preceding financial
Chapter 2: Expenditure
32 2017–18 Budget Statement
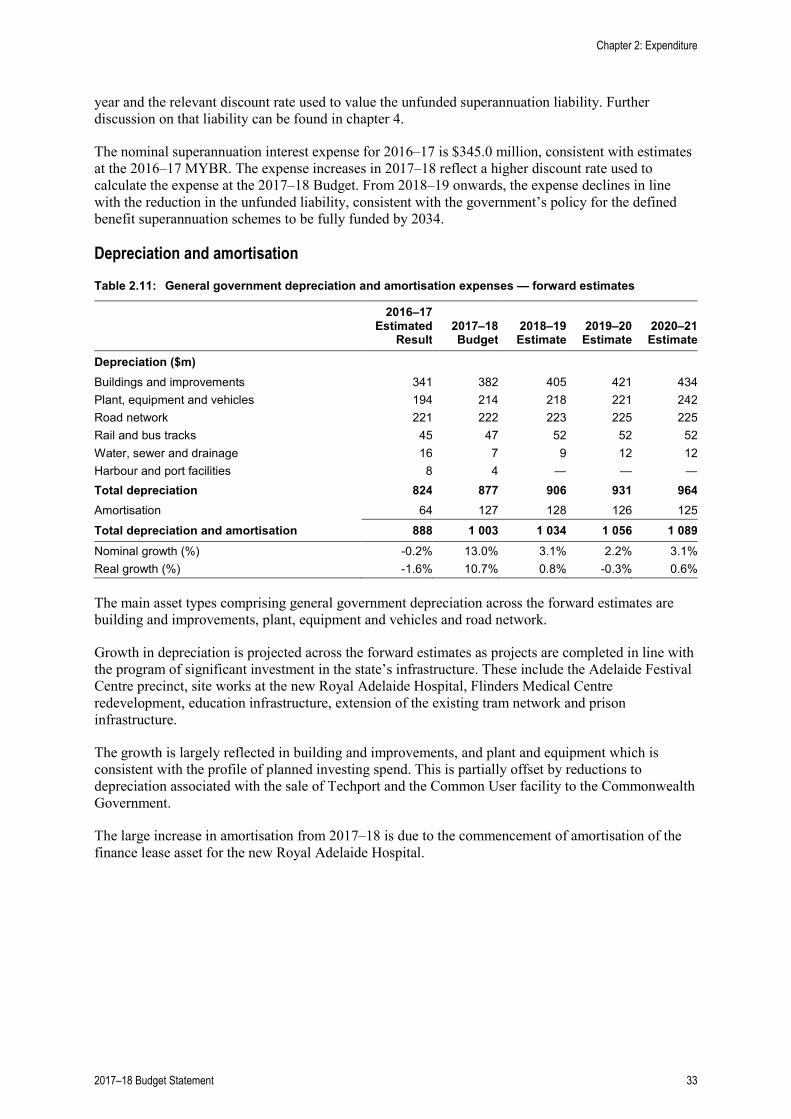
year and the relevant discount rate used to value the unfunded superannuation liability. Further discussion on that liability can be found in chapter 4.
The nominal superannuation interest expense for 2016–17 is $345.0 million, consistent with estimates at the 2016–17 MYBR. The expense increases in 2017–18 reflect a higher discount rate used to calculate the expense at the 2017–18 Budget. From 2018–19 onwards, the expense declines in line with the reduction in the unfunded liability, consistent with the government’s policy for the defined benefit superannuation schemes to be fully funded by 2034.
Depreciation and amortisation
Table 2.11: General government depreciation and amortisation expenses — forward estimates
2016–17 Estimated
Result 2017–18
Budget 2018–19 Estimate
2019–20 Estimate
2020–21 Estimate
Depreciation ($m) Buildings and improvements 341 382 405 421 434 Plant, equipment and vehicles 194 214 218 221 242 Road network 221 222 223 225 225 Rail and bus tracks 45 47 52 52 52 Water, sewer and drainage 16 7 9 12 12 Harbour and port facilities 8 4 — — — Total depreciation 824 877 906 931 964 Amortisation 64 127 128 126 125 Total depreciation and amortisation 888 1 003 1 034 1 056 1 089 Nominal growth (%) -0.2% 13.0% 3.1% 2.2% 3.1% Real growth (%) -1.6% 10.7% 0.8% -0.3% 0.6%
The main asset types comprising general government depreciation across the forward estimates are building and improvements, plant, equipment and vehicles and road network.
Growth in depreciation is projected across the forward estimates as projects are completed in line with the program of significant investment in the state’s infrastructure. These include the Adelaide Festival Centre precinct, site works at the new Royal Adelaide Hospital, Flinders Medical Centre redevelopment, education infrastructure, extension of the existing tram network and prison infrastructure.
The growth is largely reflected in building and improvements, and plant and equipment which is consistent with the profile of planned investing spend. This is partially offset by reductions to depreciation associated with the sale of Techport and the Common User facility to the Commonwealth Government.
The large increase in amortisation from 2017–18 is due to the commencement of amortisation of the finance lease asset for the new Royal Adelaide Hospital.
Chapter 2: Expenditure
2017–18 Budget Statement 33
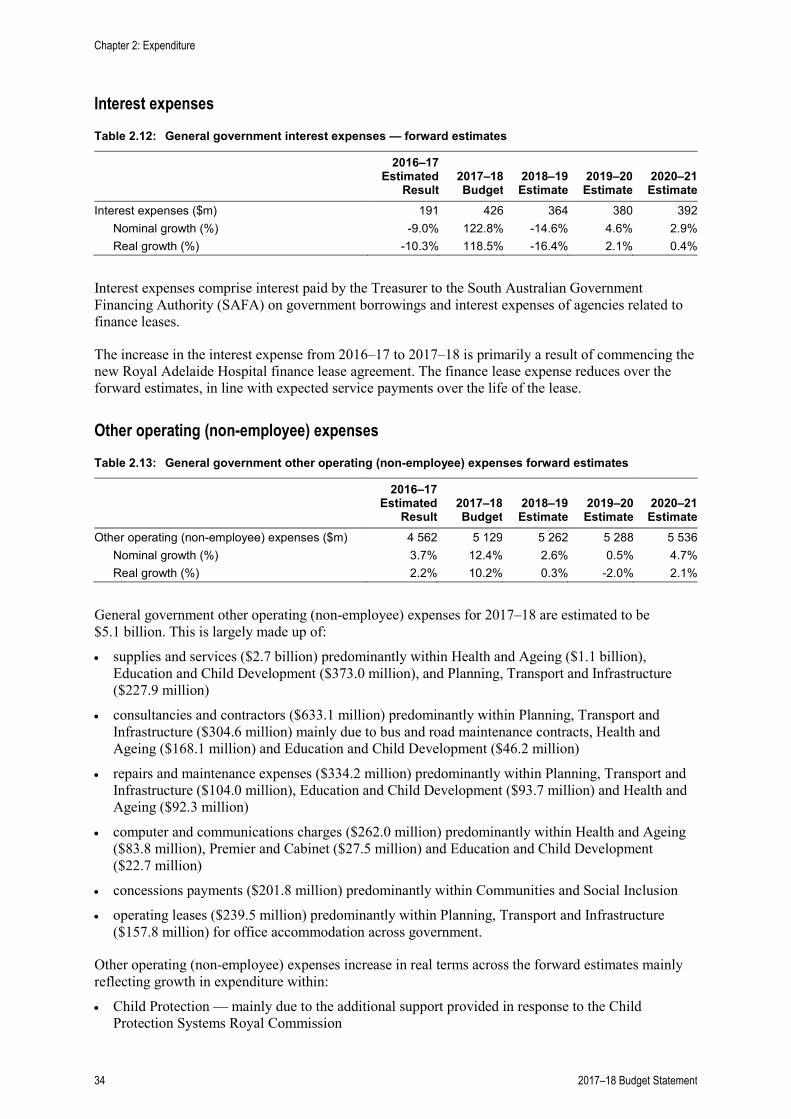
Interest expenses
Table 2.12: General government interest expenses — forward estimates
2016–17 Estimated
Result 2017–18 Budget
2018–19 Estimate
2019–20 Estimate
2020–21 Estimate
Interest expenses ($m) 191 426 364 380 392 Nominal growth (%) -9.0% 122.8% -14.6% 4.6% 2.9% Real growth (%) -10.3% 118.5% -16.4% 2.1% 0.4%
Interest expenses comprise interest paid by the Treasurer to the South Australian Government Financing Authority (SAFA) on government borrowings and interest expenses of agencies related to finance leases.
The increase in the interest expense from 2016–17 to 2017–18 is primarily a result of commencing the new Royal Adelaide Hospital finance lease agreement. The finance lease expense reduces over the forward estimates, in line with expected service payments over the life of the lease.
Other operating (non-employee) expenses
Table 2.13: General government other operating (non-employee) expenses forward estimates
2016–17 Estimated
Result 2017–18 Budget
2018–19 Estimate
2019–20 Estimate
2020–21 Estimate
Other operating (non-employee) expenses ($m) 4 562 5 129 5 262 5 288 5 536 Nominal growth (%) 3.7% 12.4% 2.6% 0.5% 4.7% Real growth (%) 2.2% 10.2% 0.3% -2.0% 2.1%
General government other operating (non-employee) expenses for 2017–18 are estimated to be $5.1 billion. This is largely made up of:
• supplies and services ($2.7 billion) predominantly within Health and Ageing ($1.1 billion), Education and Child Development ($373.0 million), and Planning, Transport and Infrastructure ($227.9 million)
• consultancies and contractors ($633.1 million) predominantly within Planning, Transport and Infrastructure ($304.6 million) mainly due to bus and road maintenance contracts, Health and Ageing ($168.1 million) and Education and Child Development ($46.2 million)
• repairs and maintenance expenses ($334.2 million) predominantly within Planning, Transport and Infrastructure ($104.0 million), Education and Child Development ($93.7 million) and Health and Ageing ($92.3 million)
• computer and communications charges ($262.0 million) predominantly within Health and Ageing ($83.8 million), Premier and Cabinet ($27.5 million) and Education and Child Development ($22.7 million)
• concessions payments ($201.8 million) predominantly within Communities and Social Inclusion
• operating leases ($239.5 million) predominantly within Planning, Transport and Infrastructure ($157.8 million) for office accommodation across government.
Other operating (non-employee) expenses increase in real terms across the forward estimates mainly reflecting growth in expenditure within:
• Child Protection — mainly due to the additional support provided in response to the Child Protection Systems Royal Commission
Chapter 2: Expenditure
34 2017–18 Budget Statement
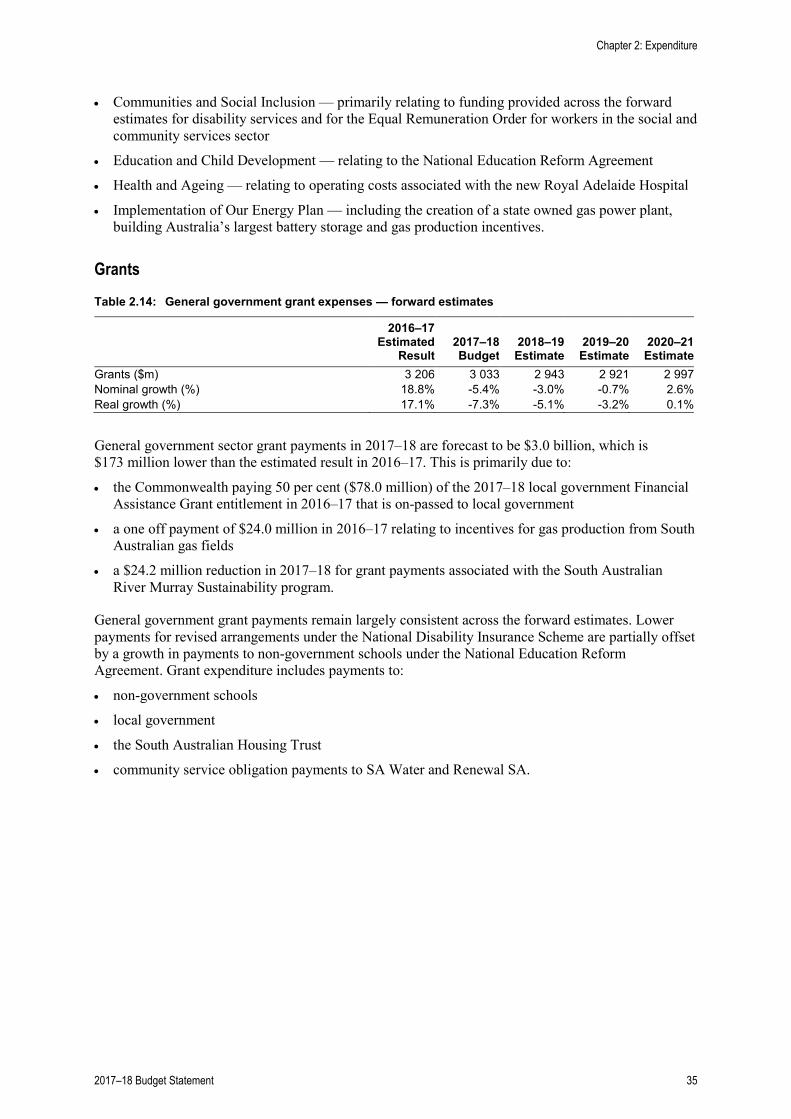
• Communities and Social Inclusion — primarily relating to funding provided across the forward estimates for disability services and for the Equal Remuneration Order for workers in the social and community services sector
• Education and Child Development — relating to the National Education Reform Agreement
• Health and Ageing — relating to operating costs associated with the new Royal Adelaide Hospital
• Implementation of Our Energy Plan — including the creation of a state owned gas power plant, building Australia’s largest battery storage and gas production incentives.
Grants
Table 2.14: General government grant expenses — forward estimates
2016–17 Estimated
Result 2017–18 Budget
2018–19 Estimate
2019–20 Estimate
2020–21 Estimate
Grants ($m) 3 206 3 033 2 943 2 921 2 997 Nominal growth (%) 18.8% -5.4% -3.0% -0.7% 2.6% Real growth (%) 17.1% -7.3% -5.1% -3.2% 0.1%
General government sector grant payments in 2017–18 are forecast to be $3.0 billion, which is $173 million lower than the estimated result in 2016–17. This is primarily due to:
• the Commonwealth paying 50 per cent ($78.0 million) of the 2017–18 local government Financial Assistance Grant entitlement in 2016–17 that is on-passed to local government
• a one off payment of $24.0 million in 2016–17 relating to incentives for gas production from South Australian gas fields
• a $24.2 million reduction in 2017–18 for grant payments associated with the South Australian River Murray Sustainability program.
General government grant payments remain largely consistent across the forward estimates. Lower payments for revised arrangements under the National Disability Insurance Scheme are partially offset by a growth in payments to non-government schools under the National Education Reform Agreement. Grant expenditure includes payments to:
• non-government schools
• local government
• the South Australian Housing Trust
• community service obligation payments to SA Water and Renewal SA.
Chapter 2: Expenditure
2017–18 Budget Statement 35
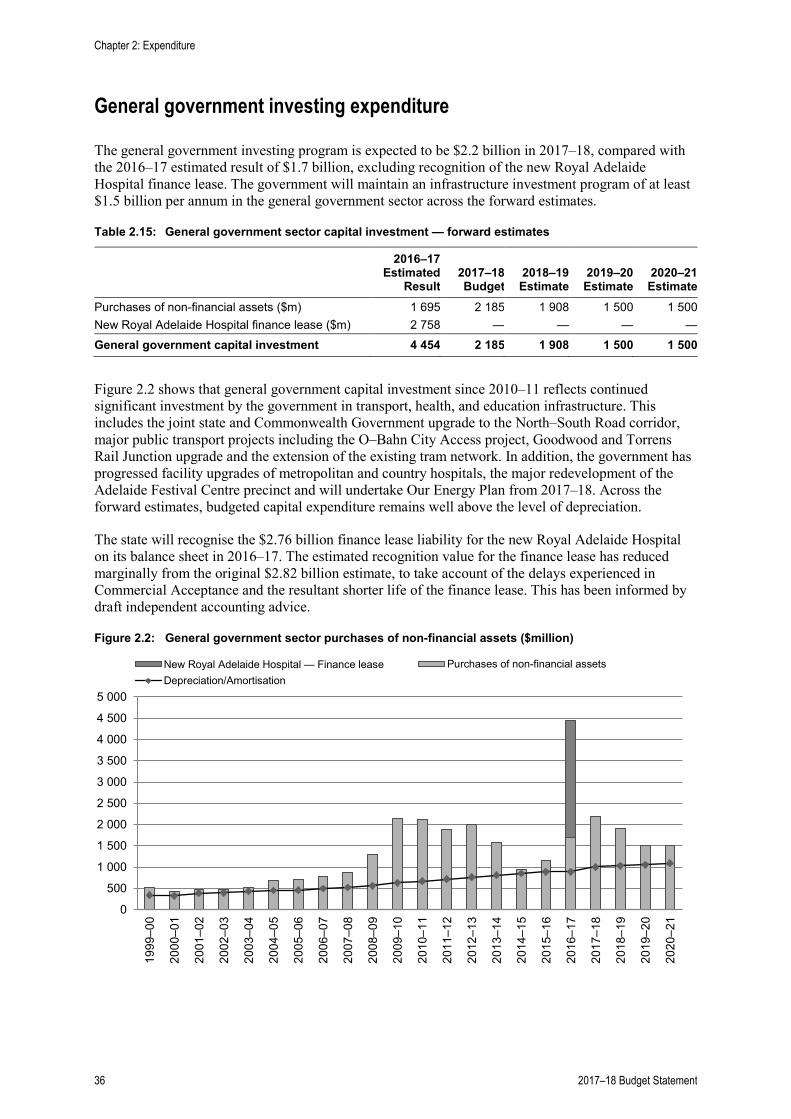
General government investing expenditure
The general government investing program is expected to be $2.2 billion in 2017–18, compared with the 2016–17 estimated result of $1.7 billion, excluding recognition of the new Royal Adelaide Hospital finance lease. The government will maintain an infrastructure investment program of at least $1.5 billion per annum in the general government sector across the forward estimates.
Table 2.15: General government sector capital investment — forward estimates
2016–17 Estimated
Result 2017–18 Budget
2018–19 Estimate
2019–20 Estimate
2020–21 Estimate
Purchases of non-financial assets ($m) 1 695 2 185 1 908 1 500 1 500 New Royal Adelaide Hospital finance lease ($m) 2 758 — — — — General government capital investment 4 454 2 185 1 908 1 500 1 500
Figure 2.2 shows that general government capital investment since 2010–11 reflects continued significant investment by the government in transport, health, and education infrastructure. This includes the joint state and Commonwealth Government upgrade to the North–South Road corridor, major public transport projects including the O–Bahn City Access project, Goodwood and Torrens Rail Junction upgrade and the extension of the existing tram network. In addition, the government has progressed facility upgrades of metropolitan and country hospitals, the major redevelopment of the Adelaide Festival Centre precinct and will undertake Our Energy Plan from 2017–18. Across the forward estimates, budgeted capital expenditure remains well above the level of depreciation.
The state will recognise the $2.76 billion finance lease liability for the new Royal Adelaide Hospital on its balance sheet in 2016–17. The estimated recognition value for the finance lease has reduced marginally from the original $2.82 billion estimate, to take account of the delays experienced in Commercial Acceptance and the resultant shorter life of the finance lease. This has been informed by draft independent accounting advice.
Figure 2.2: General government sector purchases of non-financial assets ($million)
0
500
1 000
1 500
2 000
2 500
3 000
3 500
4 000
4 500
5 000
1999
–00
2000
–01
2001
–02
2002
–03
2003
–04
2004
–05
2005
–06
2006
–07
2007
–08
2008
–09
2009
–10
2010
–11
2011
–12
2012
–13
2013
–14
2014
–15
2015
–16
2016
–17
2017
–18
2018
–19
2019
–20
2020
–21
New Royal Adelaide Hospital — Finance lease Purchases of non-financial assetsDepreciation/Amortisation
Chapter 2: Expenditure
36 2017–18 Budget Statement
Significant investments being undertaken by the government include:
• $4.1 billion, of which $1.9 billion will be spent over the forward estimates, in partnership with the Commonwealth Government for road projects to improve traffic flow along the North–South Road Corridor. Significant projects include the South Road upgrade from Torrens Road to the River Torrens, South Road Superway, Darlington upgrade, the Northern Connector and the Oaklands Crossing redevelopment. Subject to the Commonwealth Government agreeing to match the state commitment, the Government of South Australia has also committed to funding the next stage of the North–South Road upgrade, being the section of South Road from Regency Road to Pym Street
• $1.5 billion, of which $875.0 million will be spent over the forward estimates, on major public transport projects, which in the forward estimates period will include the Torrens Rail Junction upgrade, O-Bahn City Access project, extension of the Tonsley Train line to Flinders Medical Centre, extension of the tram network along North Terrace to the existing Royal Adelaide Hospital site, the overhaul, maintenance and life extension of rail cars and the purchase of new buses. Subject to the Commonwealth agreeing to match the state commitment, the state government has also committed to funding the electrification of the Gawler Rail Line from Salisbury to Gawler
• $1.5 billion, of which $425.4 million will be spent over the forward estimates, for redevelopment of major metropolitan and regional hospitals including works at the new Royal Adelaide Hospital, The Queen Elizabeth Hospital, Lyell McEwin Hospital, Modbury Hospital and Flinders Medical Centre. Construction of the Adelaide Women’s Hospital will commence as well as upgrades to the existing Women’s and Children’s Hospital to sustain services
• $463.8 million, of which $409.3 million will be spent over the forward estimates, on education projects including continuation of the contemporary science, technology, engineering and mathematics (STEM) initiative, construction of the Botanic High School, addressing the National Quality Agenda compliance, transitioning schools to renewable energy programs and improving facilities for pre-schools and at children’s centres. In addition the state will enter into a public private partnership (PPP) to oversee the construction of two new schools in Adelaide’s northern and southern metropolitan regions.
Table 2.16 summarises the investing program for the general government sector by agency. Further detail on agency investing programs is contained in the 2017–18 Agency Statements.
Agency investing programs contain budgets for approved major works projects and annual program expenditure. Annual program expenditure is generally provided to agencies to complete minor works or upgrade existing assets.
Typically, the investing program of an agency will decline over the forward estimates as major works are budgeted to be completed. As new projects are approved by the government, the budget of an agency will be increased to include the budgeted cost of those projects.
The general government sector budget holds a contingency provision over the forward estimates to maintain the overall size of the government’s investing budget. While agency budgets typically decline over the forward estimates as projects are scheduled to finish, the contingency provision will rise as the unallocated component of the overall general government sector budget increases.
Chapter 2: Expenditure
2017–18 Budget Statement 37
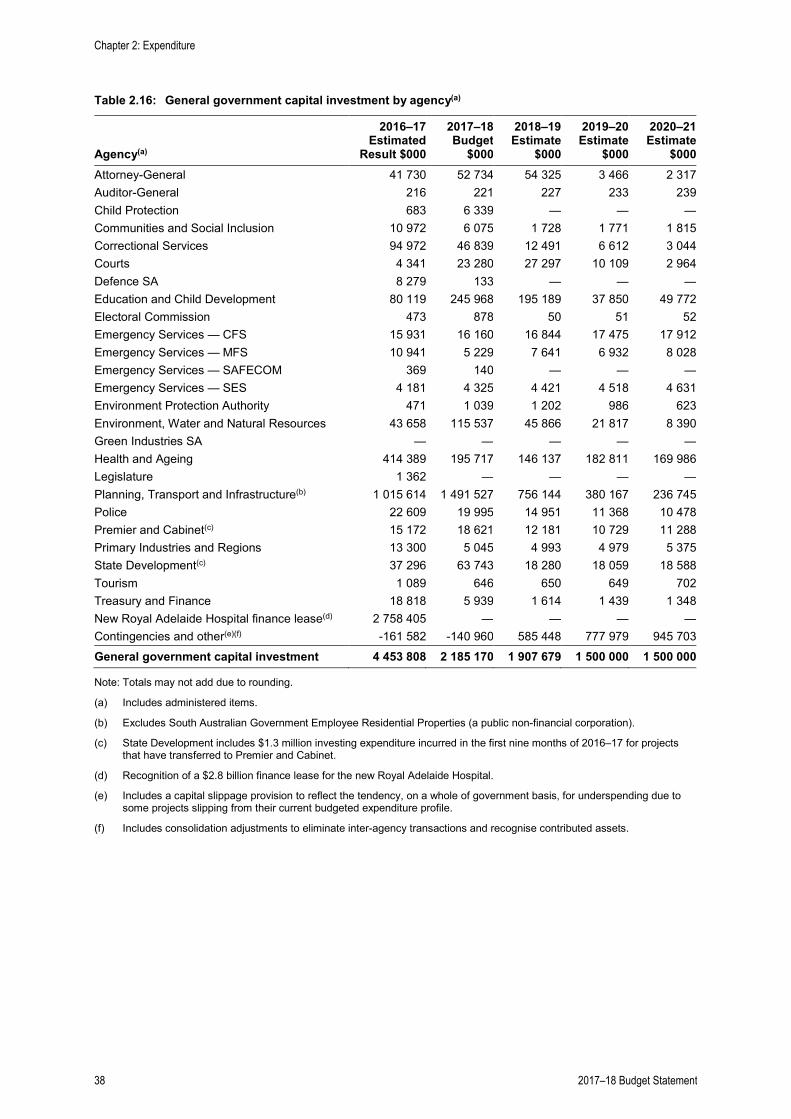
Table 2.16: General government capital investment by agency(a)
Agency(a)
2016–17 Estimated
Result $000
2017–18 Budget
$000
2018–19 Estimate
$000
2019–20 Estimate
$000
2020–21 Estimate
$000 Attorney-General 41 730 52 734 54 325 3 466 2 317 Auditor-General 216 221 227 233 239 Child Protection 683 6 339 — — — Communities and Social Inclusion 10 972 6 075 1 728 1 771 1 815 Correctional Services 94 972 46 839 12 491 6 612 3 044 Courts 4 341 23 280 27 297 10 109 2 964 Defence SA 8 279 133 — — — Education and Child Development 80 119 245 968 195 189 37 850 49 772 Electoral Commission 473 878 50 51 52 Emergency Services — CFS 15 931 16 160 16 844 17 475 17 912 Emergency Services — MFS 10 941 5 229 7 641 6 932 8 028 Emergency Services — SAFECOM 369 140 — — — Emergency Services — SES 4 181 4 325 4 421 4 518 4 631 Environment Protection Authority 471 1 039 1 202 986 623 Environment, Water and Natural Resources 43 658 115 537 45 866 21 817 8 390 Green Industries SA — — — — — Health and Ageing 414 389 195 717 146 137 182 811 169 986 Legislature 1 362 — — — — Planning, Transport and Infrastructure(b) 1 015 614 1 491 527 756 144 380 167 236 745 Police 22 609 19 995 14 951 11 368 10 478 Premier and Cabinet(c) 15 172 18 621 12 181 10 729 11 288 Primary Industries and Regions 13 300 5 045 4 993 4 979 5 375 State Development(c) 37 296 63 743 18 280 18 059 18 588 Tourism 1 089 646 650 649 702 Treasury and Finance 18 818 5 939 1 614 1 439 1 348 New Royal Adelaide Hospital finance lease(d) 2 758 405 — — — — Contingencies and other(e)(f) -161 582 -140 960 585 448 777 979 945 703 General government capital investment 4 453 808 2 185 170 1 907 679 1 500 000 1 500 000
Note: Totals may not add due to rounding.
(a) Includes administered items.
(b) Excludes South Australian Government Employee Residential Properties (a public non-financial corporation).
(c) State Development includes $1.3 million investing expenditure incurred in the first nine months of 2016–17 for projects that have transferred to Premier and Cabinet.
(d) Recognition of a $2.8 billion finance lease for the new Royal Adelaide Hospital.
(e) Includes a capital slippage provision to reflect the tendency, on a whole of government basis, for underspending due to some projects slipping from their current budgeted expenditure profile.
(f) Includes consolidation adjustments to eliminate inter-agency transactions and recognise contributed assets.
Chapter 2: Expenditure
38 2017–18 Budget Statement
Chapter 3: Revenue
Overview
This chapter provides an overview of new revenue measures introduced as part of the 2017–18 Budget and summarises movements in government revenues over the forward estimates.
Total general government revenues are projected to grow in real terms by 0.2 per cent per annum on average over the period 2016–17 to 2020–21. This relatively low growth largely reflects the profile of dividend payments from the Motor Accident Commission (MAC), expected relatively low growth in GST grants in 2018–19 and 2019–20, a decline in Commonwealth Government National Partnership grants and the impact of the 2015–16 State Budget tax cuts being phased in over the coming years.
In line with the government’s commitment to support small businesses, job creation and encourage economic growth in the state, the payroll tax rate for small businesses will be lowered to lock in and expand the assistance currently provided under the small business payroll tax rebate scheme. In addition, the existing Job Accelerator Grant will be increased by up to $5000 for employers who hire new eligible apprentices and trainees. The 2017–18 Budget also includes an extension to the current off-the-plan apartment stamp duty concession as well as a new $10 000 grant for eligible apartments where construction has not commenced.
These measures build upon the significant tax cuts and related initiatives introduced over the last two budgets. The measures announced in the 2015–16 budget comprised the most comprehensive tax reform package in the state’s history and included the abolition of a range of stamp duties and other charges. Some of these changes are being phased in over the next few years including the abolition of duty on transfers of non-residential, non-primary production property. South Australia currently has the lowest duty on transfers of non-residential property following the first one third reduction in duty in December 2015. Duty rates will be reduced by a further third on 1 July 2017, before being fully abolished from 1 July 2018. The 2016–17 Budget also introduced the Job Accelerator Grant program providing grants of up to $10 000 for eligible new positions created between July 2016 and June 2018. Table 3.1outlines the measures introduced since the 2015–16 Budget.
Table 3.1: Major tax reforms and supporting measures from the 2015–16 Budget to 2017–18 Budget
2015–16 Budget Taxes Abolished
• Share duty (18 June 2015) • Stamp duty on:
– Non-real property (e.g. non-fixed plant and equipment 18 June 2015) – Corporate reconstructions (18 June 2015)
• Save the River Murray Levy (1 July 2015) • Hindmarsh Island Bridge Levy (1 July 2015)
2015–16 Budget Taxes being abolished
• Phased abolition of stamp duty on non-residential real property transfers: – Duty rates reduced by one third from 7 December 2015 – Reduced by a further one third from 1 July 2017 – Abolished from 1 July 2018.
• Stamp duty on the transfer of units in a unit trust – Abolished from 1 July 2018.
2017–18 Budget Statement 39
2016–17 Budget • Small business payroll tax rebate extended to 2019–20. • Off-the-plan apartment stamp duty concession extended to 30 June 2017 and
expanded statewide. • Job Accelerator Grant introduced for businesses that increase their number of
employees between 1 July 2016 and 30 June 2018. – a grant of up to $10 000 for each full-time equivalent worker for businesses
liable for payroll tax with total Australian wages of $5 million or less – a grant of up to $4000 for each full-time equivalent worker for businesses
not liable for payroll tax. • Betting Operations Tax of 15 per cent introduced on net wagering revenue
received from persons located in South Australia by all Australian-based wagering operators.
2017–18 Budget • Lower payroll tax rate for small businesses (replaces small business payroll tax rebate) – Rate of 2.5 per cent for taxable payrolls up to $1 million with rate
incrementally increasing to 4.95 per cent for businesses with Australian payrolls above $1.5 million.
• Off-the-plan apartment statewide stamp duty concession extended to 30 June 2018.
• Land tax exemption for five years for investors who enter into off-the-plan apartments contracts between 22 June 2017 and 30 June 2018.
• Pre-construction grant of $10 000 for purchases of off-the-plan apartments where construction of the apartment has not commenced and contract is entered into between 22 June 2017 to 30 September 2017.
• Job Accelerator Grant increased by up to $5000 for each eligible new apprentice or trainee employed and eligible for an existing Job Accelerator Grant.
• Conveyance duty surcharge of four per cent on purchases of residential property by foreign buyers and temporary residents to apply from 1 January 2018.
• South Australian major bank levy to be introduced from 1 July 2017. The levy will apply to all authorised deposit-taking institutions that operate in South Australia and are liable for the Commonwealth Government major bank levy.
(a) The 2015–16 Budget also included a number of other stamp duty and land tax relief measures as well as legislation of ex gratia schemes.
Details on the government’s new revenue measures are provided in the following section.
New initiatives
The 2017–18 Budget introduces a number of new initiatives including three broad assistance measures to support growth in businesses and jobs as well as two taxation measures.
Recognising the importance of small and medium sized businesses in South Australia, a new lower payroll tax rate will be introduced from 1 July 2017 to replace the existing small business payroll tax rebate scheme. The new rate structure locks in the concessional arrangements that apply as a result of the rebate as a permanent feature of the payroll tax rate structure and extends it to more small businesses.
It is estimated that around 3200 employers will be eligible for a payroll tax rate lower than the standard 4.95 per cent rate. Of these, an estimated 1300 employers will benefit by up to $8820 from this initiative each year compared with the assistance received under the small business payroll tax rebate.
The current stamp duty concession for purchases of off-the-plan apartments, due to expire on 30 June 2017, has been extended for a further 12 months to provide further support to the construction industry and purchasers. Consistent with the existing concession scheme, eligible contracts entered into for the purchase of an off-the-plan apartment within the state will receive a stamp duty concession of up to $15 500. It is estimated that 800 off-the-plan apartment purchases will benefit from the
Chapter 3: Revenue
40 2017–18 Budget Statement
extension of the concession. From 22 June 2017, foreign purchasers will no longer be eligible for the off-the-plan concession.
A $10 000 grant will also be introduced for purchases of off-the-plan apartments where construction of the apartment building has not yet commenced and the sale contract is entered into between 22 June 2017 to 30 September 2017 (both dates inclusive).
Combined with the extension of the off-the-plan stamp duty concession, eligible recipients can receive up to $25 500 in assistance for purchases of off-the-plan apartments. Eligible first home buyers will be able to receive up to $40 500 in assistance. A land tax exemption for a period of five years from the commencement of ownership will also apply for off-the-plan apartment contracts entered into between 22 June 2017 and 30 June 2018.
The Job Accelerator Grant introduced in the 2016–17 Budget will be increased by up to $5000 for each eligible new apprentice or trainee employed and eligible for an existing Job Accelerator Grant. The additional amount will be paid in two equal instalments on the first and second anniversary of employment. It is estimated that around 2000 applications will be eligible for the additional grant.
Businesses with payrolls between $600 000 and $5 million will receive up to $15 000 for each new apprentice and trainee, while small businesses with payrolls up to $600 000 will receive up to $9000.
A South Australian major bank levy will be introduced from 1 July 2017. The levy will apply to all authorised-deposit-taking institutions that operate in South Australian and are liable for the Commonwealth Government major bank levy.
The amount payable under the South Australian major bank levy will be 0.015 per cent of South Australia’s estimated share of the total value of bank liabilities subject to the Commonwealth Government major bank levy at the end of each quarter. South Australia’s estimated share of relevant bank liabilities will be determined as South Australia’s gross state product share of national gross domestic product (currently around 6 per cent).
This measure will effectively double the rate of the Commonwealth Government’s major bank levy, but only on the proportion of estimated liabilities in South Australia.
A four per cent conveyance duty surcharge on purchases of residential property by foreign buyers and temporary residents will be introduced from 1 January 2018. This surcharge will be in addition to any other conveyance duty payable on the transfer of residential property. New South Wales, Victoria and Queensland also levy a similar surcharge on foreign buyers of certain property.
As announced in last year’s budget, from 1 July 2017, a 15 per cent tax will apply on net wagering revenue received from persons located in South Australia by all Australian based wagering operators. A tax-free threshold of $150 000 net wagering revenue will apply for all operators. To help fund services to support and rehabilitate people affected by problem gambling, $500 000 of the tax collected will be paid into the Gamblers Rehabilitation Fund each year.
Chapter 3: Revenue
2017–18 Budget Statement 41
Table 3.2: Revenue measures in the 2017–18 Budget ($million)
2016–17 Estimate
2017–18 Budget
2018–19 Estimate
2019–20 Estimate
2020–21 Estimate
Revenue — taxation measures(a)
South Australian major bank levy — 97.0 89.0 89.0 95.0 Lower the payroll tax rate for small businesses — -15.3 -5.1 -5.5 -19.2 Introduce a conveyance duty surcharge on foreign buyers of residential property
— 6.2 13.3 14.2 15.1
Extend the off-the-plan apartment stamp duty concession
— -0.8 -4.2 -3.4 —
Introduce a five year land tax exemption for investors who purchase off-the-plan apartments
— — -0.1 -0.1 -0.1
Total revenue measures — taxation — 87.1 92.9 94.2 90.8
(a) The Pre-construction Grant and Job Accelerator Grant for apprentices and trainees are expenditure measures and are not reflected in this table.
General government sector revenue
Total general government sector operating revenues are projected to increase by 2.8 per cent in real terms in 2017–18, following a real-terms increase of 3.7 per cent in 2016–17. Growth in operating revenue in 2017–18 is principally due to an increase in Commonwealth Government capital grant funding, South Australia’s share of the national GST pool and growth in taxation revenues. Negative real growth in 2018–19 and 2019–20 largely reflects a fall in dividend and income tax equivalent revenue.
Total general government sector revenues are provided in table 3.3.
Table 3.3: General government sector revenues ($million)
2016–17 Budget
2016–17 Estimated
Result 2017–18 Budget
2018–19 Estimate
2019–20 Estimate
2020–21 Estimate
Taxation revenue 4 517.2 4 421.1 4 629.2 4 782.8 4 998.4 5 228.2 Grant revenue 10 245.8 10 005.1 10 660.6 10 769.8 10 846.9 11 254.2 Sales of goods and services 2 486.5 2 526.9 2 568.5 2 633.7 2 698.1 2 741.7 Interest income 23.6 23.7 24.6 25.6 27.0 29.4 Dividend and ITE(a) revenue 326.3 627.6 592.4 395.7 286.3 258.1 Other revenue 663.9 664.2 672.7 700.3 700.3 690.6 Total revenue 18 263.3 18 268.7 19 147.9 19 307.9 19 557.1 20 202.3
% change on previous year Nominal-terms growth (%)
5.2 4.8 0.8 1.3 3.3 Real-terms growth (%) 3.7 2.8 -1.4 -1.2 0.8
Note: Totals may not add due to rounding.
(a) Income tax equivalent (ITE).
Chapter 3: Revenue
42 2017–18 Budget Statement
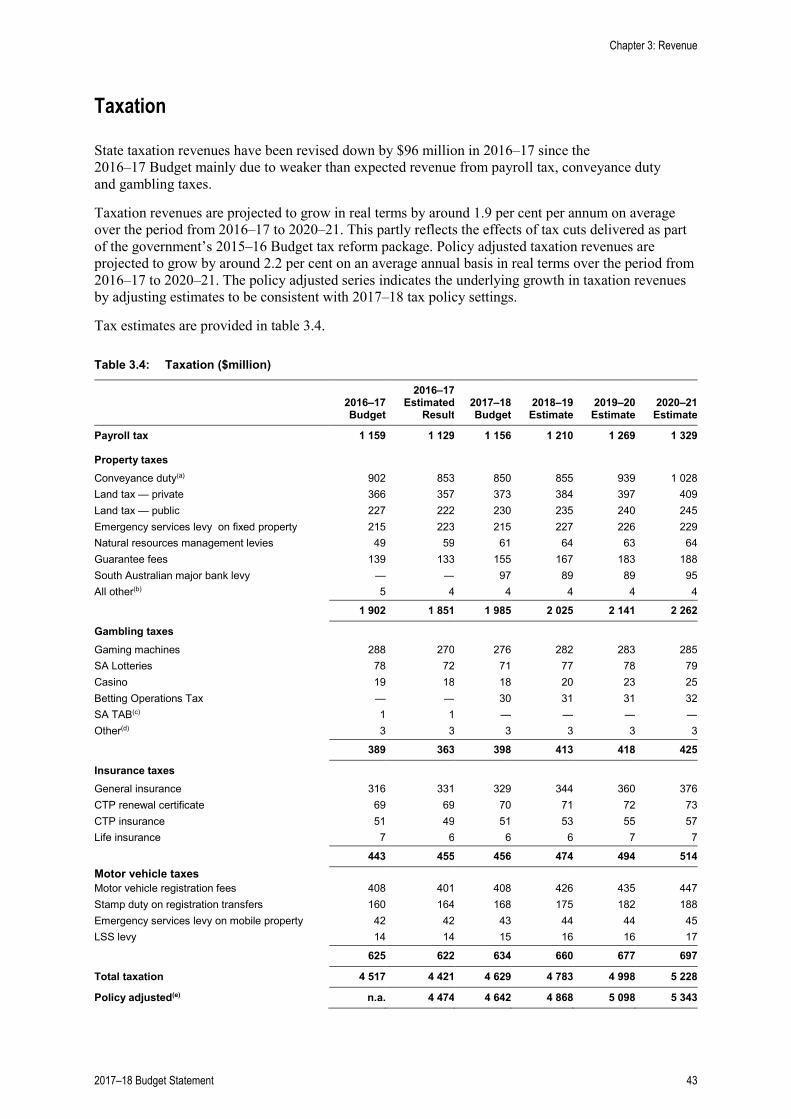
Taxation
State taxation revenues have been revised down by $96 million in 2016–17 since the 2016–17 Budget mainly due to weaker than expected revenue from payroll tax, conveyance duty and gambling taxes.
Taxation revenues are projected to grow in real terms by around 1.9 per cent per annum on average over the period from 2016–17 to 2020–21. This partly reflects the effects of tax cuts delivered as part of the government’s 2015–16 Budget tax reform package. Policy adjusted taxation revenues are projected to grow by around 2.2 per cent on an average annual basis in real terms over the period from 2016–17 to 2020–21. The policy adjusted series indicates the underlying growth in taxation revenues by adjusting estimates to be consistent with 2017–18 tax policy settings.
Tax estimates are provided in table 3.4.
Table 3.4: Taxation ($million)
2016–17 Budget
2016–17 Estimated
Result 2017–18 Budget
2018–19 Estimate
2019–20 Estimate
2020–21 Estimate
Payroll tax 1 159 1 129 1 156 1 210 1 269 1 329
Property taxes
Conveyance duty(a) 902 853 850 855 939 1 028 Land tax — private 366 357 373 384 397 409 Land tax — public 227 222 230 235 240 245 Emergency services levy on fixed property 215 223 215 227 226 229 Natural resources management levies 49 59 61 64 63 64 Guarantee fees 139 133 155 167 183 188 South Australian major bank levy — — 97 89 89 95 All other(b) 5 4 4 4 4 4
1 902 1 851 1 985 2 025 2 141 2 262
Gambling taxes Gaming machines 288 270 276 282 283 285 SA Lotteries 78 72 71 77 78 79 Casino 19 18 18 20 23 25 Betting Operations Tax — — 30 31 31 32 SA TAB(c) 1 1 — — — — Other(d) 3 3 3 3 3 3
389 363 398 413 418 425
Insurance taxes General insurance 316 331 329 344 360 376 CTP renewal certificate 69 69 70 71 72 73 CTP insurance 51 49 51 53 55 57 Life insurance 7 6 6 6 7 7
443 455 456 474 494 514 Motor vehicle taxes Motor vehicle registration fees 408 401 408 426 435 447 Stamp duty on registration transfers 160 164 168 175 182 188 Emergency services levy on mobile property 42 42 43 44 44 45 LSS levy 14 14 15 16 16 17
625 622 634 660 677 697
Total taxation 4 517 4 421 4 629 4 783 4 998 5 228
Policy adjusted(e) n.a. 4 474 4 642 4 868 5 098 5 343
Chapter 3: Revenue
2017–18 Budget Statement 43
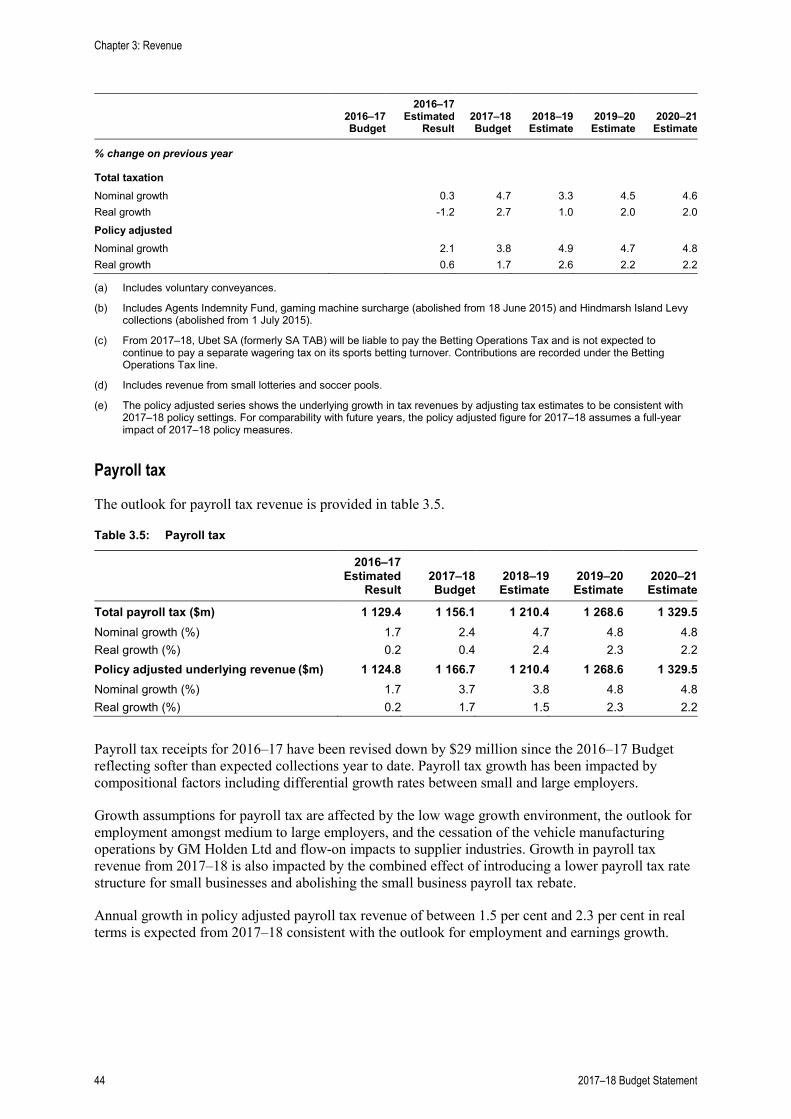
2016–17 Budget
2016–17 Estimated
Result 2017–18 Budget
2018–19 Estimate
2019–20 Estimate
2020–21 Estimate
% change on previous year
Total taxation Nominal growth 0.3 4.7 3.3 4.5 4.6 Real growth -1.2 2.7 1.0 2.0 2.0 Policy adjusted Nominal growth 2.1 3.8 4.9 4.7 4.8 Real growth 0.6 1.7 2.6 2.2 2.2
(a) Includes voluntary conveyances.
(b) Includes Agents Indemnity Fund, gaming machine surcharge (abolished from 18 June 2015) and Hindmarsh Island Levy collections (abolished from 1 July 2015).
(c) From 2017–18, Ubet SA (formerly SA TAB) will be liable to pay the Betting Operations Tax and is not expected to continue to pay a separate wagering tax on its sports betting turnover. Contributions are recorded under the Betting Operations Tax line.
(d) Includes revenue from small lotteries and soccer pools.
(e) The policy adjusted series shows the underlying growth in tax revenues by adjusting tax estimates to be consistent with 2017–18 policy settings. For comparability with future years, the policy adjusted figure for 2017–18 assumes a full-year impact of 2017–18 policy measures.
Payroll tax
The outlook for payroll tax revenue is provided in table 3.5.
Table 3.5: Payroll tax
2016–17 Estimated
Result 2017–18 Budget
2018–19 Estimate
2019–20 Estimate
2020–21 Estimate
Total payroll tax ($m) 1 129.4 1 156.1 1 210.4 1 268.6 1 329.5 Nominal growth (%) 1.7 2.4 4.7 4.8 4.8 Real growth (%) 0.2 0.4 2.4 2.3 2.2 Policy adjusted underlying revenue ($m) 1 124.8 1 166.7 1 210.4 1 268.6 1 329.5 Nominal growth (%) 1.7 3.7 3.8 4.8 4.8 Real growth (%) 0.2 1.7 1.5 2.3 2.2
Payroll tax receipts for 2016–17 have been revised down by $29 million since the 2016–17 Budget reflecting softer than expected collections year to date. Payroll tax growth has been impacted by compositional factors including differential growth rates between small and large employers.
Growth assumptions for payroll tax are affected by the low wage growth environment, the outlook for employment amongst medium to large employers, and the cessation of the vehicle manufacturing operations by GM Holden Ltd and flow-on impacts to supplier industries. Growth in payroll tax revenue from 2017–18 is also impacted by the combined effect of introducing a lower payroll tax rate structure for small businesses and abolishing the small business payroll tax rebate.
Annual growth in policy adjusted payroll tax revenue of between 1.5 per cent and 2.3 per cent in real terms is expected from 2017–18 consistent with the outlook for employment and earnings growth.
Chapter 3: Revenue
44 2017–18 Budget Statement
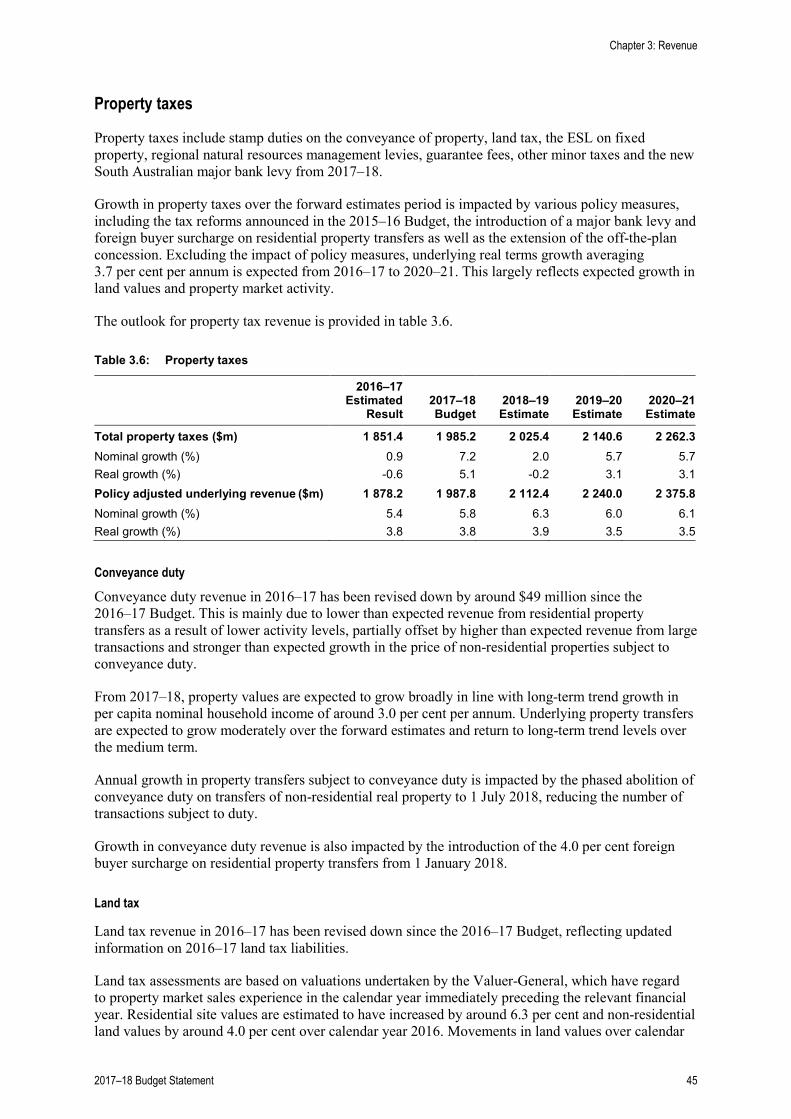
Property taxes
Property taxes include stamp duties on the conveyance of property, land tax, the ESL on fixed property, regional natural resources management levies, guarantee fees, other minor taxes and the new South Australian major bank levy from 2017–18.
Growth in property taxes over the forward estimates period is impacted by various policy measures, including the tax reforms announced in the 2015–16 Budget, the introduction of a major bank levy and foreign buyer surcharge on residential property transfers as well as the extension of the off-the-plan concession. Excluding the impact of policy measures, underlying real terms growth averaging 3.7 per cent per annum is expected from 2016–17 to 2020–21. This largely reflects expected growth in land values and property market activity.
The outlook for property tax revenue is provided in table 3.6.
Table 3.6: Property taxes
2016–17 Estimated
Result 2017–18 Budget
2018–19 Estimate
2019–20 Estimate
2020–21 Estimate
Total property taxes ($m) 1 851.4 1 985.2 2 025.4 2 140.6 2 262.3 Nominal growth (%) 0.9 7.2 2.0 5.7 5.7 Real growth (%) -0.6 5.1 -0.2 3.1 3.1 Policy adjusted underlying revenue ($m) 1 878.2 1 987.8 2 112.4 2 240.0 2 375.8 Nominal growth (%) 5.4 5.8 6.3 6.0 6.1 Real growth (%) 3.8 3.8 3.9 3.5 3.5
Conveyance duty
Conveyance duty revenue in 2016–17 has been revised down by around $49 million since the 2016–17 Budget. This is mainly due to lower than expected revenue from residential property transfers as a result of lower activity levels, partially offset by higher than expected revenue from large transactions and stronger than expected growth in the price of non-residential properties subject to conveyance duty.
From 2017–18, property values are expected to grow broadly in line with long-term trend growth in per capita nominal household income of around 3.0 per cent per annum. Underlying property transfers are expected to grow moderately over the forward estimates and return to long-term trend levels over the medium term.
Annual growth in property transfers subject to conveyance duty is impacted by the phased abolition of conveyance duty on transfers of non-residential real property to 1 July 2018, reducing the number of transactions subject to duty.
Growth in conveyance duty revenue is also impacted by the introduction of the 4.0 per cent foreign buyer surcharge on residential property transfers from 1 January 2018.
Land tax
Land tax revenue in 2016–17 has been revised down since the 2016–17 Budget, reflecting updated information on 2016–17 land tax liabilities.
Land tax assessments are based on valuations undertaken by the Valuer-General, which have regard to property market sales experience in the calendar year immediately preceding the relevant financial year. Residential site values are estimated to have increased by around 6.3 per cent and non-residential land values by around 4.0 per cent over calendar year 2016. Movements in land values over calendar
Chapter 3: Revenue
2017–18 Budget Statement 45
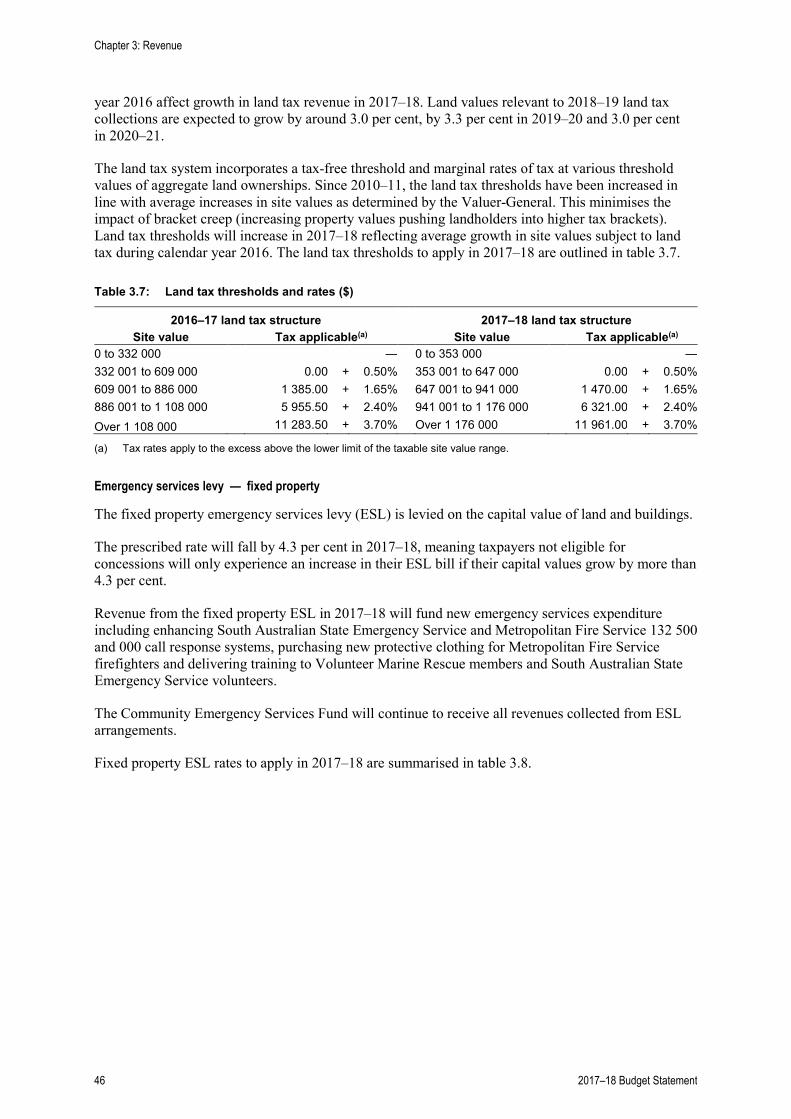
year 2016 affect growth in land tax revenue in 2017–18. Land values relevant to 2018–19 land tax collections are expected to grow by around 3.0 per cent, by 3.3 per cent in 2019–20 and 3.0 per cent in 2020–21.
The land tax system incorporates a tax-free threshold and marginal rates of tax at various threshold values of aggregate land ownerships. Since 2010–11, the land tax thresholds have been increased in line with average increases in site values as determined by the Valuer-General. This minimises the impact of bracket creep (increasing property values pushing landholders into higher tax brackets). Land tax thresholds will increase in 2017–18 reflecting average growth in site values subject to land tax during calendar year 2016. The land tax thresholds to apply in 2017–18 are outlined in table 3.7.
Table 3.7: Land tax thresholds and rates ($)
2016–17 land tax structure 2017–18 land tax structure Site value Tax applicable(a) Site value
Tax applicable(a)
0 to 332 000
— 0 to 353 000
—
332 001 to 609 000
0.00 + 0.50% 353 001 to 647 000
0.00 + 0.50%
609 001 to 886 000
1 385.00 + 1.65% 647 001 to 941 000
1 470.00 + 1.65%
886 001 to 1 108 000
5 955.50 + 2.40% 941 001 to 1 176 000
6 321.00 + 2.40%
Over 1 108 000
11 283.50 + 3.70% Over 1 176 000
11 961.00 + 3.70%
(a) Tax rates apply to the excess above the lower limit of the taxable site value range.
Emergency services levy — fixed property
The fixed property emergency services levy (ESL) is levied on the capital value of land and buildings.
The prescribed rate will fall by 4.3 per cent in 2017–18, meaning taxpayers not eligible for concessions will only experience an increase in their ESL bill if their capital values grow by more than 4.3 per cent.
Revenue from the fixed property ESL in 2017–18 will fund new emergency services expenditure including enhancing South Australian State Emergency Service and Metropolitan Fire Service 132 500 and 000 call response systems, purchasing new protective clothing for Metropolitan Fire Service firefighters and delivering training to Volunteer Marine Rescue members and South Australian State Emergency Service volunteers.
The Community Emergency Services Fund will continue to receive all revenues collected from ESL arrangements.
Fixed property ESL rates to apply in 2017–18 are summarised in table 3.8.
Chapter 3: Revenue
46 2017–18 Budget Statement
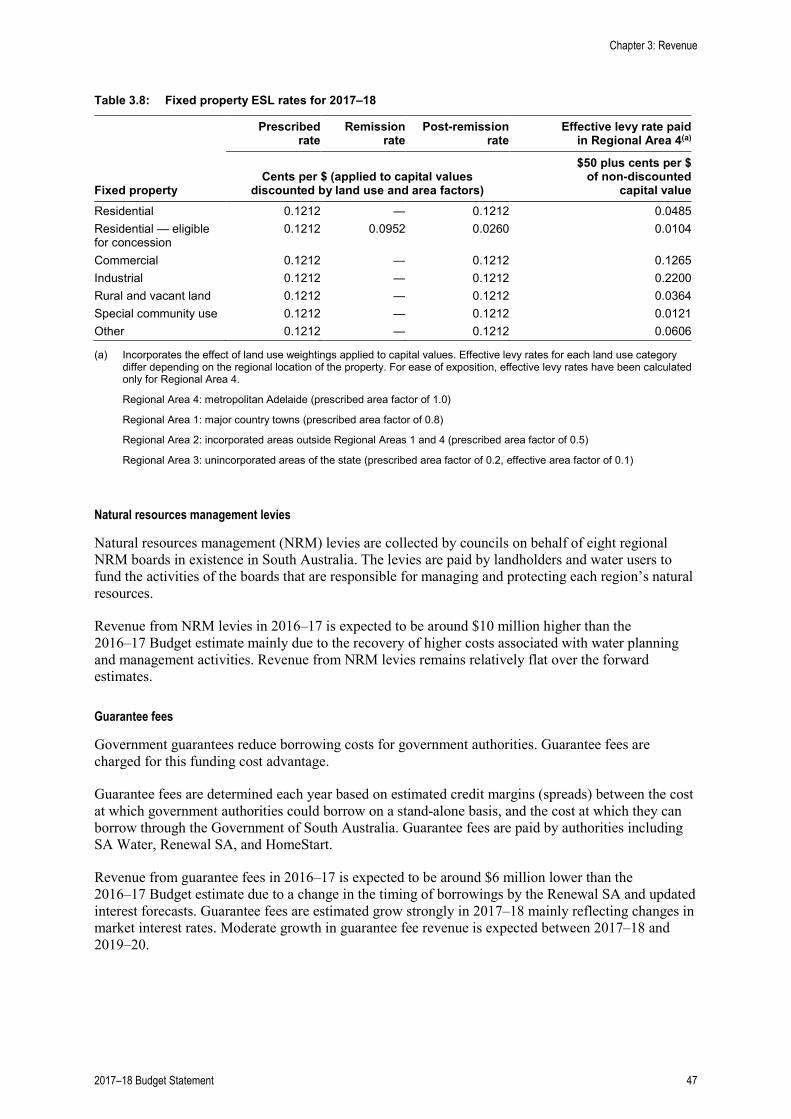
Table 3.8: Fixed property ESL rates for 2017–18
Prescribed rate
Remission rate
Post-remission rate
Effective levy rate paid in Regional Area 4(a)
Fixed property Cents per $ (applied to capital values
discounted by land use and area factors)
$50 plus cents per $ of non-discounted
capital value Residential 0.1212 — 0.1212 0.0485 Residential — eligible for concession
0.1212 0.0952 0.0260 0.0104
Commercial 0.1212 — 0.1212 0.1265 Industrial 0.1212 — 0.1212 0.2200 Rural and vacant land 0.1212 — 0.1212 0.0364 Special community use 0.1212 — 0.1212 0.0121 Other 0.1212 — 0.1212 0.0606
(a) Incorporates the effect of land use weightings applied to capital values. Effective levy rates for each land use category differ depending on the regional location of the property. For ease of exposition, effective levy rates have been calculated only for Regional Area 4.
Regional Area 4: metropolitan Adelaide (prescribed area factor of 1.0)
Regional Area 1: major country towns (prescribed area factor of 0.8)
Regional Area 2: incorporated areas outside Regional Areas 1 and 4 (prescribed area factor of 0.5)
Regional Area 3: unincorporated areas of the state (prescribed area factor of 0.2, effective area factor of 0.1)
Natural resources management levies
Natural resources management (NRM) levies are collected by councils on behalf of eight regional NRM boards in existence in South Australia. The levies are paid by landholders and water users to fund the activities of the boards that are responsible for managing and protecting each region’s natural resources.
Revenue from NRM levies in 2016–17 is expected to be around $10 million higher than the 2016–17 Budget estimate mainly due to the recovery of higher costs associated with water planning and management activities. Revenue from NRM levies remains relatively flat over the forward estimates.
Guarantee fees
Government guarantees reduce borrowing costs for government authorities. Guarantee fees are charged for this funding cost advantage.
Guarantee fees are determined each year based on estimated credit margins (spreads) between the cost at which government authorities could borrow on a stand-alone basis, and the cost at which they can borrow through the Government of South Australia. Guarantee fees are paid by authorities including SA Water, Renewal SA, and HomeStart.
Revenue from guarantee fees in 2016–17 is expected to be around $6 million lower than the 2016–17 Budget estimate due to a change in the timing of borrowings by the Renewal SA and updated interest forecasts. Guarantee fees are estimated grow strongly in 2017–18 mainly reflecting changes in market interest rates. Moderate growth in guarantee fee revenue is expected between 2017–18 and 2019–20.
Chapter 3: Revenue
2017–18 Budget Statement 47
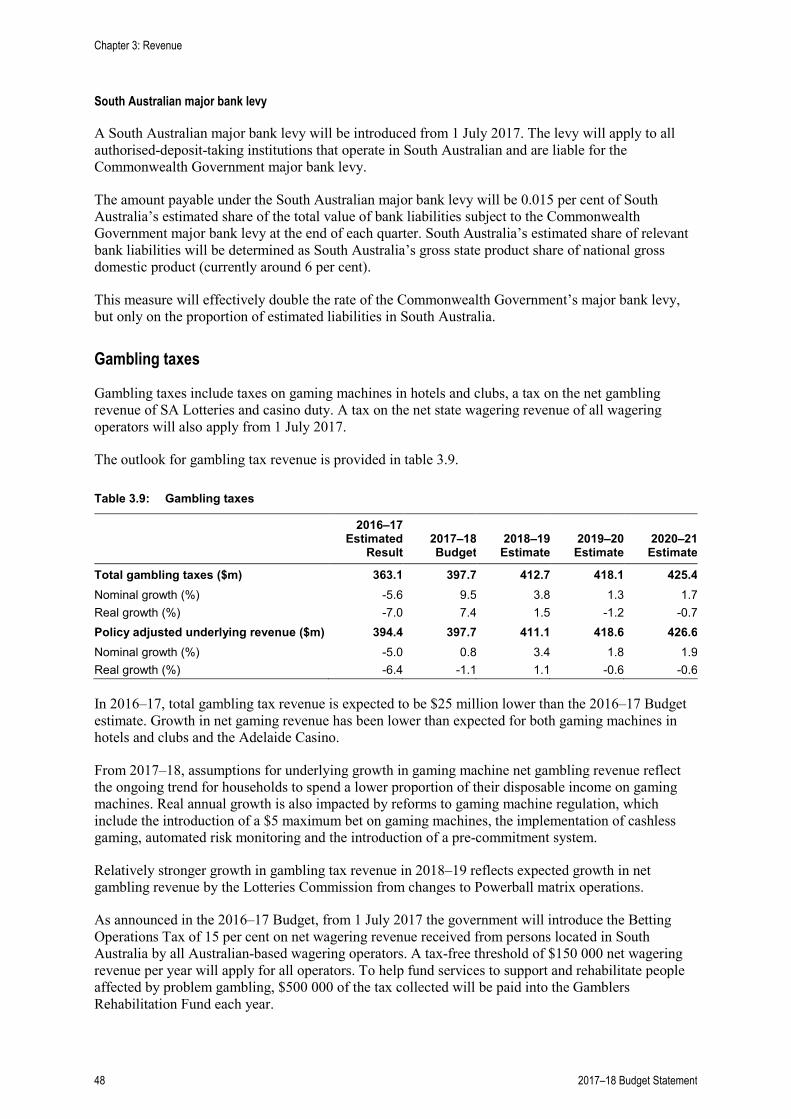
South Australian major bank levy
A South Australian major bank levy will be introduced from 1 July 2017. The levy will apply to all authorised-deposit-taking institutions that operate in South Australian and are liable for the Commonwealth Government major bank levy.
The amount payable under the South Australian major bank levy will be 0.015 per cent of South Australia’s estimated share of the total value of bank liabilities subject to the Commonwealth Government major bank levy at the end of each quarter. South Australia’s estimated share of relevant bank liabilities will be determined as South Australia’s gross state product share of national gross domestic product (currently around 6 per cent).
This measure will effectively double the rate of the Commonwealth Government’s major bank levy, but only on the proportion of estimated liabilities in South Australia.
Gambling taxes
Gambling taxes include taxes on gaming machines in hotels and clubs, a tax on the net gambling revenue of SA Lotteries and casino duty. A tax on the net state wagering revenue of all wagering operators will also apply from 1 July 2017.
The outlook for gambling tax revenue is provided in table 3.9.
Table 3.9: Gambling taxes
2016–17 Estimated
Result 2017–18 Budget
2018–19 Estimate
2019–20 Estimate
2020–21 Estimate
Total gambling taxes ($m) 363.1 397.7 412.7 418.1 425.4 Nominal growth (%) -5.6 9.5 3.8 1.3 1.7 Real growth (%) -7.0 7.4 1.5 -1.2 -0.7 Policy adjusted underlying revenue ($m) 394.4 397.7 411.1 418.6 426.6 Nominal growth (%) -5.0 0.8 3.4 1.8 1.9 Real growth (%) -6.4 -1.1 1.1 -0.6 -0.6
In 2016–17, total gambling tax revenue is expected to be $25 million lower than the 2016–17 Budget estimate. Growth in net gaming revenue has been lower than expected for both gaming machines in hotels and clubs and the Adelaide Casino.
From 2017–18, assumptions for underlying growth in gaming machine net gambling revenue reflect the ongoing trend for households to spend a lower proportion of their disposable income on gaming machines. Real annual growth is also impacted by reforms to gaming machine regulation, which include the introduction of a $5 maximum bet on gaming machines, the implementation of cashless gaming, automated risk monitoring and the introduction of a pre-commitment system.
Relatively stronger growth in gambling tax revenue in 2018–19 reflects expected growth in net gambling revenue by the Lotteries Commission from changes to Powerball matrix operations.
As announced in the 2016–17 Budget, from 1 July 2017 the government will introduce the Betting Operations Tax of 15 per cent on net wagering revenue received from persons located in South Australia by all Australian-based wagering operators. A tax-free threshold of $150 000 net wagering revenue per year will apply for all operators. To help fund services to support and rehabilitate people affected by problem gambling, $500 000 of the tax collected will be paid into the Gamblers Rehabilitation Fund each year.
Chapter 3: Revenue
48 2017–18 Budget Statement
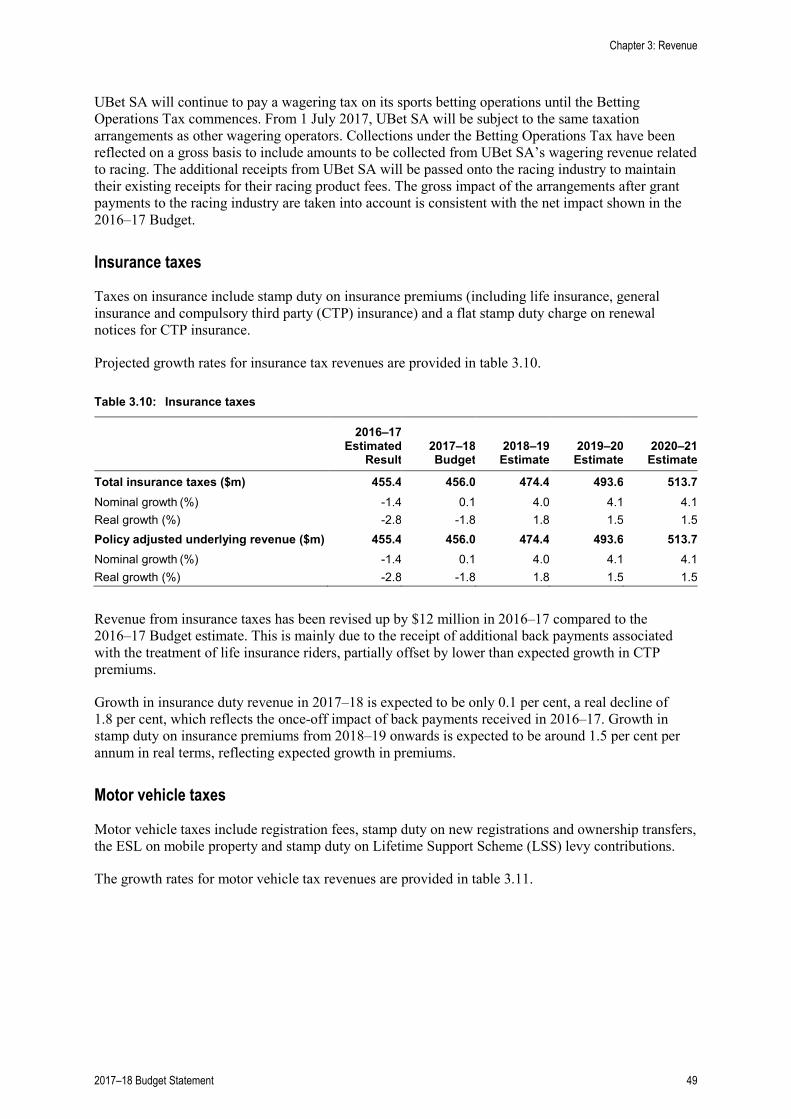
UBet SA will continue to pay a wagering tax on its sports betting operations until the Betting Operations Tax commences. From 1 July 2017, UBet SA will be subject to the same taxation arrangements as other wagering operators. Collections under the Betting Operations Tax have been reflected on a gross basis to include amounts to be collected from UBet SA’s wagering revenue related to racing. The additional receipts from UBet SA will be passed onto the racing industry to maintain their existing receipts for their racing product fees. The gross impact of the arrangements after grant payments to the racing industry are taken into account is consistent with the net impact shown in the 2016–17 Budget.
Insurance taxes
Taxes on insurance include stamp duty on insurance premiums (including life insurance, general insurance and compulsory third party (CTP) insurance) and a flat stamp duty charge on renewal notices for CTP insurance.
Projected growth rates for insurance tax revenues are provided in table 3.10.
Table 3.10: Insurance taxes
2016–17 Estimated
Result
2017–18 Budget
2018–19
Estimate
2019–20
Estimate
2020–21
Estimate
Total insurance taxes ($m) 455.4 456.0 474.4 493.6 513.7 Nominal growth (%) -1.4 0.1 4.0 4.1 4.1 Real growth (%) -2.8 -1.8 1.8 1.5 1.5 Policy adjusted underlying revenue ($m) 455.4 456.0 474.4 493.6 513.7 Nominal growth (%) -1.4 0.1 4.0 4.1 4.1 Real growth (%) -2.8 -1.8 1.8 1.5 1.5
Revenue from insurance taxes has been revised up by $12 million in 2016–17 compared to the 2016–17 Budget estimate. This is mainly due to the receipt of additional back payments associated with the treatment of life insurance riders, partially offset by lower than expected growth in CTP premiums.
Growth in insurance duty revenue in 2017–18 is expected to be only 0.1 per cent, a real decline of 1.8 per cent, which reflects the once-off impact of back payments received in 2016–17. Growth in stamp duty on insurance premiums from 2018–19 onwards is expected to be around 1.5 per cent per annum in real terms, reflecting expected growth in premiums.
Motor vehicle taxes
Motor vehicle taxes include registration fees, stamp duty on new registrations and ownership transfers, the ESL on mobile property and stamp duty on Lifetime Support Scheme (LSS) levy contributions.
The growth rates for motor vehicle tax revenues are provided in table 3.11.
Chapter 3: Revenue
2017–18 Budget Statement 49
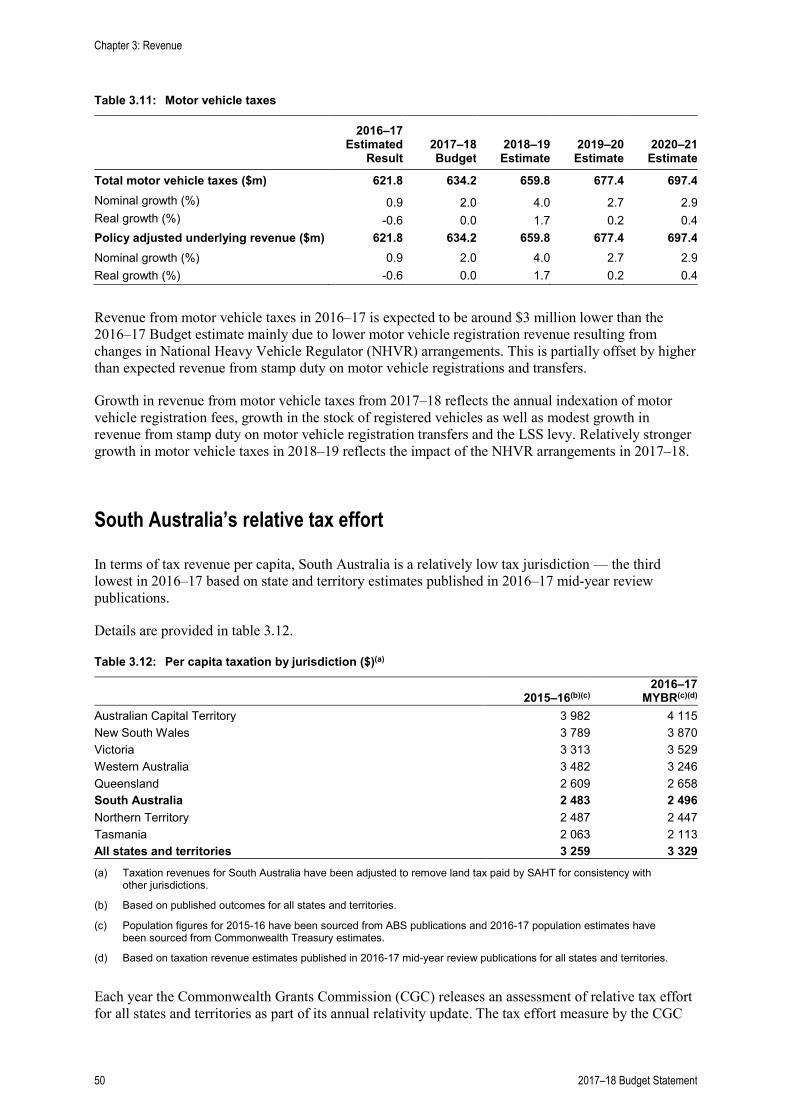
Table 3.11: Motor vehicle taxes
2016–17 Estimated
Result
2017–18 Budget
2018–19
Estimate
2019–20
Estimate
2020–21
Estimate
Total motor vehicle taxes ($m) 621.8 634.2 659.8 677.4 697.4 Nominal growth (%) 0.9 2.0 4.0 2.7 2.9 Real growth (%) -0.6 0.0 1.7 0.2 0.4 Policy adjusted underlying revenue ($m) 621.8 634.2 659.8 677.4 697.4 Nominal growth (%) 0.9 2.0 4.0 2.7 2.9 Real growth (%) -0.6 0.0 1.7 0.2 0.4
Revenue from motor vehicle taxes in 2016–17 is expected to be around $3 million lower than the 2016–17 Budget estimate mainly due to lower motor vehicle registration revenue resulting from changes in National Heavy Vehicle Regulator (NHVR) arrangements. This is partially offset by higher than expected revenue from stamp duty on motor vehicle registrations and transfers.
Growth in revenue from motor vehicle taxes from 2017–18 reflects the annual indexation of motor vehicle registration fees, growth in the stock of registered vehicles as well as modest growth in revenue from stamp duty on motor vehicle registration transfers and the LSS levy. Relatively stronger growth in motor vehicle taxes in 2018–19 reflects the impact of the NHVR arrangements in 2017–18.
South Australia’s relative tax effort
In terms of tax revenue per capita, South Australia is a relatively low tax jurisdiction — the third lowest in 2016–17 based on state and territory estimates published in 2016–17 mid-year review publications.
Details are provided in table 3.12.
Table 3.12: Per capita taxation by jurisdiction ($)(a)
2015–16(b)(c)
2016–17 MYBR(c)(d)
Australian Capital Territory 3 982 4 115 New South Wales 3 789 3 870 Victoria 3 313 3 529 Western Australia 3 482 3 246 Queensland 2 609 2 658 South Australia 2 483 2 496 Northern Territory 2 487 2 447 Tasmania 2 063 2 113 All states and territories 3 259 3 329 (a) Taxation revenues for South Australia have been adjusted to remove land tax paid by SAHT for consistency with
other jurisdictions.
(b) Based on published outcomes for all states and territories.
(c) Population figures for 2015-16 have been sourced from ABS publications and 2016-17 population estimates have been sourced from Commonwealth Treasury estimates.
(d) Based on taxation revenue estimates published in 2016-17 mid-year review publications for all states and territories.
Each year the Commonwealth Grants Commission (CGC) releases an assessment of relative tax effort for all states and territories as part of its annual relativity update. The tax effort measure by the CGC
Chapter 3: Revenue
50 2017–18 Budget Statement
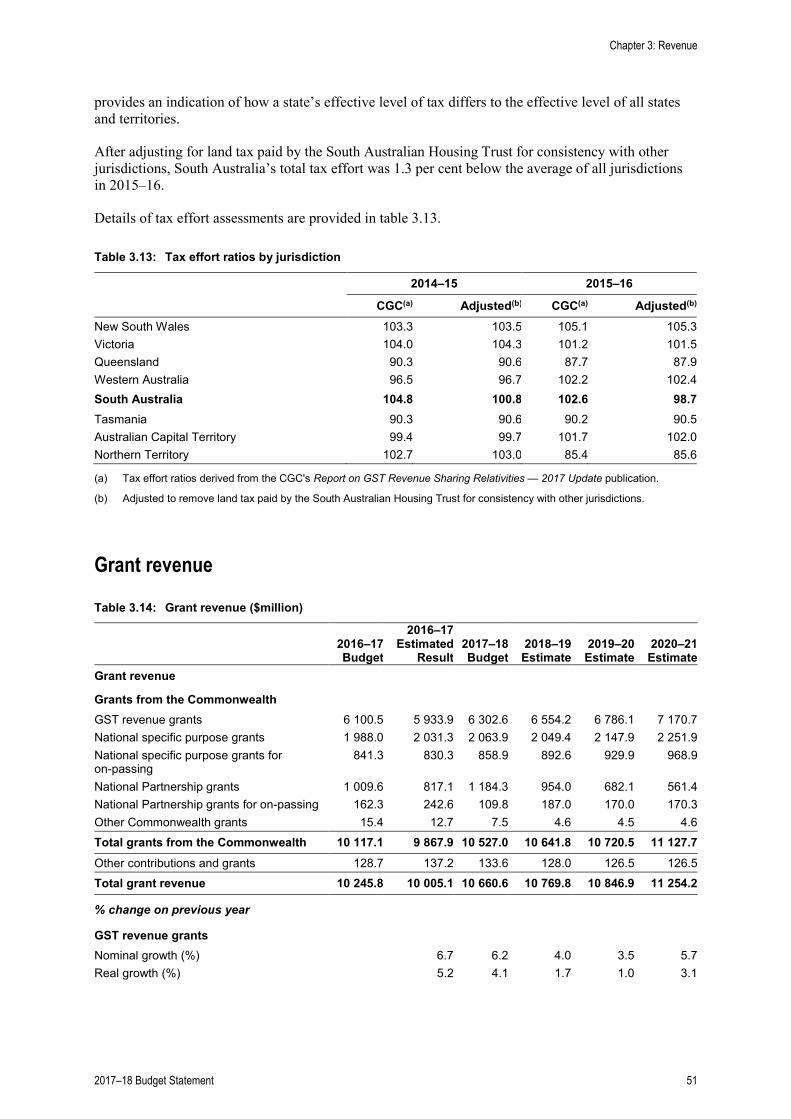
provides an indication of how a state’s effective level of tax differs to the effective level of all states and territories.
After adjusting for land tax paid by the South Australian Housing Trust for consistency with other jurisdictions, South Australia’s total tax effort was 1.3 per cent below the average of all jurisdictions in 2015–16.
Details of tax effort assessments are provided in table 3.13.
Table 3.13: Tax effort ratios by jurisdiction
2014–15 2015–16
CGC(a) Adjusted(b) CGC(a) Adjusted(b) New South Wales 103.3 103.5 105.1 105.3 Victoria 104.0 104.3 101.2 101.5 Queensland 90.3 90.6 87.7 87.9 Western Australia 96.5 96.7 102.2 102.4 South Australia 104.8 100.8 102.6 98.7 Tasmania 90.3 90.6 90.2 90.5 Australian Capital Territory 99.4 99.7 101.7 102.0 Northern Territory 102.7 103.0 85.4 85.6
(a) Tax effort ratios derived from the CGC's Report on GST Revenue Sharing Relativities — 2017 Update publication.
(b) Adjusted to remove land tax paid by the South Australian Housing Trust for consistency with other jurisdictions.
Grant revenue
Table 3.14: Grant revenue ($million)
2016–17 Budget
2016–17 Estimated
Result 2017–18 Budget
2018–19 Estimate
2019–20 Estimate
2020–21 Estimate
Grant revenue Grants from the Commonwealth GST revenue grants 6 100.5 5 933.9 6 302.6 6 554.2 6 786.1 7 170.7
National specific purpose grants 1 988.0 2 031.3 2 063.9 2 049.4 2 147.9 2 251.9 National specific purpose grants for on-passing
841.3 830.3 858.9 892.6 929.9 968.9
National Partnership grants 1 009.6 817.1 1 184.3 954.0 682.1 561.4 National Partnership grants for on-passing 162.3 242.6 109.8 187.0 170.0 170.3 Other Commonwealth grants 15.4 12.7 7.5 4.6 4.5 4.6 Total grants from the Commonwealth 10 117.1 9 867.9 10 527.0 10 641.8 10 720.5 11 127.7 Other contributions and grants 128.7 137.2 133.6 128.0 126.5 126.5 Total grant revenue 10 245.8 10 005.1 10 660.6 10 769.8 10 846.9 11 254.2
% change on previous year
GST revenue grants
Nominal growth (%) 6.7 6.2 4.0 3.5 5.7 Real growth (%) 5.2 4.1 1.7 1.0 3.1
Chapter 3: Revenue
2017–18 Budget Statement 51
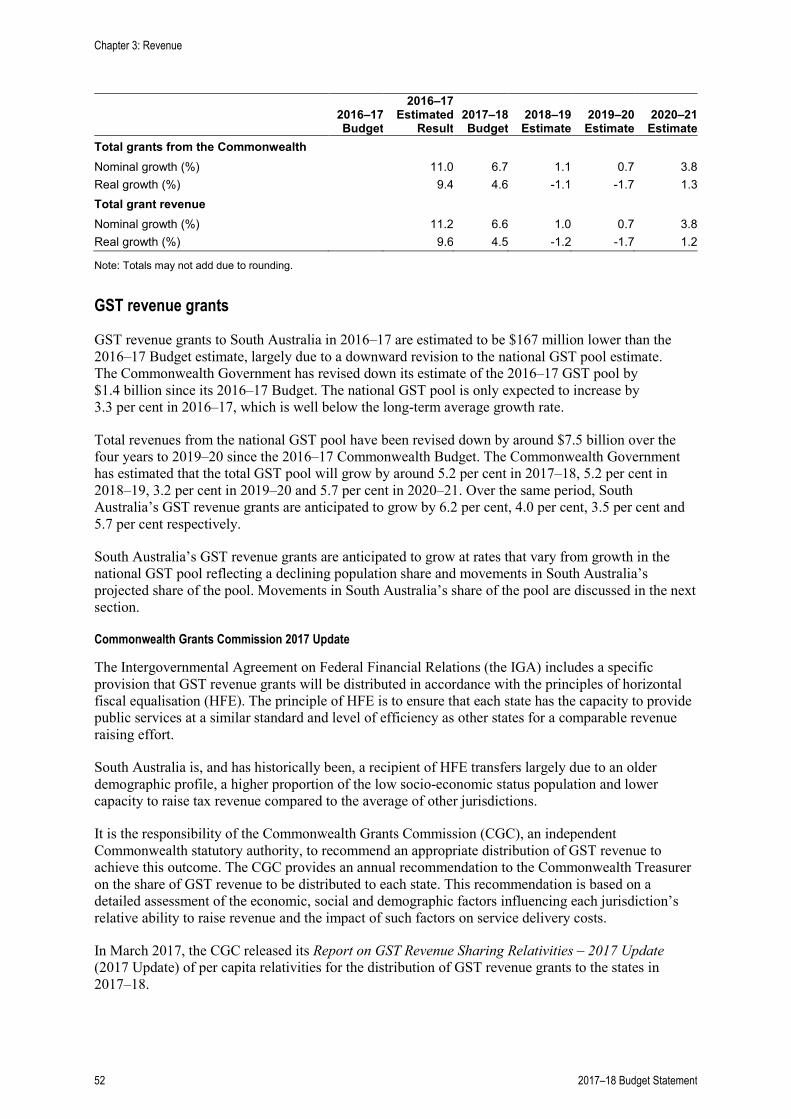
2016–17 Budget
2016–17 Estimated
Result 2017–18 Budget
2018–19 Estimate
2019–20 Estimate
2020–21 Estimate
Total grants from the Commonwealth Nominal growth (%) 11.0 6.7 1.1 0.7 3.8 Real growth (%) 9.4 4.6 -1.1 -1.7 1.3 Total grant revenue Nominal growth (%) 11.2 6.6 1.0 0.7 3.8 Real growth (%) 9.6 4.5 -1.2 -1.7 1.2
Note: Totals may not add due to rounding.
GST revenue grants
GST revenue grants to South Australia in 2016–17 are estimated to be $167 million lower than the 2016–17 Budget estimate, largely due to a downward revision to the national GST pool estimate. The Commonwealth Government has revised down its estimate of the 2016–17 GST pool by $1.4 billion since its 2016–17 Budget. The national GST pool is only expected to increase by 3.3 per cent in 2016–17, which is well below the long-term average growth rate.
Total revenues from the national GST pool have been revised down by around $7.5 billion over the four years to 2019–20 since the 2016–17 Commonwealth Budget. The Commonwealth Government has estimated that the total GST pool will grow by around 5.2 per cent in 2017–18, 5.2 per cent in 2018–19, 3.2 per cent in 2019–20 and 5.7 per cent in 2020–21. Over the same period, South Australia’s GST revenue grants are anticipated to grow by 6.2 per cent, 4.0 per cent, 3.5 per cent and 5.7 per cent respectively.
South Australia’s GST revenue grants are anticipated to grow at rates that vary from growth in the national GST pool reflecting a declining population share and movements in South Australia’s projected share of the pool. Movements in South Australia’s share of the pool are discussed in the next section.
Commonwealth Grants Commission 2017 Update
The Intergovernmental Agreement on Federal Financial Relations (the IGA) includes a specific provision that GST revenue grants will be distributed in accordance with the principles of horizontal fiscal equalisation (HFE). The principle of HFE is to ensure that each state has the capacity to provide public services at a similar standard and level of efficiency as other states for a comparable revenue raising effort.
South Australia is, and has historically been, a recipient of HFE transfers largely due to an older demographic profile, a higher proportion of the low socio-economic status population and lower capacity to raise tax revenue compared to the average of other jurisdictions.
It is the responsibility of the Commonwealth Grants Commission (CGC), an independent Commonwealth statutory authority, to recommend an appropriate distribution of GST revenue to achieve this outcome. The CGC provides an annual recommendation to the Commonwealth Treasurer on the share of GST revenue to be distributed to each state. This recommendation is based on a detailed assessment of the economic, social and demographic factors influencing each jurisdiction’s relative ability to raise revenue and the impact of such factors on service delivery costs.
In March 2017, the CGC released its Report on GST Revenue Sharing Relativities – 2017 Update (2017 Update) of per capita relativities for the distribution of GST revenue grants to the states in 2017–18.
Chapter 3: Revenue
52 2017–18 Budget Statement
South Australia’s relativity increased to 1.43997 in the 2017 Update compared with 1.41695 in the 2016 Update. A relativity for a given year reflects the impact of three year average data. In 2017–18, South Australia will receive 10.1 per cent of the GST pool compared to 10.0 per cent in 2016–17.
The main factors that produced the increase in South Australia’s relativity for 2017–18 were:
• The strong property sales growth in the Eastern states, which reduced South Australia’s relative capacity to raise revenue from conveyance duty compared to other states
• An increased share of national population growth in 2015–16 (the new year in the averaging period) when compared with 2012–13 (the year that has moved out of the averaging period)
• A decrease in national natural disaster relief expenditure over the averaging period.
These increases were partially offset by:
• Reduced transfers to the small mining states, including South Australia, as a result of the decline in the value of mining production in large mining states
• Above average growth in South Australian taxable private sector payrolls over the three year averaging period.
Based on the new relativity and current GST pool estimates for 2017–18, South Australia will receive nearly $2 billion more than it would if funding was distributed on a simple population share basis, without regard to the fiscal needs and capacities of each state.
Beyond 2017–18 South Australia’s GST relativity is expected to be impacted by:
• Changes in South Australia’s projected share of Commonwealth Government payments, particularly increases in infrastructure payments in 2017–18 for roads and rail related projects including the Northern Connector, North South Corridor Darlington upgrade and the Goodwood/Torrens rail junction.
• Continued strength in eastern states’ property markets in 2016–17
• A strengthening in mineral commodity prices and mining revenues in 2016–17 which will increase transfer to states with small mining sectors
• Volatility in the underlying Australian Bureau of Statistics (ABS) data supporting the wage cost assessment.
Commonwealth Government payments for specific purposes
There are two broad types of payments for specific purposes.
• National specific purpose payments (SPPs) that provide ongoing funding to the states for service delivery in the areas of housing and homelessness, skills and workforce development, disability services, health and education.
• National Partnerships (NPs) that fall into two broad categories — to support the delivery of specific projects (including infrastructure) and to facilitate the implementation or reward the delivery of national reforms. A further category of NPs has been created called project agreements, which is a vehicle for funding low value or low risk projects.
Table 3.15 summarises expected national SPP and NP grants to South Australia by category.
Chapter 3: Revenue
2017–18 Budget Statement 53
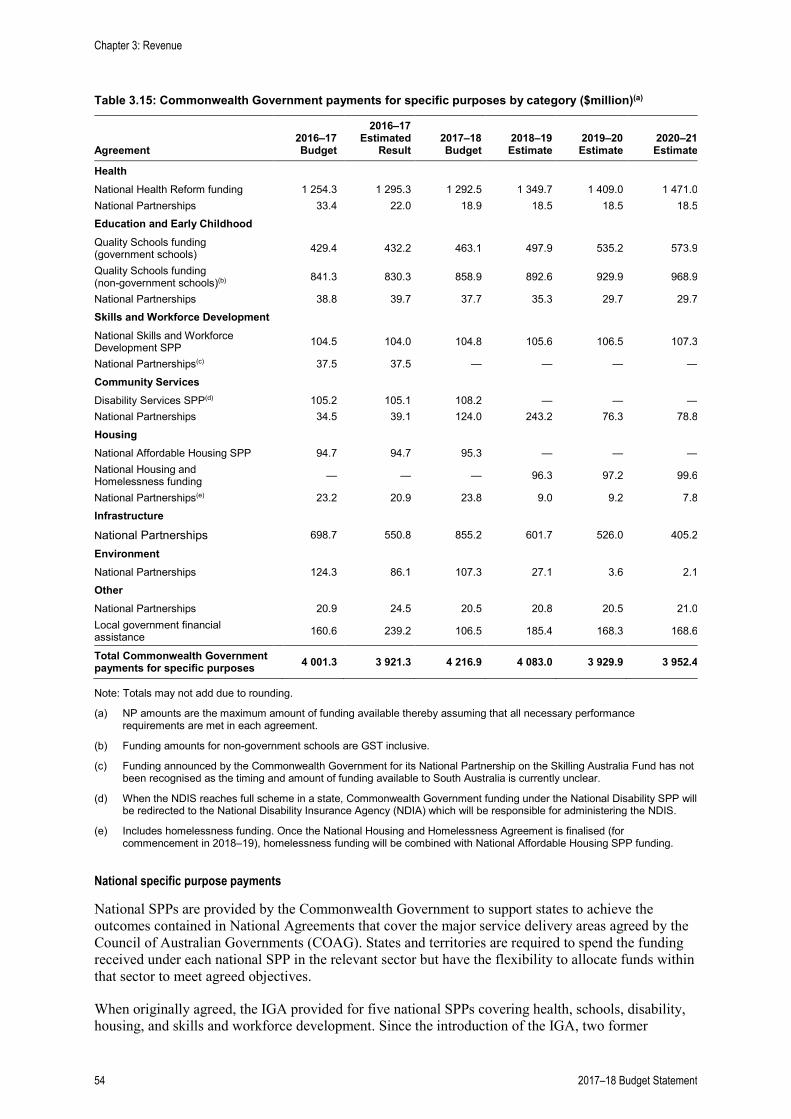
Table 3.15: Commonwealth Government payments for specific purposes by category ($million)(a)
Agreement 2016–17 Budget
2016–17 Estimated
Result 2017–18 Budget
2018–19 Estimate
2019–20 Estimate
2020–21 Estimate
Health National Health Reform funding 1 254.3 1 295.3 1 292.5 1 349.7 1 409.0 1 471.0 National Partnerships 33.4 22.0 18.9 18.5 18.5 18.5 Education and Early Childhood
Quality Schools funding (government schools) 429.4 432.2 463.1 497.9 535.2 573.9
Quality Schools funding (non-government schools)(b) 841.3 830.3 858.9 892.6 929.9 968.9
National Partnerships 38.8 39.7 37.7 35.3 29.7 29.7 Skills and Workforce Development
National Skills and Workforce Development SPP 104.5 104.0 104.8 105.6 106.5 107.3
National Partnerships(c) 37.5 37.5 — — — — Community Services
Disability Services SPP(d) 105.2 105.1 108.2 — — — National Partnerships 34.5 39.1 124.0 243.2 76.3 78.8 Housing
National Affordable Housing SPP 94.7 94.7 95.3 — — — National Housing and Homelessness funding — — — 96.3 97.2 99.6
National Partnerships(e) 23.2 20.9 23.8 9.0 9.2 7.8 Infrastructure
National Partnerships 698.7 550.8 855.2 601.7 526.0 405.2
Environment National Partnerships 124.3 86.1 107.3 27.1 3.6 2.1 Other National Partnerships 20.9 24.5 20.5 20.8 20.5 21.0 Local government financial assistance 160.6 239.2 106.5 185.4 168.3 168.6
Total Commonwealth Government payments for specific purposes 4 001.3 3 921.3 4 216.9 4 083.0 3 929.9 3 952.4
Note: Totals may not add due to rounding.
(a) NP amounts are the maximum amount of funding available thereby assuming that all necessary performance requirements are met in each agreement.
(b) Funding amounts for non-government schools are GST inclusive.
(c) Funding announced by the Commonwealth Government for its National Partnership on the Skilling Australia Fund has not been recognised as the timing and amount of funding available to South Australia is currently unclear.
(d) When the NDIS reaches full scheme in a state, Commonwealth Government funding under the National Disability SPP will be redirected to the National Disability Insurance Agency (NDIA) which will be responsible for administering the NDIS.
(e) Includes homelessness funding. Once the National Housing and Homelessness Agreement is finalised (for commencement in 2018–19), homelessness funding will be combined with National Affordable Housing SPP funding.
National specific purpose payments
National SPPs are provided by the Commonwealth Government to support states to achieve the outcomes contained in National Agreements that cover the major service delivery areas agreed by the Council of Australian Governments (COAG). States and territories are required to spend the funding received under each national SPP in the relevant sector but have the flexibility to allocate funds within that sector to meet agreed objectives.
When originally agreed, the IGA provided for five national SPPs covering health, schools, disability, housing, and skills and workforce development. Since the introduction of the IGA, two former
Chapter 3: Revenue
54 2017–18 Budget Statement
national SPPs have been superseded (health and schools), while national SPP funding under the National Affordable Housing Agreement will be replaced by a new housing and homelessness agreement from 2018–19. The Disability SPP will also discontinue in 2018–19 with funding re-directed into the National Disability Insurance Scheme (NDIS).
The National Healthcare SPP was replaced by National Health Reform (NHR) funding and from 1 July 2014 Commonwealth Government growth funding has been based on public hospital activity and an efficient price determined by an independent administrator.
In its 2014–15 Budget, the Commonwealth Government announced that the activity-based funding arrangements established in 2014 would not be ongoing and would cease on 30 June 2017, to be replaced by indexation that only accounted for inflation (CPI) and population growth. This decision was not sustainable as growth in health costs is significantly higher than the CPI and demand grows faster than population growth due to population ageing impacts. Following the April 2016 COAG meeting, the Commonwealth Government announced that activity based funding would continue from 1 July 2017 to 30 June 2020. However, funding growth will remain effectively lower than was agreed before the 2014–15 Commonwealth Budget.
From 1 January 2014, the National Schools SPP was replaced by funding under the Students First program and these arrangements will continue up to and including the 2017 school year. Under these arrangements, the Commonwealth Government provides recurrent funding, special circumstances funding for non-government schools, funding for non-representative bodies and other prescribed purpose funding.
From the 2018 school year, the Commonwealth Government is transitioning all schools to a uniform needs-based funding model under the Quality Schools program. Under this program, the Commonwealth Government will retain the Schooling Resource Standard (SRS) recommended in the 2011 Review of Funding for Schooling (the Gonski Review), including loadings for disadvantaged students. The Commonwealth Government’s share of SRS funding will transition to 20 per cent for government schools and 80 per cent for non-government schools by 2027.
The Commonwealth Government will index the base SRS by 3.56 per cent per annum between 2018 and 2020. From 2021 onwards, the base SRS will be indexed by either 3 per cent per annum or a composite of the Wage Price Index (75 per cent weighting) and CPI (25 per cent), whichever is higher.
Although these arrangements do provide growth in funding across the forward estimates, the cuts made by the Commonwealth Government in its 2014–15 Budget will still be significant when compared to funding estimates prior to that budget which were based on delivering full Gonski school funding to the states.
From 1 July 2018, the Commonwealth have proposed that a new National Housing and Homelessness Agreement (NHHA) will come into operation which will combine the former National Affordable Housing SPP with the Homelessness NP funding. States and territories will continue to be required to match the Commonwealth Government’s homelessness funding. The Commonwealth Government has indicated that it wants to renegotiate the terms and scope of the NHHA including a focus on housing supply and land use planning which is not part of the current National Affordable Housing Agreement. It is currently not clear what obligations will be placed on states and territories to secure respective funding allocations.
The National Disability Insurance Scheme (NDIS) will change the nature of disability care and support in Australia. When the NDIS reaches full scheme in a state, Commonwealth Government funding under the National Disability SPP will be redirected to the National Disability Insurance Agency (NDIA) which will be responsible for administering the NDIS. South Australia is scheduled to reach full scheme from 2018–19 and, accordingly, National Disability SPP funding will be redirected to the NDIA from that year onwards.
Chapter 3: Revenue
2017–18 Budget Statement 55
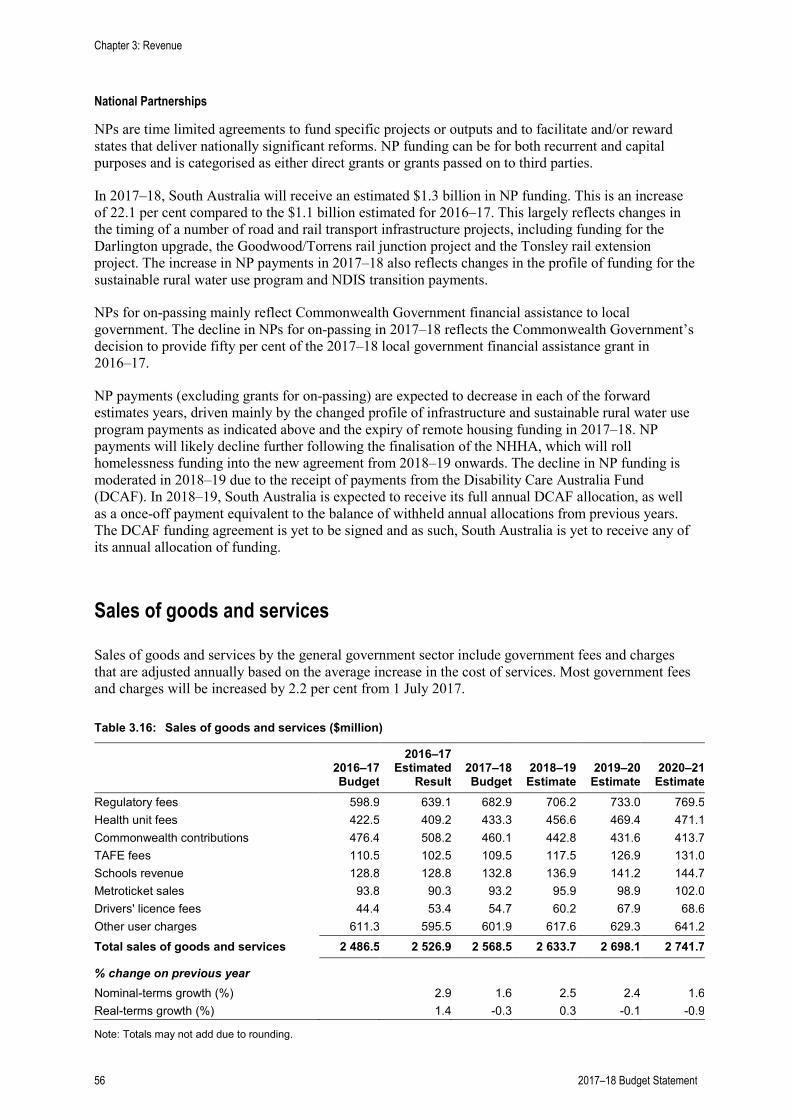
National Partnerships
NPs are time limited agreements to fund specific projects or outputs and to facilitate and/or reward states that deliver nationally significant reforms. NP funding can be for both recurrent and capital purposes and is categorised as either direct grants or grants passed on to third parties.
In 2017–18, South Australia will receive an estimated $1.3 billion in NP funding. This is an increase of 22.1 per cent compared to the $1.1 billion estimated for 2016–17. This largely reflects changes in the timing of a number of road and rail transport infrastructure projects, including funding for the Darlington upgrade, the Goodwood/Torrens rail junction project and the Tonsley rail extension project. The increase in NP payments in 2017–18 also reflects changes in the profile of funding for the sustainable rural water use program and NDIS transition payments.
NPs for on-passing mainly reflect Commonwealth Government financial assistance to local government. The decline in NPs for on-passing in 2017–18 reflects the Commonwealth Government’s decision to provide fifty per cent of the 2017–18 local government financial assistance grant in 2016–17.
NP payments (excluding grants for on-passing) are expected to decrease in each of the forward estimates years, driven mainly by the changed profile of infrastructure and sustainable rural water use program payments as indicated above and the expiry of remote housing funding in 2017–18. NP payments will likely decline further following the finalisation of the NHHA, which will roll homelessness funding into the new agreement from 2018–19 onwards. The decline in NP funding is moderated in 2018–19 due to the receipt of payments from the Disability Care Australia Fund (DCAF). In 2018–19, South Australia is expected to receive its full annual DCAF allocation, as well as a once-off payment equivalent to the balance of withheld annual allocations from previous years. The DCAF funding agreement is yet to be signed and as such, South Australia is yet to receive any of its annual allocation of funding.
Sales of goods and services
Sales of goods and services by the general government sector include government fees and charges that are adjusted annually based on the average increase in the cost of services. Most government fees and charges will be increased by 2.2 per cent from 1 July 2017.
Table 3.16: Sales of goods and services ($million)
2016–17 Budget
2016–17 Estimated
Result 2017–18 Budget
2018–19 Estimate
2019–20 Estimate
2020–21 Estimate
Regulatory fees 598.9 639.1 682.9 706.2 733.0 769.5 Health unit fees 422.5 409.2 433.3 456.6 469.4 471.1 Commonwealth contributions 476.4 508.2 460.1 442.8 431.6 413.7 TAFE fees 110.5 102.5 109.5 117.5 126.9 131.0 Schools revenue 128.8 128.8 132.8 136.9 141.2 144.7 Metroticket sales 93.8 90.3 93.2 95.9 98.9 102.0 Drivers' licence fees 44.4 53.4 54.7 60.2 67.9 68.6 Other user charges 611.3 595.5 601.9 617.6 629.3 641.2 Total sales of goods and services 2 486.5 2 526.9 2 568.5 2 633.7 2 698.1 2 741.7
% change on previous year Nominal-terms growth (%)
2.9 1.6 2.5 2.4 1.6 Real-terms growth (%) 1.4 -0.3 0.3 -0.1 -0.9
Note: Totals may not add due to rounding.
Chapter 3: Revenue
56 2017–18 Budget Statement
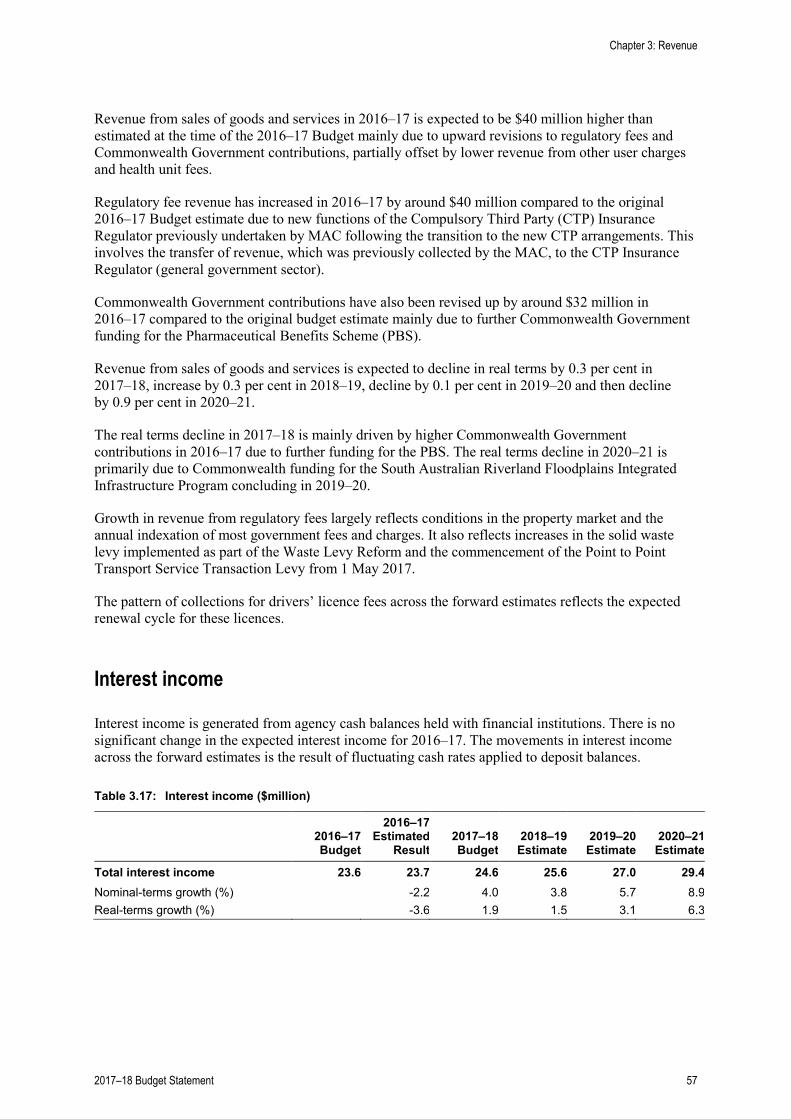
Revenue from sales of goods and services in 2016–17 is expected to be $40 million higher than estimated at the time of the 2016–17 Budget mainly due to upward revisions to regulatory fees and Commonwealth Government contributions, partially offset by lower revenue from other user charges and health unit fees.
Regulatory fee revenue has increased in 2016–17 by around $40 million compared to the original 2016–17 Budget estimate due to new functions of the Compulsory Third Party (CTP) Insurance Regulator previously undertaken by MAC following the transition to the new CTP arrangements. This involves the transfer of revenue, which was previously collected by the MAC, to the CTP Insurance Regulator (general government sector).
Commonwealth Government contributions have also been revised up by around $32 million in 2016–17 compared to the original budget estimate mainly due to further Commonwealth Government funding for the Pharmaceutical Benefits Scheme (PBS).
Revenue from sales of goods and services is expected to decline in real terms by 0.3 per cent in 2017–18, increase by 0.3 per cent in 2018–19, decline by 0.1 per cent in 2019–20 and then decline by 0.9 per cent in 2020–21.
The real terms decline in 2017–18 is mainly driven by higher Commonwealth Government contributions in 2016–17 due to further funding for the PBS. The real terms decline in 2020–21 is primarily due to Commonwealth funding for the South Australian Riverland Floodplains Integrated Infrastructure Program concluding in 2019–20.
Growth in revenue from regulatory fees largely reflects conditions in the property market and the annual indexation of most government fees and charges. It also reflects increases in the solid waste levy implemented as part of the Waste Levy Reform and the commencement of the Point to Point Transport Service Transaction Levy from 1 May 2017.
The pattern of collections for drivers’ licence fees across the forward estimates reflects the expected renewal cycle for these licences.
Interest income
Interest income is generated from agency cash balances held with financial institutions. There is no significant change in the expected interest income for 2016–17. The movements in interest income across the forward estimates is the result of fluctuating cash rates applied to deposit balances.
Table 3.17: Interest income ($million)
2016–17 Budget
2016–17 Estimated
Result 2017–18
Budget 2018–19 Estimate
2019–20 Estimate
2020–21 Estimate
Total interest income 23.6 23.7 24.6 25.6 27.0 29.4 Nominal-terms growth (%)
-2.2 4.0 3.8 5.7 8.9
Real-terms growth (%) -3.6 1.9 1.5 3.1 6.3
Chapter 3: Revenue
2017–18 Budget Statement 57
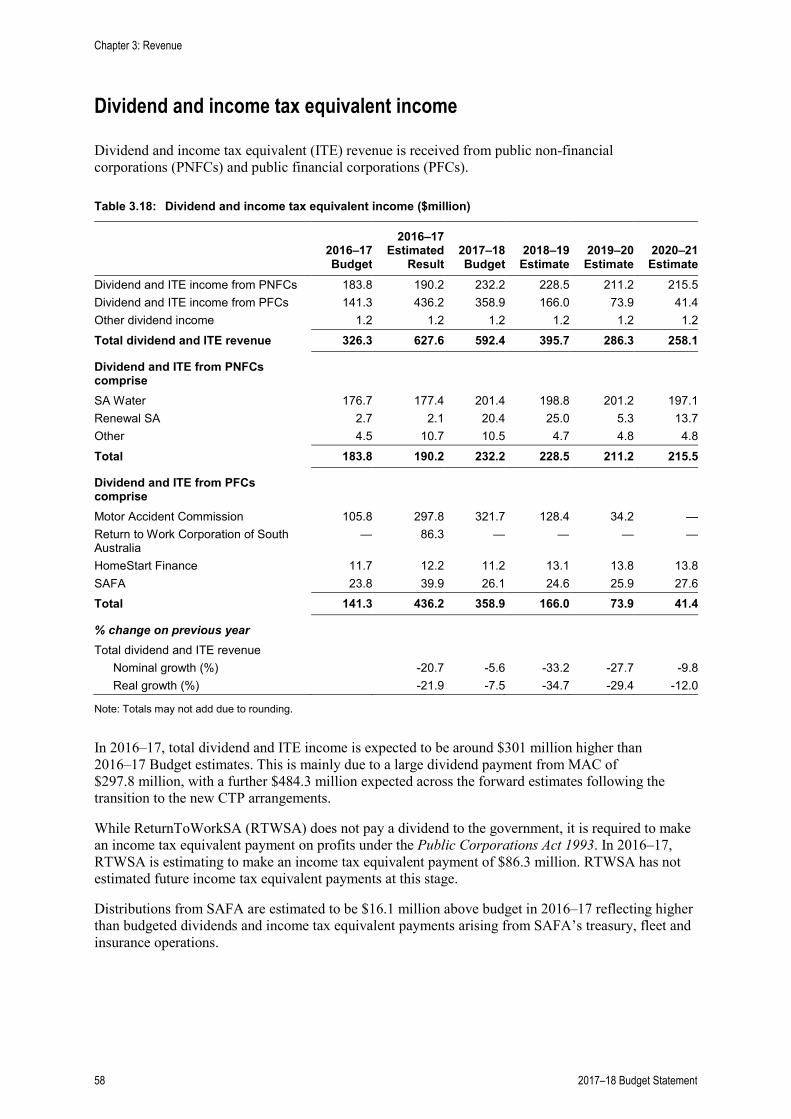
Dividend and income tax equivalent income
Dividend and income tax equivalent (ITE) revenue is received from public non-financial corporations (PNFCs) and public financial corporations (PFCs).
Table 3.18: Dividend and income tax equivalent income ($million)
2016–17 Budget
2016–17 Estimated
Result
2017–18 Budget
2018–19
Estimate
2019–20
Estimate 2020–21
Estimate Dividend and ITE income from PNFCs 183.8 190.2 232.2 228.5 211.2 215.5 Dividend and ITE income from PFCs 141.3 436.2 358.9 166.0 73.9 41.4 Other dividend income 1.2 1.2 1.2 1.2 1.2 1.2 Total dividend and ITE revenue 326.3 627.6 592.4 395.7 286.3 258.1
Dividend and ITE from PNFCs comprise
SA Water 176.7 177.4 201.4 198.8 201.2 197.1 Renewal SA 2.7 2.1 20.4 25.0 5.3 13.7 Other 4.5 10.7 10.5 4.7 4.8 4.8 Total 183.8 190.2 232.2 228.5 211.2 215.5
Dividend and ITE from PFCs comprise
Motor Accident Commission 105.8 297.8 321.7 128.4 34.2 — Return to Work Corporation of South Australia
— 86.3 — — — —
HomeStart Finance 11.7 12.2 11.2 13.1 13.8 13.8 SAFA 23.8 39.9 26.1 24.6 25.9 27.6 Total 141.3 436.2 358.9 166.0 73.9 41.4
% change on previous year Total dividend and ITE revenue Nominal growth (%)
-20.7 -5.6 -33.2 -27.7 -9.8 Real growth (%) -21.9 -7.5 -34.7 -29.4 -12.0
Note: Totals may not add due to rounding.
In 2016–17, total dividend and ITE income is expected to be around $301 million higher than 2016–17 Budget estimates. This is mainly due to a large dividend payment from MAC of $297.8 million, with a further $484.3 million expected across the forward estimates following the transition to the new CTP arrangements.
While ReturnToWorkSA (RTWSA) does not pay a dividend to the government, it is required to make an income tax equivalent payment on profits under the Public Corporations Act 1993. In 2016–17, RTWSA is estimating to make an income tax equivalent payment of $86.3 million. RTWSA has not estimated future income tax equivalent payments at this stage.
Distributions from SAFA are estimated to be $16.1 million above budget in 2016–17 reflecting higher than budgeted dividends and income tax equivalent payments arising from SAFA’s treasury, fleet and insurance operations.
Chapter 3: Revenue
58 2017–18 Budget Statement
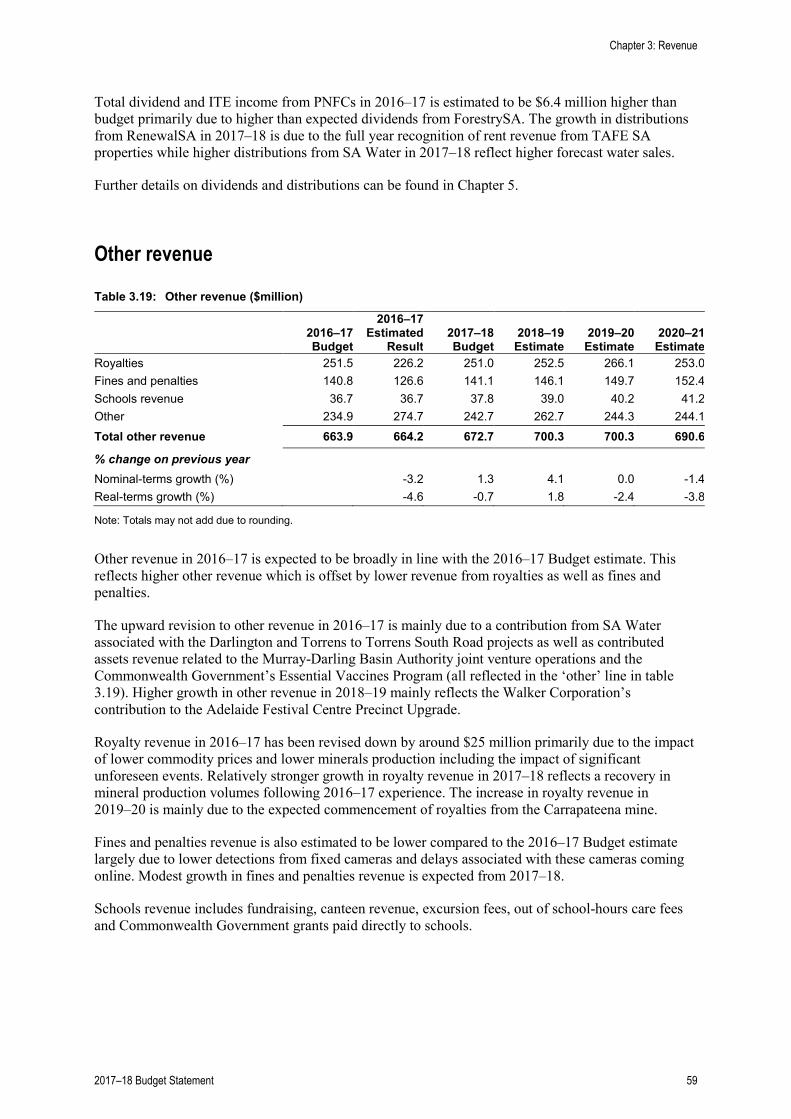
Total dividend and ITE income from PNFCs in 2016–17 is estimated to be $6.4 million higher than budget primarily due to higher than expected dividends from ForestrySA. The growth in distributions from RenewalSA in 2017–18 is due to the full year recognition of rent revenue from TAFE SA properties while higher distributions from SA Water in 2017–18 reflect higher forecast water sales.
Further details on dividends and distributions can be found in Chapter 5.
Other revenue
Table 3.19: Other revenue ($million)
2016–17 Budget
2016–17 Estimated
Result 2017–18 Budget
2018–19 Estimate
2019–20 Estimate
2020–21 Estimate
Royalties 251.5 226.2 251.0 252.5 266.1 253.0 Fines and penalties 140.8 126.6 141.1 146.1 149.7 152.4 Schools revenue 36.7 36.7 37.8 39.0 40.2 41.2 Other 234.9 274.7 242.7 262.7 244.3 244.1 Total other revenue 663.9 664.2 672.7 700.3 700.3 690.6
% change on previous year Nominal-terms growth (%)
-3.2 1.3 4.1 0.0 -1.4 Real-terms growth (%) -4.6 -0.7 1.8 -2.4 -3.8
Note: Totals may not add due to rounding.
Other revenue in 2016–17 is expected to be broadly in line with the 2016–17 Budget estimate. This reflects higher other revenue which is offset by lower revenue from royalties as well as fines and penalties.
The upward revision to other revenue in 2016–17 is mainly due to a contribution from SA Water associated with the Darlington and Torrens to Torrens South Road projects as well as contributed assets revenue related to the Murray-Darling Basin Authority joint venture operations and the Commonwealth Government’s Essential Vaccines Program (all reflected in the ‘other’ line in table 3.19). Higher growth in other revenue in 2018–19 mainly reflects the Walker Corporation’s contribution to the Adelaide Festival Centre Precinct Upgrade.
Royalty revenue in 2016–17 has been revised down by around $25 million primarily due to the impact of lower commodity prices and lower minerals production including the impact of significant unforeseen events. Relatively stronger growth in royalty revenue in 2017–18 reflects a recovery in mineral production volumes following 2016–17 experience. The increase in royalty revenue in 2019–20 is mainly due to the expected commencement of royalties from the Carrapateena mine.
Fines and penalties revenue is also estimated to be lower compared to the 2016–17 Budget estimate largely due to lower detections from fixed cameras and delays associated with these cameras coming online. Modest growth in fines and penalties revenue is expected from 2017–18.
Schools revenue includes fundraising, canteen revenue, excursion fees, out of school-hours care fees and Commonwealth Government grants paid directly to schools.
Chapter 3: Revenue
2017–18 Budget Statement 59

Annual fee and rate setting
Fees and charges The annual indexation factor for fees and charges has been set at 2.2 per cent for 2017–18 reflecting the average increase in the cost of providing the relevant services. Fees and charges are typically adjusted by the indexation factor and then rounded to an administratively convenient amount. This results in the increase of some fees and charges being smaller or greater than the indexation factor.
Not all fees and charges are increased through the annual adjustment process. Adjustments to certain fees and charges are determined as a consequence of specific policy decisions.
Water prices for 2017–18 have been prepared on a consistent basis with ESCOSA’s Final Revenue Determination of SA Water’s water and sewerage retail services for four years from 1 July 2016 to 30 June 2020. The government has proposed that for SA Water customers, residential water supply and usage charges in 2017–18 will increase by 2.1 per cent. Metropolitan sewerage charges will increase on average by 2.1 per cent. For the average residential metropolitan residential customer, this will mean a combined water and sewerage bill increase of around $31 in 2017–18.
The Class 1 CTP premium (metropolitan private passenger vehicle) and Class 41 CTP premium (input tax credit entitled metropolitan passenger vehicle) will increase by 3.0 per cent in 2017–18. The Lifetime Support Scheme (LSS) levy will remain unchanged in 2017–18. On average, the combined CTP premium and LSS levy will increase by 2.4 per cent in 2017–18.
Table 3.20 sets out the increases in fees and charges in 2017–18 for major government services. These increases take effect from 1 July 2017.
Table 3.20: 2017–18 changes to selected agency fees and charges
2016–17
$ 2017–18
$ Increase
% Public transport
Single trip tickets — all times and zones 5.30 5.40 1.9 MetroCard single fare ― all times and zones 3.54 3.62 2.3 Regular 28 Day pass 121.80 124.50 2.2 Motor vehicle charges
Registration fee — motor vehicles: Four cylinders or less 120.00 123.00 2.5
Five or six cylinders 247.00 252.00 2.0 Seven or more cylinders 357.00 365.00 2.2
Registration fee — light commercial vehicles: Mass between 1001 kg and 1500 kg 265.00 271.00 2.3
Mass greater than 1500 kg 454.00 464.00 2.2 Drivers’ licence renewals
Five years 210.00 215.00 2.4 Ten years 420.00 430.00 2.4 Speeding fines
Exceeding the speed limit by: Less than 10 km/h 166.00 170.00 2.4
By 10 km/h but less than 20 km/h 363.00 371.00 2.2 By 20 km/h but less than 30 km/h 738.00 754.00 2.2 By 30 km/h but less than 45 km/h 881.00 900.00 2.2 By 45 km/h and above 992.00 1014.00 2.2
Chapter 3: Revenue
60 2017–18 Budget Statement
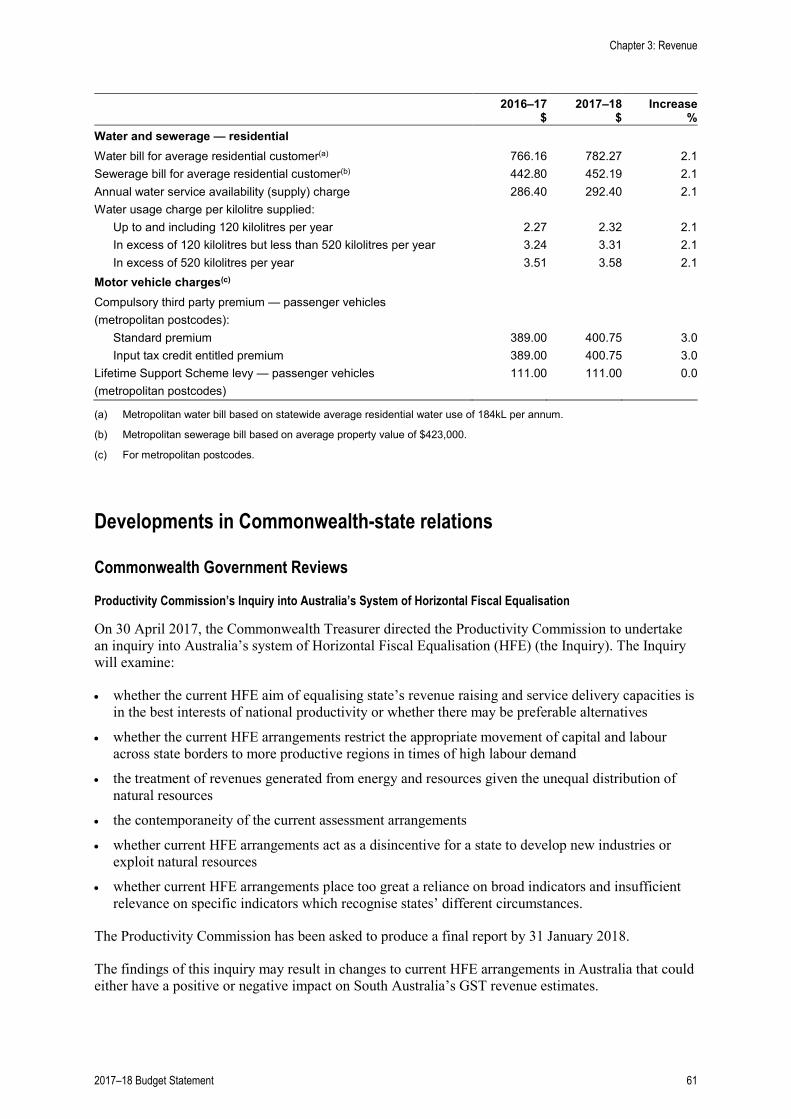
2016–17
$ 2017–18
$ Increase
% Water and sewerage — residential
Water bill for average residential customer(a) 766.16 782.27 2.1 Sewerage bill for average residential customer(b) 442.80 452.19 2.1 Annual water service availability (supply) charge 286.40 292.40 2.1 Water usage charge per kilolitre supplied:
Up to and including 120 kilolitres per year 2.27 2.32 2.1 In excess of 120 kilolitres but less than 520 kilolitres per year 3.24 3.31 2.1 In excess of 520 kilolitres per year 3.51 3.58 2.1
Motor vehicle charges(c) Compulsory third party premium — passenger vehicles (metropolitan postcodes): Standard premium 389.00 400.75 3.0
Input tax credit entitled premium 389.00 400.75 3.0 Lifetime Support Scheme levy — passenger vehicles 111.00 111.00 0.0 (metropolitan postcodes)
(a) Metropolitan water bill based on statewide average residential water use of 184kL per annum.
(b) Metropolitan sewerage bill based on average property value of $423,000.
(c) For metropolitan postcodes.
Developments in Commonwealth-state relations
Commonwealth Government Reviews
Productivity Commission’s Inquiry into Australia’s System of Horizontal Fiscal Equalisation
On 30 April 2017, the Commonwealth Treasurer directed the Productivity Commission to undertake an inquiry into Australia’s system of Horizontal Fiscal Equalisation (HFE) (the Inquiry). The Inquiry will examine:
• whether the current HFE aim of equalising state’s revenue raising and service delivery capacities is in the best interests of national productivity or whether there may be preferable alternatives
• whether the current HFE arrangements restrict the appropriate movement of capital and labour across state borders to more productive regions in times of high labour demand
• the treatment of revenues generated from energy and resources given the unequal distribution of natural resources
• the contemporaneity of the current assessment arrangements
• whether current HFE arrangements act as a disincentive for a state to develop new industries or exploit natural resources
• whether current HFE arrangements place too great a reliance on broad indicators and insufficient relevance on specific indicators which recognise states’ different circumstances.
The Productivity Commission has been asked to produce a final report by 31 January 2018.
The findings of this inquiry may result in changes to current HFE arrangements in Australia that could either have a positive or negative impact on South Australia’s GST revenue estimates.
Chapter 3: Revenue
2017–18 Budget Statement 61
South Australia strongly supports the continuation of the current HFE arrangements as they are a fundamental strength of the Australian federation and have served it well over many years. Proposals to reduce the level of fiscal equalisation in Australia would fundamentally reduce South Australia’s capacity to provide its citizens with the same standard of public services and infrastructure as other Australians. HFE is not detrimental to national productivity, does not restrict the appropriate movement of population and capital and does not act as a disincentive to economic activity, including in the natural resources sector.
South Australia will actively participate in the Inquiry and will put forward arguments to defend HFE and ensure that an equitable, efficient and responsive method of fiscal equalisation is maintained in Australia.
Commonwealth Grants Commission — 2020 Methodology Review
Approximately every five years, the CGC undertakes a review of the definition of HFE and the methods it uses to determine revenue sharing relativities based on HFE principles.
In December 2016, the Commonwealth Treasurer issued terms of reference for the CGC’s 2020 Methodology Review (the Review). The Review will result in a revised assessment methodology. GST distribution relativities based on this new methodology will apply for approximately the next five years with application from the 2020–21 financial year.
For the 2020 Review, the terms of reference are broad in nature and will consider all assessment categories. There will be considerable focus on the supporting principles that underpin current HFE assessments, the contemporaneity of the current arrangements, mining revenues, Indigenous data, provision of public transport services, health, and interstate wages.
As part of the Review process, the CGC will prepare a number of position papers on assessment categories for comment by the states. The Department of Treasury and Finance will prepare submissions and responses to the CGC’s proposed changes to assessments. The CGC has been requested to produce a draft report by the middle of 2019 outlining changes and their proposed assessment framework. States and territories will be provide submissions on the draft report prior to completion of the final report in February 2020.
The review will cover a number of issues that the recently announced Productivity Commission (PC) Inquiry into Australia’s System of Horizontal Fiscal Equalisation (discussed above) will consider. It is possible that the findings of the PC inquiry could influence the Review.
Chapter 3: Revenue
62 2017–18 Budget Statement
Chapter 4: Managing the state’s assets and liabilities
Overview
General government sector net debt is expected to rise from $6.3 billion as at 30 June 2017 to $6.7 billion in 2020–21. Over the forward estimates the ratio of net debt to revenue is expected to peak at 34.9 per cent in 2018–19. The fiscal target of a maximum net debt to revenue ratio of 35 per cent has been met across all years, and by 30 June 2021 the ratio is expected to fall to 33.1 per cent.
General government sector net operating surpluses are projected to total $1.1 billion across 2016–17 and the four-year forward estimates.
General government sector capital investment is estimated to be a record $2.2 billion in 2017–18, contributing to a total investment of $7.1 billion across the forward estimates.
As a result, the value of land and other fixed assets in the general government sector, including the state’s transport, education and health infrastructure, increases from $43.4 billion in 2017 to $45.0 billion in 2021. The net worth of the general government sector, which measures the extent to which the value of its assets exceeds its liabilities, grows over this period to reach $44.8 billion by 2021.
Non-financial public sector (NFPS) net debt reflects the combined debt of the general government and the public non-financial corporations (PNFC) sectors. NFPS net debt is expected to increase from an estimated $13.8 billion as at 30 June 2017 to $14.9 billion at 30 June 2021. These movements are as a result of net debt movements in both the general government and the PNFC sectors.
The state’s unfunded superannuation liability is estimated to be $11.2 billion at 30 June 2017. This is $961 million lower than the estimate at the time of the 2016–17 Budget largely as a result of higher projected earnings on superannuation assets and a marginally higher discount rate used to value the liability. The government remains on track to fully fund superannuation liabilities by 2034, with the unfunded liability projected to decline to $9.7 billion by 30 June 2021.
General government sector financial position
Table 4.1 summarises key balance sheet indicators for the general government sector.
2017–18 Budget Statement 63
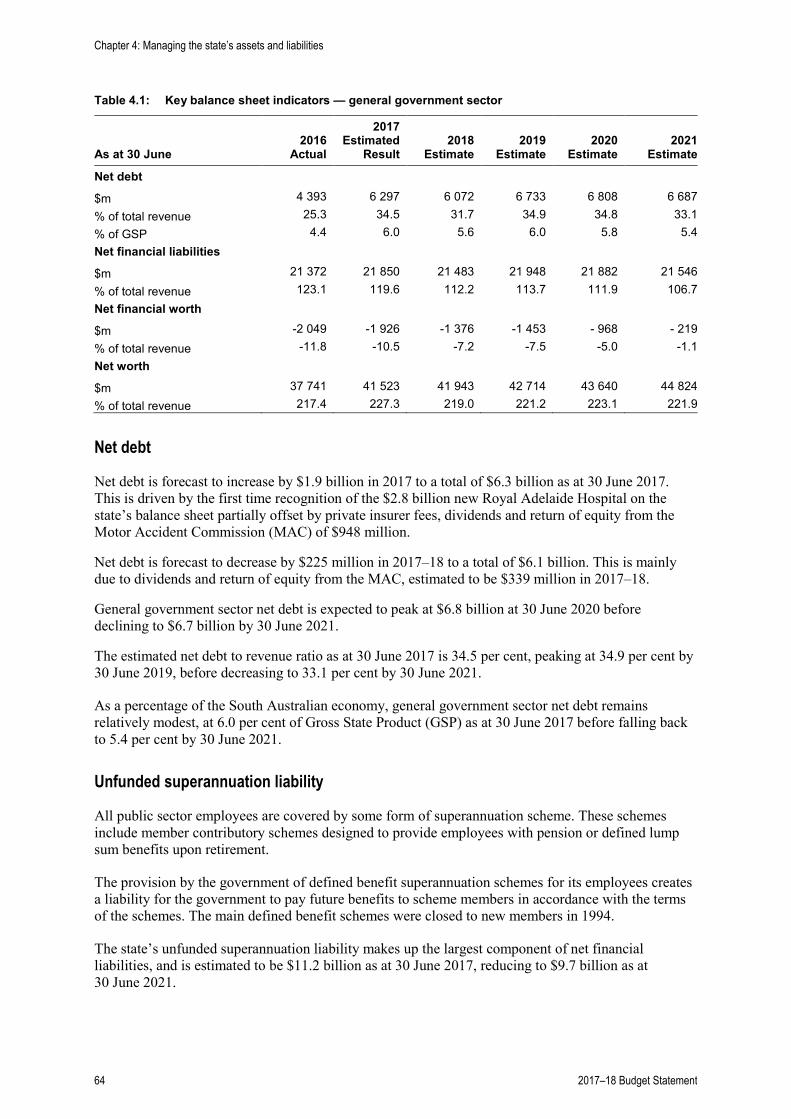
Table 4.1: Key balance sheet indicators — general government sector
As at 30 June 2016
Actual
2017 Estimated
Result 2018
Estimate 2019
Estimate 2020
Estimate 2021
Estimate
Net debt $m 4 393 6 297 6 072 6 733 6 808 6 687
% of total revenue 25.3 34.5 31.7 34.9 34.8 33.1 % of GSP 4.4 6.0 5.6 6.0 5.8 5.4 Net financial liabilities
$m 21 372 21 850 21 483 21 948 21 882 21 546 % of total revenue 123.1 119.6 112.2 113.7 111.9 106.7 Net financial worth
$m -2 049 -1 926 -1 376 -1 453 - 968 - 219 % of total revenue -11.8 -10.5 -7.2 -7.5 -5.0 -1.1 Net worth
$m 37 741 41 523 41 943 42 714 43 640 44 824 % of total revenue 217.4 227.3 219.0 221.2 223.1 221.9
Net debt
Net debt is forecast to increase by $1.9 billion in 2017 to a total of $6.3 billion as at 30 June 2017. This is driven by the first time recognition of the $2.8 billion new Royal Adelaide Hospital on the state’s balance sheet partially offset by private insurer fees, dividends and return of equity from the Motor Accident Commission (MAC) of $948 million.
Net debt is forecast to decrease by $225 million in 2017–18 to a total of $6.1 billion. This is mainly due to dividends and return of equity from the MAC, estimated to be $339 million in 2017–18.
General government sector net debt is expected to peak at $6.8 billion at 30 June 2020 before declining to $6.7 billion by 30 June 2021.
The estimated net debt to revenue ratio as at 30 June 2017 is 34.5 per cent, peaking at 34.9 per cent by 30 June 2019, before decreasing to 33.1 per cent by 30 June 2021.
As a percentage of the South Australian economy, general government sector net debt remains relatively modest, at 6.0 per cent of Gross State Product (GSP) as at 30 June 2017 before falling back to 5.4 per cent by 30 June 2021.
Unfunded superannuation liability
All public sector employees are covered by some form of superannuation scheme. These schemes include member contributory schemes designed to provide employees with pension or defined lump sum benefits upon retirement.
The provision by the government of defined benefit superannuation schemes for its employees creates a liability for the government to pay future benefits to scheme members in accordance with the terms of the schemes. The main defined benefit schemes were closed to new members in 1994.
The state’s unfunded superannuation liability makes up the largest component of net financial liabilities, and is estimated to be $11.2 billion as at 30 June 2017, reducing to $9.7 billion as at 30 June 2021.
Chapter 4: Managing the state’s assets and liabilities
64 2017–18 Budget Statement
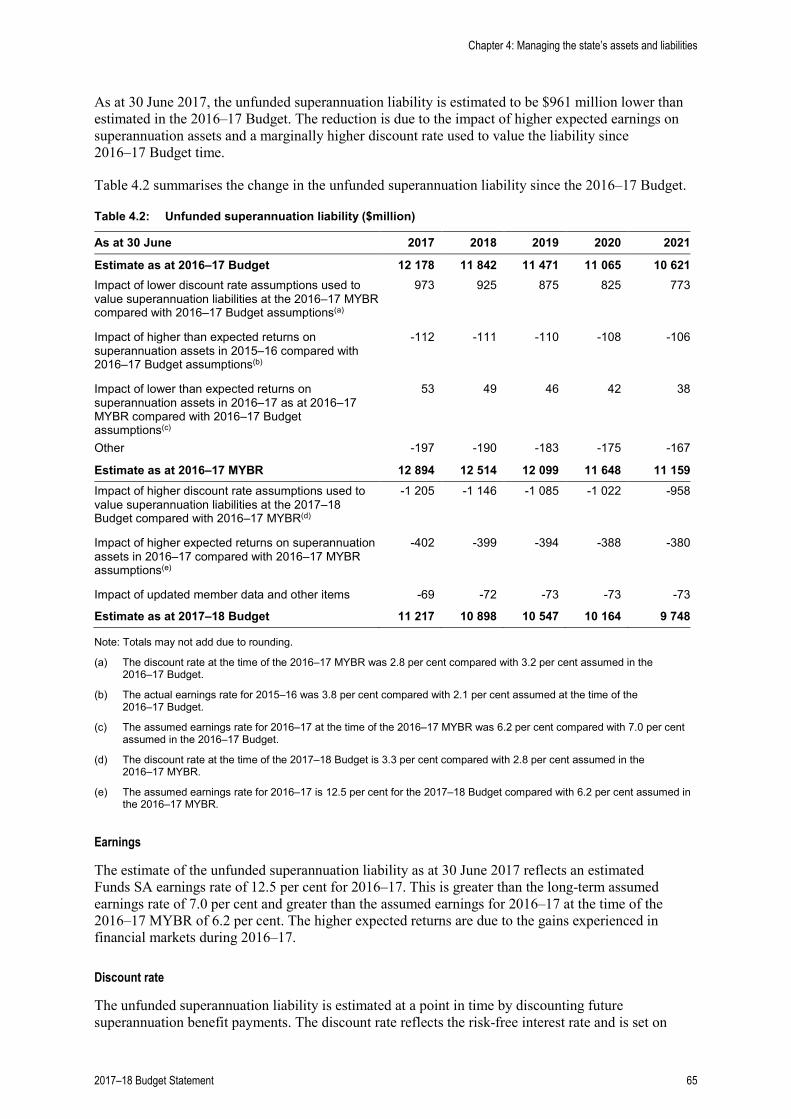
As at 30 June 2017, the unfunded superannuation liability is estimated to be $961 million lower than estimated in the 2016–17 Budget. The reduction is due to the impact of higher expected earnings on superannuation assets and a marginally higher discount rate used to value the liability since 2016–17 Budget time.
Table 4.2 summarises the change in the unfunded superannuation liability since the 2016–17 Budget.
Table 4.2: Unfunded superannuation liability ($million)
As at 30 June 2017 2018 2019 2020 2021
Estimate as at 2016–17 Budget 12 178 11 842 11 471 11 065 10 621 Impact of lower discount rate assumptions used to value superannuation liabilities at the 2016–17 MYBR compared with 2016–17 Budget assumptions(a)
973 925 875 825 773
Impact of higher than expected returns on superannuation assets in 2015–16 compared with 2016–17 Budget assumptions(b)
-112 -111 -110 -108 -106
Impact of lower than expected returns on superannuation assets in 2016–17 as at 2016–17 MYBR compared with 2016–17 Budget assumptions(c)
53 49 46 42 38
Other -197 -190 -183 -175 -167
Estimate as at 2016–17 MYBR 12 894 12 514 12 099 11 648 11 159 Impact of higher discount rate assumptions used to value superannuation liabilities at the 2017–18 Budget compared with 2016–17 MYBR(d)
-1 205 -1 146 -1 085 -1 022 -958
Impact of higher expected returns on superannuation assets in 2016–17 compared with 2016–17 MYBR assumptions(e)
-402 -399 -394 -388 -380
Impact of updated member data and other items -69 -72 -73 -73 -73
Estimate as at 2017–18 Budget 11 217 10 898 10 547 10 164 9 748
Note: Totals may not add due to rounding.
(a) The discount rate at the time of the 2016–17 MYBR was 2.8 per cent compared with 3.2 per cent assumed in the 2016–17 Budget.
(b) The actual earnings rate for 2015–16 was 3.8 per cent compared with 2.1 per cent assumed at the time of the 2016–17 Budget.
(c) The assumed earnings rate for 2016–17 at the time of the 2016–17 MYBR was 6.2 per cent compared with 7.0 per cent assumed in the 2016–17 Budget.
(d) The discount rate at the time of the 2017–18 Budget is 3.3 per cent compared with 2.8 per cent assumed in the 2016–17 MYBR.
(e) The assumed earnings rate for 2016–17 is 12.5 per cent for the 2017–18 Budget compared with 6.2 per cent assumed in the 2016–17 MYBR.
Earnings
The estimate of the unfunded superannuation liability as at 30 June 2017 reflects an estimated Funds SA earnings rate of 12.5 per cent for 2016–17. This is greater than the long-term assumed earnings rate of 7.0 per cent and greater than the assumed earnings for 2016–17 at the time of the 2016–17 MYBR of 6.2 per cent. The higher expected returns are due to the gains experienced in financial markets during 2016–17.
Discount rate
The unfunded superannuation liability is estimated at a point in time by discounting future superannuation benefit payments. The discount rate reflects the risk-free interest rate and is set on
Chapter 4: Managing the state’s assets and liabilities
2017–18 Budget Statement 65
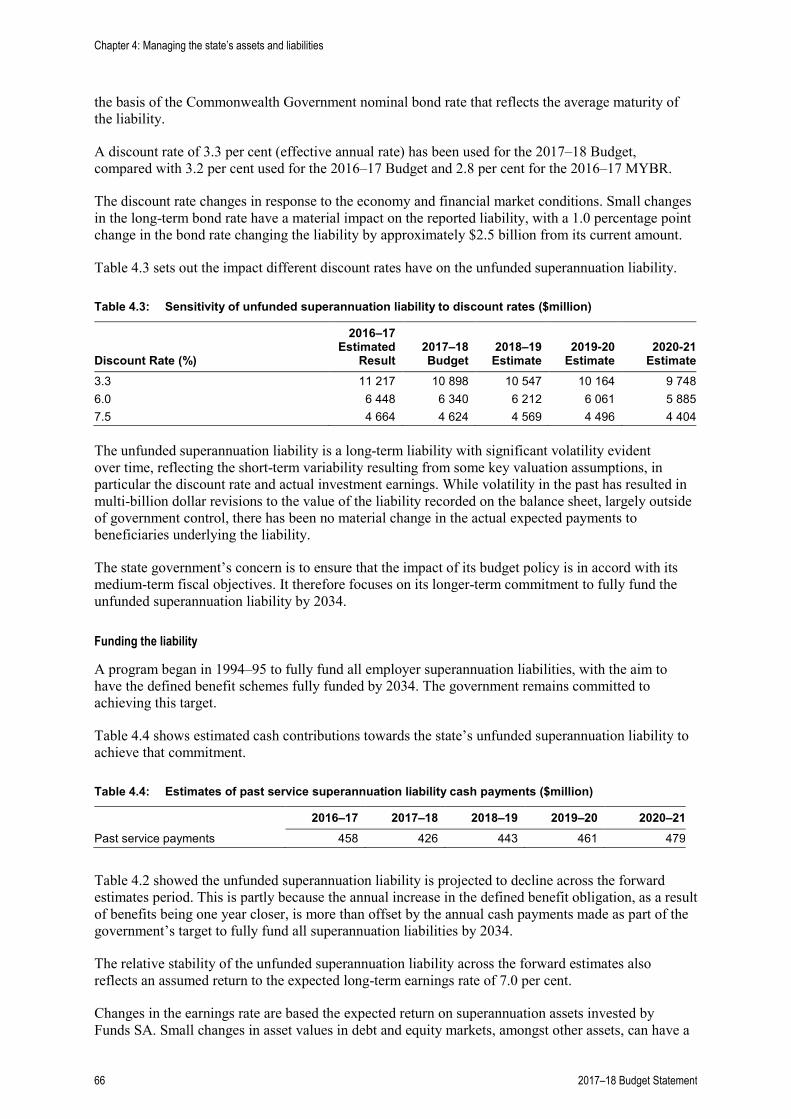
the basis of the Commonwealth Government nominal bond rate that reflects the average maturity of the liability.
A discount rate of 3.3 per cent (effective annual rate) has been used for the 2017–18 Budget, compared with 3.2 per cent used for the 2016–17 Budget and 2.8 per cent for the 2016–17 MYBR.
The discount rate changes in response to the economy and financial market conditions. Small changes in the long-term bond rate have a material impact on the reported liability, with a 1.0 percentage point change in the bond rate changing the liability by approximately $2.5 billion from its current amount.
Table 4.3 sets out the impact different discount rates have on the unfunded superannuation liability.
Table 4.3: Sensitivity of unfunded superannuation liability to discount rates ($million)
Discount Rate (%)
2016–17 Estimated
Result 2017–18 Budget
2018–19 Estimate
2019-20 Estimate
2020-21 Estimate
3.3 11 217 10 898 10 547 10 164 9 748 6.0 6 448 6 340 6 212 6 061 5 885 7.5 4 664 4 624 4 569 4 496 4 404
The unfunded superannuation liability is a long-term liability with significant volatility evident over time, reflecting the short-term variability resulting from some key valuation assumptions, in particular the discount rate and actual investment earnings. While volatility in the past has resulted in multi-billion dollar revisions to the value of the liability recorded on the balance sheet, largely outside of government control, there has been no material change in the actual expected payments to beneficiaries underlying the liability.
The state government’s concern is to ensure that the impact of its budget policy is in accord with its medium-term fiscal objectives. It therefore focuses on its longer-term commitment to fully fund the unfunded superannuation liability by 2034.
Funding the liability
A program began in 1994–95 to fully fund all employer superannuation liabilities, with the aim to have the defined benefit schemes fully funded by 2034. The government remains committed to achieving this target.
Table 4.4 shows estimated cash contributions towards the state’s unfunded superannuation liability to achieve that commitment.
Table 4.4: Estimates of past service superannuation liability cash payments ($million)
2016–17 2017–18 2018–19 2019–20 2020–21 Past service payments 458 426 443 461 479
Table 4.2 showed the unfunded superannuation liability is projected to decline across the forward estimates period. This is partly because the annual increase in the defined benefit obligation, as a result of benefits being one year closer, is more than offset by the annual cash payments made as part of the government’s target to fully fund all superannuation liabilities by 2034.
The relative stability of the unfunded superannuation liability across the forward estimates also reflects an assumed return to the expected long-term earnings rate of 7.0 per cent.
Changes in the earnings rate are based the expected return on superannuation assets invested by Funds SA. Small changes in asset values in debt and equity markets, amongst other assets, can have a
Chapter 4: Managing the state’s assets and liabilities
66 2017–18 Budget Statement
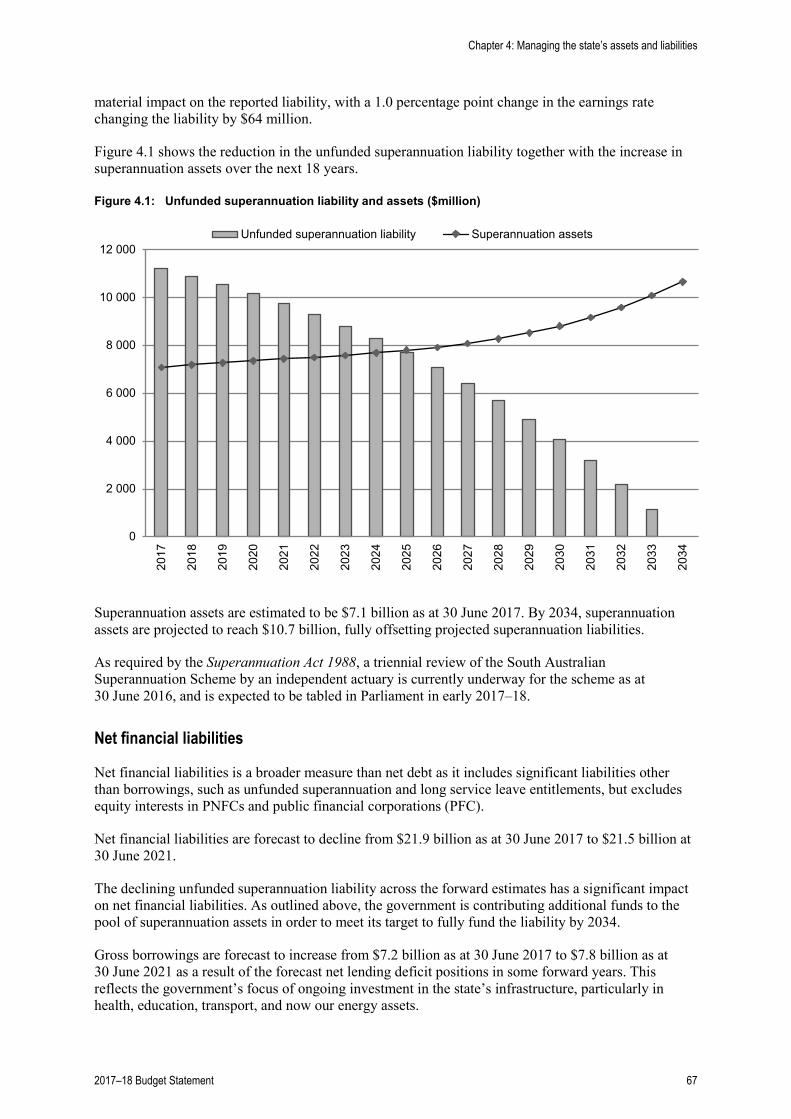
material impact on the reported liability, with a 1.0 percentage point change in the earnings rate changing the liability by $64 million.
Figure 4.1 shows the reduction in the unfunded superannuation liability together with the increase in superannuation assets over the next 18 years.
Figure 4.1: Unfunded superannuation liability and assets ($million)
0
2 000
4 000
6 000
8 000
10 000
12 000
2017
2018
2019
2020
2021
2022
2023
2024
2025
2026
2027
2028
2029
2030
2031
2032
2033
2034
Unfunded superannuation liability Superannuation assets
Superannuation assets are estimated to be $7.1 billion as at 30 June 2017. By 2034, superannuation assets are projected to reach $10.7 billion, fully offsetting projected superannuation liabilities.
As required by the Superannuation Act 1988, a triennial review of the South Australian Superannuation Scheme by an independent actuary is currently underway for the scheme as at 30 June 2016, and is expected to be tabled in Parliament in early 2017–18.
Net financial liabilities
Net financial liabilities is a broader measure than net debt as it includes significant liabilities other than borrowings, such as unfunded superannuation and long service leave entitlements, but excludes equity interests in PNFCs and public financial corporations (PFC).
Net financial liabilities are forecast to decline from $21.9 billion as at 30 June 2017 to $21.5 billion at 30 June 2021.
The declining unfunded superannuation liability across the forward estimates has a significant impact on net financial liabilities. As outlined above, the government is contributing additional funds to the pool of superannuation assets in order to meet its target to fully fund the liability by 2034.
Gross borrowings are forecast to increase from $7.2 billion as at 30 June 2017 to $7.8 billion as at 30 June 2021 as a result of the forecast net lending deficit positions in some forward years. This reflects the government’s focus of ongoing investment in the state’s infrastructure, particularly in health, education, transport, and now our energy assets.
Chapter 4: Managing the state’s assets and liabilities
2017–18 Budget Statement 67
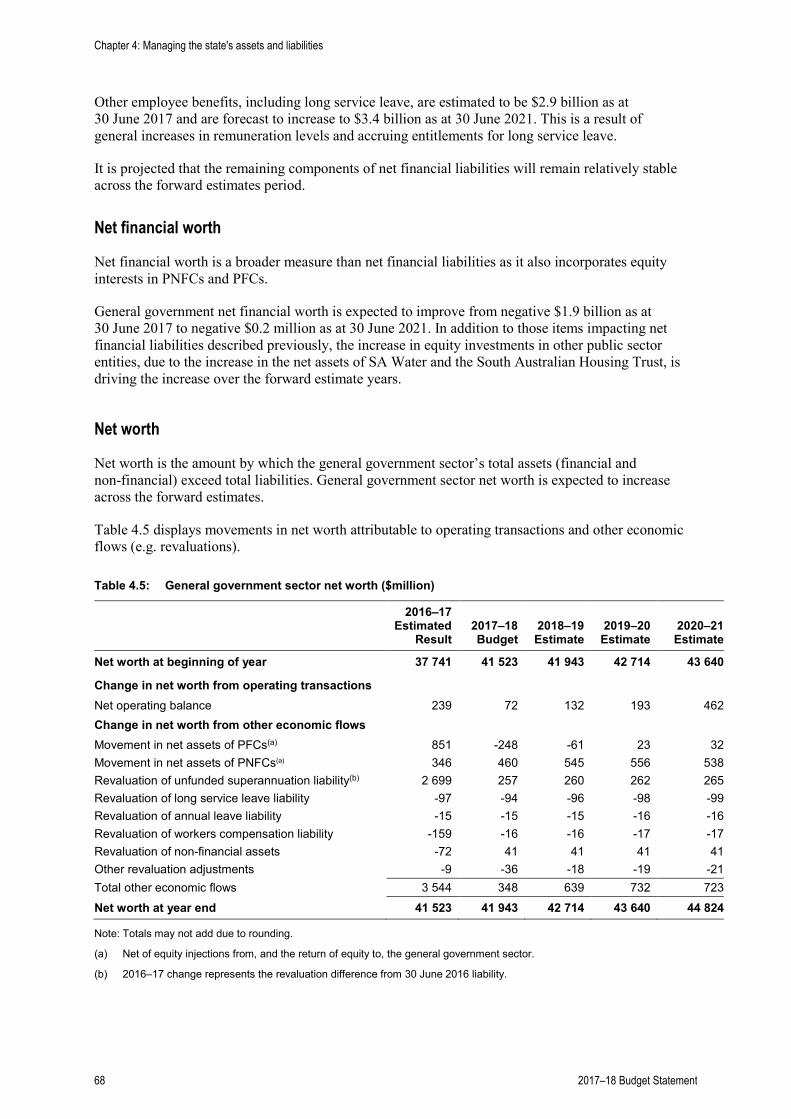
Other employee benefits, including long service leave, are estimated to be $2.9 billion as at 30 June 2017 and are forecast to increase to $3.4 billion as at 30 June 2021. This is a result of general increases in remuneration levels and accruing entitlements for long service leave.
It is projected that the remaining components of net financial liabilities will remain relatively stable across the forward estimates period.
Net financial worth
Net financial worth is a broader measure than net financial liabilities as it also incorporates equity interests in PNFCs and PFCs.
General government net financial worth is expected to improve from negative $1.9 billion as at 30 June 2017 to negative $0.2 million as at 30 June 2021. In addition to those items impacting net financial liabilities described previously, the increase in equity investments in other public sector entities, due to the increase in the net assets of SA Water and the South Australian Housing Trust, is driving the increase over the forward estimate years.
Net worth
Net worth is the amount by which the general government sector’s total assets (financial and non-financial) exceed total liabilities. General government sector net worth is expected to increase across the forward estimates.
Table 4.5 displays movements in net worth attributable to operating transactions and other economic flows (e.g. revaluations).
Table 4.5: General government sector net worth ($million)
2016–17 Estimated
Result 2017–18 Budget
2018–19 Estimate
2019–20 Estimate
2020–21 Estimate
Net worth at beginning of year 37 741 41 523 41 943 42 714 43 640
Change in net worth from operating transactions Net operating balance 239 72 132 193 462 Change in net worth from other economic flows Movement in net assets of PFCs(a) 851 -248 -61 23 32 Movement in net assets of PNFCs(a) 346 460 545 556 538 Revaluation of unfunded superannuation liability(b) 2 699 257 260 262 265 Revaluation of long service leave liability -97 -94 -96 -98 -99 Revaluation of annual leave liability -15 -15 -15 -16 -16 Revaluation of workers compensation liability -159 -16 -16 -17 -17 Revaluation of non-financial assets -72 41 41 41 41 Other revaluation adjustments -9 -36 -18 -19 -21 Total other economic flows 3 544 348 639 732 723 Net worth at year end 41 523 41 943 42 714 43 640 44 824
Note: Totals may not add due to rounding.
(a) Net of equity injections from, and the return of equity to, the general government sector.
(b) 2016–17 change represents the revaluation difference from 30 June 2016 liability.
Chapter 4: Managing the state's assets and liabilities
68 2017–18 Budget Statement
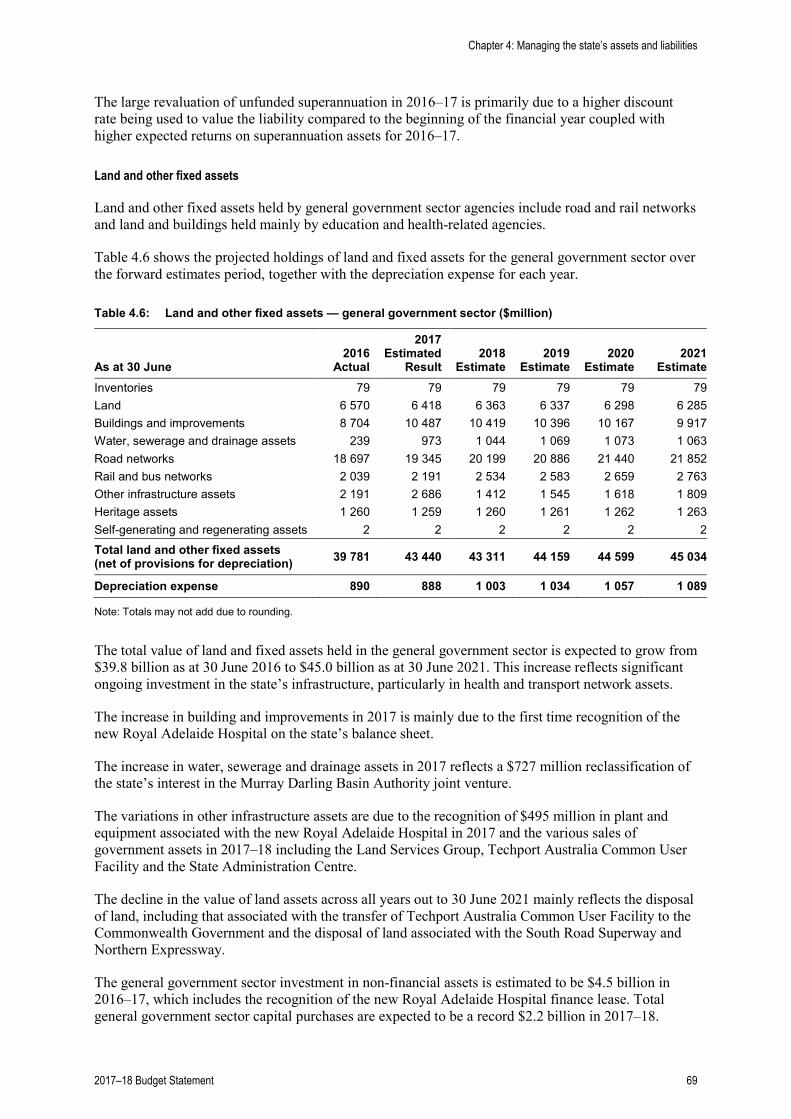
The large revaluation of unfunded superannuation in 2016–17 is primarily due to a higher discount rate being used to value the liability compared to the beginning of the financial year coupled with higher expected returns on superannuation assets for 2016–17.
Land and other fixed assets
Land and other fixed assets held by general government sector agencies include road and rail networks and land and buildings held mainly by education and health-related agencies.
Table 4.6 shows the projected holdings of land and fixed assets for the general government sector over the forward estimates period, together with the depreciation expense for each year.
Table 4.6: Land and other fixed assets — general government sector ($million)
As at 30 June 2016
Actual
2017 Estimated
Result 2018
Estimate 2019
Estimate 2020
Estimate 2021
Estimate Inventories 79 79 79 79 79 79 Land 6 570 6 418 6 363 6 337 6 298 6 285 Buildings and improvements 8 704 10 487 10 419 10 396 10 167 9 917 Water, sewerage and drainage assets 239 973 1 044 1 069 1 073 1 063 Road networks 18 697 19 345 20 199 20 886 21 440 21 852 Rail and bus networks 2 039 2 191 2 534 2 583 2 659 2 763 Other infrastructure assets 2 191 2 686 1 412 1 545 1 618 1 809 Heritage assets 1 260 1 259 1 260 1 261 1 262 1 263 Self-generating and regenerating assets 2 2 2 2 2 2 Total land and other fixed assets (net of provisions for depreciation) 39 781 43 440 43 311 44 159 44 599 45 034
Depreciation expense 890 888 1 003 1 034 1 057 1 089
Note: Totals may not add due to rounding.
The total value of land and fixed assets held in the general government sector is expected to grow from $39.8 billion as at 30 June 2016 to $45.0 billion as at 30 June 2021. This increase reflects significant ongoing investment in the state’s infrastructure, particularly in health and transport network assets.
The increase in building and improvements in 2017 is mainly due to the first time recognition of the new Royal Adelaide Hospital on the state’s balance sheet.
The increase in water, sewerage and drainage assets in 2017 reflects a $727 million reclassification of the state’s interest in the Murray Darling Basin Authority joint venture.
The variations in other infrastructure assets are due to the recognition of $495 million in plant and equipment associated with the new Royal Adelaide Hospital in 2017 and the various sales of government assets in 2017–18 including the Land Services Group, Techport Australia Common User Facility and the State Administration Centre.
The decline in the value of land assets across all years out to 30 June 2021 mainly reflects the disposal of land, including that associated with the transfer of Techport Australia Common User Facility to the Commonwealth Government and the disposal of land associated with the South Road Superway and Northern Expressway.
The general government sector investment in non-financial assets is estimated to be $4.5 billion in 2016–17, which includes the recognition of the new Royal Adelaide Hospital finance lease. Total general government sector capital purchases are expected to be a record $2.2 billion in 2017–18.
Chapter 4: Managing the state’s assets and liabilities
2017–18 Budget Statement 69
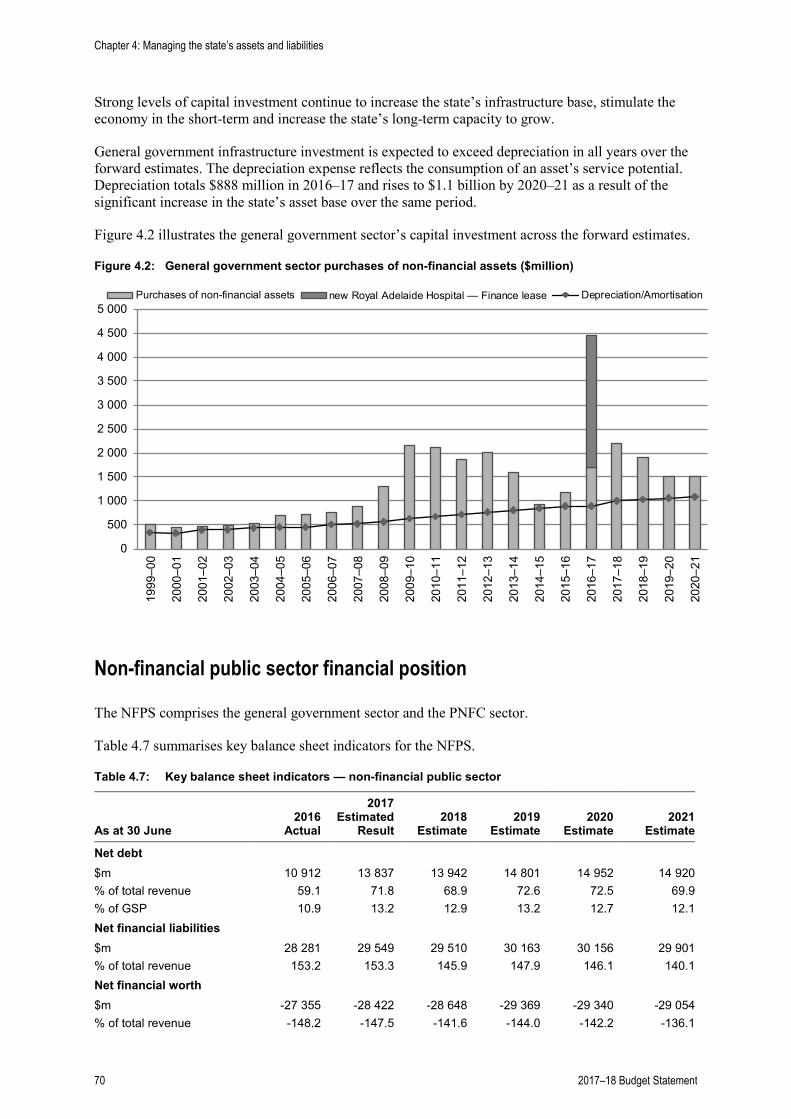
Strong levels of capital investment continue to increase the state’s infrastructure base, stimulate the economy in the short-term and increase the state’s long-term capacity to grow.
General government infrastructure investment is expected to exceed depreciation in all years over the forward estimates. The depreciation expense reflects the consumption of an asset’s service potential. Depreciation totals $888 million in 2016–17 and rises to $1.1 billion by 2020–21 as a result of the significant increase in the state’s asset base over the same period.
Figure 4.2 illustrates the general government sector’s capital investment across the forward estimates.
Figure 4.2: General government sector purchases of non-financial assets ($million)
0
500
1 000
1 500
2 000
2 500
3 000
3 500
4 000
4 500
5 000
1999
–00
2000
–01
2001
–02
2002
–03
2003
–04
2004
–05
2005
–06
2006
–07
2007
–08
2008
–09
2009
–10
2010
–11
2011
–12
2012
–13
2013
–14
2014
–15
2015
–16
2016
–17
2017
–18
2018
–19
2019
–20
2020
–21
Purchases of non-financial assets new Royal Adelaide Hospital — Finance lease Depreciation/Amortisation
Non-financial public sector financial position
The NFPS comprises the general government sector and the PNFC sector.
Table 4.7 summarises key balance sheet indicators for the NFPS.
Table 4.7: Key balance sheet indicators — non-financial public sector
As at 30 June 2016
Actual
2017 Estimated
Result 2018
Estimate 2019
Estimate 2020
Estimate 2021
Estimate
Net debt $m 10 912 13 837 13 942 14 801 14 952 14 920
% of total revenue 59.1 71.8 68.9 72.6 72.5 69.9 % of GSP 10.9 13.2 12.9 13.2 12.7 12.1 Net financial liabilities
$m 28 281 29 549 29 510 30 163 30 156 29 901 % of total revenue 153.2 153.3 145.9 147.9 146.1 140.1 Net financial worth
$m -27 355 -28 422 -28 648 -29 369 -29 340 -29 054 % of total revenue -148.2 -147.5 -141.6 -144.0 -142.2 -136.1
Chapter 4: Managing the state’s assets and liabilities
70 2017–18 Budget Statement
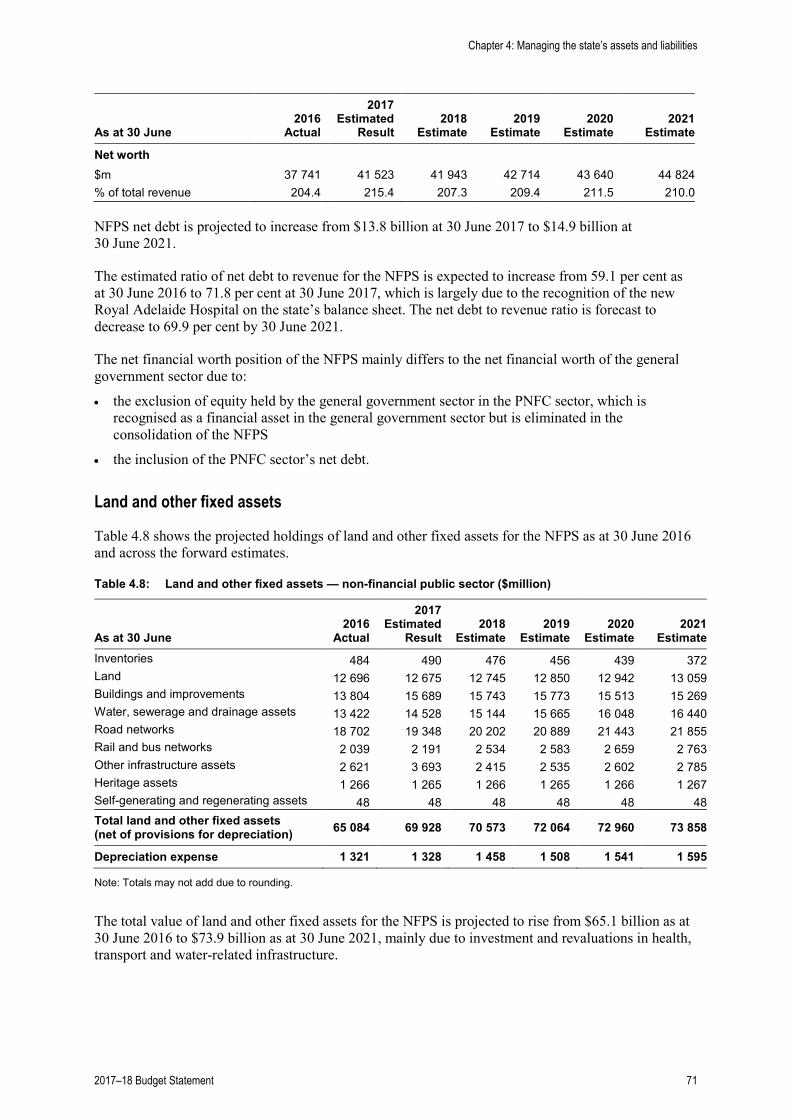
As at 30 June 2016
Actual
2017 Estimated
Result 2018
Estimate 2019
Estimate 2020
Estimate 2021
Estimate
Net worth $m 37 741 41 523 41 943 42 714 43 640 44 824
% of total revenue 204.4 215.4 207.3 209.4 211.5 210.0
NFPS net debt is projected to increase from $13.8 billion at 30 June 2017 to $14.9 billion at 30 June 2021.
The estimated ratio of net debt to revenue for the NFPS is expected to increase from 59.1 per cent as at 30 June 2016 to 71.8 per cent at 30 June 2017, which is largely due to the recognition of the new Royal Adelaide Hospital on the state’s balance sheet. The net debt to revenue ratio is forecast to decrease to 69.9 per cent by 30 June 2021.
The net financial worth position of the NFPS mainly differs to the net financial worth of the general government sector due to:
• the exclusion of equity held by the general government sector in the PNFC sector, which is recognised as a financial asset in the general government sector but is eliminated in the consolidation of the NFPS
• the inclusion of the PNFC sector’s net debt.
Land and other fixed assets
Table 4.8 shows the projected holdings of land and other fixed assets for the NFPS as at 30 June 2016 and across the forward estimates.
Table 4.8: Land and other fixed assets — non-financial public sector ($million)
As at 30 June 2016
Actual
2017 Estimated
Result 2018
Estimate 2019
Estimate 2020
Estimate 2021
Estimate Inventories 484 490 476 456 439 372 Land 12 696 12 675 12 745 12 850 12 942 13 059 Buildings and improvements 13 804 15 689 15 743 15 773 15 513 15 269 Water, sewerage and drainage assets 13 422 14 528 15 144 15 665 16 048 16 440 Road networks 18 702 19 348 20 202 20 889 21 443 21 855 Rail and bus networks 2 039 2 191 2 534 2 583 2 659 2 763 Other infrastructure assets 2 621 3 693 2 415 2 535 2 602 2 785 Heritage assets 1 266 1 265 1 266 1 265 1 266 1 267 Self-generating and regenerating assets 48 48 48 48 48 48 Total land and other fixed assets (net of provisions for depreciation) 65 084 69 928 70 573 72 064 72 960 73 858
Depreciation expense 1 321 1 328 1 458 1 508 1 541 1 595
Note: Totals may not add due to rounding.
The total value of land and other fixed assets for the NFPS is projected to rise from $65.1 billion as at 30 June 2016 to $73.9 billion as at 30 June 2021, mainly due to investment and revaluations in health, transport and water-related infrastructure.
Chapter 4: Managing the state’s assets and liabilities
2017–18 Budget Statement 71
The higher level of non-financial assets in the NFPS compared with the general government sector reflects the inclusion of assets held by PNFCs. These include assets held by SA Water (water and wastewater infrastructure such as pipelines, water filtration plants and reservoirs) and the South Australian Housing Trust (SAHT).
Debt Management
The funding and management of the state’s debt is undertaken by the South Australian Government Financing Authority (SAFA).
The state’s funding requirements are achieved by SAFA through the issue of securities in the financial markets, including long-term Select Line fixed interest securities issued in Australia and through SAFA’s short-term issuance programs.
Throughout the 2016–17 financial year, SAFA has had strong access to markets and continues to hold adequate levels of liquidity to ensure the state can meet its obligations.
Term interest rates in major world bond markets, including the United States of America and Europe, have moved marginally higher from historically low levels over the course of the current financial year. In addition, credit spreads have been broadly stable, in line with the global environment.
SAFA’s term borrowing rates have remained broadly unchanged over 2016–17. For instance, the interest rate on SAFA’s May 2021 Select Line bond has moved to 2.03 per cent as at 31 May 2017 from 2.02 per cent as at 30 June 2016. The interest rate on a corresponding Commonwealth Government bond has risen from 1.65 per cent to 1.79 per cent in the same time period, highlighting a 13 basis point relatively better performance in SAFA bonds.
The government’s debt management objective is to minimise the long-term average interest cost subject to acceptable levels of interest rate risk.
Debt is managed within a duration range of one to five years. There is no discretion to have an interest rate position outside that range. Interest rate risks are also controlled by the use of risk limits. These risk limits, based on industry standard measures, serve to limit the exposure of the portfolio to changes in market prices (yields). The debt management framework is reviewed regularly and such reviews take into account any significant changes in the state’s debt levels.
In addition to debt managed under this framework, the general government sector has long-term housing agreement debt with the Commonwealth Government. This is managed within the duration of the general government sector debt.
The framework for managing the debt of PNFCs, such as SA Water, is determined by the individual corporations.
Insurance arrangements
SAFA manages the government’s insurance arrangements through a separate insurance division using the trading name SAICORP.
The insurance function of SAFA is operated through three funds specifically established in the authority’s accounts to quarantine the insurance activities from SAFA’s finance activities.
Chapter 4: Managing the state’s assets and liabilities
72 2017–18 Budget Statement
Premiums received from agencies for insurance cover provided under the government’s insurance arrangements for incidents occurring from 1 July 1994 are credited to SAICORP Insurance Fund 1, which is used to:
• meet loss and claim payments above agreed levels of agency excesses
• provide a reserve to cover future losses and claims
• pay premiums for the government’s catastrophe reinsurance program and other insurances deemed necessary and appropriate in connection with the arrangements
• meet the cost of administering the insurance program
• pay service providers for advice and services as required in connection with the insurance program.
All government departments and statutory authorities are included in the arrangements, unless specifically exempted by the Treasurer.
Premium revenue earned by SAFA from client agencies for 2016–17 is estimated to be $42.4 million ($40.5 million for 2015–16). SAFA has a policy of accumulating reserves over time to meet the cost of retained risks. Funds not required to meet day-to-day operational costs or short-term claim costs are invested in the tax exempt multi-sector growth product of Funds SA.
At 30 June 2016, SAICORP Insurance Fund 1 had:
• total assets of $547.3 million
• total liabilities of $386.1 million, including outstanding claim liabilities of $348.8 million — medical malpractice claims accounted for $286.2 million of the outstanding claim liabilities
• net assets (free reserves) of $161.2 million.
SAICORP aims to maintain its level of free reserves (total assets over total liabilities expressed as a percentage) within a target range of 125 per cent to 165 per cent. At 30 June 2016 the level of free reserves was 141 per cent, which is within the target range. SAICORP operated within its target level of reserves throughout the year. As at 30 April 2017 free reserves were at 155 per cent.
Two other funds are retained for other residual claims, with these being in a break even position, and indemnified by the Treasurer.
Chapter 4: Managing the state’s assets and liabilities
2017–18 Budget Statement 73
Chapter 4: Managing the state’s assets and liabilities
74 2017–18 Budget Statement
Chapter 5: Government businesses
Overview
This chapter outlines the major developments and performance of government businesses. Government business is a broad term that captures both public non-financial corporations (government controlled entities that are engaged mainly in the production of marketable goods and/or services) and public financial corporations (government controlled entities engaged mainly in financial intermediation or other financial services). A defining feature of a government business is that a significant proportion of its operational costs are recovered through user charges. A complete list of government businesses is contained in Appendix D.
Key budget aggregates for the state’s government businesses are shown in Table 5.1.
Table 5.1: Key budget aggregates for public non-financial corporations and public financial corporations ($million)
2016–17 Budget
2016–17 Estimated
Result 2017–18 Budget
2018–19 Estimate
2019–20 Estimate
2020–21 Estimate
Public non-financial corporations
Net contribution to/from government(a) -235.9 -184.9 -186.6 -243.5 -269.8 -274.9 Capital investment 1 298.0 1 231.4 817.7 697.0 485.0 471.0 Net debt 7 524.3 7 540.3 7 870.0 8 067.2 8 144.6 8 233.6 Public financial corporations Net contribution to/from government(a) 135.0 429.9 352.4 159.1 66.6 33.8
(a) Net contribution to/from the government comprises income tax equivalents plus dividends less grants, subsidies and community service obligations. Positive indicates net contribution to government while negative indicates net contribution from government.
The net contribution from government to public non-financial corporations (PNFCs) in 2016–17 has improved from budget mainly due to a lower community service obligation (CSO) payment to Renewal SA. On 1 March 2017, Renewal SA purchased key TAFE SA properties from the Department of State Development (DSD) for $595 million. In the 2016–17 Budget, Renewal SA was budgeted to receive CSO payments in relation to its purchase of the TAFE SA properties. The finalised structure provides for DSD to pay commercial lease rates on the TAFE SA properties and ongoing CSO payments are therefore not required.
SA Water’s contributions to government in 2016–17 are on budget despite water sales being lower than expected throughout the year. This is mainly due to operating savings achieved by SA Water, lower depreciation and additional contributed assets. Commencing July 2017, the gearing level of SA Water will be maintained at a target debt to asset ratio of 45 per cent, ensuring that SA Water’s gearing levels are maintained in line with interstate peers.
In the 2014–15 Budget the state government announced the reform of the Compulsory Third Party (CTP) insurance market in South Australia which resulted in the Motor Accident Commission (MAC) ceasing its role as the sole provider of CTP insurance from 1 July 2016. The state government has now implemented a new market-based model for the private sector provision of CTP insurance. As a result of the reforms, from 2014 to June 2016, MAC paid $1.3 billion from its surplus assets into the state government's Highways Fund to improve the safety of roads in South Australia with a further $688.2 million paid in June 2017 following the transition to the new CTP arrangements. In addition, four private insurers paid $259.4 million to the state in 2016–17 at the time of their entry to the South
2017–18 Budget Statement 75
Australian CTP insurance market. Beyond 2016–17, further contributions totalling $509.8 million are anticipated to be paid across the forward estimates. In total, the reform of the CTP insurance market will return an estimated $2.8 billion to the general government sector.
Financial arrangements and policy framework
Financial contributions in the form of dividends and income tax equivalent payments which are made by public non-financial corporations (PNFCs) and public financial corporations (PFCs) are recorded as part of the general government sector’s revenue. PNFCs also pay guarantee fees to the government to ensure that their borrowing rates are consistent with competitive neutrality principles. Grants, subsidies and payments for CSOs made to PNFCs and PFCs are recorded as expenditures of the general government sector.
Competitive neutrality policy
All jurisdictions signed the Competition Principles Agreement, which covers a range of matters including competitive neutrality policy and principles (Competition Principles Agreement — 11 April 1995, as amended to 13 April 2007).
Among the requirements of the policy are that jurisdictions will ensure that their government business enterprises are subject to the same government taxes (or tax equivalent systems), debt guarantee fees and regulations that private sector businesses are normally subject to.
All jurisdictions recommitted to the principles in the Competition Principles Agreement at the Council of Australian Governments (COAG) meeting on 10 February 2006, and signed the Competition and Infrastructure Reform Agreement. The objectives listed under the agreement in relation to competitive neutrality of government business enterprises are:
• that the enterprise has clear commercial objectives
• that any non-commercial objectives or obligations established for the enterprise are clearly specified and publicly reported
• that enterprises do not exercise regulatory or planning approval functions in circumstances in which they compete with private sector enterprises.
Heads of Treasuries monitor and report annually to COAG on the operation of the enhanced competitive neutrality principles in the Competition and Infrastructure Reform Agreement. States are required to complete a competitive neutrality matrix template and self-assess compliance against criteria that reflect obligations under the Competition Principles Agreement and the Competition and Infrastructure Reform Agreement.
As a signatory to the Competition Principles Agreement, the Government of South Australia must also report annually on the competitive neutrality status of all of its significant business activities. Information on the status of category 1 and 2 significant business activities is published by the Department of the Premier and Cabinet on its website <dpc.sa.gov.au>.
Guarantee fees
Government guarantees on borrowed funds reduce borrowing costs for government authorities. Guarantee fees are charged for this funding cost advantage.
Guarantee fees are determined each year based on estimated credit margins (spreads) between the cost at which lower-rated entities or entities that have no assigned credit rating could borrow at on a stand-alone basis and the cost at which they can borrow through the Government of South Australia.
Chapter 5: Government businesses
76 2017–18 Budget Statement
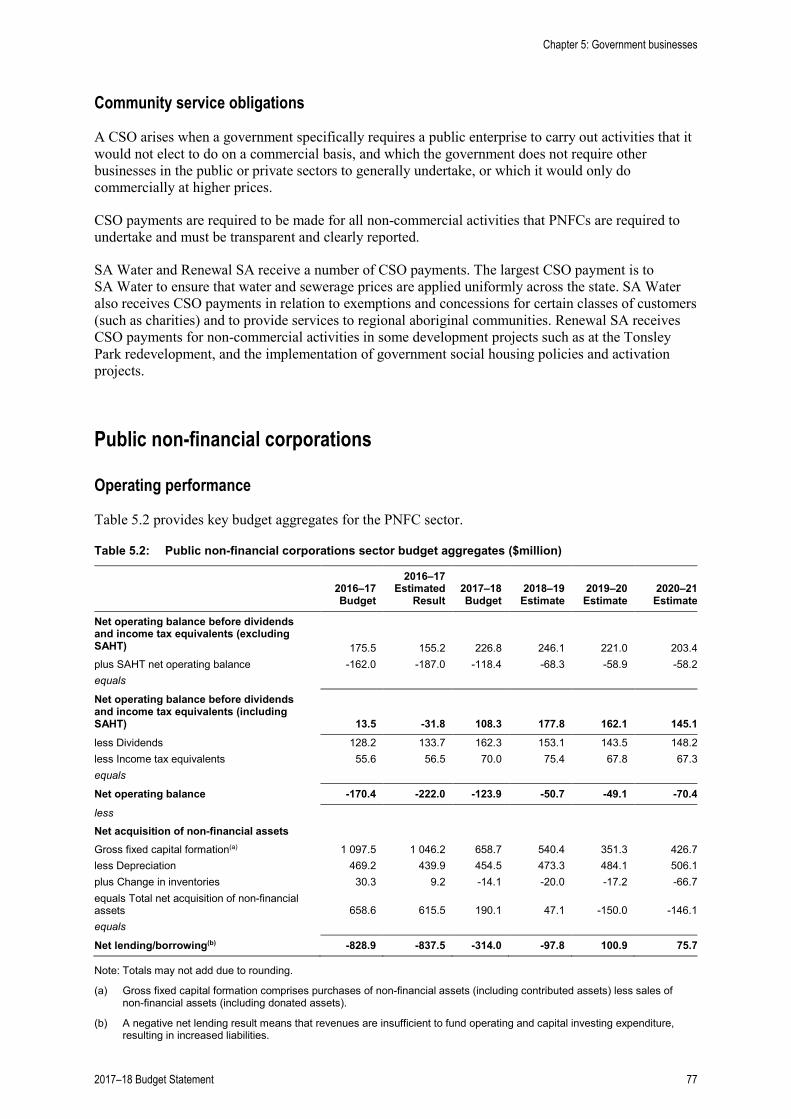
Community service obligations
A CSO arises when a government specifically requires a public enterprise to carry out activities that it would not elect to do on a commercial basis, and which the government does not require other businesses in the public or private sectors to generally undertake, or which it would only do commercially at higher prices.
CSO payments are required to be made for all non-commercial activities that PNFCs are required to undertake and must be transparent and clearly reported.
SA Water and Renewal SA receive a number of CSO payments. The largest CSO payment is to SA Water to ensure that water and sewerage prices are applied uniformly across the state. SA Water also receives CSO payments in relation to exemptions and concessions for certain classes of customers (such as charities) and to provide services to regional aboriginal communities. Renewal SA receives CSO payments for non-commercial activities in some development projects such as at the Tonsley Park redevelopment, and the implementation of government social housing policies and activation projects.
Public non-financial corporations
Operating performance
Table 5.2 provides key budget aggregates for the PNFC sector.
Table 5.2: Public non-financial corporations sector budget aggregates ($million)
2016–17 Budget
2016–17 Estimated
Result 2017–18 Budget
2018–19 Estimate
2019–20 Estimate
2020–21 Estimate
Net operating balance before dividends and income tax equivalents (excluding SAHT) 175.5 155.2 226.8 246.1 221.0 203.4 plus SAHT net operating balance -162.0 -187.0 -118.4 -68.3 -58.9 -58.2 equals
Net operating balance before dividends and income tax equivalents (including SAHT) 13.5 -31.8 108.3 177.8 162.1 145.1 less Dividends 128.2 133.7 162.3 153.1 143.5 148.2 less Income tax equivalents 55.6 56.5 70.0 75.4 67.8 67.3 equals
Net operating balance -170.4 -222.0 -123.9 -50.7 -49.1 -70.4 less Net acquisition of non-financial assets Gross fixed capital formation(a) 1 097.5 1 046.2 658.7 540.4 351.3 426.7 less Depreciation 469.2 439.9 454.5 473.3 484.1 506.1 plus Change in inventories 30.3 9.2 -14.1 -20.0 -17.2 -66.7 equals Total net acquisition of non-financial assets 658.6 615.5 190.1 47.1 -150.0 -146.1 equals
Net lending/borrowing(b) -828.9 -837.5 -314.0 -97.8 100.9 75.7
Note: Totals may not add due to rounding.
(a) Gross fixed capital formation comprises purchases of non-financial assets (including contributed assets) less sales of non-financial assets (including donated assets).
(b) A negative net lending result means that revenues are insufficient to fund operating and capital investing expenditure, resulting in increased liabilities.
Chapter 5: Government businesses
2017–18 Budget Statement 77
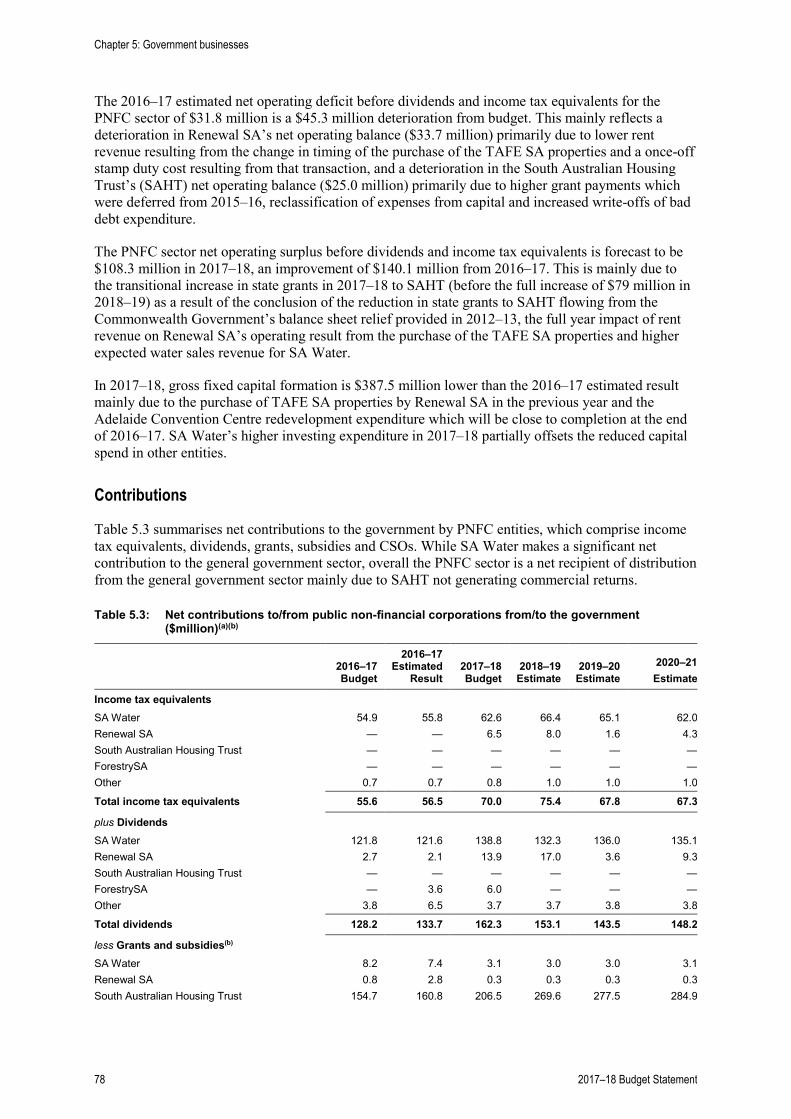
The 2016–17 estimated net operating deficit before dividends and income tax equivalents for the PNFC sector of $31.8 million is a $45.3 million deterioration from budget. This mainly reflects a deterioration in Renewal SA’s net operating balance ($33.7 million) primarily due to lower rent revenue resulting from the change in timing of the purchase of the TAFE SA properties and a once-off stamp duty cost resulting from that transaction, and a deterioration in the South Australian Housing Trust’s (SAHT) net operating balance ($25.0 million) primarily due to higher grant payments which were deferred from 2015–16, reclassification of expenses from capital and increased write-offs of bad debt expenditure.
The PNFC sector net operating surplus before dividends and income tax equivalents is forecast to be $108.3 million in 2017–18, an improvement of $140.1 million from 2016–17. This is mainly due to the transitional increase in state grants in 2017–18 to SAHT (before the full increase of $79 million in 2018–19) as a result of the conclusion of the reduction in state grants to SAHT flowing from the Commonwealth Government’s balance sheet relief provided in 2012–13, the full year impact of rent revenue on Renewal SA’s operating result from the purchase of the TAFE SA properties and higher expected water sales revenue for SA Water.
In 2017–18, gross fixed capital formation is $387.5 million lower than the 2016–17 estimated result mainly due to the purchase of TAFE SA properties by Renewal SA in the previous year and the Adelaide Convention Centre redevelopment expenditure which will be close to completion at the end of 2016–17. SA Water’s higher investing expenditure in 2017–18 partially offsets the reduced capital spend in other entities.
Contributions
Table 5.3 summarises net contributions to the government by PNFC entities, which comprise income tax equivalents, dividends, grants, subsidies and CSOs. While SA Water makes a significant net contribution to the general government sector, overall the PNFC sector is a net recipient of distribution from the general government sector mainly due to SAHT not generating commercial returns.
Table 5.3: Net contributions to/from public non-financial corporations from/to the government ($million)(a)(b)
2016–17 Budget
2016–17 Estimated
Result 2017–18 Budget
2018–19 Estimate
2019–20 Estimate
2020–21 Estimate
Income tax equivalents SA Water 54.9 55.8 62.6 66.4 65.1 62.0 Renewal SA — — 6.5 8.0 1.6 4.3 South Australian Housing Trust — — — — — — ForestrySA — — — — — — Other 0.7 0.7 0.8 1.0 1.0 1.0
Total income tax equivalents 55.6 56.5 70.0 75.4 67.8 67.3
plus Dividends SA Water 121.8 121.6 138.8 132.3 136.0 135.1 Renewal SA 2.7 2.1 13.9 17.0 3.6 9.3 South Australian Housing Trust — — — — — — ForestrySA — 3.6 6.0 — — — Other 3.8 6.5 3.7 3.7 3.8 3.8
Total dividends 128.2 133.7 162.3 153.1 143.5 148.2
less Grants and subsidies(b) SA Water 8.2 7.4 3.1 3.0 3.0 3.1 Renewal SA 0.8 2.8 0.3 0.3 0.3 0.3 South Australian Housing Trust 154.7 160.8 206.5 269.6 277.5 284.9
Chapter 5: Government businesses
78 2017–18 Budget Statement
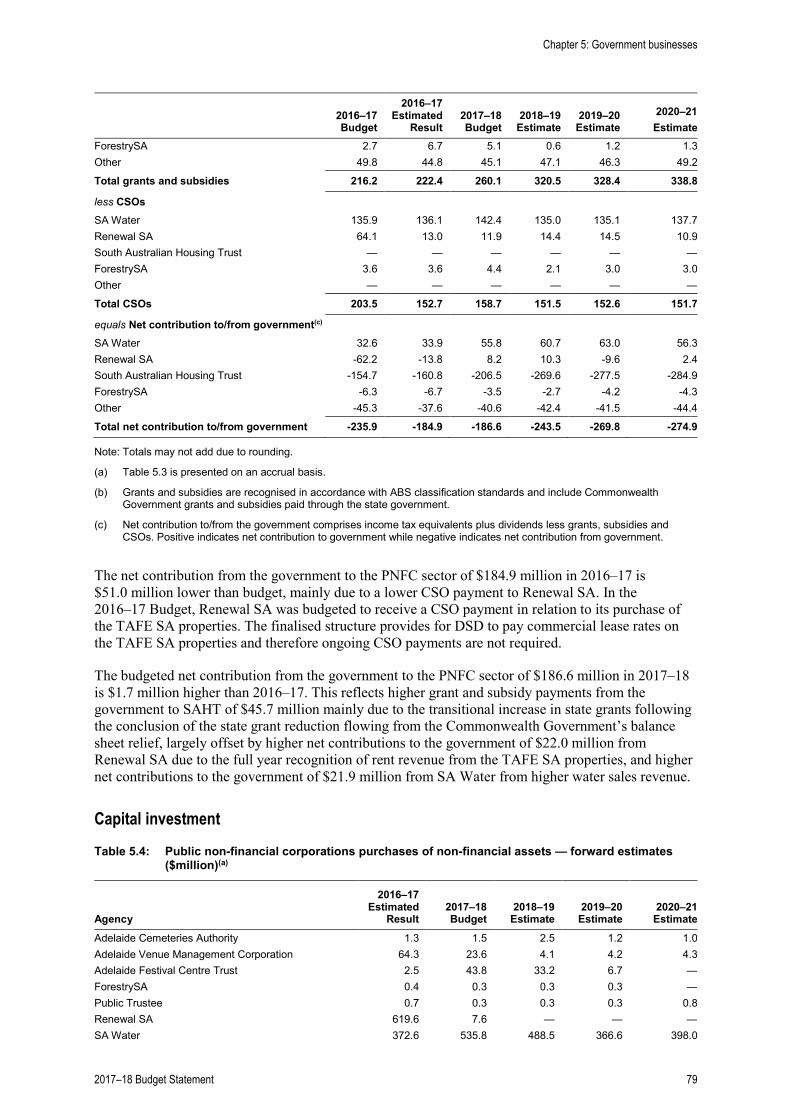
2016–17 Budget
2016–17 Estimated
Result 2017–18 Budget
2018–19 Estimate
2019–20 Estimate
2020–21 Estimate
ForestrySA 2.7 6.7 5.1 0.6 1.2 1.3 Other 49.8 44.8 45.1 47.1 46.3 49.2
Total grants and subsidies 216.2 222.4 260.1 320.5 328.4 338.8
less CSOs SA Water 135.9 136.1 142.4 135.0 135.1 137.7 Renewal SA 64.1 13.0 11.9 14.4 14.5 10.9 South Australian Housing Trust — — — — — — ForestrySA 3.6 3.6 4.4 2.1 3.0 3.0 Other — — — — — —
Total CSOs 203.5 152.7 158.7 151.5 152.6 151.7
equals Net contribution to/from government(c) SA Water 32.6 33.9 55.8 60.7 63.0 56.3 Renewal SA -62.2 -13.8 8.2 10.3 -9.6 2.4 South Australian Housing Trust -154.7 -160.8 -206.5 -269.6 -277.5 -284.9 ForestrySA -6.3 -6.7 -3.5 -2.7 -4.2 -4.3 Other -45.3 -37.6 -40.6 -42.4 -41.5 -44.4
Total net contribution to/from government -235.9 -184.9 -186.6 -243.5 -269.8 -274.9
Note: Totals may not add due to rounding.
(a) Table 5.3 is presented on an accrual basis.
(b) Grants and subsidies are recognised in accordance with ABS classification standards and include Commonwealth Government grants and subsidies paid through the state government.
(c) Net contribution to/from the government comprises income tax equivalents plus dividends less grants, subsidies and CSOs. Positive indicates net contribution to government while negative indicates net contribution from government.
The net contribution from the government to the PNFC sector of $184.9 million in 2016–17 is $51.0 million lower than budget, mainly due to a lower CSO payment to Renewal SA. In the 2016–17 Budget, Renewal SA was budgeted to receive a CSO payment in relation to its purchase of the TAFE SA properties. The finalised structure provides for DSD to pay commercial lease rates on the TAFE SA properties and therefore ongoing CSO payments are not required.
The budgeted net contribution from the government to the PNFC sector of $186.6 million in 2017–18 is $1.7 million higher than 2016–17. This reflects higher grant and subsidy payments from the government to SAHT of $45.7 million mainly due to the transitional increase in state grants following the conclusion of the state grant reduction flowing from the Commonwealth Government’s balance sheet relief, largely offset by higher net contributions to the government of $22.0 million from Renewal SA due to the full year recognition of rent revenue from the TAFE SA properties, and higher net contributions to the government of $21.9 million from SA Water from higher water sales revenue.
Capital investment
Table 5.4: Public non-financial corporations purchases of non-financial assets — forward estimates ($million)(a)
Agency
2016–17 Estimated
Result 2017–18 Budget
2018–19 Estimate
2019–20 Estimate
2020–21
Estimate Adelaide Cemeteries Authority 1.3 1.5 2.5 1.2 1.0 Adelaide Venue Management Corporation 64.3 23.6 4.1 4.2 4.3 Adelaide Festival Centre Trust 2.5 43.8 33.2 6.7 — ForestrySA 0.4 0.3 0.3 0.3 — Public Trustee 0.7 0.3 0.3 0.3 0.8 Renewal SA 619.6 7.6 — — — SA Water 372.6 535.8 488.5 366.6 398.0
Chapter 5: Government businesses
2017–18 Budget Statement 79
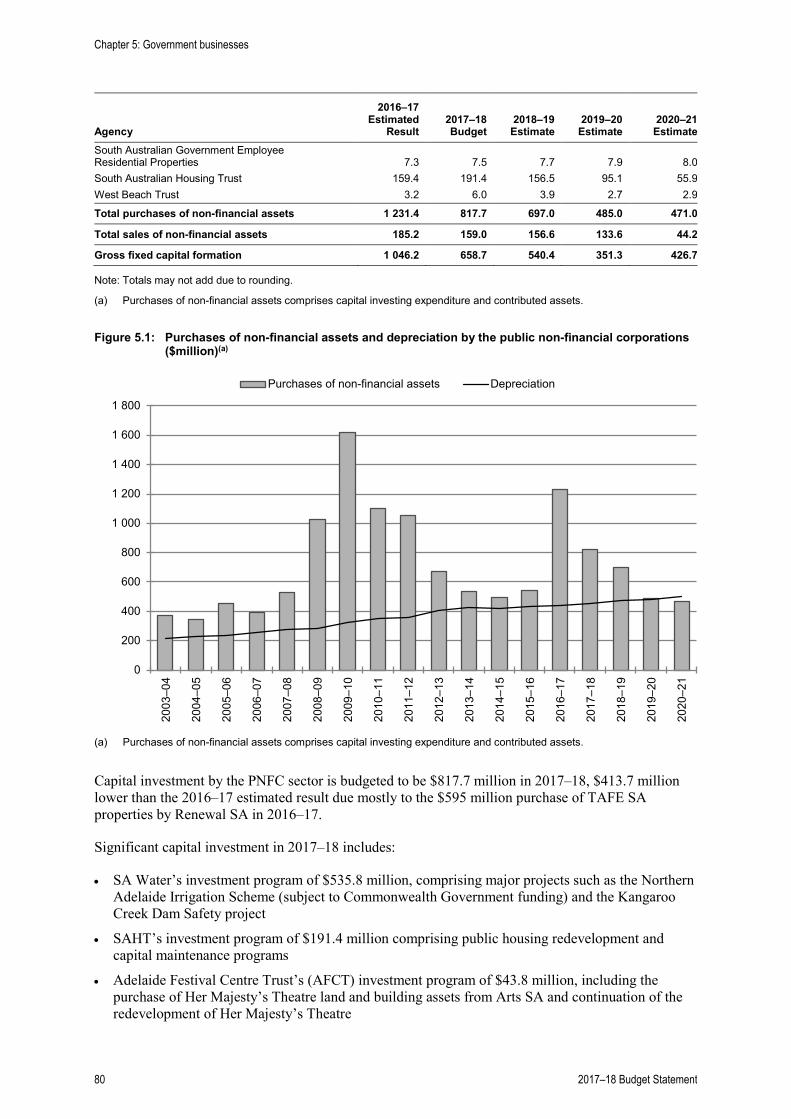
Agency
2016–17 Estimated
Result 2017–18 Budget
2018–19 Estimate
2019–20 Estimate
2020–21
Estimate South Australian Government Employee Residential Properties 7.3 7.5 7.7 7.9 8.0 South Australian Housing Trust 159.4 191.4 156.5 95.1 55.9 West Beach Trust 3.2 6.0 3.9 2.7 2.9
Total purchases of non-financial assets 1 231.4 817.7 697.0 485.0 471.0
Total sales of non-financial assets 185.2 159.0 156.6 133.6 44.2
Gross fixed capital formation 1 046.2 658.7 540.4 351.3 426.7
Note: Totals may not add due to rounding.
(a) Purchases of non-financial assets comprises capital investing expenditure and contributed assets.
Figure 5.1: Purchases of non-financial assets and depreciation by the public non-financial corporations ($million)(a)
0
200
400
600
800
1 000
1 200
1 400
1 600
1 800
2003
–04
2004
–05
2005
–06
2006
–07
2007
–08
2008
–09
2009
–10
2010
–11
2011
–12
2012
–13
2013
–14
2014
–15
2015
–16
2016
–17
2017
–18
2018
–19
2019
–20
2020
–21
Purchases of non-financial assets Depreciation
(a) Purchases of non-financial assets comprises capital investing expenditure and contributed assets.
Capital investment by the PNFC sector is budgeted to be $817.7 million in 2017–18, $413.7 million lower than the 2016–17 estimated result due mostly to the $595 million purchase of TAFE SA properties by Renewal SA in 2016–17.
Significant capital investment in 2017–18 includes:
• SA Water’s investment program of $535.8 million, comprising major projects such as the Northern Adelaide Irrigation Scheme (subject to Commonwealth Government funding) and the Kangaroo Creek Dam Safety project
• SAHT’s investment program of $191.4 million comprising public housing redevelopment and capital maintenance programs
• Adelaide Festival Centre Trust’s (AFCT) investment program of $43.8 million, including the purchase of Her Majesty’s Theatre land and building assets from Arts SA and continuation of the redevelopment of Her Majesty’s Theatre
Chapter 5: Government businesses
80 2017–18 Budget Statement
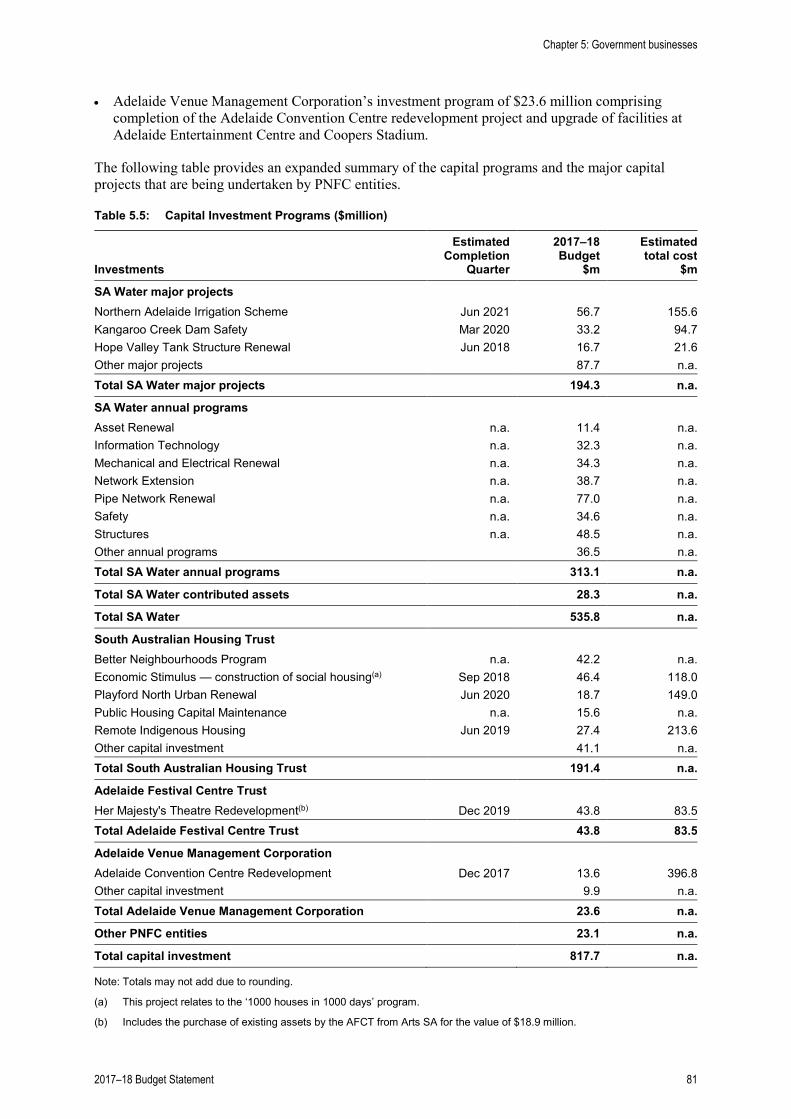
• Adelaide Venue Management Corporation’s investment program of $23.6 million comprising completion of the Adelaide Convention Centre redevelopment project and upgrade of facilities at Adelaide Entertainment Centre and Coopers Stadium.
The following table provides an expanded summary of the capital programs and the major capital projects that are being undertaken by PNFC entities.
Table 5.5: Capital Investment Programs ($million)
Investments
Estimated Completion
Quarter
2017–18 Budget
$m
Estimated total cost
$m
SA Water major projects
Northern Adelaide Irrigation Scheme Jun 2021 56.7 155.6 Kangaroo Creek Dam Safety Mar 2020 33.2 94.7 Hope Valley Tank Structure Renewal Jun 2018 16.7 21.6 Other major projects 87.7 n.a. Total SA Water major projects 194.3 n.a.
SA Water annual programs
Asset Renewal n.a. 11.4 n.a. Information Technology n.a. 32.3 n.a. Mechanical and Electrical Renewal n.a. 34.3 n.a. Network Extension n.a. 38.7 n.a. Pipe Network Renewal n.a. 77.0 n.a. Safety n.a. 34.6 n.a. Structures n.a. 48.5 n.a. Other annual programs 36.5 n.a. Total SA Water annual programs 313.1 n.a.
Total SA Water contributed assets 28.3 n.a.
Total SA Water 535.8 n.a.
South Australian Housing Trust
Better Neighbourhoods Program n.a. 42.2 n.a. Economic Stimulus — construction of social housing(a) Sep 2018 46.4 118.0 Playford North Urban Renewal Jun 2020 18.7 149.0 Public Housing Capital Maintenance n.a. 15.6 n.a. Remote Indigenous Housing Jun 2019 27.4 213.6 Other capital investment 41.1 n.a. Total South Australian Housing Trust 191.4 n.a.
Adelaide Festival Centre Trust
Her Majesty's Theatre Redevelopment(b) Dec 2019 43.8 83.5 Total Adelaide Festival Centre Trust 43.8 83.5
Adelaide Venue Management Corporation Adelaide Convention Centre Redevelopment Dec 2017 13.6 396.8 Other capital investment 9.9 n.a. Total Adelaide Venue Management Corporation 23.6 n.a.
Other PNFC entities 23.1 n.a.
Total capital investment 817.7 n.a.
Note: Totals may not add due to rounding.
(a) This project relates to the ‘1000 houses in 1000 days’ program.
(b) Includes the purchase of existing assets by the AFCT from Arts SA for the value of $18.9 million.
Chapter 5: Government businesses
2017–18 Budget Statement 81
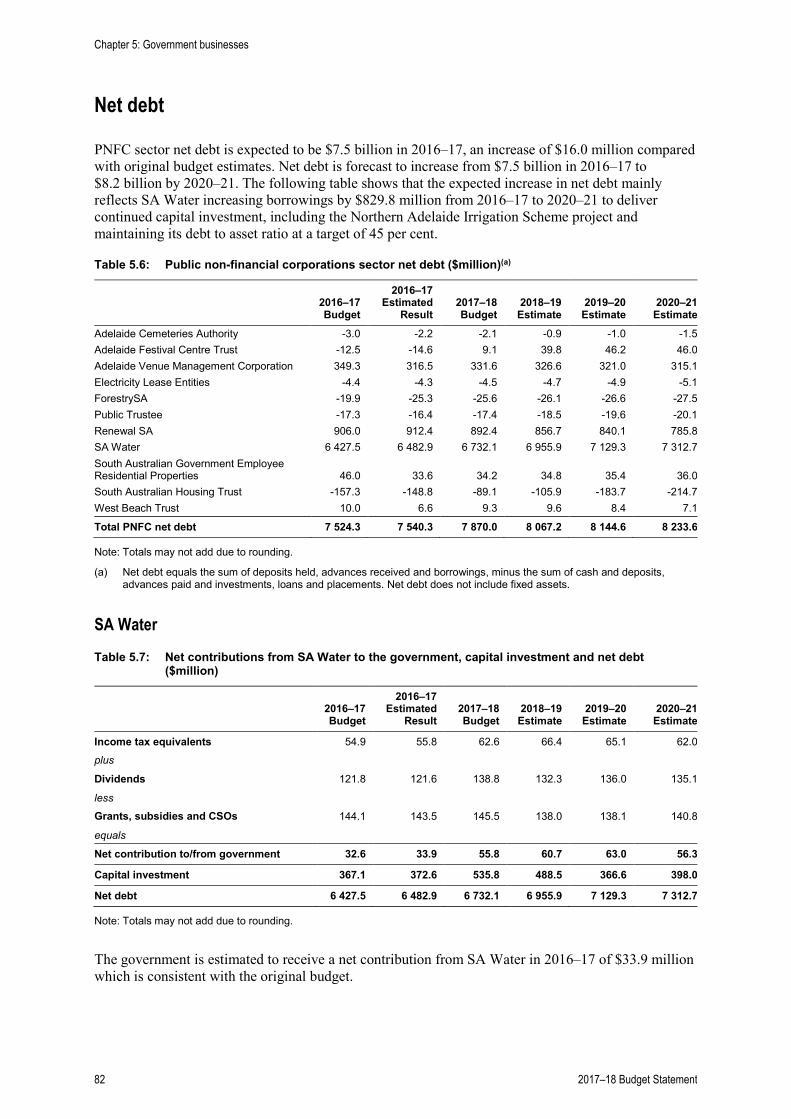
Net debt
PNFC sector net debt is expected to be $7.5 billion in 2016–17, an increase of $16.0 million compared with original budget estimates. Net debt is forecast to increase from $7.5 billion in 2016–17 to $8.2 billion by 2020–21. The following table shows that the expected increase in net debt mainly reflects SA Water increasing borrowings by $829.8 million from 2016–17 to 2020–21 to deliver continued capital investment, including the Northern Adelaide Irrigation Scheme project and maintaining its debt to asset ratio at a target of 45 per cent.
Table 5.6: Public non-financial corporations sector net debt ($million)(a)
2016–17 Budget
2016–17 Estimated
Result 2017–18 Budget
2018–19 Estimate
2019–20 Estimate
2020–21 Estimate
Adelaide Cemeteries Authority -3.0 -2.2 -2.1 -0.9 -1.0 -1.5 Adelaide Festival Centre Trust -12.5 -14.6 9.1 39.8 46.2 46.0 Adelaide Venue Management Corporation 349.3 316.5 331.6 326.6 321.0 315.1 Electricity Lease Entities -4.4 -4.3 -4.5 -4.7 -4.9 -5.1 ForestrySA -19.9 -25.3 -25.6 -26.1 -26.6 -27.5 Public Trustee -17.3 -16.4 -17.4 -18.5 -19.6 -20.1 Renewal SA 906.0 912.4 892.4 856.7 840.1 785.8 SA Water 6 427.5 6 482.9 6 732.1 6 955.9 7 129.3 7 312.7 South Australian Government Employee Residential Properties 46.0 33.6 34.2 34.8 35.4 36.0 South Australian Housing Trust -157.3 -148.8 -89.1 -105.9 -183.7 -214.7 West Beach Trust 10.0 6.6 9.3 9.6 8.4 7.1
Total PNFC net debt 7 524.3 7 540.3 7 870.0 8 067.2 8 144.6 8 233.6
Note: Totals may not add due to rounding.
(a) Net debt equals the sum of deposits held, advances received and borrowings, minus the sum of cash and deposits, advances paid and investments, loans and placements. Net debt does not include fixed assets.
SA Water
Table 5.7: Net contributions from SA Water to the government, capital investment and net debt ($million)
2016–17 Budget
2016–17 Estimated
Result 2017–18 Budget
2018–19 Estimate
2019–20 Estimate
2020–21 Estimate
Income tax equivalents 54.9 55.8 62.6 66.4 65.1 62.0
plus Dividends 121.8 121.6 138.8 132.3 136.0 135.1
less Grants, subsidies and CSOs 144.1 143.5 145.5 138.0 138.1 140.8
equals Net contribution to/from government 32.6 33.9 55.8 60.7 63.0 56.3
Capital investment 367.1 372.6 535.8 488.5 366.6 398.0
Net debt 6 427.5 6 482.9 6 732.1 6 955.9 7 129.3 7 312.7
Note: Totals may not add due to rounding.
The government is estimated to receive a net contribution from SA Water in 2016–17 of $33.9 million which is consistent with the original budget.
Chapter 5: Government businesses
82 2017–18 Budget Statement
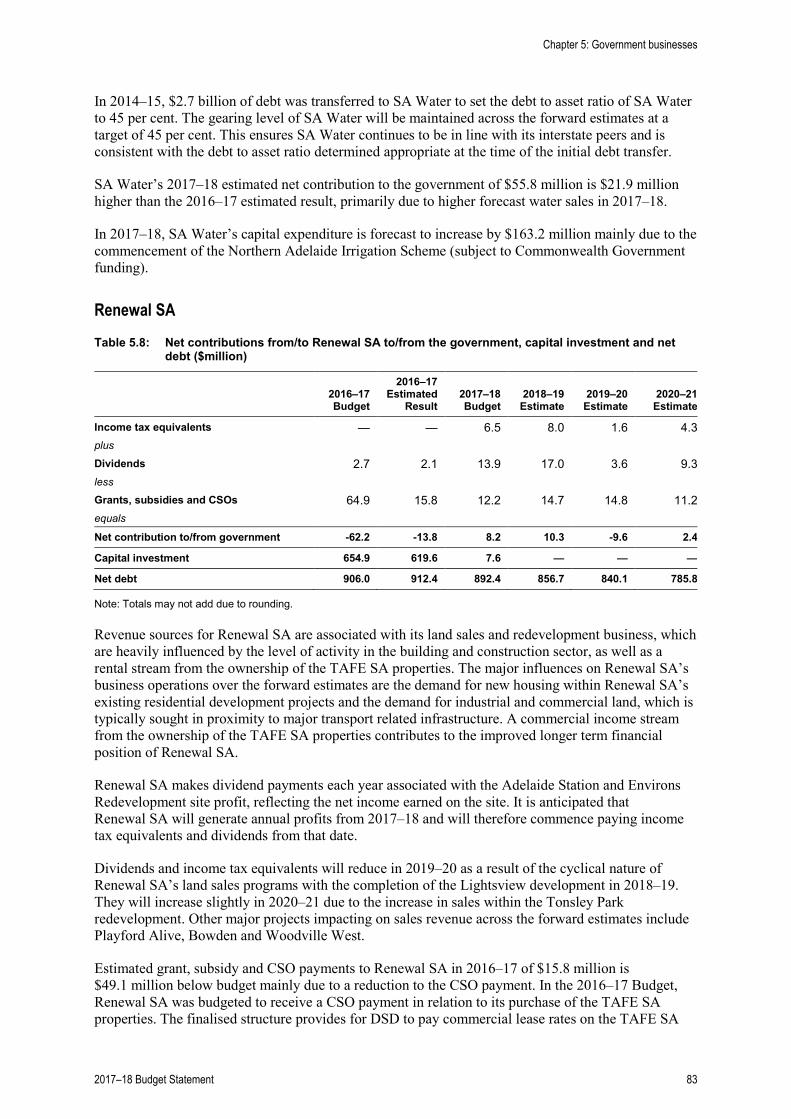
In 2014–15, $2.7 billion of debt was transferred to SA Water to set the debt to asset ratio of SA Water to 45 per cent. The gearing level of SA Water will be maintained across the forward estimates at a target of 45 per cent. This ensures SA Water continues to be in line with its interstate peers and is consistent with the debt to asset ratio determined appropriate at the time of the initial debt transfer.
SA Water’s 2017–18 estimated net contribution to the government of $55.8 million is $21.9 million higher than the 2016–17 estimated result, primarily due to higher forecast water sales in 2017–18.
In 2017–18, SA Water’s capital expenditure is forecast to increase by $163.2 million mainly due to the commencement of the Northern Adelaide Irrigation Scheme (subject to Commonwealth Government funding).
Renewal SA
Table 5.8: Net contributions from/to Renewal SA to/from the government, capital investment and net debt ($million)
2016–17 Budget
2016–17 Estimated
Result 2017–18 Budget
2018–19 Estimate
2019–20 Estimate
2020–21 Estimate
Income tax equivalents — — 6.5 8.0 1.6 4.3 plus Dividends 2.7 2.1 13.9 17.0 3.6 9.3 less Grants, subsidies and CSOs 64.9 15.8 12.2 14.7 14.8 11.2 equals Net contribution to/from government -62.2 -13.8 8.2 10.3 -9.6 2.4
Capital investment 654.9 619.6 7.6 — — —
Net debt 906.0 912.4 892.4 856.7 840.1 785.8
Note: Totals may not add due to rounding.
Revenue sources for Renewal SA are associated with its land sales and redevelopment business, which are heavily influenced by the level of activity in the building and construction sector, as well as a rental stream from the ownership of the TAFE SA properties. The major influences on Renewal SA’s business operations over the forward estimates are the demand for new housing within Renewal SA’s existing residential development projects and the demand for industrial and commercial land, which is typically sought in proximity to major transport related infrastructure. A commercial income stream from the ownership of the TAFE SA properties contributes to the improved longer term financial position of Renewal SA.
Renewal SA makes dividend payments each year associated with the Adelaide Station and Environs Redevelopment site profit, reflecting the net income earned on the site. It is anticipated that Renewal SA will generate annual profits from 2017–18 and will therefore commence paying income tax equivalents and dividends from that date.
Dividends and income tax equivalents will reduce in 2019–20 as a result of the cyclical nature of Renewal SA’s land sales programs with the completion of the Lightsview development in 2018–19. They will increase slightly in 2020–21 due to the increase in sales within the Tonsley Park redevelopment. Other major projects impacting on sales revenue across the forward estimates include Playford Alive, Bowden and Woodville West.
Estimated grant, subsidy and CSO payments to Renewal SA in 2016–17 of $15.8 million is $49.1 million below budget mainly due to a reduction to the CSO payment. In the 2016–17 Budget, Renewal SA was budgeted to receive a CSO payment in relation to its purchase of the TAFE SA properties. The finalised structure provides for DSD to pay commercial lease rates on the TAFE SA
Chapter 5: Government businesses
2017–18 Budget Statement 83
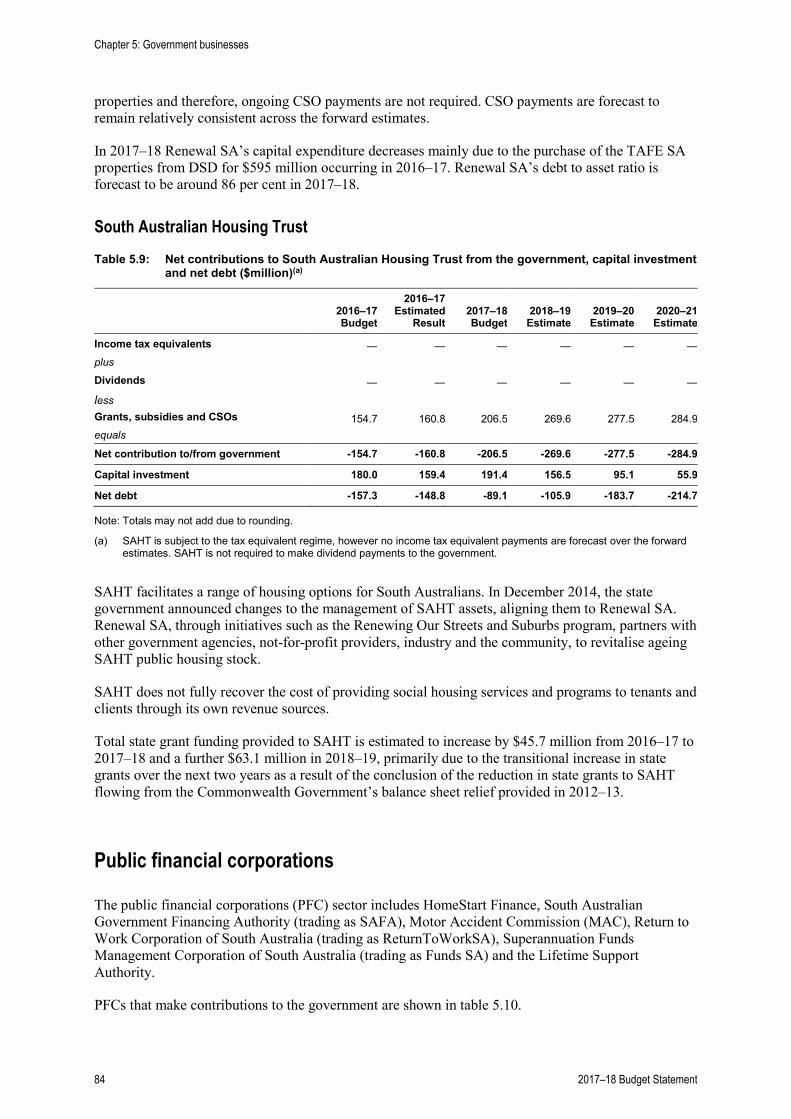
properties and therefore, ongoing CSO payments are not required. CSO payments are forecast to remain relatively consistent across the forward estimates.
In 2017–18 Renewal SA’s capital expenditure decreases mainly due to the purchase of the TAFE SA properties from DSD for $595 million occurring in 2016–17. Renewal SA’s debt to asset ratio is forecast to be around 86 per cent in 2017–18.
South Australian Housing Trust
Table 5.9: Net contributions to South Australian Housing Trust from the government, capital investment and net debt ($million)(a)
2016–17 Budget
2016–17 Estimated
Result 2017–18 Budget
2018–19 Estimate
2019–20 Estimate
2020–21 Estimate
Income tax equivalents — — — — — — plus Dividends — — — — — — less Grants, subsidies and CSOs 154.7 160.8 206.5 269.6 277.5 284.9 equals
Net contribution to/from government -154.7 -160.8 -206.5 -269.6 -277.5 -284.9
Capital investment 180.0 159.4 191.4 156.5 95.1 55.9
Net debt -157.3 -148.8 -89.1 -105.9 -183.7 -214.7
Note: Totals may not add due to rounding.
(a) SAHT is subject to the tax equivalent regime, however no income tax equivalent payments are forecast over the forward estimates. SAHT is not required to make dividend payments to the government.
SAHT facilitates a range of housing options for South Australians. In December 2014, the state government announced changes to the management of SAHT assets, aligning them to Renewal SA. Renewal SA, through initiatives such as the Renewing Our Streets and Suburbs program, partners with other government agencies, not-for-profit providers, industry and the community, to revitalise ageing SAHT public housing stock.
SAHT does not fully recover the cost of providing social housing services and programs to tenants and clients through its own revenue sources.
Total state grant funding provided to SAHT is estimated to increase by $45.7 million from 2016–17 to 2017–18 and a further $63.1 million in 2018–19, primarily due to the transitional increase in state grants over the next two years as a result of the conclusion of the reduction in state grants to SAHT flowing from the Commonwealth Government’s balance sheet relief provided in 2012–13.
Public financial corporations
The public financial corporations (PFC) sector includes HomeStart Finance, South Australian Government Financing Authority (trading as SAFA), Motor Accident Commission (MAC), Return to Work Corporation of South Australia (trading as ReturnToWorkSA), Superannuation Funds Management Corporation of South Australia (trading as Funds SA) and the Lifetime Support Authority.
PFCs that make contributions to the government are shown in table 5.10.
Chapter 5: Government businesses
84 2017–18 Budget Statement

Table 5.10: Net contributions from public financial corporations to the government ($million)
2016–17 Budget
2016–17 Estimated
Result 2017–18 Budget
2018–19 Estimate
2019–20 Estimate
2020–21 Estimate
Income tax equivalents HomeStart Finance 4.9 5.1 4.7 5.4 5.8 5.8 Motor Accident Commission — — — — — — Return to Work Corporation of South Australia — 86.3 — — — —
South Australian Government Financing Authority 10.7 16.9 10.4 10.4 10.4 10.4
Total income tax equivalents 15.6 108.2 15.0 15.8 16.1 16.1
plus Dividends HomeStart Finance 6.8 7.1 6.5 7.6 8.1 8.1 Motor Accident Commission 105.8 297.8 321.7 128.4 34.2 — Return to Work Corporation of South Australia — — — — — — South Australian Government Financing Authority 13.1 23.1 15.7 14.2 15.5 17.2
Total dividends 125.7 328.0 343.9 150.2 57.7 25.3
less CSOs HomeStart Finance 6.2 6.2 6.6 6.9 7.3 7.6 Motor Accident Commission — — — — — — Return to Work Corporation of South Australia — — — — — — South Australian Government Financing Authority — — — — — —
Total CSOs 6.2 6.2 6.6 6.9 7.3 7.6
equals Net contribution to/from government(a)
HomeStart Finance 5.4 5.9 4.6 6.1 6.5 6.2 Motor Accident Commission 105.8 297.8 321.7 128.4 34.2 — Return to Work Corporation of South Australia — 86.3 — — — — South Australian Government Financing Authority 23.8 39.9 26.1 24.6 25.9 27.6
Total net contribution to/from government(a) 135.0 429.9 352.4 159.1 66.6 33.8
Note: Totals may not add due to rounding.
(a) Net contribution to/from the government comprises income tax equivalents plus dividends less grants, subsidies and CSOs. Positive indicates net contribution to government while negative indicates net contribution from government.
Distributions from SAFA are estimated to be $16.1 million above budget in 2016–17 reflecting higher than budgeted dividends and income tax equivalent payments arising from SAFA’s treasury, fleet and insurance operations.
ReturnToWorkSA is forecast to make a profit in 2016–17 and has announced that the average premium rate levied on employers will reduce from 1.95 per cent in 2016–17 to 1.8 per cent in 2017–18, delivering a $40 million per annum benefit to employers through reduced premiums in 2017–18. This follows the reduction from 1 July 2016 which provided a total benefit to employers of $180 million per annum. The two premium rate reductions deliver an ongoing benefit to employers of $220 million per annum. While ReturnToWorkSA does not pay a dividend to the government, it is required to make an income tax equivalent payment on profits under the Public Corporations Act 1993. In 2016–17, ReturnToWorkSA is estimating to make an income tax equivalent payment of $86.3 million.
Chapter 5: Government businesses
2017–18 Budget Statement 85
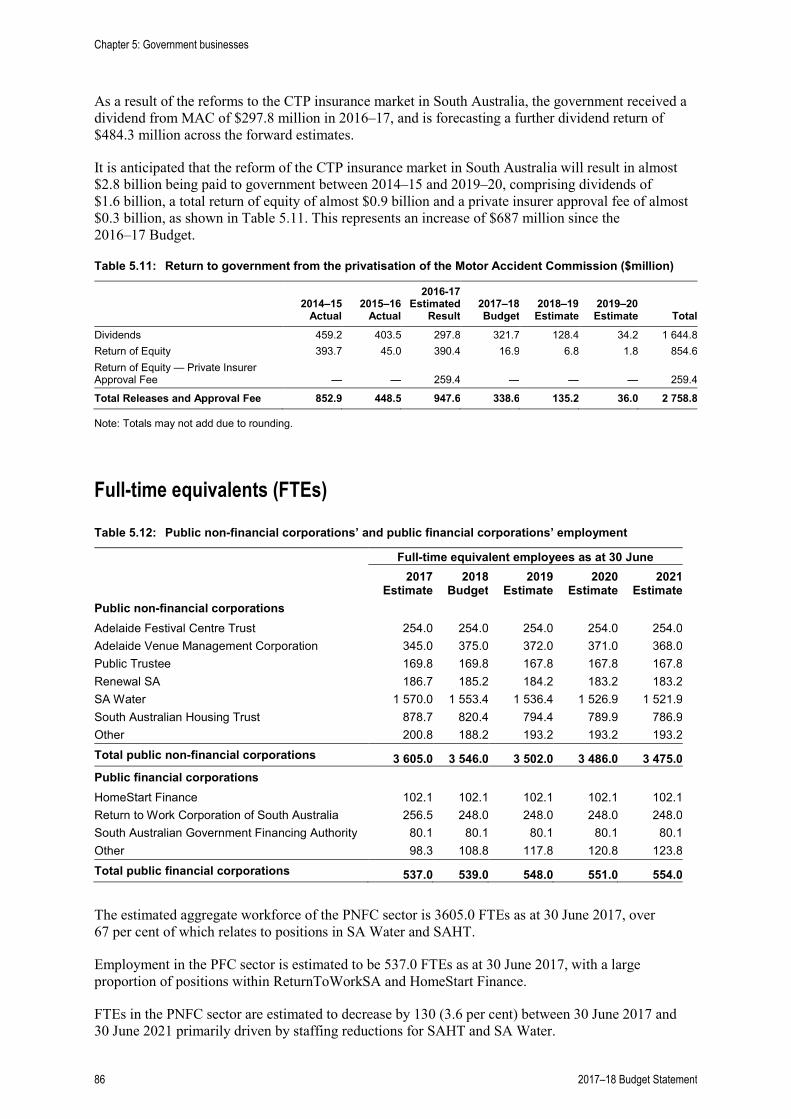
As a result of the reforms to the CTP insurance market in South Australia, the government received a dividend from MAC of $297.8 million in 2016–17, and is forecasting a further dividend return of $484.3 million across the forward estimates.
It is anticipated that the reform of the CTP insurance market in South Australia will result in almost $2.8 billion being paid to government between 2014–15 and 2019–20, comprising dividends of $1.6 billion, a total return of equity of almost $0.9 billion and a private insurer approval fee of almost $0.3 billion, as shown in Table 5.11. This represents an increase of $687 million since the 2016–17 Budget.
Table 5.11: Return to government from the privatisation of the Motor Accident Commission ($million)
2014–15
Actual 2015–16
Actual
2016-17 Estimated
Result 2017–18 Budget
2018–19 Estimate
2019–20 Estimate Total
Dividends 459.2 403.5 297.8 321.7 128.4 34.2 1 644.8 Return of Equity 393.7 45.0 390.4 16.9 6.8 1.8 854.6 Return of Equity — Private Insurer Approval Fee — — 259.4 — — — 259.4
Total Releases and Approval Fee 852.9 448.5 947.6 338.6 135.2 36.0 2 758.8
Note: Totals may not add due to rounding.
Full-time equivalents (FTEs)
Table 5.12: Public non-financial corporations’ and public financial corporations’ employment
Full-time equivalent employees as at 30 June 2017
Estimate 2018
Budget 2019
Estimate 2020
Estimate 2021
Estimate Public non-financial corporations Adelaide Festival Centre Trust 254.0 254.0 254.0 254.0 254.0 Adelaide Venue Management Corporation 345.0 375.0 372.0 371.0 368.0 Public Trustee 169.8 169.8 167.8 167.8 167.8 Renewal SA 186.7 185.2 184.2 183.2 183.2 SA Water 1 570.0 1 553.4 1 536.4 1 526.9 1 521.9 South Australian Housing Trust 878.7 820.4 794.4 789.9 786.9 Other 200.8 188.2 193.2 193.2 193.2 Total public non-financial corporations 3 605.0 3 546.0 3 502.0 3 486.0 3 475.0 Public financial corporations HomeStart Finance 102.1 102.1 102.1 102.1 102.1 Return to Work Corporation of South Australia 256.5 248.0 248.0 248.0 248.0 South Australian Government Financing Authority 80.1 80.1 80.1 80.1 80.1 Other 98.3 108.8 117.8 120.8 123.8 Total public financial corporations 537.0 539.0 548.0 551.0 554.0
The estimated aggregate workforce of the PNFC sector is 3605.0 FTEs as at 30 June 2017, over 67 per cent of which relates to positions in SA Water and SAHT.
Employment in the PFC sector is estimated to be 537.0 FTEs as at 30 June 2017, with a large proportion of positions within ReturnToWorkSA and HomeStart Finance.
FTEs in the PNFC sector are estimated to decrease by 130 (3.6 per cent) between 30 June 2017 and 30 June 2021 primarily driven by staffing reductions for SAHT and SA Water.
Chapter 5: Government businesses
86 2017–18 Budget Statement
Chapter 6: Risk statement
Overview
This chapter outlines the major financial risks that could affect the fiscal outlook set out in the 2017−18 Budget and identifies measures the government has adopted to manage these risks. The risks are summarised in three main sections — risks to revenue, risks to expenditure, and contingent liabilities.
Budget estimates are made on assumptions and judgements formed in the context of information available at the time of their preparation. In practice, both revenues and expenses will be subject to variation from the estimates contained in the budget, and the size of the potential variation typically increases over the forward estimates period.
Financial risks arise from general developments or from specific events that affect the fiscal outlook. They may be positive or negative, and they may not necessarily be within the government’s control. Examples include fluctuations in economic activity and financial markets, changes to demand for government services, and changes in Commonwealth Government funding and policy.
The budget estimates include allowances to help manage potential financial risks. For example, allowances are made for wage and salary outcomes and capital expenditure contingency provisions. In addition, some sources of risk to the fiscal outlook can, to a certain extent, be managed through established risk management practices such as hedging and insurance.
Revenue risks
Taxation, grants, royalties and fines
State taxation revenues are exposed to variations and fluctuations in both the volume and value of activities that are subject to taxation. Broadly based taxes such as payroll tax are influenced by general economic trends, whereas more narrowly based taxes are impacted by particular segments of economic activity. Price and activity trends in the property market generally have a greater impact on the short-term volatility of state taxation revenues than the broader economy because of the significant share of revenues derived from property-based transactional taxes such as stamp duty.
Fluctuations in economic activity within the state increase the risk of state taxation revenues exceeding or falling short of budget forecasts, particularly at turning points in the economic cycle. The performance of the national economy is also a key driver of state government revenues. The pool of GST revenue grants allocated to the states and territories is directly influenced by national trends in consumer spending and housing construction, as well as population growth in each jurisdiction.
Furthermore, South Australia’s share of GST revenue grants is influenced, in part, by the state’s relative taxation revenue capacity. Under the horizontal fiscal equalisation (HFE) system, if South Australia’s taxation revenues are constrained relative to other states and territories as a result of economic conditions, the HFE process will provide South Australia with a higher share of GST revenues. This means that in the medium to longer term, total South Australian revenues (the combination of GST revenue grants and own-source revenues) are primarily driven by the national
2017–18 Budget Statement 87
economy. However, the HFE process operates with a lag and therefore fluctuations in state economic activity do have a greater short-term impact on overall revenues.
Specific economic-related risk factors include that:
• weaker international and national economic environments could reduce the demand for South Australian goods and services, with consequent impacts on investment and activity more broadly. The International Monetary Fund World Economic Outlook (April) suggested that while the immediate global outlook is positive, the risks are weighted to the downside. International economic factors that can impact South Australia include:
– commodity prices (oil, iron ore and coal) have recovered significantly since bottoming in 2016, supporting an increase in national income tax receipts, but there is risk around the sustainability of the current prices
– increasing trade protection, geopolitical tension, international debt levels and global financial market instability could all be triggers for a reversal in global market sentiment and confidence impacting demand for Australian exports
– there are continued concerns around the smoothness of the transition of the Chinese economy away from investment-based growth (largely credit driven) to consumption and services based growth. China is the state’s most significant export market
– faster than expected interest rate rises in the United States of America could result in a more rapid tightening in global financial conditions and a sharp appreciation in the United States dollar, which would subsequently reduce the state’s competitiveness in international markets.
Within South Australia:
• the closure of the automotive manufacturing industry in October and uncertainty around the Arrium operation at Whyalla present a risk to consumer and business confidence and levels of investment, consumption and employment
• agricultural output, which has been very strong in recent years, is subject to significant climate variability.
State taxation
Specific revenue risk areas for state tax collections are discussed below.
Payroll tax
Payroll tax tends to be influenced by broad economic trends, particularly employment, hours worked and wages growth.
There is a risk that employment or wages growth will be lower than forecast which would flow through as a reduction in payroll tax revenue. In addition, there are risks to revenue estimates associated with the composition of employment growth between firms that are subject to payroll tax and those that are not. Historically these compositional factors have had a positive impact on payroll tax growth, but in recent times they have had negative impacts.
Impact: A 1.0 per cent change in taxable payrolls equates to about $12 million in payroll tax revenue.
Property taxes
Conveyance duty revenue is exposed to local variations in the property market. Trends in property market values and activity levels can be difficult to predict particularly transaction numbers which can change significantly from one year to the next. Forward projections of conveyance duty revenue assume that underlying property market transactions will return to long term trend levels over the medium term.
Chapter 6: Risk statement
88 2017–18 Budget Statement
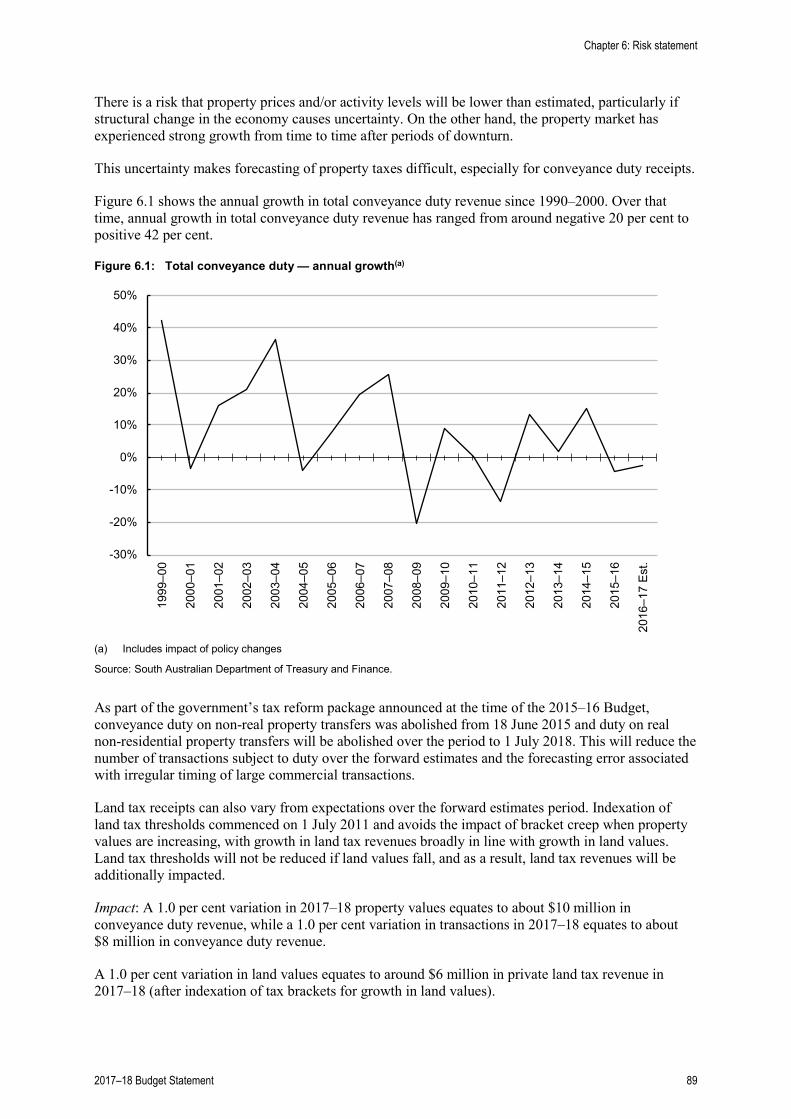
There is a risk that property prices and/or activity levels will be lower than estimated, particularly if structural change in the economy causes uncertainty. On the other hand, the property market has experienced strong growth from time to time after periods of downturn.
This uncertainty makes forecasting of property taxes difficult, especially for conveyance duty receipts.
Figure 6.1 shows the annual growth in total conveyance duty revenue since 1990–2000. Over that time, annual growth in total conveyance duty revenue has ranged from around negative 20 per cent to positive 42 per cent.
Figure 6.1: Total conveyance duty — annual growth(a)
-30%
-20%
-10%
0%
10%
20%
30%
40%
50%
1999
–00
2000
–01
2001
–02
2002
–03
2003
–04
2004
–05
2005
–06
2006
–07
2007
–08
2008
–09
2009
–10
2010
–11
2011
–12
2012
–13
2013
–14
2014
–15
2015
–16
2016
–17
Est.
(a) Includes impact of policy changes
Source: South Australian Department of Treasury and Finance.
As part of the government’s tax reform package announced at the time of the 2015–16 Budget, conveyance duty on non-real property transfers was abolished from 18 June 2015 and duty on real non-residential property transfers will be abolished over the period to 1 July 2018. This will reduce the number of transactions subject to duty over the forward estimates and the forecasting error associated with irregular timing of large commercial transactions.
Land tax receipts can also vary from expectations over the forward estimates period. Indexation of land tax thresholds commenced on 1 July 2011 and avoids the impact of bracket creep when property values are increasing, with growth in land tax revenues broadly in line with growth in land values. Land tax thresholds will not be reduced if land values fall, and as a result, land tax revenues will be additionally impacted.
Impact: A 1.0 per cent variation in 2017–18 property values equates to about $10 million in conveyance duty revenue, while a 1.0 per cent variation in transactions in 2017–18 equates to about $8 million in conveyance duty revenue.
A 1.0 per cent variation in land values equates to around $6 million in private land tax revenue in 2017–18 (after indexation of tax brackets for growth in land values).
Chapter 6: Risk statement
2017–18 Budget Statement 89
Gaming machine revenue
There are a number of risks to gaming machine tax revenue collections.
Discretionary spending levels are influenced by a range of factors, including growth in wages and incomes, debt servicing levels, the cost of essential items and perceived future spending needs. Regulatory reforms such as harm minimisation measures can also impact on gaming machine taxation revenue collections.
In recent years growth in gambling has been lower than expected. Accordingly, underlying gaming machine expenditure is expected to grow only modestly over the forward estimates. The growth projection is, however, vulnerable to household budget shocks, for example increases in interest rates and petrol prices as well as increases in key basic living charges.
Impact: A variance of 1.0 per cent in hotel and club gaming machine expenditure equates to around $3 million in gambling tax revenue.
Insurance duty
Insurance premiums can vary significantly over time depending on the capacity of the market and can sometimes be affected by major insurable events around the world. Events such as the natural disasters in Australia and offshore may affect the level and type of insurance taken out by policy holders, as well as the price of insurance premiums. In recent years underlying growth in insurance tax receipts has been largely in line with expectations.
Impact: A variance of 1.0 per cent in premium levels equates to around $4 million in insurance duty.
Royalties
Mining and petroleum royalty revenue is exposed to external economic conditions. In particular, royalties are affected by exchange rates and changes in international prices particularly for oil, copper, iron ore, uranium and gold. Royalties can also be affected by changes to production levels, including the impact from natural occurrences (e.g. floods), unanticipated mine closures, unplanned operational incidents such as plant fires and failures as well as other unforeseen events.
There is potential for growth in royalty revenue from new mines. The timing of these additional royalty streams is dependent on the timing of discoveries, global economic conditions as well as the time required for development approvals and to develop new mine sites to an operational level. Royalty revenue does not flow until commercial production commences.
Variations in royalty revenues arising from the royalty base (production and price levels) are substantially offset over time by consequent variations in the share of Commonwealth Government GST revenue grants received by South Australia through the HFE process.
Impact: Excluding HFE impacts, a 1.0 cent change in the US dollar/Australian dollar exchange rate has a direct revenue impact of about $3 million on royalty revenue. A 1.0 per cent change in international prices for copper, iron ore, uranium, gold, oil and petroleum liquids has a direct revenue impact of about $3 million.
Traffic infringement fines
Revenue collected from traffic infringement fines is sensitive to changes in driver behaviour patterns and the number of speed detection devices (red light/speed cameras) in operation.
Impact: A variance of 1.0 per cent in the number of traffic infringement notices equates to around $1 million per annum in fines revenue.
Chapter 6: Risk statement
90 2017–18 Budget Statement
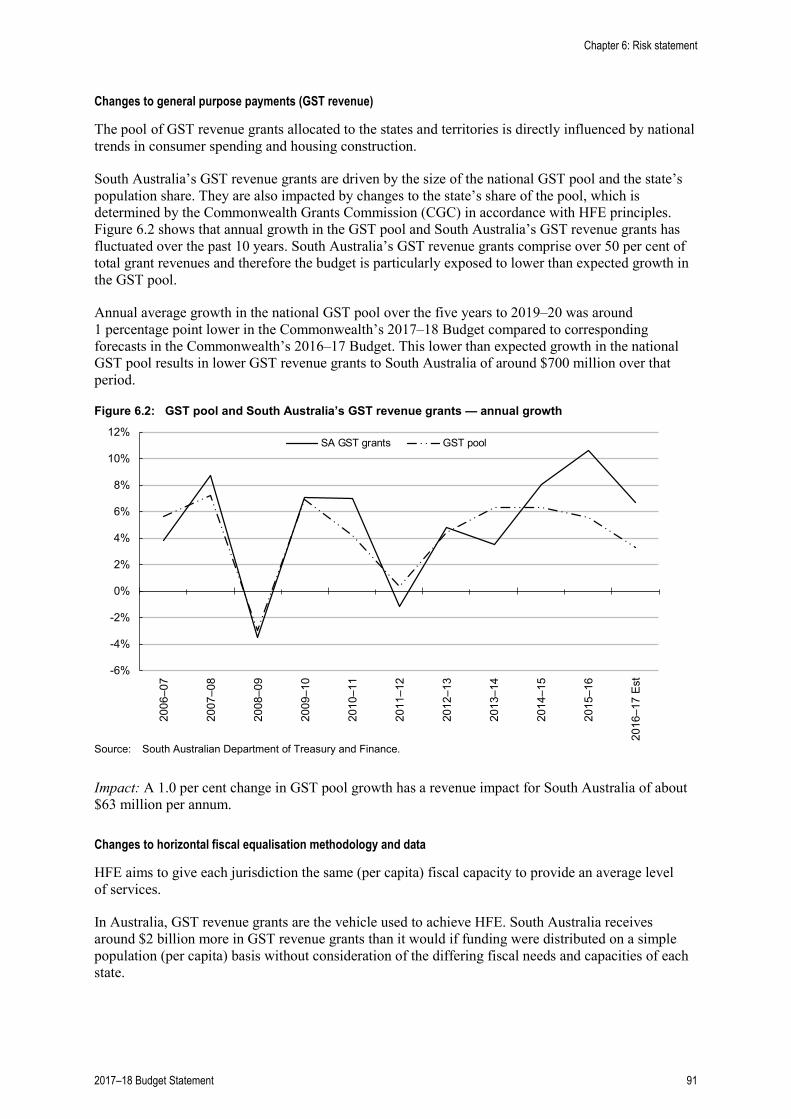
Changes to general purpose payments (GST revenue)
The pool of GST revenue grants allocated to the states and territories is directly influenced by national trends in consumer spending and housing construction.
South Australia’s GST revenue grants are driven by the size of the national GST pool and the state’s population share. They are also impacted by changes to the state’s share of the pool, which is determined by the Commonwealth Grants Commission (CGC) in accordance with HFE principles. Figure 6.2 shows that annual growth in the GST pool and South Australia’s GST revenue grants has fluctuated over the past 10 years. South Australia’s GST revenue grants comprise over 50 per cent of total grant revenues and therefore the budget is particularly exposed to lower than expected growth in the GST pool.
Annual average growth in the national GST pool over the five years to 2019–20 was around 1 percentage point lower in the Commonwealth’s 2017–18 Budget compared to corresponding forecasts in the Commonwealth’s 2016–17 Budget. This lower than expected growth in the national GST pool results in lower GST revenue grants to South Australia of around $700 million over that period.
Figure 6.2: GST pool and South Australia’s GST revenue grants — annual growth
-6%
-4%
-2%
0%
2%
4%
6%
8%
10%
12%
2006
–07
2007
–08
2008
–09
2009
–10
2010
–11
2011
–12
2012
–13
2013
–14
2014
–15
2015
–16
2016
–17
Est
SA GST grants GST pool
Source: South Australian Department of Treasury and Finance.
Impact: A 1.0 per cent change in GST pool growth has a revenue impact for South Australia of about $63 million per annum.
Changes to horizontal fiscal equalisation methodology and data
HFE aims to give each jurisdiction the same (per capita) fiscal capacity to provide an average level of services.
In Australia, GST revenue grants are the vehicle used to achieve HFE. South Australia receives around $2 billion more in GST revenue grants than it would if funding were distributed on a simple population (per capita) basis without consideration of the differing fiscal needs and capacities of each state.
Chapter 6: Risk statement
2017–18 Budget Statement 91
Accordingly, changes to the methodology and data underlying the HFE process, determined by the CGC, have the potential to significantly impact (both positively and negatively) on the state’s revenue base and budget position.
Approximately every five years the CGC reviews the methodology it uses to distribute GST revenue grants in order to achieve HFE. The last methodology review was conducted in April 2015 and the next methodology review, which has now commenced, will conclude in February 2020.
In each annual update of relativities, the CGC updates its assessment for the latest available social, demographic and economic data. While the CGC’s desire to improve data and data sources wherever possible is appropriate, this can lead to changes in annual relativities.
State relativities can vary significantly between annual updates, reflecting factors such as fluctuations in the value of mining output, variations in Commonwealth Government payments between states and differential growth rates in conveyance duty receipts.
In addition to the CGC’s methodology review, the Commonwealth Treasurer has directed the Productivity Commission to undertake an inquiry into Australia’s system of HFE (the Inquiry). The Inquiry will examine current HFE arrangements in Australia, consider the economic efficiency impacts of current HFE arrangements, the contemporaneity of the CGC’s assessment process and whether HFE creates disincentives for economic development.
The Inquiry may recommend changes to the current HFE arrangements in Australia which, if implemented, could result in either negative or positive impacts on GST revenue grants to South Australia.
South Australia will make submissions to the Inquiry highlighting the importance of maintaining a system of full equalisation in Australia.
The Productivity Commission is required to produce a final report by 31 January 2018.
Impact: A 0.01 change in South Australia’s relativity (from the 2017 update relativity of 1.43997) would result in a change in GST revenue grants of about $44 million.
Specific purpose and National Partnership payments
Commonwealth-state funding arrangements are governed by the Intergovernmental Agreement on Federal Financial Relations (the IGA) agreed to by the Council of Australian Governments (COAG) in December 2008. The IGA provides for a small number of ongoing national-specific purpose payments (SPPs) for housing, skills development and disability services; National Health Reform funding and Quality Schools funding. In addition, National Partnership payments (NPPs) are paid to states to support delivery of specified projects or to facilitate or reward the implementation of reforms of national importance.
In the 2017–18 Commonwealth Budget the Commonwealth Government announced an extension of the needs-based (Gonski) funding over the period 2018 to 2027. Although this will provide an increase in funding to schools, it does not restore funding to levels in place prior to the 2014–15 Commonwealth Budget.
The Commonwealth Government has also announced that it will combine the existing National Affordable Housing Agreement with the National Partnership on Homelessness to create a new National Affordable Housing and Homelessness Agreement. While the funding levels are expected to be relatively unchanged the Commonwealth Government has indicated that it will seek to change the performance benchmarks for the agreement from 2018–19.
Chapter 6: Risk statement
92 2017–18 Budget Statement
Impact: SPPs and NPPs from the Commonwealth Government account for about 22 per cent of state government revenues. Variations in their level or the conditions applying to these payments impact the budget.
Changes in profitability of government businesses
As part of their day-to-day operations, government business enterprises — comprising public non-financial corporations (PNFCs) such as SA Water and Renewal SA and public financial corporations (PFCs) such as the South Australian Government Financing Authority (SAFA) — manage a range of commercial risks. Risks that adversely impact upon a government business may affect its ability to pay dividends and make tax equivalent payments, thereby impacting on the financial position of the general government sector.
Impact: A 1.0 per cent fall in total contributions in 2017–18 to the general government sector from PNFCs and PFCs would have a $5.9 million impact on the budget.
Expenditure risks
Hospital expenditure growth
Hospital expenditure is a significant component of the budget and growth can therefore have a substantial impact on the budget.
The government is implementing a number of strategies to manage the expenditure growth in hospitals, including ensuring services and infrastructure are provided in the most efficient manner to deliver quality health outcomes and productivity improvements. Changes to Commonwealth funding for health also significantly impact on the state government’s capacity to provide resources to the health system.
The new Royal Adelaide Hospital will open in 2017–18. In other instances interstate where a new facility has opened to the public, there has been an initial period where emergency department presentations increase, as people use their discretion and choose to attend the new hospital in favour of other hospitals. This may lead to pressures on the emergency department and additional activity at the new Royal Adelaide Hospital generally. This would likely represent a diversion of activity from other public hospitals to the new Royal Adelaide Hospital, but there are risks of additional costs to the health system overall should this occur and resources not able to be managed and re-directed appropriately with this activity.
Impact: A 1.0 per cent growth in hospital expenditure above the level incorporated in the 2017−18 Budget would increase expenditure by approximately $53 million per annum.
Student enrolment numbers
The budget includes a best estimate of expected movements in the number of student enrolments. To the extent that actual enrolment numbers vary from those estimates there will be an impact on the state’s financial position. Enrolments are impacted by growth in the school age population as well as shifts between government and private education.
Impact: A 1.0 per cent growth in government school enrolment numbers above the levels incorporated in the 2017−18 Budget would increase expenditure by approximately $20 million per annum.
Chapter 6: Risk statement
2017–18 Budget Statement 93
Growth in children in care
The budget includes provisions for resourcing requirements of children in state care, including home-based, community residential and emergency care accommodation. The costs associated with children in care can be impacted by both growth in the number of children entering the child protection system as well as the type of care provided to children. Resources required for the residential and emergency care accommodation are significantly higher per child than home-based foster and kinship care.
Impact: Depending on the mix of care types, a 1.0 per cent growth in children in out-of-home care above the levels incorporated in the 2017−18 Budget would increase expenditure by approximately $3.6 million per annum.
Disability
The cost of state disability support is increasing in real terms. This is due to a number of factors including growth and ageing of the potential client population, medical advances and a general drift from home care to state care in part due to the ageing of carers. If the increase in services is higher than forecast there will be an impact on the budget.
For clients who have transitioned to the National Disability Insurance Scheme (NDIS), above-projected growth in costs under the agreed phasing arrangements will be fully funded by the Commonwealth Government. From 2018–19 the state is scheduled to fully implement NDIS and any growth in costs above the state’s fixed contribution to the scheme will be met by the Commonwealth Government. This is subject to a Productivity Commission review in 2017 and COAG consideration of the findings, with the Commonwealth Government committing to meeting a minimum of 75 per cent of cost risk.
The NDIS is a substantial policy change from how disability services have historically been funded and delivered. Disability service providers, including government owned disability service providers will need to review their business models to ensure services meet NDIS requirements and reform their service offerings as required. There are a range of issues that need to be resolved as part of transition to the full scheme NDIS arrangements, including scope of services provided by the NDIS. Costs arising during the transition period for implementing the significant NDIS reforms will require careful management.
Impact: Depending on the mix of client needs, a 1.0 per cent growth in client costs above the level incorporated in the 2017–18 Budget would increase expenditure by approximately $3.9 million in 2017–18, noting that this takes into account the state’s scheduled transition to the NDIS in 2017-18, with the state in full NDIS from 2018–19.
Increases in wages and salaries
Enterprise agreements are in place for major workforce groups for the relevant terms of each agreement, with all associated costs included in the 2017−18 Budget.
In 2017–18 enterprise bargaining negotiations will occur for Wages Parity Groups (salaried and weekly paid), Visiting Medical Specialists, Salaried Medical Officers, Clinical Academics, Firefighters, the Rail Commissioner’s Tram employees and School and Preschool staff.
The government has set its wages policy to limit wage growth to 1.5 per cent per annum over the next three years of each enterprise agreement. The outcomes of future wage negotiations will be crucial in determining whether expenditure forward estimates in this budget can be achieved and the level of government services that can be delivered in light of the current challenging economic conditions.
Chapter 6: Risk statement
94 2017–18 Budget Statement
Allowances in the forward estimates for enterprise bargaining outcomes cover both salary and non-salary outcomes.
Impact: If public sector-wide wage outcomes for new enterprise agreements vary by 1.0 per cent per annum from allowances in the forward estimates, the budget impact is estimated to be around $220 million in 2020−21.
Delivery of savings and revenue measures
Since the 2010–11 Budget the government has implemented significant savings measures each year. The large specific savings measures have been substantially delivered and consequently there is a lower level of risk surrounding the delivery of savings measures than was the case in previous budgets.
The majority of ongoing savings for agencies relate to a continuation of the existing efficiency dividend policy of 1.0 per cent of the agency employee expenses budget per annum and a 1.0 per cent reduction in their net cost of services per annum. The policy applies to the majority of general government agencies and allows the flexibility to tailor savings to their particular operating structures to ensure more efficient ways of conducting business are pursued, without reducing the quality or level of services provided. Agencies will be required to continue to find expenditure efficiencies to deliver these savings.
Interest rates
Changes in interest rates affect the budget position of all sectors through changes in interest payments.
Impact: A 1.0 percentage point move in the average interest rate applying to general government sector net debt would change net interest expense by approximately $61 million in 2017−18 rising to $67 million in 2020−21.
A 1.0 percentage point move in interest rates applying to the PNFC sector would change their net interest expense which would affect contributions received by the general government sector from PNFCs by approximately $79 million in 2017−18.
Increase in Consumer Price Index (CPI)
Higher inflation may impact on the prices paid by government agencies for goods and services. The government’s indexation policy provides for standard indexation of supplies and services expenditure in line with projections in the CPI. Agencies are required to absorb a cost increase from within existing budget allocations, unless the specific price increase has resulted in a material effect on the agency budget. The materiality test applied is that the price change experienced has altered agency costs by more than 0.5 percentage points above or below the standard indexation provided for in agency budgets.
Impact: Not quantifiable.
Fluctuation in foreign exchange rates
Treasurer’s Instruction 23 ‘Management of Foreign Currency Exposures’ requires public authorities to recognise and control foreign exchange risks associated with the purchase of imported goods and services. Public authorities are required to obtain forward cover for the acquisition of goods and services that are expected to give rise to a foreign currency exposure exceeding $250 000. This limits potential foreign exchange risks faced by the government once acquisition decisions are made.
Chapter 6: Risk statement
2017–18 Budget Statement 95
Impact: Foreign exchange rates could have an impact on the costs of agencies that source capital equipment, supplies and services from overseas. This includes items such as pharmaceuticals, transport equipment and the operations of overseas offices.
Capital investment
Project estimates include prudent allowances for cost escalations. Large capital programs increase the risk of additional costs.
Impact: If cost escalations exceed the allowances included in the investment program, there will be a negative impact on annual net lending outcomes. A 1.0 per cent increase in costs for the general government investment program would increase capital expenditure by approximately $22.2 million in 2017−18.
Superannuation liabilities and expenses
For defined benefit scheme superannuation liabilities (pension or defined benefit lump sum schemes), the budget is exposed to factors affecting the value of the unfunded liability. These factors include:
• volatility in the expected returns on investment funds and the risk-free discount rate
• changes in actuarial assumptions relating to future benefit payments
The unfunded superannuation liability is the state’s biggest financial liability.
Impact: Volatility in asset markets poses a risk to the budget. A 1.0 percentage point lower than expected return on superannuation assets invested by Funds SA would increase estimated unfunded superannuation liabilities by around $64 million. An increase in unfunded superannuation liabilities of this magnitude would increase nominal superannuation interest expenses, decreasing the net operating balance by around $2 million per annum.
A fall in the Commonwealth Government bond rate between valuation dates will lead to the use of a lower discount rate for valuation purposes, resulting in an increase in the value of the unfunded liability. A 1.0 percentage point reduction in the discount rate would increase unfunded superannuation liabilities by $2.5 billion. However the impact on the budget net operating balance is the imputed interest on these unfunded liabilities, and the interest rate used to calculate this will also fall by 1.0 percentage point. The net effect on the budget would be an improvement of around $52 million per annum in the net operating balance. An increase in the discount rate of 1.0 percentage point would decrease unfunded superannuation liabilities by $2.1 billion and increase the imputed interest and reduce the net operating balance by $22 million.
Change in domestic and overseas share prices
Funds SA, ReturnToWorkSA, MAC and the insurance-related investments of SAFA are exposed to both domestic and international equity markets. Changes in domestic and overseas share prices impact on the investments of these entities.
Impact: A variation in domestic and overseas share prices will directly impact the budget through a change in earnings on superannuation assets. A change in the value of the financial investments of ReturnToWorkSA can impact the budget through the income tax equivalent payment received from ReturnToWorkSA.
A change in the value of SAFA’s financial investments may have a direct impact on the budget through a variation in SAFA’s dividend contributions.
Chapter 6: Risk statement
96 2017–18 Budget Statement
Insurance
Risks associated with insurance liabilities are managed by SAICORP, the insurance division of SAFA. The operations of SAICORP are described in Chapter 4.
Government motor vehicle fleet — residual value risk
The state government’s fleet operations transferred to SAFA from 1 July 2009. Accordingly, reductions in residual values of vehicles will be met by SAFA and will impact on government agencies over time through changes to the leasing rates charged by SAFA.
Any reductions in residual values of vehicles will be a risk exposure to SAFA and may impact on the budget through either an increase in lease rates or a reduction in SAFA’s dividend contributions.
Contingent liabilities
Contingent liabilities are liabilities, or possible liabilities, that have not been recognised in the government’s balance sheet because they:
• arise from past events, and will be confirmed only by the occurrence or non-occurrence of one or more uncertain future events not wholly within the control of the government, or
• are a present obligation that arises from past events but is not recognised because:
– it is not probable that there will be a cost or other financial impact for the government to settle the obligation, or
– the amount of the obligation cannot be measured with sufficient reliability.
Full details of the state’s material quantifiable and non-quantifiable contingent liabilities are included in the Consolidated Financial Report as at 30 June 2016.
The state’s quantifiable contingent liabilities are summarised in table 6.1.
Table 6.1: Contingent liabilities of the Government of South Australia to entities external to the public sector at 30 June ($million)
2015 2016 Guarantees 943 920 Nyrstar indemnity 291 291 Other 62 109 Total 1 296 1 320
Note: Totals may not add due to rounding.
Final whole of government data for 2016–17 will be published in the Consolidated Financial Report as at 30 June 2017.
The information below provides 30 June 2016 data for the major individual contingent liabilities.
Chapter 6: Risk statement
2017–18 Budget Statement 97
Summary of contingent liabilities and other exposures
Significant contingent liabilities and other specific exposures, both quantifiable and non-quantifiable, for the Government of South Australia include the following.
• Guarantee of Local Government Finance Authority loans and other liabilities ― pursuant to the Local Government Finance Authority Act 1983, liabilities incurred or assumed by the Local Government Finance Authority are guaranteed by the Treasurer.
Exposure: $665 million at 30 June 2016 (compared with $693 million at 30 June 2015).
• Osborne Cogeneration arrangements ― certain underlying exposures were retained as part of the former government’s sale of electricity assets.
Exposure: $150 million to $200 million at 30 June 2016 (unchanged from 30 June 2015).
• Electricity entities ― as part of the former government’s privatisation of the state’s electricity assets, the government provided certain specified undertakings to the lessees. In the extremely remote event that these undertakings are not enforceable and the leasing arrangements are terminated, the state is required to make specified payments to the lessees and would receive the associated electricity infrastructure assets in return.
Gross exposure: $1.4 billion at 30 June 2016 (compared with $1.5 billion at 30 June 2015).
• Alice Springs–Darwin Railway ― both the South Australian and Northern Territory governments guarantee the obligations of the AustralAsia Railway Corporation, the joint statutory authority that looks after the government’s interests in relation to the Alice Springs–Darwin Railway. The prospect of these contingent liabilities arising is considered to be highly remote.
Exposure: Not quantifiable (unchanged from 30 June 2015).
• Port Pirie smelter upgrade ― the Treasurer has agreed to indemnify the Export Finance and Insurance Corporation (EFIC), the Commonwealth Government’s export finance agency, for a guarantee of up to $291 million to external lenders to the Port Pirie Smelter Transformation Project being undertaken by Nyrstar.
Exposure: $291 million at 30 June 2016 (unchanged from 30 June 2015).
• Local Government Association (LGA) public liability fund — the Treasurer has indemnified the fund of the LGA Mutual Liability Scheme — a self-managed mutual fund for public liability insurance purposes of the local government sector in South Australia. Any losses that exceed the state government’s liability reinsurance program limits and the $50 million limit for liability risks not covered by the reinsurance program will be subject to separate negotiations between the LGA and the state government.
Exposure: $50 million at 30 June 2016 (unchanged from 30 June 2015).
• Residential bond guarantees — the Bond Guarantee Scheme provides a guarantee to private owners and/or real estate agents in regards to the bond payable by eligible private rental tenants. The South Australian Housing Trust (SAHT) ultimately pays for any bond claims made by owners/agents and the tenant becomes liable to the SAHT for any amount paid. The value of bond guarantees as at 30 June 2016 was $56 million with the value of claims made during 2015–16 at $8 million.
Exposure: $56 million at 30 June 2016 (compared with $50 million at 30 June 2015).
• Unlocking Capital for Jobs Program ― this program involves the Government of South Australia providing a partial guarantee for loans made by participating banks to South Australian small and medium enterprises that have expansion or transformation plans and have satisfied the participating bank’s normal lending criteria other than the provision of sufficient collateral as security for the loan.
Exposure: $3.5 million at 30 June 2016 out of the $50 million program limit (unchanged from 30 June 2015).
Chapter 6: Risk statement
98 2017–18 Budget Statement
• New Royal Adelaide Hospital financing arrangements — the Central Adelaide Local Health Network has a finance lease arrangement in place for the new Royal Adelaide Hospital and has recognised a leased asset and finance lease obligation in 2016–17. The hospital is being delivered under a public-private partnership agreement with SA Health Partnership Nominees Pty Limited which is now known as Celsus. The agreement with Celsus provides a regime that allows Celsus to submit claims for additional time to complete and associated compensation for state induced delays to commercial acceptance, and equally for the state to submit claims for compensation for delays, incurable defects and other related matters where each claim will be assessed independently on its merits. To date, all claims from Celsus have been rejected by the independent assessor, however there are still a number of commercial matters, principally related to delays and incurable defects which the state believes it is entitled to compensation for, that remain outstanding and are currently the subject of an arbitration process.
Exposure: Not presently quantifiable.
• Non–government School Loans Scheme — Pursuant to section 15(1) of the South Australian Government Financing Authority Act 1982, liabilities incurred or assumed in performance by the South Australian Government Financing Authority of its functions under the Scheme are guaranteed by the Treasurer.
Exposure: $38.5 million at 31 May 2017
Other, less material, contingent liabilities are reported in individual agency financial statements, as contained in agency annual reports or Part B of the Report of the Auditor-General.
Chapter 6: Risk statement
2017–18 Budget Statement 99
Chapter 6: Risk statement
100 2017–18 Budget Statement
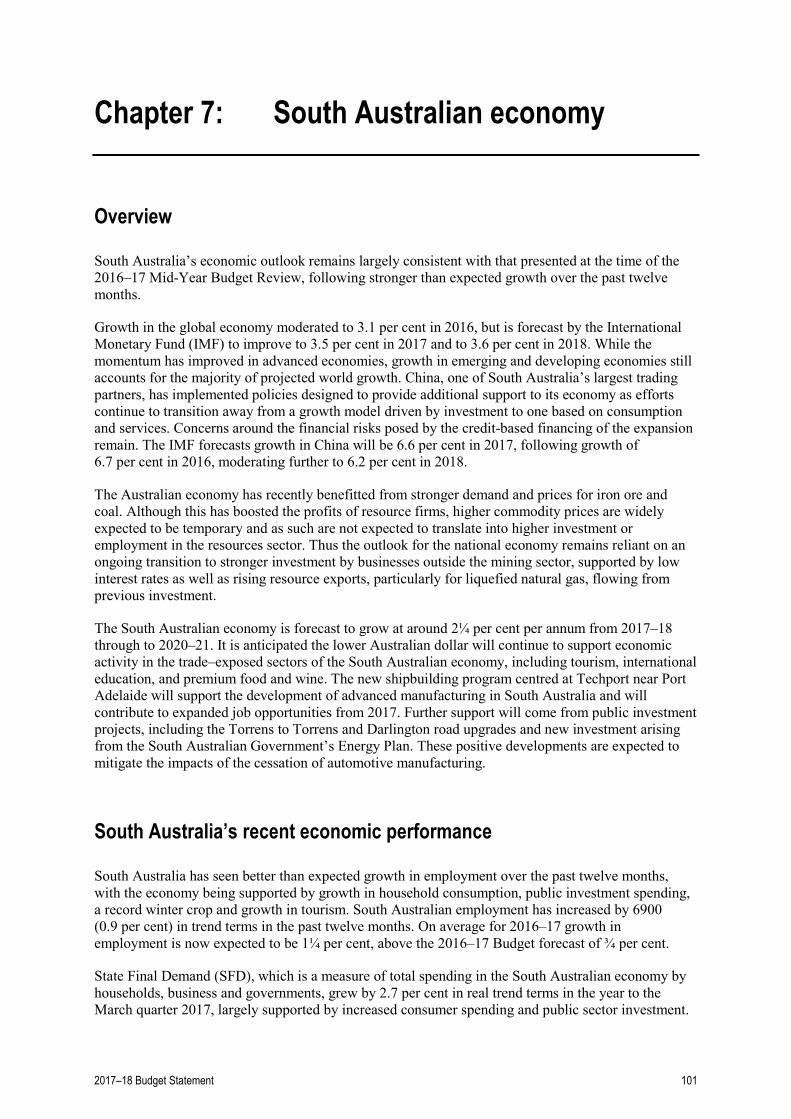
Chapter 7: South Australian economy
Overview
South Australia’s economic outlook remains largely consistent with that presented at the time of the 2016–17 Mid-Year Budget Review, following stronger than expected growth over the past twelve months.
Growth in the global economy moderated to 3.1 per cent in 2016, but is forecast by the International Monetary Fund (IMF) to improve to 3.5 per cent in 2017 and to 3.6 per cent in 2018. While the momentum has improved in advanced economies, growth in emerging and developing economies still accounts for the majority of projected world growth. China, one of South Australia’s largest trading partners, has implemented policies designed to provide additional support to its economy as efforts continue to transition away from a growth model driven by investment to one based on consumption and services. Concerns around the financial risks posed by the credit-based financing of the expansion remain. The IMF forecasts growth in China will be 6.6 per cent in 2017, following growth of 6.7 per cent in 2016, moderating further to 6.2 per cent in 2018.
The Australian economy has recently benefitted from stronger demand and prices for iron ore and coal. Although this has boosted the profits of resource firms, higher commodity prices are widely expected to be temporary and as such are not expected to translate into higher investment or employment in the resources sector. Thus the outlook for the national economy remains reliant on an ongoing transition to stronger investment by businesses outside the mining sector, supported by low interest rates as well as rising resource exports, particularly for liquefied natural gas, flowing from previous investment.
The South Australian economy is forecast to grow at around 2¼ per cent per annum from 2017–18 through to 2020–21. It is anticipated the lower Australian dollar will continue to support economic activity in the trade–exposed sectors of the South Australian economy, including tourism, international education, and premium food and wine. The new shipbuilding program centred at Techport near Port Adelaide will support the development of advanced manufacturing in South Australia and will contribute to expanded job opportunities from 2017. Further support will come from public investment projects, including the Torrens to Torrens and Darlington road upgrades and new investment arising from the South Australian Government’s Energy Plan. These positive developments are expected to mitigate the impacts of the cessation of automotive manufacturing.
South Australia’s recent economic performance
South Australia has seen better than expected growth in employment over the past twelve months, with the economy being supported by growth in household consumption, public investment spending, a record winter crop and growth in tourism. South Australian employment has increased by 6900 (0.9 per cent) in trend terms in the past twelve months. On average for 2016–17 growth in employment is now expected to be 1¼ per cent, above the 2016–17 Budget forecast of ¾ per cent.
State Final Demand (SFD), which is a measure of total spending in the South Australian economy by households, business and governments, grew by 2.7 per cent in real trend terms in the year to the March quarter 2017, largely supported by increased consumer spending and public sector investment.
2017–18 Budget Statement 101
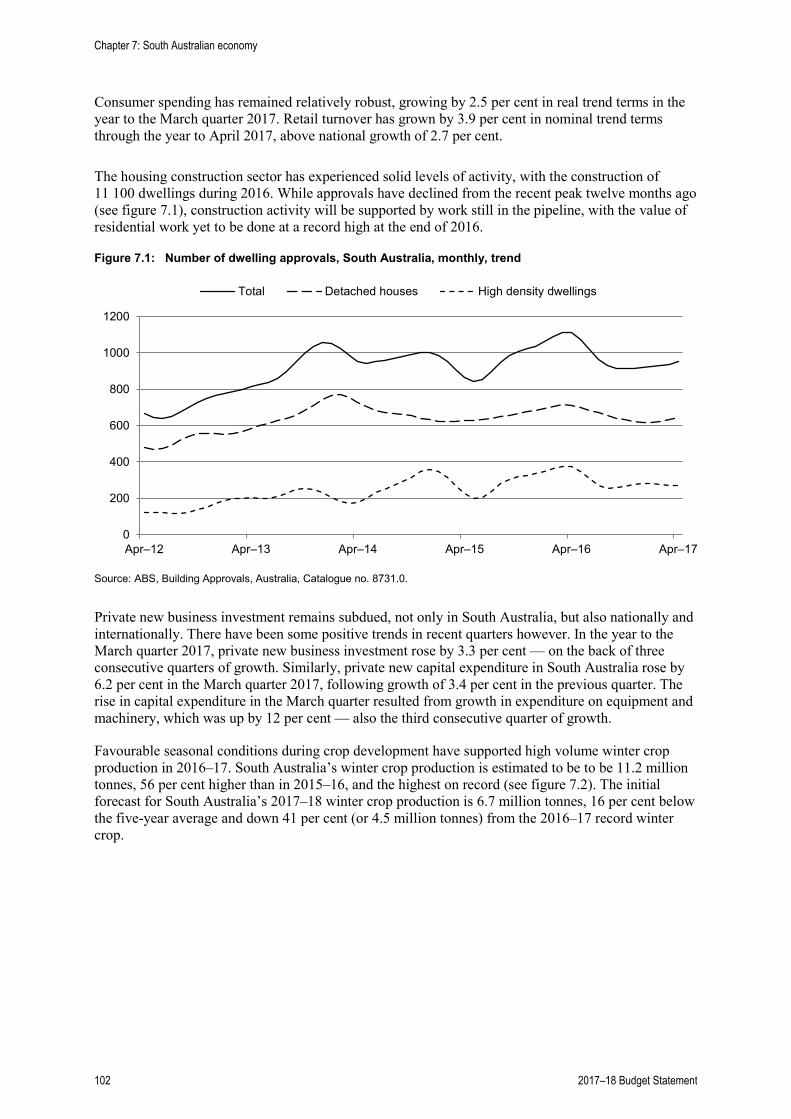
Consumer spending has remained relatively robust, growing by 2.5 per cent in real trend terms in the year to the March quarter 2017. Retail turnover has grown by 3.9 per cent in nominal trend terms through the year to April 2017, above national growth of 2.7 per cent.
The housing construction sector has experienced solid levels of activity, with the construction of 11 100 dwellings during 2016. While approvals have declined from the recent peak twelve months ago (see figure 7.1), construction activity will be supported by work still in the pipeline, with the value of residential work yet to be done at a record high at the end of 2016.
Figure 7.1: Number of dwelling approvals, South Australia, monthly, trend
Source: ABS, Building Approvals, Australia, Catalogue no. 8731.0.
Private new business investment remains subdued, not only in South Australia, but also nationally and internationally. There have been some positive trends in recent quarters however. In the year to the March quarter 2017, private new business investment rose by 3.3 per cent — on the back of three consecutive quarters of growth. Similarly, private new capital expenditure in South Australia rose by 6.2 per cent in the March quarter 2017, following growth of 3.4 per cent in the previous quarter. The rise in capital expenditure in the March quarter resulted from growth in expenditure on equipment and machinery, which was up by 12 per cent — also the third consecutive quarter of growth.
Favourable seasonal conditions during crop development have supported high volume winter crop production in 2016–17. South Australia’s winter crop production is estimated to be to be 11.2 million tonnes, 56 per cent higher than in 2015–16, and the highest on record (see figure 7.2). The initial forecast for South Australia’s 2017–18 winter crop production is 6.7 million tonnes, 16 per cent below the five-year average and down 41 per cent (or 4.5 million tonnes) from the 2016–17 record winter crop.
0
200
400
600
800
1000
1200
Apr–12 Apr–13 Apr–14 Apr–15 Apr–16 Apr–17
Total Detached houses High density dwellings
Chapter 7: South Australian economy
102 2017–18 Budget Statement
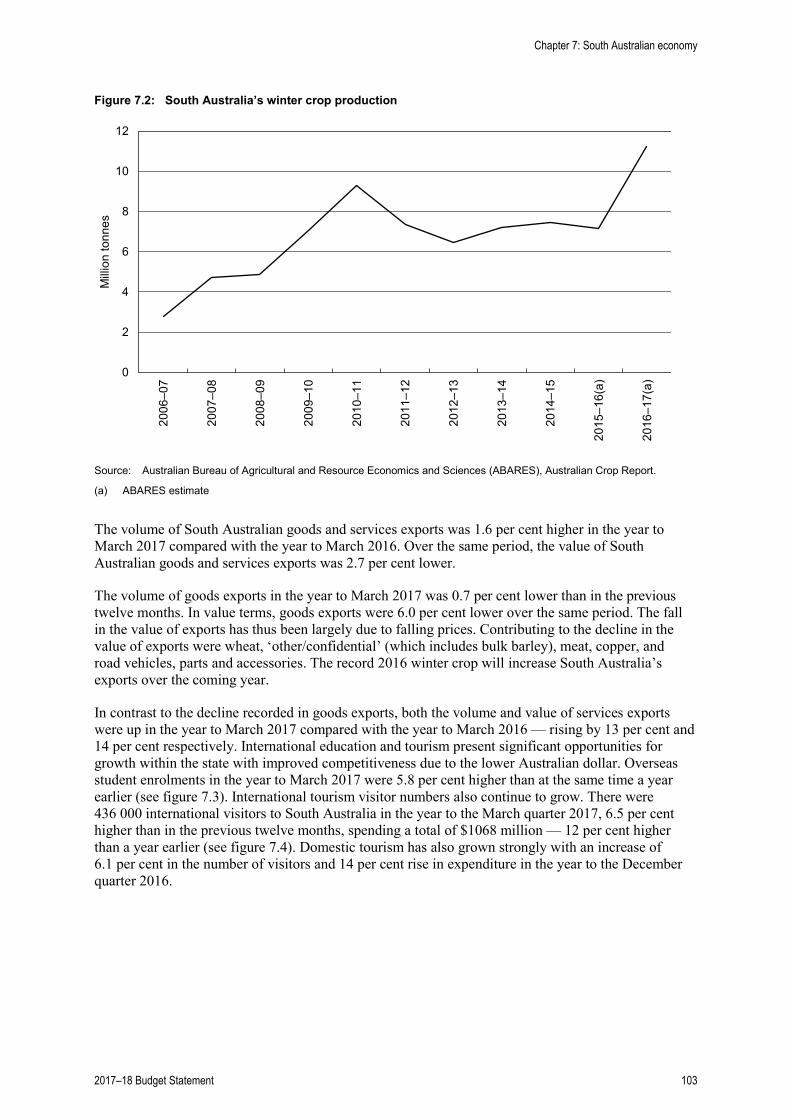
Figure 7.2: South Australia’s winter crop production
Source: Australian Bureau of Agricultural and Resource Economics and Sciences (ABARES), Australian Crop Report.
(a) ABARES estimate
The volume of South Australian goods and services exports was 1.6 per cent higher in the year to March 2017 compared with the year to March 2016. Over the same period, the value of South Australian goods and services exports was 2.7 per cent lower.
The volume of goods exports in the year to March 2017 was 0.7 per cent lower than in the previous twelve months. In value terms, goods exports were 6.0 per cent lower over the same period. The fall in the value of exports has thus been largely due to falling prices. Contributing to the decline in the value of exports were wheat, ‘other/confidential’ (which includes bulk barley), meat, copper, and road vehicles, parts and accessories. The record 2016 winter crop will increase South Australia’s exports over the coming year.
In contrast to the decline recorded in goods exports, both the volume and value of services exports were up in the year to March 2017 compared with the year to March 2016 — rising by 13 per cent and 14 per cent respectively. International education and tourism present significant opportunities for growth within the state with improved competitiveness due to the lower Australian dollar. Overseas student enrolments in the year to March 2017 were 5.8 per cent higher than at the same time a year earlier (see figure 7.3). International tourism visitor numbers also continue to grow. There were 436 000 international visitors to South Australia in the year to the March quarter 2017, 6.5 per cent higher than in the previous twelve months, spending a total of $1068 million — 12 per cent higher than a year earlier (see figure 7.4). Domestic tourism has also grown strongly with an increase of 6.1 per cent in the number of visitors and 14 per cent rise in expenditure in the year to the December quarter 2016.
0
2
4
6
8
10
12
2006
–07
2007
–08
2008
–09
2009
–10
2010
–11
2011
–12
2012
–13
2013
–14
2014
–15
2015
–16(
a)
2016
–17(
a)
Milli
on to
nnes
Chapter 7: South Australian economy
2017–18 Budget Statement 103
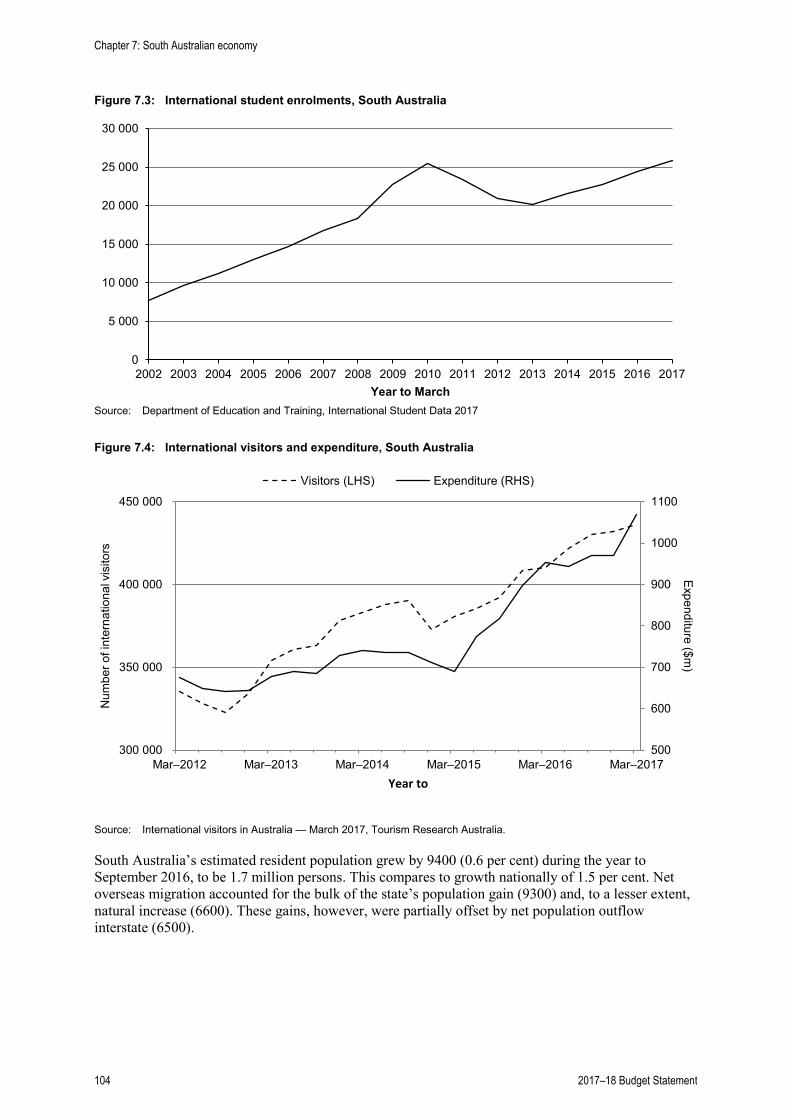
Figure 7.3: International student enrolments, South Australia
Source: Department of Education and Training, International Student Data 2017
Figure 7.4: International visitors and expenditure, South Australia
Source: International visitors in Australia — March 2017, Tourism Research Australia.
South Australia’s estimated resident population grew by 9400 (0.6 per cent) during the year to September 2016, to be 1.7 million persons. This compares to growth nationally of 1.5 per cent. Net overseas migration accounted for the bulk of the state’s population gain (9300) and, to a lesser extent, natural increase (6600). These gains, however, were partially offset by net population outflow interstate (6500).
0
5 000
10 000
15 000
20 000
25 000
30 000
2002 2003 2004 2005 2006 2007 2008 2009 2010 2011 2012 2013 2014 2015 2016 2017Year to March
500
600
700
800
900
1000
1100
300 000
350 000
400 000
450 000
Mar–2012 Mar–2013 Mar–2014 Mar–2015 Mar–2016 Mar–2017
Expenditure ($m)
Num
ber o
f int
erna
tiona
l vis
itors
Year to
Visitors (LHS) Expenditure (RHS)
Chapter 7: South Australian economy
104 2017–18 Budget Statement
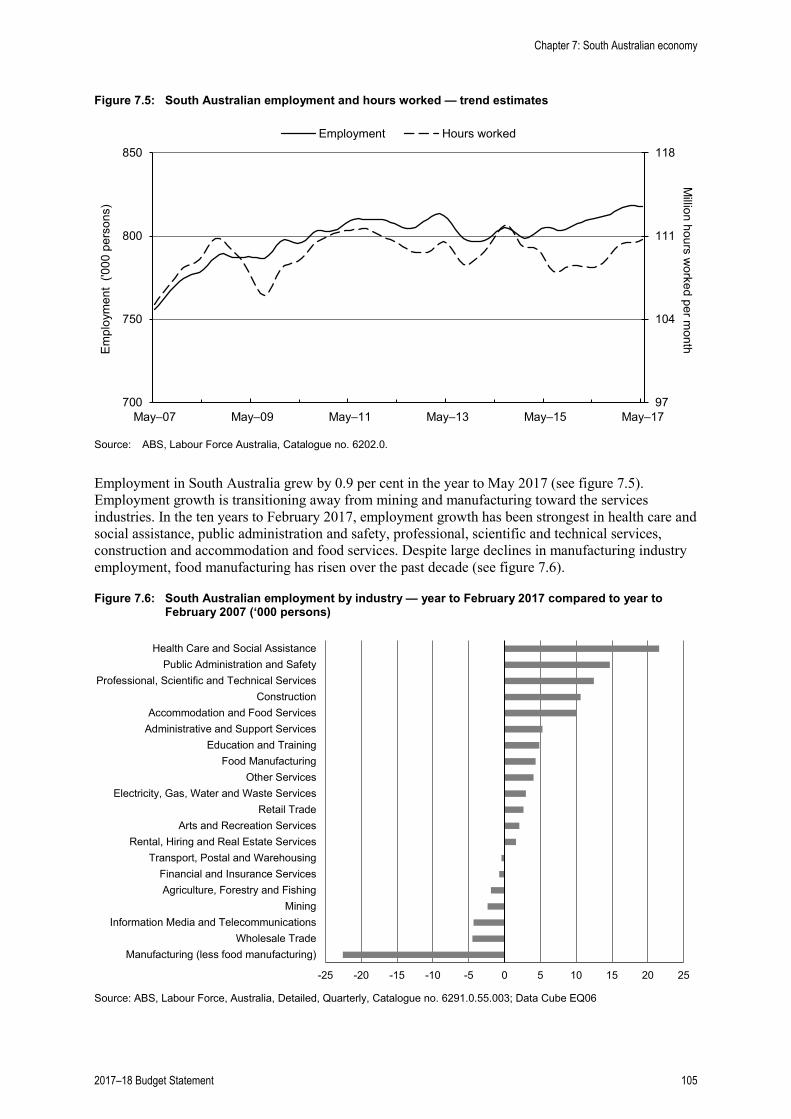
Figure 7.5: South Australian employment and hours worked — trend estimates
Source: ABS, Labour Force Australia, Catalogue no. 6202.0.
Employment in South Australia grew by 0.9 per cent in the year to May 2017 (see figure 7.5). Employment growth is transitioning away from mining and manufacturing toward the services industries. In the ten years to February 2017, employment growth has been strongest in health care and social assistance, public administration and safety, professional, scientific and technical services, construction and accommodation and food services. Despite large declines in manufacturing industry employment, food manufacturing has risen over the past decade (see figure 7.6).
Figure 7.6: South Australian employment by industry — year to February 2017 compared to year to February 2007 (‘000 persons)
Source: ABS, Labour Force, Australia, Detailed, Quarterly, Catalogue no. 6291.0.55.003; Data Cube EQ06
97
104
111
118
700
750
800
850
May–07 May–09 May–11 May–13 May–15 May–17
Million hours w
orked per monthEm
ploy
men
t ('0
00 p
erso
ns)
Employment Hours worked
-25 -20 -15 -10 -5 0 5 10 15 20 25
Manufacturing (less food manufacturing)Wholesale Trade
Information Media and TelecommunicationsMining
Agriculture, Forestry and FishingFinancial and Insurance Services
Transport, Postal and WarehousingRental, Hiring and Real Estate Services
Arts and Recreation ServicesRetail Trade
Electricity, Gas, Water and Waste ServicesOther Services
Food ManufacturingEducation and Training
Administrative and Support ServicesAccommodation and Food Services
ConstructionProfessional, Scientific and Technical Services
Public Administration and SafetyHealth Care and Social Assistance
Chapter 7: South Australian economy
2017–18 Budget Statement 105
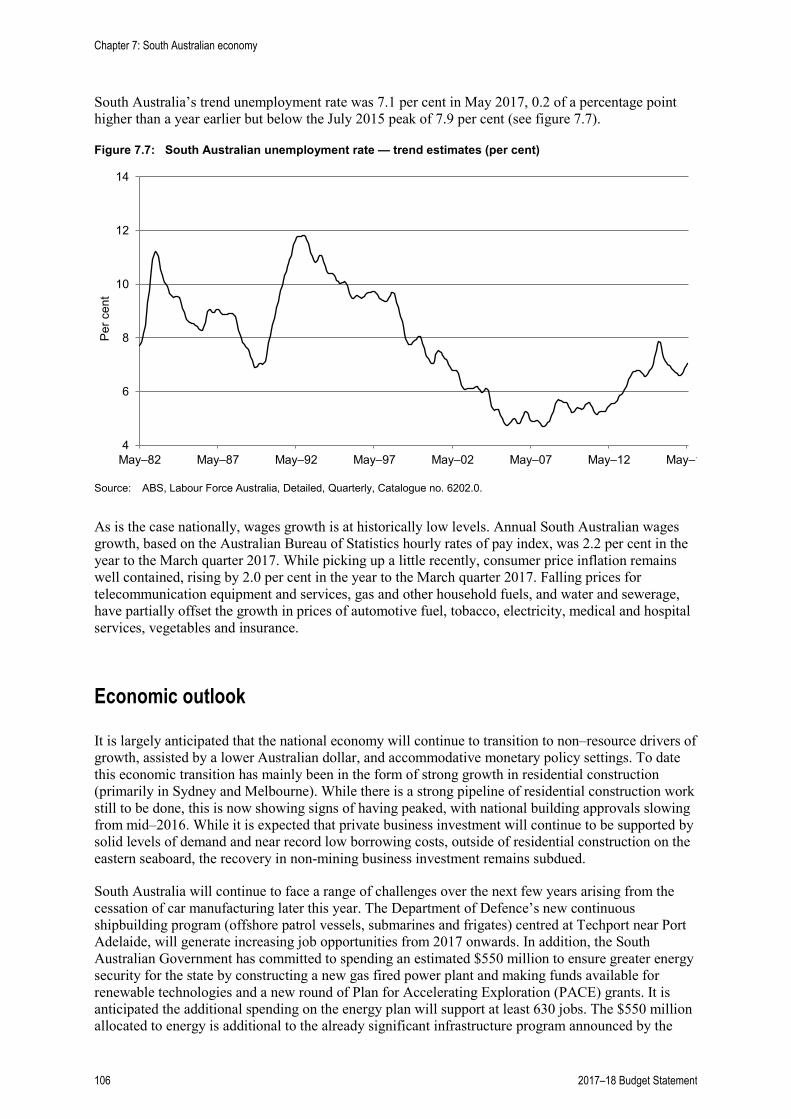
South Australia’s trend unemployment rate was 7.1 per cent in May 2017, 0.2 of a percentage point higher than a year earlier but below the July 2015 peak of 7.9 per cent (see figure 7.7).
Figure 7.7: South Australian unemployment rate — trend estimates (per cent)
Source: ABS, Labour Force Australia, Detailed, Quarterly, Catalogue no. 6202.0.
As is the case nationally, wages growth is at historically low levels. Annual South Australian wages growth, based on the Australian Bureau of Statistics hourly rates of pay index, was 2.2 per cent in the year to the March quarter 2017. While picking up a little recently, consumer price inflation remains well contained, rising by 2.0 per cent in the year to the March quarter 2017. Falling prices for telecommunication equipment and services, gas and other household fuels, and water and sewerage, have partially offset the growth in prices of automotive fuel, tobacco, electricity, medical and hospital services, vegetables and insurance.
Economic outlook
It is largely anticipated that the national economy will continue to transition to non–resource drivers of growth, assisted by a lower Australian dollar, and accommodative monetary policy settings. To date this economic transition has mainly been in the form of strong growth in residential construction (primarily in Sydney and Melbourne). While there is a strong pipeline of residential construction work still to be done, this is now showing signs of having peaked, with national building approvals slowing from mid–2016. While it is expected that private business investment will continue to be supported by solid levels of demand and near record low borrowing costs, outside of residential construction on the eastern seaboard, the recovery in non-mining business investment remains subdued.
South Australia will continue to face a range of challenges over the next few years arising from the cessation of car manufacturing later this year. The Department of Defence’s new continuous shipbuilding program (offshore patrol vessels, submarines and frigates) centred at Techport near Port Adelaide, will generate increasing job opportunities from 2017 onwards. In addition, the South Australian Government has committed to spending an estimated $550 million to ensure greater energy security for the state by constructing a new gas fired power plant and making funds available for renewable technologies and a new round of Plan for Accelerating Exploration (PACE) grants. It is anticipated the additional spending on the energy plan will support at least 630 jobs. The $550 million allocated to energy is additional to the already significant infrastructure program announced by the
4
6
8
10
12
14
May–82 May–87 May–92 May–97 May–02 May–07 May–12 May–1
Per c
ent
Chapter 7: South Australian economy
106 2017–18 Budget Statement
Government, which will further support construction industry activity and jobs. The lower Australian dollar and very low interest rates are expected to continue to support consumer spending and emerging industries such as food, tourism and international education. In addition, the government’s record spend on capital works in 2017–18 will lend further support to employment and the economy more generally. South Australian employment is forecast to grow by 1 per cent in 2017–18, following estimated growth of 1¼ per cent in 2016–17. In South Australia, GSP is forecast to increase by 2¼ per cent in real terms in 2017–18, following similar growth in 2016–17.
Forecasts and projections for South Australia from 2017–18 onwards take into consideration the expected performance of the national economy over the medium term and relative population growth rates. In addition, employment, GSP and SFD forecasts include an allowance for automotive manufacture and related supply chain closures, State Budget infrastructure spending and the increased activity accruing from the various defence works.
Table 7.1: Key economic indicators — Australia and South Australia real growth rates (per cent per annum, year averages)
(a) Australian forecasts from 2017–18 Australian Government Budget, 2017.
2015–16 Actual
2016–17 Estimate
2017–18 Forecast
2018–19 Projection
2019–20 Projection
2020–21 Projection
Australia(a)
Gross Domestic Product (GDP) 2.6 1¾ 2¾ 3 3 3 South Australia Gross State Product (GSP) 1.9 2¼ 2¼ 2¼ 2¼ 2¼ State Final Demand (SFD) 1.1 2¼ 2¼ 2¼ 2¼ 2¼ Employment 0.4 1¼ 1 1 1 1 Adelaide Consumer Price Index (CPI) 0.9 1½ 2 2¼ 2½ 2½
Chapter 7: South Australian economy
2017–18 Budget Statement 107
Chapter 7: South Australian economy
108 2017–18 Budget Statement
Chapter 8: Regional South Australia
Overview
This chapter provides information about the programs, new initiatives and investing expenditure in the 2017–18 Budget for regional South Australia.
Regions contribute to the economic strength and social fabric of South Australia and are an integral part of the state’s identity. Regional South Australia contributes around $25.4 billion to the state’s economy, over one quarter of our Gross State Product (GSP).
Regional South Australia continues to play a crucial part in meeting the objectives under the government’s 10 economic priorities, particularly as a producer of premium food and wine, mineral resources, energy and renewable assets, and as a major drawcard for tourism.
More than 20 per cent of the Government of South Australia’s employees (17 592 full-time equivalents, or FTEs) are based in regional South Australia.
In recognition of the unique issues faced by regional South Australia, the government has developed a range of initiatives to ensure regional policy is at the forefront of government decision-making. These include a Charter for Stronger Regional Policy, the Regional South Australia Cabinet Committee, and the establishment of Regions South Australia.
The 2017–18 Budget includes a range of initiatives in regional South Australia with expenditure totalling $74 million over the five years to 2020–21. The government continues its commitment to investing in regional infrastructure with expenditure on projects either underway or commencing in 2017–18 totalling over $1.1 billion.
Regional economic conditions
The economic profile of South Australia’s regions
The economic contribution of South Australia’s non-metropolitan regions was around $25.4 billion in 2015–16. This accounted for 25.3 per cent of the state’s GSP, which was $100.3 billion.
The Gross Regional Product (GRP) of South Australia’s non-metropolitan regions has grown strongly in the nine years to 2015–16, rising at an annualised rate of 4.4 per cent per annum in nominal terms.
All non-metropolitan regions recorded growth in nominal GRP in the nine years to 2015–16. The Far North region recorded the highest average annual percentage growth in nominal terms over the period, rising by 8.4 per cent per annum, followed by the Eyre and Western region (up 5.7 per cent per annum). A significant portion of this growth is attributable to growth in mining production in these regions.
2017–18 Budget Statement 109
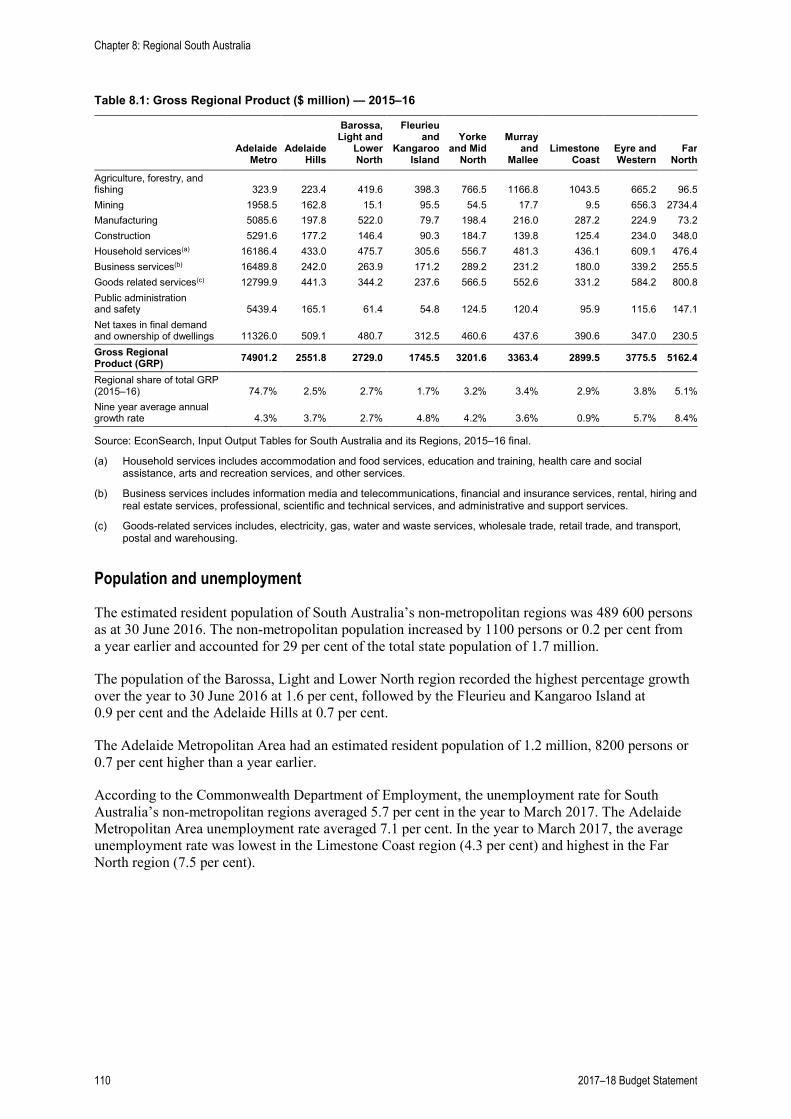
Table 8.1: Gross Regional Product ($ million) — 2015–16
Adelaide Metro
Adelaide Hills
Barossa, Light and
Lower North
Fleurieu and
Kangaroo Island
Yorke and Mid
North
Murray and
Mallee Limestone
Coast Eyre and Western
Far North
Agriculture, forestry, and fishing 323.9 223.4 419.6 398.3 766.5 1166.8 1043.5 665.2 96.5 Mining 1958.5 162.8 15.1 95.5 54.5 17.7 9.5 656.3 2734.4 Manufacturing 5085.6 197.8 522.0 79.7 198.4 216.0 287.2 224.9 73.2 Construction 5291.6 177.2 146.4 90.3 184.7 139.8 125.4 234.0 348.0 Household services(a) 16186.4 433.0 475.7 305.6 556.7 481.3 436.1 609.1 476.4 Business services(b) 16489.8 242.0 263.9 171.2 289.2 231.2 180.0 339.2 255.5 Goods related services(c) 12799.9 441.3 344.2 237.6 566.5 552.6 331.2 584.2 800.8 Public administration and safety 5439.4 165.1 61.4 54.8 124.5 120.4 95.9 115.6 147.1 Net taxes in final demand and ownership of dwellings 11326.0 509.1 480.7 312.5 460.6 437.6 390.6 347.0 230.5 Gross Regional Product (GRP) 74901.2 2551.8 2729.0 1745.5 3201.6 3363.4 2899.5 3775.5 5162.4
Regional share of total GRP (2015–16) 74.7% 2.5% 2.7% 1.7% 3.2% 3.4% 2.9% 3.8% 5.1% Nine year average annual growth rate 4.3% 3.7% 2.7% 4.8% 4.2% 3.6% 0.9% 5.7% 8.4%
Source: EconSearch, Input Output Tables for South Australia and its Regions, 2015–16 final.
(a) Household services includes accommodation and food services, education and training, health care and social assistance, arts and recreation services, and other services.
(b) Business services includes information media and telecommunications, financial and insurance services, rental, hiring and real estate services, professional, scientific and technical services, and administrative and support services.
(c) Goods-related services includes, electricity, gas, water and waste services, wholesale trade, retail trade, and transport, postal and warehousing.
Population and unemployment
The estimated resident population of South Australia’s non-metropolitan regions was 489 600 persons as at 30 June 2016. The non-metropolitan population increased by 1100 persons or 0.2 per cent from a year earlier and accounted for 29 per cent of the total state population of 1.7 million.
The population of the Barossa, Light and Lower North region recorded the highest percentage growth over the year to 30 June 2016 at 1.6 per cent, followed by the Fleurieu and Kangaroo Island at 0.9 per cent and the Adelaide Hills at 0.7 per cent.
The Adelaide Metropolitan Area had an estimated resident population of 1.2 million, 8200 persons or 0.7 per cent higher than a year earlier.
According to the Commonwealth Department of Employment, the unemployment rate for South Australia’s non-metropolitan regions averaged 5.7 per cent in the year to March 2017. The Adelaide Metropolitan Area unemployment rate averaged 7.1 per cent. In the year to March 2017, the average unemployment rate was lowest in the Limestone Coast region (4.3 per cent) and highest in the Far North region (7.5 per cent).
Chapter 8: Regional South Australia
110 2017–18 Budget Statement
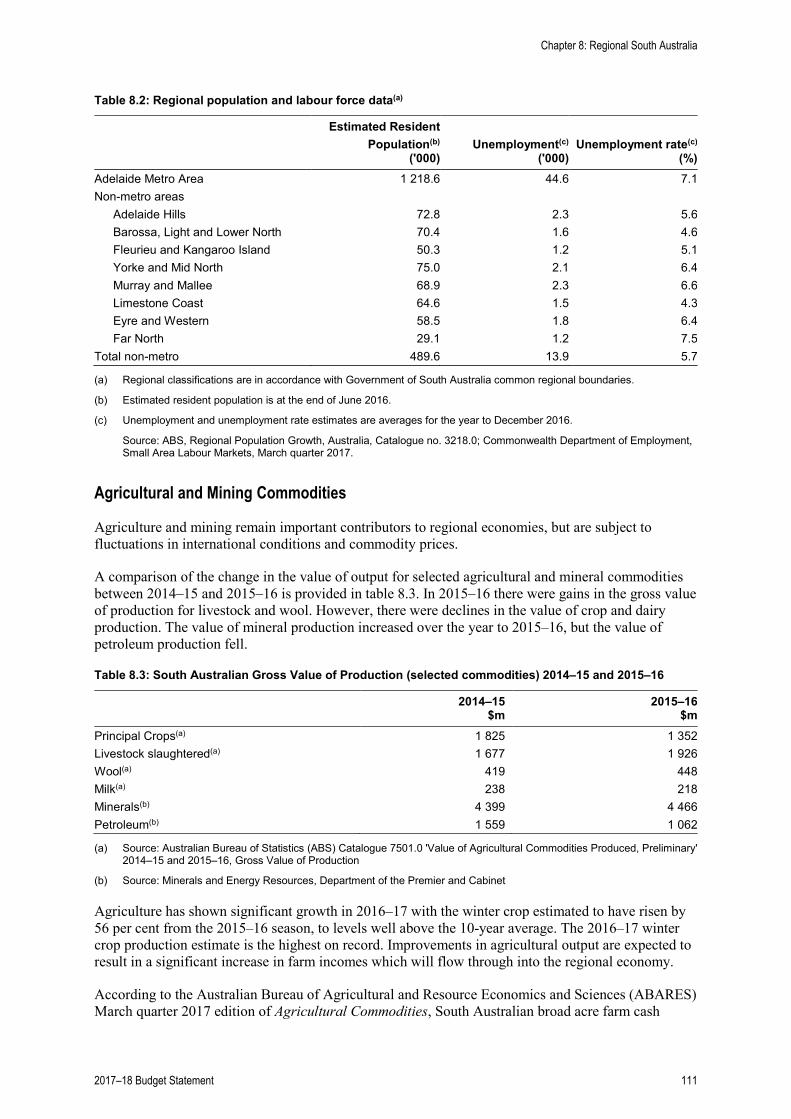
Table 8.2: Regional population and labour force data(a)
Estimated Resident Population(b)
('000) Unemployment(c)
('000) Unemployment rate(c)
(%) Adelaide Metro Area 1 218.6 44.6 7.1 Non-metro areas
Adelaide Hills 72.8 2.3 5.6 Barossa, Light and Lower North 70.4 1.6 4.6 Fleurieu and Kangaroo Island 50.3 1.2 5.1 Yorke and Mid North 75.0 2.1 6.4 Murray and Mallee 68.9 2.3 6.6 Limestone Coast 64.6 1.5 4.3 Eyre and Western 58.5 1.8 6.4 Far North 29.1 1.2 7.5
Total non-metro 489.6 13.9 5.7
(a) Regional classifications are in accordance with Government of South Australia common regional boundaries.
(b) Estimated resident population is at the end of June 2016.
(c) Unemployment and unemployment rate estimates are averages for the year to December 2016.
Source: ABS, Regional Population Growth, Australia, Catalogue no. 3218.0; Commonwealth Department of Employment, Small Area Labour Markets, March quarter 2017.
Agricultural and Mining Commodities
Agriculture and mining remain important contributors to regional economies, but are subject to fluctuations in international conditions and commodity prices.
A comparison of the change in the value of output for selected agricultural and mineral commodities between 2014–15 and 2015–16 is provided in table 8.3. In 2015–16 there were gains in the gross value of production for livestock and wool. However, there were declines in the value of crop and dairy production. The value of mineral production increased over the year to 2015–16, but the value of petroleum production fell.
Table 8.3: South Australian Gross Value of Production (selected commodities) 2014–15 and 2015–16
2014–15 $m
2015–16 $m
Principal Crops(a) 1 825 1 352 Livestock slaughtered(a) 1 677 1 926 Wool(a) 419 448 Milk(a) 238 218 Minerals(b) 4 399 4 466 Petroleum(b) 1 559 1 062
(a) Source: Australian Bureau of Statistics (ABS) Catalogue 7501.0 'Value of Agricultural Commodities Produced, Preliminary' 2014–15 and 2015–16, Gross Value of Production
(b) Source: Minerals and Energy Resources, Department of the Premier and Cabinet
Agriculture has shown significant growth in 2016–17 with the winter crop estimated to have risen by 56 per cent from the 2015–16 season, to levels well above the 10-year average. The 2016–17 winter crop production estimate is the highest on record. Improvements in agricultural output are expected to result in a significant increase in farm incomes which will flow through into the regional economy.
According to the Australian Bureau of Agricultural and Resource Economics and Sciences (ABARES) March quarter 2017 edition of Agricultural Commodities, South Australian broad acre farm cash
Chapter 8: Regional South Australia
2017–18 Budget Statement 111
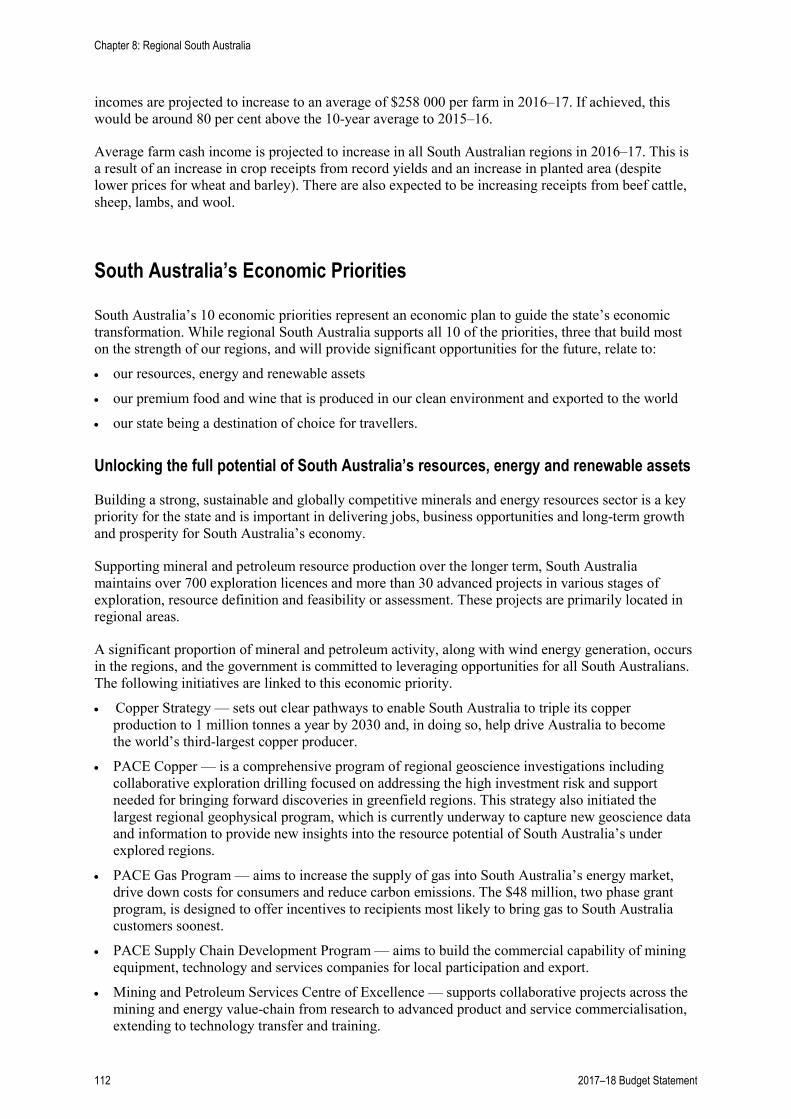
incomes are projected to increase to an average of $258 000 per farm in 2016–17. If achieved, this would be around 80 per cent above the 10-year average to 2015–16.
Average farm cash income is projected to increase in all South Australian regions in 2016–17. This is a result of an increase in crop receipts from record yields and an increase in planted area (despite lower prices for wheat and barley). There are also expected to be increasing receipts from beef cattle, sheep, lambs, and wool.
South Australia’s Economic Priorities
South Australia’s 10 economic priorities represent an economic plan to guide the state’s economic transformation. While regional South Australia supports all 10 of the priorities, three that build most on the strength of our regions, and will provide significant opportunities for the future, relate to:
• our resources, energy and renewable assets
• our premium food and wine that is produced in our clean environment and exported to the world
• our state being a destination of choice for travellers.
Unlocking the full potential of South Australia’s resources, energy and renewable assets
Building a strong, sustainable and globally competitive minerals and energy resources sector is a key priority for the state and is important in delivering jobs, business opportunities and long-term growth and prosperity for South Australia’s economy.
Supporting mineral and petroleum resource production over the longer term, South Australia maintains over 700 exploration licences and more than 30 advanced projects in various stages of exploration, resource definition and feasibility or assessment. These projects are primarily located in regional areas.
A significant proportion of mineral and petroleum activity, along with wind energy generation, occurs in the regions, and the government is committed to leveraging opportunities for all South Australians. The following initiatives are linked to this economic priority.
• Copper Strategy — sets out clear pathways to enable South Australia to triple its copper production to 1 million tonnes a year by 2030 and, in doing so, help drive Australia to become the world’s third-largest copper producer.
• PACE Copper — is a comprehensive program of regional geoscience investigations including collaborative exploration drilling focused on addressing the high investment risk and support needed for bringing forward discoveries in greenfield regions. This strategy also initiated the largest regional geophysical program, which is currently underway to capture new geoscience data and information to provide new insights into the resource potential of South Australia’s under explored regions.
• PACE Gas Program — aims to increase the supply of gas into South Australia’s energy market, drive down costs for consumers and reduce carbon emissions. The $48 million, two phase grant program, is designed to offer incentives to recipients most likely to bring gas to South Australia customers soonest.
• PACE Supply Chain Development Program — aims to build the commercial capability of mining equipment, technology and services companies for local participation and export.
• Mining and Petroleum Services Centre of Excellence — supports collaborative projects across the mining and energy value-chain from research to advanced product and service commercialisation, extending to technology transfer and training.
Chapter 8: Regional South Australia
112 2017–18 Budget Statement
• Low Carbon Investment Plan — aims to achieve the investment target of $10 billion in low carbon energy generation by 2025.
• Magnetite Strategy — designed to achieve committed, significant new investment in magnetite mining projects and export of magnetite product.
• Steel Task Force — oversees policy initiatives and industry support to underpin the sustainable future of the South Australian steel industry.
• The Leading Practice Mining Acts Review — is a comprehensive review of mining legislation to facilitate creation of sustainable jobs and maximise economic and social benefits of resource developments to all stakeholders.
The government has committed $50 million to be made available to a new owner of the Whyalla Steelworks, for investment that increases the productivity of its operations. The Government of South Australia is working with the Commonwealth Government and the administrator of Arrium Limited to develop a support package for potential purchasers of Arrium’s Whyalla assets, to ensure the best possible sale outcome and sustainable future for the state and the Whyalla community.
The government is focused on transitioning South Australia to a low carbon economy. South Australia has to date attracted over $7 billion in capital investment in renewable energy, with approximately 40 per cent occurring in regional areas. Investment in the renewable energy sector supported over 710 direct jobs across South Australia in 2015–16. The recently announced South Australian Energy Plan, along with the Bioenergy Roadmap; the investigation of opportunities for carbon sequestration; development of a Hydrogen Roadmap and a Low Emissions Vehicle Strategy, all support economic development in regional South Australia.
Other key resource projects under way include:
• Iron Road received a mineral lease and infrastructure development approval for its Central Eyre Iron Project
• OZ Minerals Carrapateena copper-gold project is advancing with opportunities for regional investment including plans for a concentrate treatment plant in Port Augusta
• BHP Billiton’s Olympic Dam operations, advancing the development path towards further expansion of its mining and processing operations
• WPG Resources’ Tarcoola gold mine commenced production with haulage of ore to Challenger for first gold pour in February 2017
• Nyrstar’s Port Pirie $660 million lead smelter transformation to an advanced poly-metallic processing and recovery facility progressed, with commissioning scheduled for late 2017.
Premium food and wine produced in our clean environment and exported to the world
This priority highlights the importance of food and wine production and its role as a major export earner for the state.
The headline objective of this economic priority is to increase international exports of differentiated and processed food and wine from $2.8 billion in 2013–14 to $3.6 billion in 2016–17. This target is ahead of schedule, with exports reaching $3.4 billion in 2015–16.
Work will continue on key programs to grow international exports and to achieve the economic priority objectives. A number of recent and ongoing programs are highlighted below.
Wine regions across the state have benefited from the Department of Primary Industries and Regions, South Australia’s (PIRSA’s) new $1.8 million South Australian Wine Industry Development Scheme, which commenced in 2016–17, and aims to encourage growth in the wine industry and further
Chapter 8: Regional South Australia
2017–18 Budget Statement 113
promote South Australia as a producer of premium wine. The 2016–17 round saw 56 wineries funded, which will further build on Adelaide and South Australia’s reputation as a Great Wine Capital.
At least $56 million in benefits have been estimated by the transport industry and primary producers thanks to the reforms resulting from the Improving Road Transport for the Agricultural Industry 90-day project — a partnership between PIRSA, the Department of Planning, Transport and Infrastructure (DPTI), and Primary Producers SA (PPSA). The project has cut red tape in transport regulations and regulatory approvals while reducing compliance costs and improving productivity.
Twelve regions across South Australia have been allocated funding totalling $412 000 to help them develop sustainable region-specific marketing activities that support the collaboration and development of South Australia’s food, wine, and culinary tourism industries. The Supporting Brands of our Key Regions Program has supported the development and implementation of the Riverland Trust Mark, an interactive online hub for Langhorne Creek called ‘The Table’, and the Branding Yorke Peninsula Project.
PIRSA’s Premium Food and Wine Co-Innovation Cluster Program is helping food and wine businesses increase collaboration, explore new opportunities for growth, and develop efficiencies. The $2.7 million Murraylands, Riverland and Limestone Coast program has been piloted to develop greater economic benefits for these areas — leading to sustainable growth, a boost in industry competitiveness and an increase in productivity.
The Building South Australia’s Premium Food and Wine Credentials Program co-invests with South Australian food and beverage businesses and/or industry aiming to improve access to target markets and thereby secure price premiums. A key program component is industry co-contribution third-party certification grants that has seen three rounds offered to the food and beverage industry and 23 projects supported.
PIRSA’s Advanced Food Manufacturing Grants Program encourages collaboration between food manufacturers and research and development providers, creating partnerships that strengthen our food industry’s innovation capabilities, productivity, and export competitiveness. Since commencing, the program has assisted 19 food businesses across the state to develop novel or innovative food products or manufacturing processes through the commercialisation of research. Examples of successful projects under the program include a $100 000 grant to Solar Eggs (Barossa) to support the development of a new range of eggs with enhanced levels of Omega 3, and a $66 500 grant awarded to Pangkarra Foods (Clare) who developed a new range of roasted and ready to serve chickpeas and faba beans, which recently won the New Product Award in the 2016 SA Food Industry Awards.
The SA Food Innovation Centre was established in December 2015 to help food and beverage businesses across South Australia find innovative solutions needed to develop and deliver high-value products. This strategic collaboration has been led by PIRSA — including the South Australian Research and Development Institute (SARDI) — in partnership with Food South Australia, the University of Adelaide, the University of South Australia, the Australian Wine Research Institute, Food Innovation Australia Ltd, CSIRO, the Royal Agricultural and Horticulture Society of SA Inc, Primary Producers SA, and the Economic Development Board. As part of Stage 2, which will be implemented in 2017, the centre will be guided by leaders from South Australia’s food and beverage industry, and a dedicated case manager has been appointed to assist businesses with navigating services and to ensure the centre is positioned to respond to industry needs.
The South Australian River Murray Sustainability (SARMS) Program includes $25 million for a suite of regional economic development, research, and innovation programs. Programs include the $12.5 million Regional Development and Innovation Fund and the $5 million Industry-led Research Sub-Program, with grant rounds now completed that have supported growth in regional employment, economic diversification, and productivity, and the $7.5 million redevelopment of the Loxton Research Centre, which was officially opened on 3 February 2017.
Chapter 8: Regional South Australia
114 2017–18 Budget Statement
New Horizons is a program supporting South Australia’s dryland farming regions through investigating and trialling new advances in soil science and management and extending information to South Australian farmers. New Horizons has the potential to increase the value of broad acre crop and livestock pasture production in South Australia by $800 million a year. The research has shown the best soil modification treatments can increase crop yields by 70 to 200 per cent and significantly increase South Australia’s agricultural production. PIRSA has developed partnerships to progress and continue the soil improvement program, including with the Commonwealth Research Council (CRC) for High Performance Soils and the Grains Research and Development Corporation (GRDC).
Rural Solutions SA has developed and delivered collaborative projects aimed at addressing soil acidity across the state. Soil acidity has been identified as a significant constraint to production and a major threat to the state’s soil resource. PIRSA purchased new machinery that uses precision soil pH mapping technology which enables farmers to better target lime application. The projects have raised awareness and understanding of soil acidity and are reducing the costs of acidity management and maximising production and farm profitability.
In 2016 PIRSA responded to three major emergency events: the Pinery bushfire, the Gawler River Floodplain flood, and the Riverland hail storm. In each event a Recovery Facilitator was quickly deployed and PIRSA worked with the community to identity their recovery needs and implemented a recovery program. Recovery activities included impact assessment, coordination and administration of Natural Disaster Relief and Recovery Assistance grants, land management and agronomic technical advice, coordination of waste clean-up and flood water pumping, coordination of damaged stone fruit clean up to minimise fruit fly risk, and activating a Family and Business (FaB) Scouts program to provide support to affected producers.
The state government is contributing towards the $156 million stage 1 Northern Adelaide Irrigation Scheme (NAIS) project if the Commonwealth contributes $46 million towards the project. NAIS will contribute an additional 12 gigalitres a year of affordable, reliable, recycled water suitable for agricultural use from the Bolivar Waste Water Treatment Plant, an increase of 60 per cent, to help expand the state’s irrigated agriculture industry.
PIRSA has evaluated opportunities for the Mid North Forests that provide value for government, create opportunities for employment, and enhance environmental, cultural, heritage, and community values. PIRSA has worked closely with stakeholders in the Mid North to determine a way forward after devastating bushfires in recent years. An open request for proposal process held in 2016 received 38 binding proposals detailing opportunities for future use of the Mid North Forest lands. The state government has completed the task of assessing these proposals against criteria to deliver benefits to the region and the state.
Grain growers are set to benefit from a $50 million five-year bilateral agreement between the GRDC and SARDI. The program is designed to boost research and development and more effectively tailor research to regional needs. It includes the creation of six new research agronomy roles in regional South Australia. The new regional research agronomists will be critical in boosting research targeted to the priorities of the key South Australian cropping regions.
The state government has invested $4 million over four years in the Almond Centre of Excellence in Loxton to establish South Australia as a world leader in the production of high quality almonds. Innovative research leading to more water efficient, higher-yielding almond trees that thrive in the Riverland conditions will be carried out on a 60 hectare experimental property purchased near Loxton to underpin the Almond Centre of Excellence.
South Australia — a growing destination of choice for international and domestic travellers
Tourism is already a key driver of the South Australian economy and is expected to be one of the state’s great growth opportunities. The contribution of our regions is important to achieving this
Chapter 8: Regional South Australia
2017–18 Budget Statement 115
growth. Tourism expenditure in South Australia rose to a record $6.3 billion in the 12 months to December 2016, a rise of 13 per cent, with continued growth from international markets (up 8 per cent), as well as a strong interstate market (up 14 per cent) and intrastate markets (up 15 per cent). Jobs in the tourism sector have also increased by 4000 in the latest available data for the two years to June 2015.
Tourism is particularly important in regional South Australia, and regions are also reaping the rewards of a growing tourism industry, with $2.6 billion spent outside of Adelaide, a growth of 18 per cent in the year to December 2016. This represents 41 per cent of overall visitor expenditure in South Australia.
In 2015 the state government committed $9 million as part of an $18 million airport upgrade on Kangaroo Island. The works include runway lengthening and strengthening, apron expansion and an upgrade of the existing terminal. Works for the project commenced in January 2017 with an expected completion date of December 2017. As part of an agreement between Qantas, the Government of South Australia, Kangaroo Island Council and Adelaide Airport Limited, Qantas will also begin to offer direct flights to Kangaroo Island from Adelaide and Melbourne from December 2017.
The state government has made a $4 million commitment to expand Mount Gambier Airport subject to approval of funding from the Commonwealth Building Better Regions Fund and agreed funding commitments from the adjacent councils.
Charter for Stronger Regional Policy
Building stronger regions is a key imperative of the Government of South Australia and is encapsulated in the delivery of the series of agreements reached between the Premier and the Independent Member for Frome, the Hon. Geoff Brock MP, in March 2014.
The state government’s regional development package incorporates a number of initiatives to provide opportunities for regional communities to interact with the government.
2016–17 was another successful year with the following initiatives undertaken.
• Five Country Cabinet meetings were held, in the areas of Mallee South; Whyalla, Coober Pedy and Roxby Downs; Yorke and Mid North; the Anangu Pitjantjatjara Yankunytjatjara (APY) Lands; and Fleurieu and Kangaroo Island, meeting the Charter’s requirement for at least three meetings to be held each year in the regions.
• Senior Management Council meetings were held in the Riverland, Murray and Mallee and Fleurieu Peninsula in 2016, meeting the Charter’s requirement for at least three meetings to be held each year in the regions.
• Fund My Idea: This program provides up to $50 000 for community-based projects across South Australia. Since its inception, through the nine Country Cabinet Fund My Idea programs, 355 ideas have been voted on with 22 255 votes cast. A total of 18 community-driven projects have received a share of $450 000.
Regional South Australia Cabinet Committee
The Regional South Australia Cabinet Committee was formed in 2014. The objective of this Cabinet Committee is to ensure greater focus on the needs of regional South Australia when making
Chapter 8: Regional South Australia
116 2017–18 Budget Statement
government decisions and improved coordination of government programs and funding arrangements for regional South Australia.
The Cabinet Committee is chaired by the Hon Geoff Brock MP, Minister for Regional Development and Minister for Local Government. Other members are:
• the Hon. Kyam Maher
• the Hon. Tom Koutsantonis
• the Hon. Leon Bignell (Deputy Chair)
• the Hon. Stephen Mullighan.
The Cabinet Committee ensures regional development strategies are effectively coordinated across government portfolios and agencies. Additionally, the committee provides input into the identification of priority areas for influencing Australian Government funding programs available to regional areas.
Regions South Australia
Regions South Australia (Regions SA) was established on 1 July 2014 to provide an integrated cross-sector, cross-government, and regionally focussed approach to improving economic and social outcomes for regions.
Since its establishment, Regions SA has supported economic development in South Australia’s regions by:
• helping industry to grow and create jobs through the Regional Development Fund grant rounds
• leveraging private sector investment in projects
• helping to address barriers to employment in regions through funding programs such as the Regional Youth Traineeship Program and the North West Indigenous Pastoral Program
• addressing business constraints in regional areas, such as through solutions to transport issues facing Australian agriculture and through funding for mobile blackspots
• promoting regions within government through the creation of the Regional South Australia Cabinet Committee and better use of Regional Impact Assessment Statements
• collaboration and partnerships with Regional Development Australia associations, councils, and key regional stakeholders, to ensure a cohesive approach to regional development
Building on these achievements, during 2017–18 Regions SA will undertake projects that will:
• provide training and employment opportunities intended to retain young people in our regions
• enable job growth through helping local businesses to expand
• explore opportunities to co-invest in critical infrastructure projects including telecommunications and transport
• drive policy reform to further address barriers to regional growth
• work with regional stakeholders to support their delivery of locally identified priorities.
Chapter 8: Regional South Australia
2017–18 Budget Statement 117
Regional Development Portfolio Programs
Regional Impact Assessment Statements
The Regional Impact Assessment policy and guidelines are part of a broader commitment to ensuring that regional impacts and issues are considered in government decision-making processes.
The Regional Impact Assessment policy requires government agencies to prepare a Regional Impact Assessment Statement (RIAS) for any significant change proposed in relation to services or infrastructure in regional areas.
The statements are publicly available on Regions SA’s website <pir.sa.gov.au/rias> along with guides for agencies on how to prepare their RIAS.
In total, 36 RIAS have been completed and published on the website. In this term of government, 14 RIAS have been completed.
Regional Development Fund
The government has committed $15 million per annum to the Regional Development Fund (RDF) in recognition of the importance of regional South Australia to the state’s economy. This fund supports projects to provide better infrastructure, drive economic growth, create jobs, and leverage private sector investment in the regions.
More than $60 million has been awarded through RDF grants to over 90 regional economic development projects during this term of government, creating a significant number of new jobs across our state’s regions.
Some of the grants awarded in Round 3 include:
• $2.0 million to Inghams Enterprises Feedmill to construct four chicken breeding farms at Yumali (24 jobs)
• $2.5 million to Beston Pure Dairies Pty Ltd for expansion of its Murray Bridge cheese processing facility (61 jobs)
• $1.2 million to Primo Smallgoods for Stage 1 of its expansion of the boning room to increase capacity at Port Wakefield (60 jobs)
• $950 000 to the Premium Adelaide Hills Beverage Experience for a luxury beverage facility and cellar door experience in the Adelaide Hills (35 jobs)
• $400 000 to Solar Eggs to assist in the expansion of its Barossa Valley Farm (12 jobs)
• $438 820 to Gambier Earth Movers towards its Mount Gambier asphalt plant upgrade (5 jobs)
• $397 306 to CU River Mining towards the re-commissioning of the Cairn Hill Mine (61 jobs)
• $900 000 to Mary Mackillop Care SA for innovation in aged care and affordable housing in Berri (47 jobs).
Upper Spencer Gulf and Outback Assistance
Targeted assistance to create jobs and stimulate economic development aims to address the structural adjustment challenges currently being experienced by the Upper Spencer Gulf and Outback areas of the state. The assistance has included $10 million in an interest-free loan scheme (funded in part from the RDF) to support small businesses experiencing cash-flow challenges as a result of Whyalla steelmaker Arrium entering administration.
Chapter 8: Regional South Australia
118 2017–18 Budget Statement
A $7 million grant package through the RDF and the Upper Spencer Gulf and Outback Futures Program (USGOFP) was announced in November 2015, supporting projects leading to new jobs, and sustainable communities.
Seventeen applicants have accepted a grant offered under the USGOFP, leading to the creation of 71 jobs and generating almost $10 million of investment into the region.
In addition, three projects totalling $3.78 million located in the Upper Spencer Gulf and Outback have accepted a grant offered under the $5 million prioritised within the RDF Round 3.
The government has committed $3.18 million to the Bundaleer Pipeline Scheme, to make water available for agricultural use from the Bundaleer Reservoir in the state’s mid north. The scheme will provide an affordable source of water to industry around the Bundaleer Reservoir through a 12 kilometre pipeline network and other related infrastructure. The scheme will deliver up to 275 megalitres per year of water to grow and diversify higher value agricultural production in the Mid North of South Australia.
Once completed, the scheme will create up to 25 direct jobs, and generate estimated annual revenue of around $4.6 million in the region. This commitment to developing water infrastructure relies on a successful application to the Australian Government’s National Water Infrastructure Development Fund for an equal contribution of $3.18 million.
Regional Enablers
A number of other projects are being undertaken by the Government to grow and diversify the economic base for strong regions and sustainable communities. They include:
Regional Youth Traineeship Program
A $2 million Regional Youth Traineeships Program (RYTP) was established in September 2015 as part of the state government’s commitments to regions. The program provides 57 young people the opportunity to gain a traineeship in regional local government. It offers participating local governing organisations $14 500 per year for two years, per trainee, to provide entry level employment for young people.
The program was established to assist the retention of young people in regional South Australia and to enable young unemployed people to get a start in the labour market in an entry level position.
Given the success of Round 1 of the program which was fully subscribed, a second round of the $2 million RYTP was announced in October 2016 to be funded from the Regional Development Fund.
Round 2 is for a further two years, enabling an additional 57 young people to gain a traineeship in regional local government.
North West Indigenous Pastoral Project
Round 1 of the North West Indigenous Pastoral Project — NWIPP ($1.4 million) was funded under the Jobs Accelerator Fund to facilitate the employment of indigenous pastoral workers.
NWIPP has been very successful in its engagement with indigenous landholders, the business sector — particularly BHP Billiton — and the Indigenous Land Corporation.
Funding for Round 2 of the NWIPP ($1.49 million) was announced in the 2016–17 State Budget.
Chapter 8: Regional South Australia
2017–18 Budget Statement 119
Since June 2015, when the first indigenous workers were engaged by the project, a total of 46 people have been employed for various periods. This employment occurs on indigenous lands where the majority of job opportunities exist.
Some of these workers have transitioned into independent employment, and it is anticipated that this number will increase over the next 18 months as traineeships are completed.
Additionally, 200 000 hectares of land have already been brought back into pastoral production.
Mobile Black Spots
The state government pledged a co-contribution of up to $2 million to Round 2 of the Australian Government’s Mobile Black Spot Program. The program is a Commonwealth initiative to improve and extend mobile phone coverage to regional and remote Australian locations.
The state government submitted a list of priority sites seeking Australian Government funding through Round 2 of this program. The Australian Government subsequently announced funding for 20 sites primarily in remote South Australia, 18 of which were priority sites identified by the state government.
A Modern Transport System for Agriculture Project
At least $56 million in benefits have been estimated by the transport industry and primary producers thanks to the reforms resulting from the Modern Transport System for Agriculture project — a partnership between PIRSA, the Department of Planning Transport and Infrastructure and Primary Producers SA. The project was initiated to find opportunities to improve the productivity and efficiency of road transport for the primary industries sector and to review the requirements for the movement of agricultural machinery on public roads.
The outcomes of this project are significant for the state, and more importantly for regional growth and job creation. Realising efficiencies for logistics in the primary industries sector will deliver immediate gains in productivity, as well as simplifying and modernising regulatory arrangements that support innovation and job creation, specifically in regional South Australia.
In terms of benefits, there is not only potential for significant improvement in direct transport productivity — such as shifting from B-Doubles to road trains — there are also significant economic benefits to the state as a whole.
Based on the success of the first project in delivering benefits through a collaboration of government agencies and PPSA opportunities for further improvements are now being investigated. As part of this, a further survey is seeking to identify and address further route access and machinery movement issues for primary producers, allowing further savings to be realised.
State — Local Government Infrastructure Partnership
The State-Local Government Infrastructure Partnership was announced in October 2016 following agreement at the Premier's State-Local Government Forum. The Partnership is designed to assist councils to bring forward infrastructure projects foreshadowed in their long-term planning.
State government funding will provide 20 per cent of the cost of eligible infrastructure projects. To be eligible, projects had to be brought forward to commence before 31 December 2017, and not otherwise have started before 2019–20. Councils will provide the remaining 80 per cent through their own reserves or borrowings. In addition, the Local Government Financing Authority will provide finance at a discounted rate over ten years for council borrowings on partnership projects.
In total, more than $23 million is being offered to 26 councils across the state, including more than $12 million to 15 regional councils. The initiative will result in a wide range of projects including
Chapter 8: Regional South Australia
120 2017–18 Budget Statement
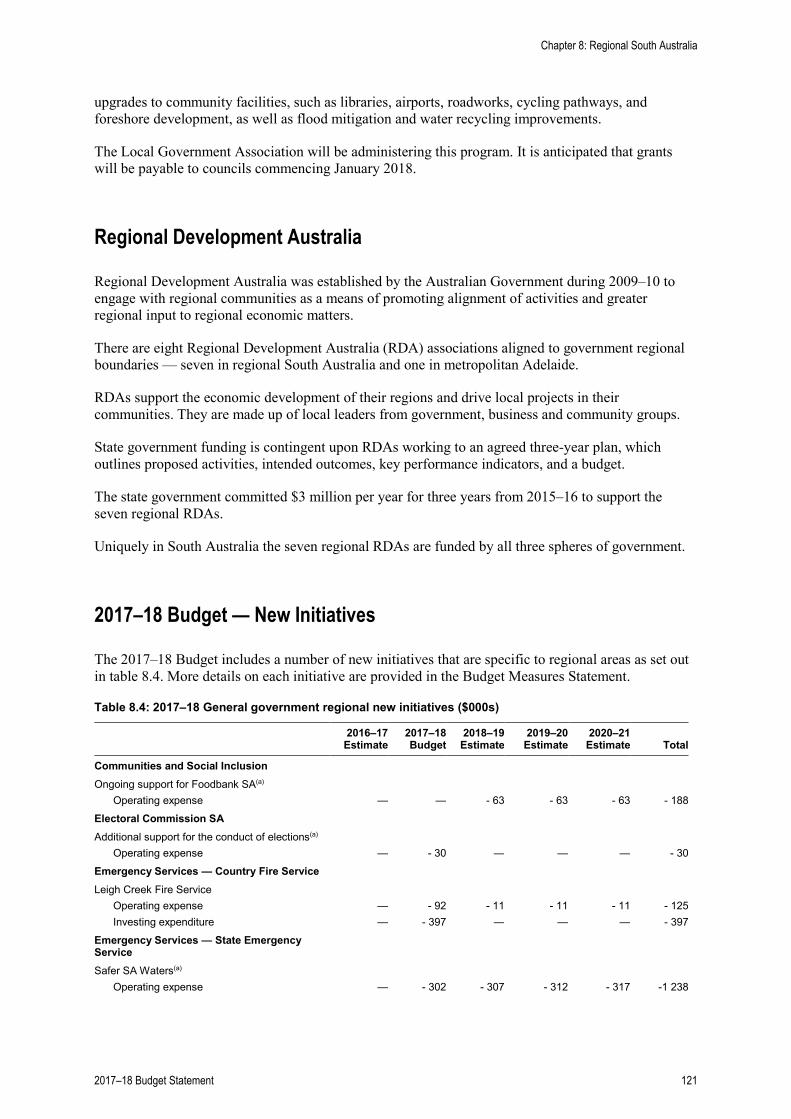
upgrades to community facilities, such as libraries, airports, roadworks, cycling pathways, and foreshore development, as well as flood mitigation and water recycling improvements.
The Local Government Association will be administering this program. It is anticipated that grants will be payable to councils commencing January 2018.
Regional Development Australia
Regional Development Australia was established by the Australian Government during 2009–10 to engage with regional communities as a means of promoting alignment of activities and greater regional input to regional economic matters.
There are eight Regional Development Australia (RDA) associations aligned to government regional boundaries — seven in regional South Australia and one in metropolitan Adelaide.
RDAs support the economic development of their regions and drive local projects in their communities. They are made up of local leaders from government, business and community groups.
State government funding is contingent upon RDAs working to an agreed three-year plan, which outlines proposed activities, intended outcomes, key performance indicators, and a budget.
The state government committed $3 million per year for three years from 2015–16 to support the seven regional RDAs.
Uniquely in South Australia the seven regional RDAs are funded by all three spheres of government.
2017–18 Budget — New Initiatives
The 2017–18 Budget includes a number of new initiatives that are specific to regional areas as set out in table 8.4. More details on each initiative are provided in the Budget Measures Statement.
Table 8.4: 2017–18 General government regional new initiatives ($000s)
2016–17 Estimate
2017–18 Budget
2018–19 Estimate
2019–20 Estimate
2020–21 Estimate Total
Communities and Social Inclusion Ongoing support for Foodbank SA(a)
Operating expense — — - 63 - 63 - 63 - 188 Electoral Commission SA Additional support for the conduct of elections(a)
Operating expense — - 30 — — — - 30 Emergency Services — Country Fire Service Leigh Creek Fire Service
Operating expense — - 92 - 11 - 11 - 11 - 125 Investing expenditure — - 397 — — — - 397
Emergency Services — State Emergency Service
Safer SA Waters(a) Operating expense — - 302 - 307 - 312 - 317 -1 238
Chapter 8: Regional South Australia
2017–18 Budget Statement 121
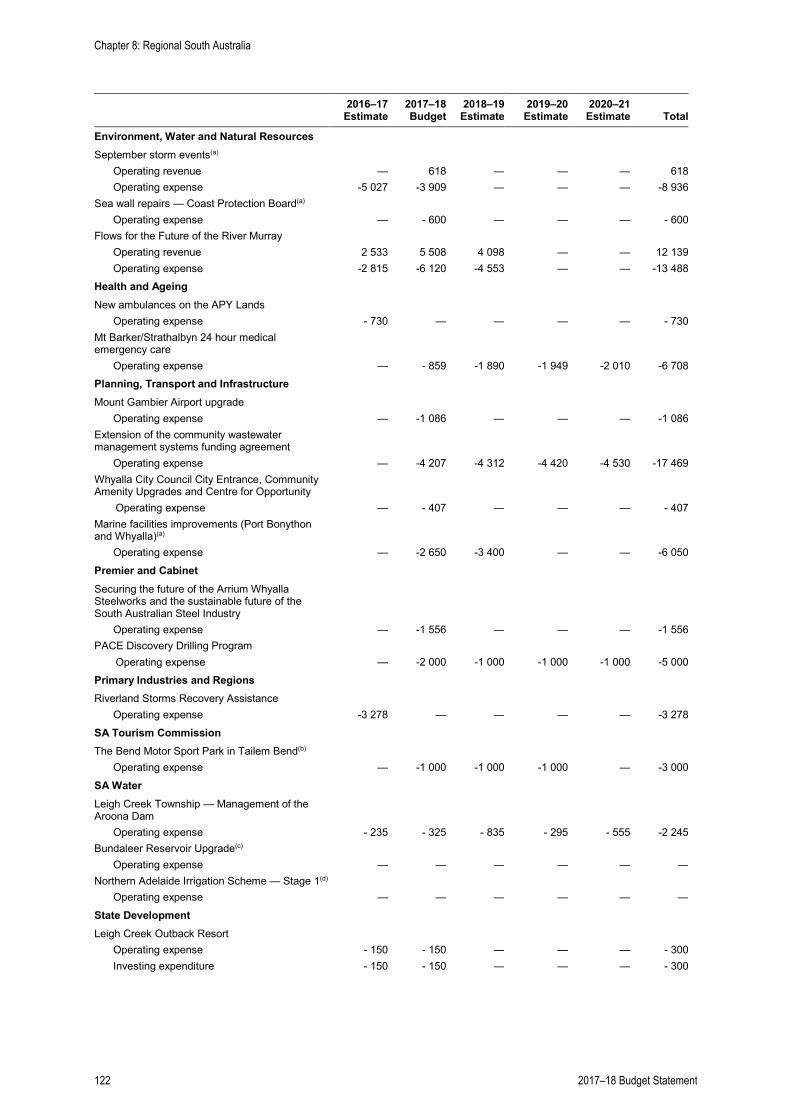
2016–17
Estimate 2017–18 Budget
2018–19 Estimate
2019–20 Estimate
2020–21 Estimate Total
Environment, Water and Natural Resources September storm events(a)
Operating revenue — 618 — — — 618 Operating expense -5 027 -3 909 — — — -8 936
Sea wall repairs — Coast Protection Board(a) Operating expense — - 600 — — — - 600
Flows for the Future of the River Murray Operating revenue 2 533 5 508 4 098 — — 12 139 Operating expense -2 815 -6 120 -4 553 — — -13 488
Health and Ageing New ambulances on the APY Lands
Operating expense - 730 — — — — - 730 Mt Barker/Strathalbyn 24 hour medical emergency care
Operating expense — - 859 -1 890 -1 949 -2 010 -6 708 Planning, Transport and Infrastructure Mount Gambier Airport upgrade
Operating expense — -1 086 — — — -1 086 Extension of the community wastewater management systems funding agreement
Operating expense — -4 207 -4 312 -4 420 -4 530 -17 469 Whyalla City Council City Entrance, Community Amenity Upgrades and Centre for Opportunity
Operating expense — - 407 — — — - 407 Marine facilities improvements (Port Bonython and Whyalla)(a)
Operating expense — -2 650 -3 400 — — -6 050 Premier and Cabinet Securing the future of the Arrium Whyalla Steelworks and the sustainable future of the South Australian Steel Industry
Operating expense — -1 556 — — — -1 556 PACE Discovery Drilling Program
Operating expense — -2 000 -1 000 -1 000 -1 000 -5 000 Primary Industries and Regions Riverland Storms Recovery Assistance
Operating expense -3 278 — — — — -3 278 SA Tourism Commission The Bend Motor Sport Park in Tailem Bend(b)
Operating expense — -1 000 -1 000 -1 000 — -3 000 SA Water Leigh Creek Township — Management of the Aroona Dam
Operating expense - 235 - 325 - 835 - 295 - 555 -2 245 Bundaleer Reservoir Upgrade(c)
Operating expense — — — — — — Northern Adelaide Irrigation Scheme — Stage 1(d)
Operating expense — — — — — — State Development Leigh Creek Outback Resort
Operating expense - 150 - 150 — — — - 300 Investing expenditure - 150 - 150 — — — - 300
Chapter 8: Regional South Australia
122 2017–18 Budget Statement
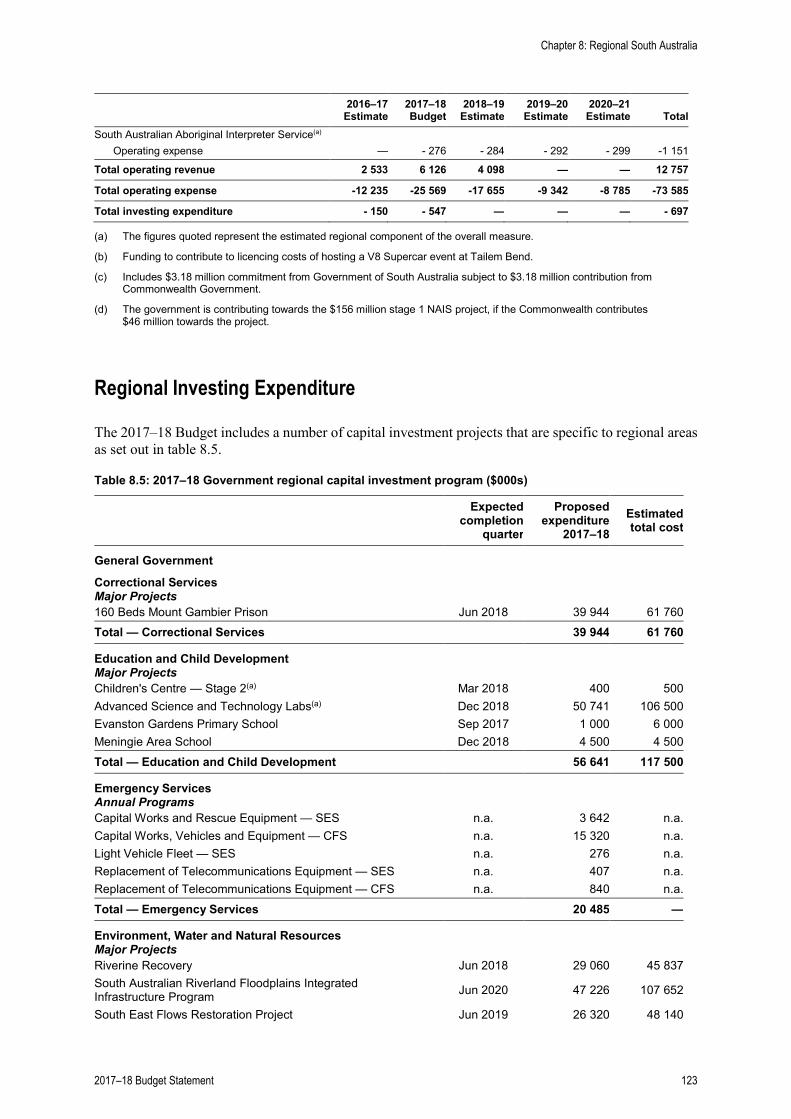
2016–17
Estimate 2017–18 Budget
2018–19 Estimate
2019–20 Estimate
2020–21 Estimate Total
South Australian Aboriginal Interpreter Service(a) Operating expense — - 276 - 284 - 292 - 299 -1 151
Total operating revenue 2 533 6 126 4 098 — — 12 757
Total operating expense -12 235 -25 569 -17 655 -9 342 -8 785 -73 585
Total investing expenditure - 150 - 547 — — — - 697
(a) The figures quoted represent the estimated regional component of the overall measure.
(b) Funding to contribute to licencing costs of hosting a V8 Supercar event at Tailem Bend.
(c) Includes $3.18 million commitment from Government of South Australia subject to $3.18 million contribution from Commonwealth Government.
(d) The government is contributing towards the $156 million stage 1 NAIS project, if the Commonwealth contributes $46 million towards the project.
Regional Investing Expenditure
The 2017–18 Budget includes a number of capital investment projects that are specific to regional areas as set out in table 8.5.
Table 8.5: 2017–18 Government regional capital investment program ($000s)
Expected completion
quarter
Proposed expenditure
2017–18 Estimated total cost
General Government
Correctional Services Major Projects 160 Beds Mount Gambier Prison Jun 2018 39 944 61 760 Total — Correctional Services 39 944 61 760
Education and Child Development Major Projects Children's Centre — Stage 2(a) Mar 2018 400 500 Advanced Science and Technology Labs(a) Dec 2018 50 741 106 500 Evanston Gardens Primary School Sep 2017 1 000 6 000 Meningie Area School Dec 2018 4 500 4 500 Total — Education and Child Development 56 641 117 500
Emergency Services Annual Programs Capital Works and Rescue Equipment — SES n.a. 3 642 n.a. Capital Works, Vehicles and Equipment — CFS n.a. 15 320 n.a. Light Vehicle Fleet — SES n.a. 276 n.a. Replacement of Telecommunications Equipment — SES n.a. 407 n.a. Replacement of Telecommunications Equipment — CFS n.a. 840 n.a. Total — Emergency Services 20 485 —
Environment, Water and Natural Resources
Major Projects
Riverine Recovery Jun 2018 29 060 45 837 South Australian Riverland Floodplains Integrated Infrastructure Program Jun 2020 47 226 107 652
South East Flows Restoration Project Jun 2019 26 320 48 140
Chapter 8: Regional South Australia
2017–18 Budget Statement 123
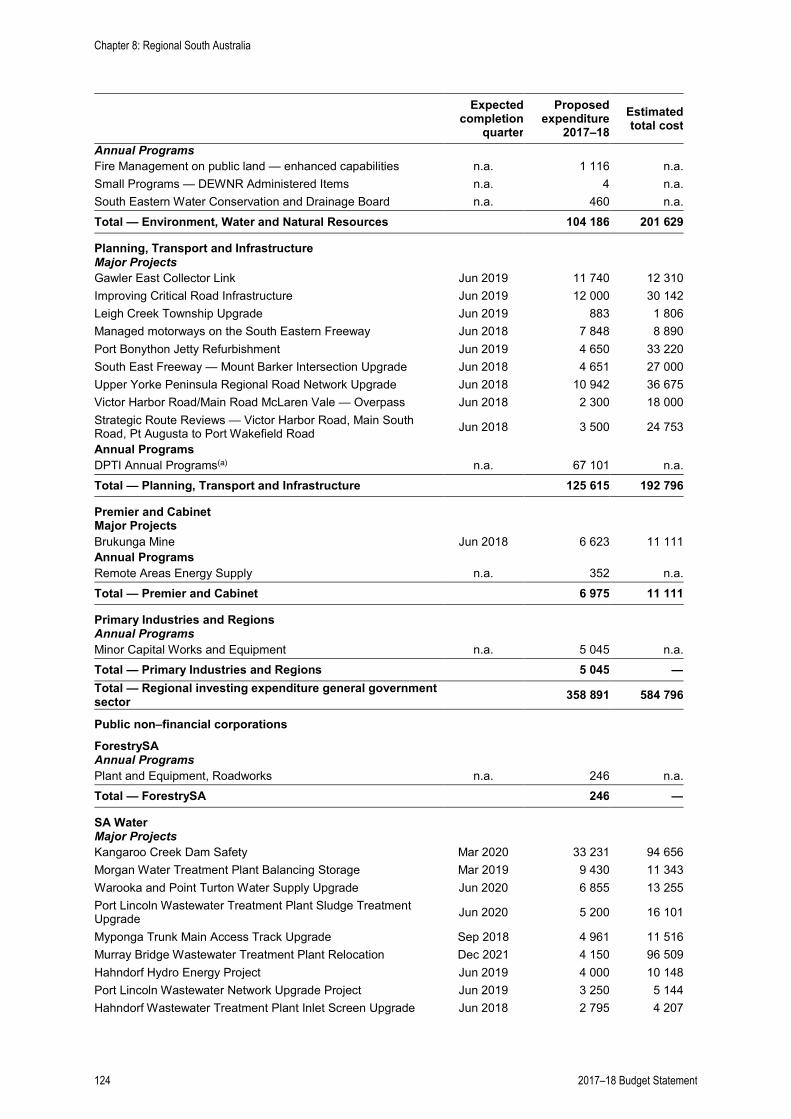
Expected completion
quarter
Proposed expenditure
2017–18 Estimated total cost
Annual Programs
Fire Management on public land — enhanced capabilities n.a. 1 116 n.a. Small Programs — DEWNR Administered Items n.a. 4 n.a. South Eastern Water Conservation and Drainage Board n.a. 460 n.a. Total — Environment, Water and Natural Resources 104 186 201 629
Planning, Transport and Infrastructure
Major Projects
Gawler East Collector Link Jun 2019 11 740 12 310 Improving Critical Road Infrastructure Jun 2019 12 000 30 142 Leigh Creek Township Upgrade Jun 2019 883 1 806 Managed motorways on the South Eastern Freeway Jun 2018 7 848 8 890 Port Bonython Jetty Refurbishment Jun 2019 4 650 33 220 South East Freeway — Mount Barker Intersection Upgrade Jun 2018 4 651 27 000 Upper Yorke Peninsula Regional Road Network Upgrade Jun 2018 10 942 36 675 Victor Harbor Road/Main Road McLaren Vale — Overpass Jun 2018 2 300 18 000 Strategic Route Reviews — Victor Harbor Road, Main South Road, Pt Augusta to Port Wakefield Road Jun 2018 3 500 24 753
Annual Programs DPTI Annual Programs(a) n.a. 67 101 n.a. Total — Planning, Transport and Infrastructure 125 615 192 796
Premier and Cabinet Major Projects Brukunga Mine Jun 2018 6 623 11 111 Annual Programs Remote Areas Energy Supply n.a. 352 n.a. Total — Premier and Cabinet 6 975 11 111
Primary Industries and Regions
Annual Programs
Minor Capital Works and Equipment n.a. 5 045 n.a. Total — Primary Industries and Regions 5 045 — Total — Regional investing expenditure general government sector
358 891 584 796
Public non–financial corporations
ForestrySA Annual Programs Plant and Equipment, Roadworks n.a. 246 n.a. Total — ForestrySA 246 —
SA Water
Major Projects Kangaroo Creek Dam Safety Mar 2020 33 231 94 656 Morgan Water Treatment Plant Balancing Storage Mar 2019 9 430 11 343 Warooka and Point Turton Water Supply Upgrade Jun 2020 6 855 13 255 Port Lincoln Wastewater Treatment Plant Sludge Treatment Upgrade Jun 2020 5 200 16 101
Myponga Trunk Main Access Track Upgrade Sep 2018 4 961 11 516 Murray Bridge Wastewater Treatment Plant Relocation Dec 2021 4 150 96 509 Hahndorf Hydro Energy Project Jun 2019 4 000 10 148 Port Lincoln Wastewater Network Upgrade Project Jun 2019 3 250 5 144 Hahndorf Wastewater Treatment Plant Inlet Screen Upgrade Jun 2018 2 795 4 207
Chapter 8: Regional South Australia
124 2017–18 Budget Statement
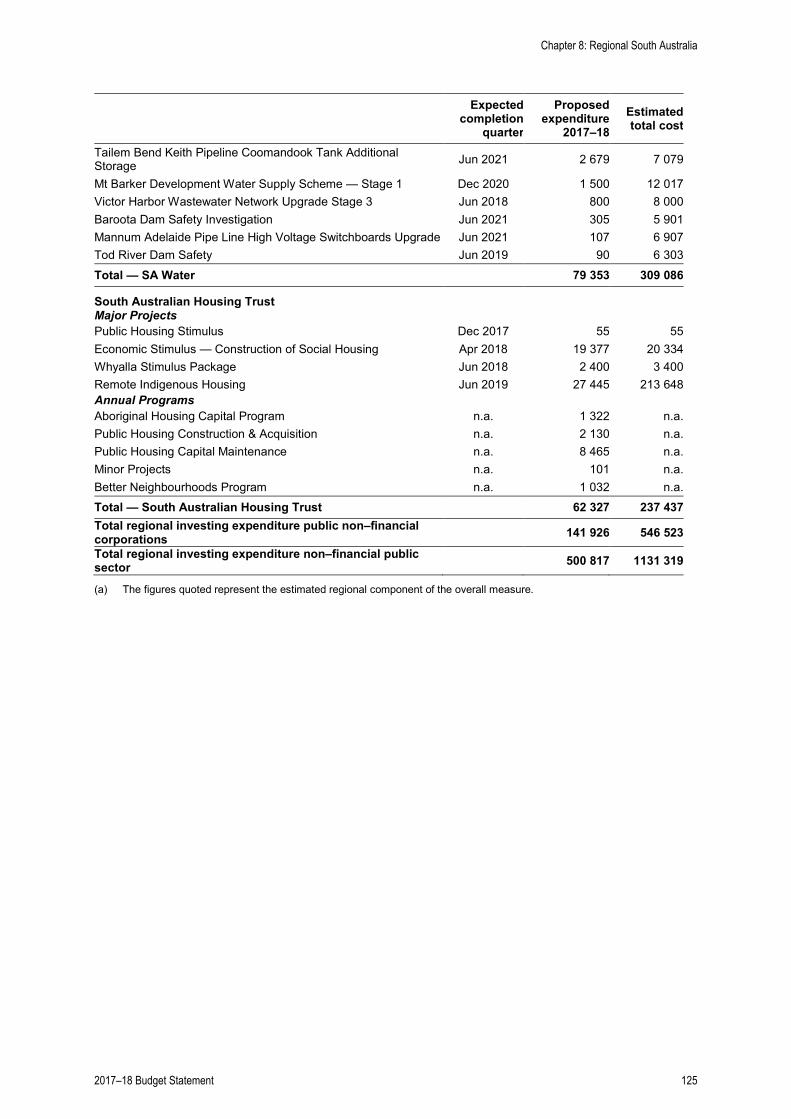
Expected completion
quarter
Proposed expenditure
2017–18 Estimated total cost
Tailem Bend Keith Pipeline Coomandook Tank Additional Storage Jun 2021 2 679 7 079
Mt Barker Development Water Supply Scheme — Stage 1 Dec 2020 1 500 12 017 Victor Harbor Wastewater Network Upgrade Stage 3 Jun 2018 800 8 000 Baroota Dam Safety Investigation Jun 2021 305 5 901 Mannum Adelaide Pipe Line High Voltage Switchboards Upgrade Jun 2021 107 6 907 Tod River Dam Safety Jun 2019 90 6 303 Total — SA Water 79 353 309 086
South Australian Housing Trust
Major Projects
Public Housing Stimulus Dec 2017 55 55 Economic Stimulus — Construction of Social Housing Apr 2018 19 377 20 334 Whyalla Stimulus Package Jun 2018 2 400 3 400 Remote Indigenous Housing Jun 2019 27 445 213 648 Annual Programs
Aboriginal Housing Capital Program n.a. 1 322 n.a. Public Housing Construction & Acquisition n.a. 2 130 n.a. Public Housing Capital Maintenance n.a. 8 465 n.a. Minor Projects n.a. 101 n.a. Better Neighbourhoods Program n.a. 1 032 n.a. Total — South Australian Housing Trust 62 327 237 437 Total regional investing expenditure public non–financial corporations
141 926 546 523 Total regional investing expenditure non–financial public sector
500 817 1131 319
(a) The figures quoted represent the estimated regional component of the overall measure.
Chapter 8: Regional South Australia
2017–18 Budget Statement 125

Chapter 8: Regional South Australia
126 2017–18 Budget Statement
Appendix A: Uniform presentation framework
Overview
This appendix contains detailed financial projections for the various sectors of the total public sector defined by the Australian System of Government Finance Statistics: Concepts, Sources and Methods (GFS), published by the Australian Bureau of Statistics (ABS).
The tables in this section satisfy Uniform Presentation Framework (UPF) requirements applicable for all States, territories, and the Commonwealth Government. The tables present budget information for South Australia on the UPF basis, reflecting the fiscal measures and scope outlined below.
The primary objective of the UPF is to ensure that the Commonwealth Government and state and territory governments provide a common ‘core’ of financial information in their budget papers to enable direct comparisons of each government’s budget and financial results.
The GFS requires that provisions for doubtful debts be excluded from the balance sheet. Consistent with the Commonwealth Government’s methodology, South Australia has not adopted this treatment in the UPF reports because excluding such provisions would overstate the value of assets in the balance sheet (and would therefore be inconsistent with the market valuation principle).
Accrual Government Financial Statistics fiscal measures
The key measures in the Government Financial Statistics (GFS) accrual framework are GFS net operating balance, GFS net lending, cash surplus, net debt, net worth, change in net worth, net financial worth and net financial liabilities.
GFS net operating balance
The GFS net operating balance, or operating result, is the excess of revenue from transactions over expenses from transactions. The net operating balance excludes expenditure on the acquisition of capital assets, but includes non-cash costs such as accruing superannuation entitlements and the consumption of capital (depreciation).
Net operating balance reflects the sustainability of government operations and is also known as the change in net worth due to transactions.
GFS net lending/borrowing
GFS net lending/borrowing shows the financing requirements of government, indicating the extent to which government is either putting financial resources at the disposal of other sectors in the economy, or utilising the financial resources generated by other sectors in the economy.
Net lending (which is recorded in the operating statement) differs from the net operating balance in the treatment of capital expenditure. Unlike the net operating balance, net lending includes net capital expenditure, but not the use of capital (depreciation). It is calculated as the GFS Net Operating Balance less the net acquisition of non-financial assets.
2017–18 Budget Statement 127
Net lending is the accrual counterpart of the GFS cash surplus in the cash flow statement. However, the two measures are unlikely to coincide because of the differences arising when transactions are recorded in cash and accrual terms.
A positive result reflects a net lending position and a negative result reflects a net borrowing position.
GFS cash surplus
The GFS cash surplus/deficit is a flow measure reported in the cash flow statement.
The GFS cash surplus has four components:
• net cash received from operating activities — comprising tax revenue plus grants and subsidies received plus revenue from sales of goods and services, less payments for goods and services, interest costs, and grants and subsidies paid
• net cash inflow from sales and purchases of non-financial assets
• the level of distributions paid — in the case of public non-financial corporations and public financial corporations
• the recognition of the initial increase in liability accruing at the beginning of finance leases and similar arrangements.
The cash surplus/deficit is a measure of a sector's cash flow requirements and if positive (i.e. a surplus), it reflects cash available to governments to either increase financial assets or decrease liabilities. When this measure is negative (i.e. a deficit), it identifies the extent to which a government needs to run down its financial assets in order to finance the cash shortfall.
Net debt
Net debt comprises the stock of selected gross financial liabilities less financial assets.
Net debt is reported in the balance sheet and is the sum of deposits held, advances received and borrowing, minus the sum of cash and deposits, advances paid, and investments, loans and placements.
Net worth
Net worth is calculated as total assets (both financial and non-financial) minus total liabilities. Net worth incorporates a government’s non-financial assets, such as land and other fixed assets, which may be sold and used to repay debt, as well as certain financial assets and liabilities not captured by the net debt measure, most notably accrued employee superannuation liabilities, debtors and creditors.
Change in net worth
Change in net worth measures the variation in net worth (as described above), and is the most inclusive measure of the change in a government’s financial position over a given period.
Net financial worth
Net financial worth measures a government’s net holdings of financial assets. It is calculated from the balance sheet as financial assets minus liabilities.
Net financial liabilities
Net financial liabilities comprises total liabilities less financial assets (net financial worth), but excludes equity investments (net worth) in the other sectors of the jurisdiction.
Appendix A: Uniform presentation framework
128 2017–18 Budget Statement
Net financial liabilities is a broader measure than net debt as it includes substantial non-debt liabilities such as accrued superannuation and long service leave entitlements. Excluding the net worth of other sectors of government from net financial worth means that net financial liabilities is a purer measure of financial worth than net financial worth, as, in general, the net worth of other sectors of government, in particular the public non-financial corporations sector, is backed by physical assets.
Scope
The UPF divides the Australian public sector into three institutional sub-sectors — the general government sector, the public non-financial corporations (PNFC) sector and the public financial corporations (PFC) sector.
General government comprises all government departments, offices and other bodies engaged in providing services free of charge or at prices significantly below their cost of production.
PNFCs are bodies mainly engaged in the production of goods and services of a non-financial nature for sale in the marketplace at prices that aim to recover most of the costs involved. This sector includes some trading enterprises, such as SA Water and the South Australian Housing Trust (SAHT). In general, PNFCs are legally distinguishable from the governments that own them.
PFCs are bodies primarily engaged in providing financial intermediation services or auxiliary financial services. Generally, they are able to transact in financial liabilities on their own account.
A listing of government entities within each sector is included in Appendix D.
Budget reporting
Under the UPF agreement, all governments are required to present as part of their budget documentation an operating statement, balance sheet and cash flow statement for the general government sector, PNFC sector and the non-financial public sector. The non-financial public sector is the consolidation of the general government sector and the PNFC sectors. In addition, information is also presented on taxes, general government sector expenses by function and Loan Council Allocations.
This information is presented in tables A.1 through to A.20 in this appendix.
Reporting of outcomes
Outcomes are presented in final budget outcome documents. In addition to the tables presented at budget time, outcome reporting also contains the accrual financial statements for the PFC sector.
Appendix A: Uniform presentation framework
2017–18 Budget Statement 129
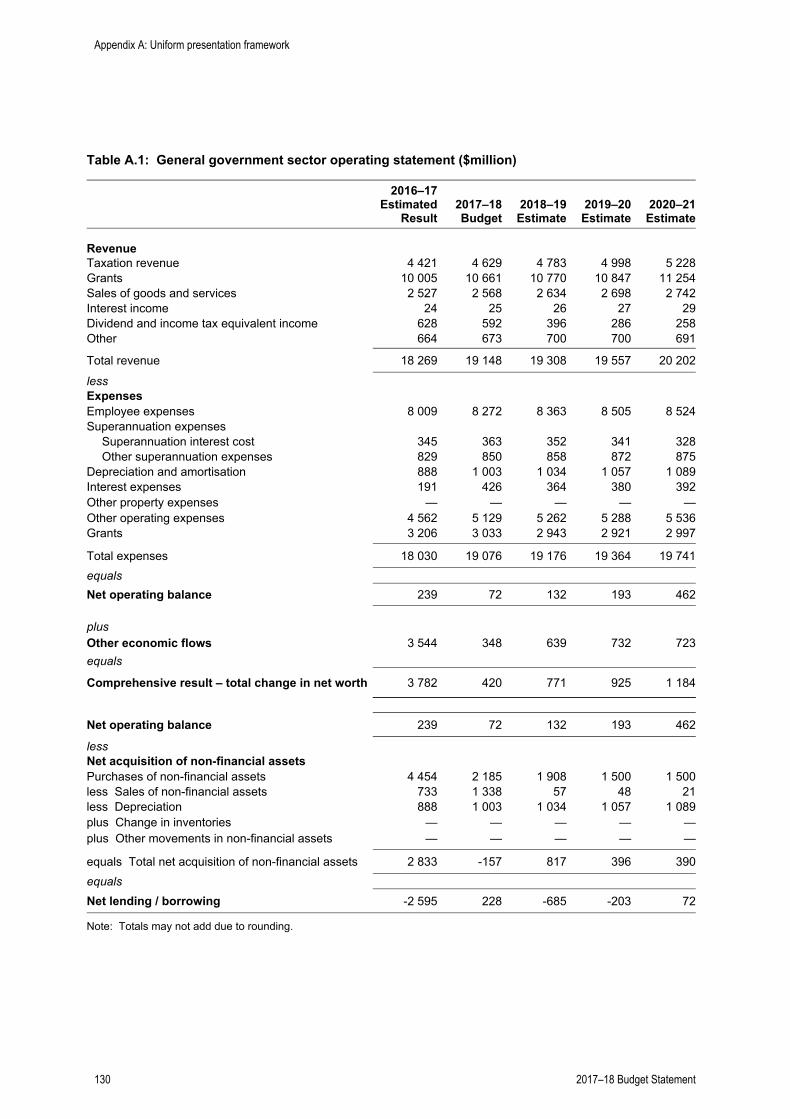
Table A.1: General government sector operating statement ($million)
2016–17Estimated
Result
2017–18Budget
2018–19Estimate
2019–20Estimate
2020–21Estimate
Revenue Taxation revenue 4 421 4 629 4 783 4 998 5 228Grants 10 005 10 661 10 770 10 847 11 254Sales of goods and services 2 527 2 568 2 634 2 698 2 742Interest income 24 25 26 27 29Dividend and income tax equivalent income 628 592 396 286 258Other 664 673 700 700 691
Total revenue 18 269 19 148 19 308 19 557 20 202
lessExpensesEmployee expenses 8 009 8 272 8 363 8 505 8 524Superannuation expenses
Superannuation interest cost 345 363 352 341 328Other superannuation expenses 829 850 858 872 875
Depreciation and amortisation 888 1 003 1 034 1 057 1 089Interest expenses 191 426 364 380 392Other property expenses — — — — —Other operating expenses 4 562 5 129 5 262 5 288 5 536Grants 3 206 3 033 2 943 2 921 2 997
Total expenses 18 030 19 076 19 176 19 364 19 741equalsNet operating balance 239 72 132 193 462
plusOther economic flows 3 544 348 639 732 723equals
Comprehensive result – total change in net worth 3 782 420 771 925 1 184
Net operating balance 239 72 132 193 462
lessNet acquisition of non-financial assetsPurchases of non-financial assets 4 454 2 185 1 908 1 500 1 500less Sales of non-financial assets 733 1 338 57 48 21less Depreciation 888 1 003 1 034 1 057 1 089plus Change in inventories — — — — —plus Other movements in non-financial assets — — — — —
equals Total net acquisition of non-financial assets 2 833 -157 817 396 390equalsNet lending / borrowing -2 595 228 -685 -203 72
Note: Totals may not add due to rounding.
Appendix A: Uniform presentation framework
130 2017–18 Budget Statement

Table A.2: Public non-financial corporations (public trading enterprises) sector operating statement ($million)
2016–17Estimated
Result
2017–18Budget
2018–19Estimate
2019–20Estimate
2020–21Estimate
Revenue Taxation revenue — — — — —Grants 375 419 473 482 491Sales of goods and services 1 638 1 741 1 797 1 815 1 894Interest income 9 6 7 7 8Dividend and income tax equivalent income 4 4 6 1 1Other 170 214 159 147 146
Total revenue 2 196 2 383 2 441 2 451 2 540
lessExpensesEmployee expenses 201 204 205 209 212Superannuation expenses
Superannuation interest cost — — — — —Other superannuation expenses 26 26 26 27 27
Depreciation and amortisation 440 454 473 484 506Interest expenses 287 297 302 311 318Other property expenses 193 238 234 217 221Other operating expenses 1 215 1 253 1 215 1 226 1 300Grants 56 35 36 27 27
Total expenses 2 418 2 507 2 492 2 501 2 610equalsNet operating balance -222 -124 -51 -49 -70
plusOther economic flows 623 572 507 447 452equals
Comprehensive result – total change in net worth 401 448 456 398 381
Net operating balance -222 -124 -51 -49 -70
lessNet acquisition of non-financial assetsPurchases of non-financial assets 1 231 818 697 485 471less Sales of non-financial assets 185 159 157 134 44less Depreciation 440 454 473 484 506plus Change in inventories 9 -14 -20 -17 -67plus Other movements in non-financial assets — — — — —
equals Total net acquisition of non-financial assets 616 190 47 -150 -146equalsNet lending / borrowing -838 -314 -98 101 76
Note: Totals may not add due to rounding.
Appendix A: Uniform presentation framework
2017–18 Budget Statement 131
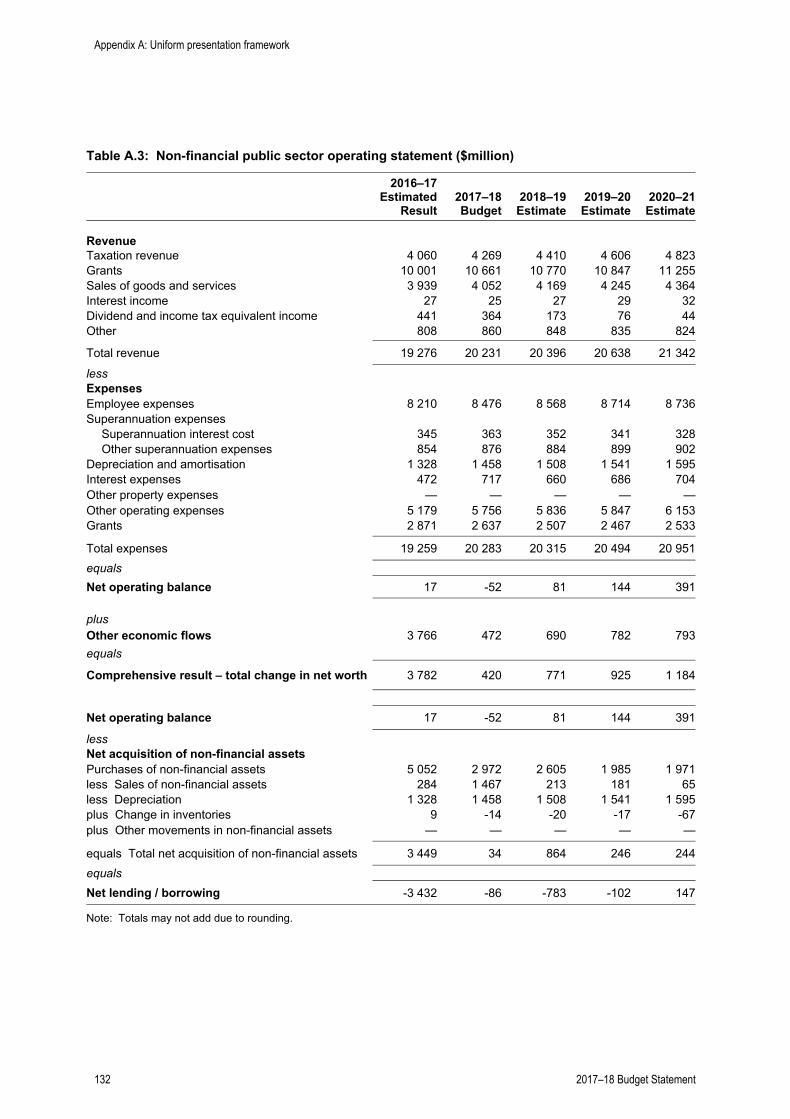
Table A.3: Non-financial public sector operating statement ($million)
2016–17Estimated
Result
2017–18Budget
2018–19Estimate
2019–20Estimate
2020–21Estimate
Revenue Taxation revenue 4 060 4 269 4 410 4 606 4 823Grants 10 001 10 661 10 770 10 847 11 255Sales of goods and services 3 939 4 052 4 169 4 245 4 364Interest income 27 25 27 29 32Dividend and income tax equivalent income 441 364 173 76 44Other 808 860 848 835 824
Total revenue 19 276 20 231 20 396 20 638 21 342
lessExpensesEmployee expenses 8 210 8 476 8 568 8 714 8 736Superannuation expenses
Superannuation interest cost 345 363 352 341 328Other superannuation expenses 854 876 884 899 902
Depreciation and amortisation 1 328 1 458 1 508 1 541 1 595Interest expenses 472 717 660 686 704Other property expenses — — — — —Other operating expenses 5 179 5 756 5 836 5 847 6 153Grants 2 871 2 637 2 507 2 467 2 533
Total expenses 19 259 20 283 20 315 20 494 20 951equalsNet operating balance 17 -52 81 144 391
plusOther economic flows 3 766 472 690 782 793equals
Comprehensive result – total change in net worth 3 782 420 771 925 1 184
Net operating balance 17 -52 81 144 391
lessNet acquisition of non-financial assetsPurchases of non-financial assets 5 052 2 972 2 605 1 985 1 971less Sales of non-financial assets 284 1 467 213 181 65less Depreciation 1 328 1 458 1 508 1 541 1 595plus Change in inventories 9 -14 -20 -17 -67plus Other movements in non-financial assets — — — — —
equals Total net acquisition of non-financial assets 3 449 34 864 246 244equalsNet lending / borrowing -3 432 -86 -783 -102 147
Note: Totals may not add due to rounding.
Appendix A: Uniform presentation framework
132 2017–18 Budget Statement
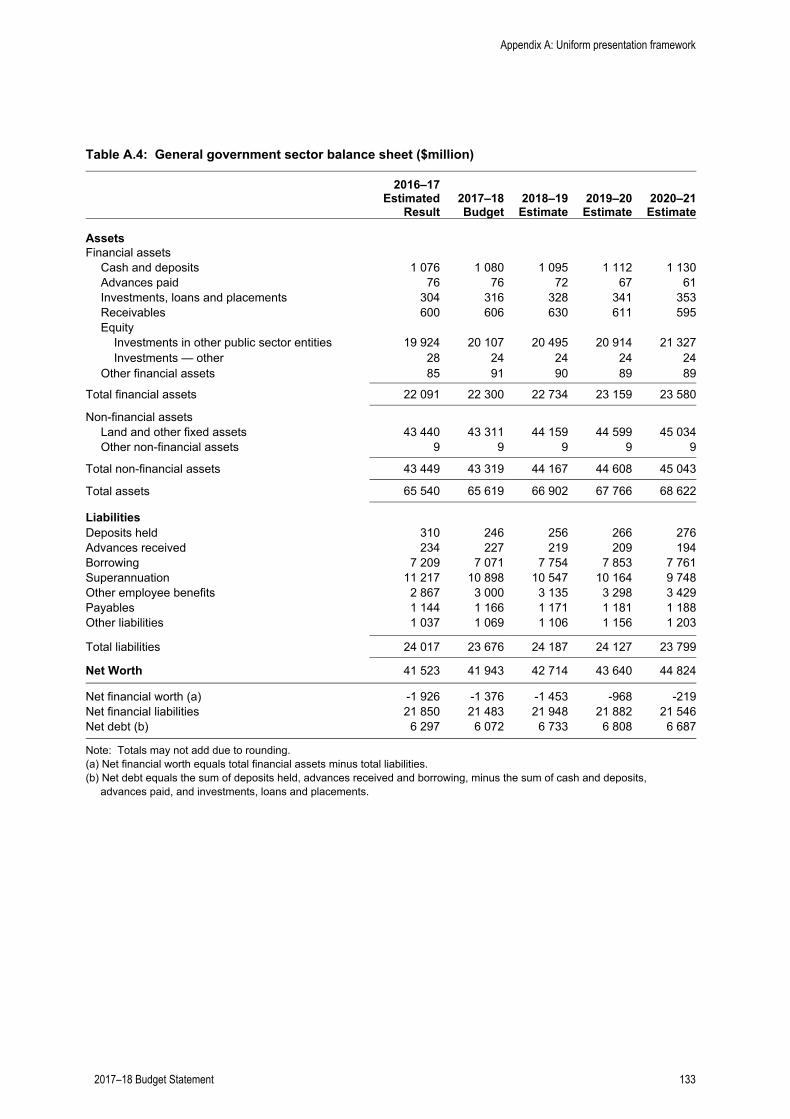
Table A.4: General government sector balance sheet ($million)
2016–17Estimated
Result
2017–18Budget
2018–19Estimate
2019–20Estimate
2020–21Estimate
AssetsFinancial assets
Cash and deposits 1 076 1 080 1 095 1 112 1 130Advances paid 76 76 72 67 61Investments, loans and placements 304 316 328 341 353Receivables 600 606 630 611 595Equity
Investments in other public sector entities 19 924 20 107 20 495 20 914 21 327Investments — other 28 24 24 24 24
Other financial assets 85 91 90 89 89
Total financial assets 22 091 22 300 22 734 23 159 23 580
Non-financial assetsLand and other fixed assets 43 440 43 311 44 159 44 599 45 034Other non-financial assets 9 9 9 9 9
Total non-financial assets 43 449 43 319 44 167 44 608 45 043
Total assets 65 540 65 619 66 902 67 766 68 622
LiabilitiesDeposits held 310 246 256 266 276Advances received 234 227 219 209 194Borrowing 7 209 7 071 7 754 7 853 7 761Superannuation 11 217 10 898 10 547 10 164 9 748Other employee benefits 2 867 3 000 3 135 3 298 3 429Payables 1 144 1 166 1 171 1 181 1 188Other liabilities 1 037 1 069 1 106 1 156 1 203
Total liabilities 24 017 23 676 24 187 24 127 23 799
Net Worth 41 523 41 943 42 714 43 640 44 824
Net financial worth (a) -1 926 -1 376 -1 453 -968 -219Net financial liabilities 21 850 21 483 21 948 21 882 21 546Net debt (b) 6 297 6 072 6 733 6 808 6 687
Note: Totals may not add due to rounding.(a) Net financial worth equals total financial assets minus total liabilities.(b) Net debt equals the sum of deposits held, advances received and borrowing, minus the sum of cash and deposits,
advances paid, and investments, loans and placements.
Appendix A: Uniform presentation framework
2017–18 Budget Statement 133
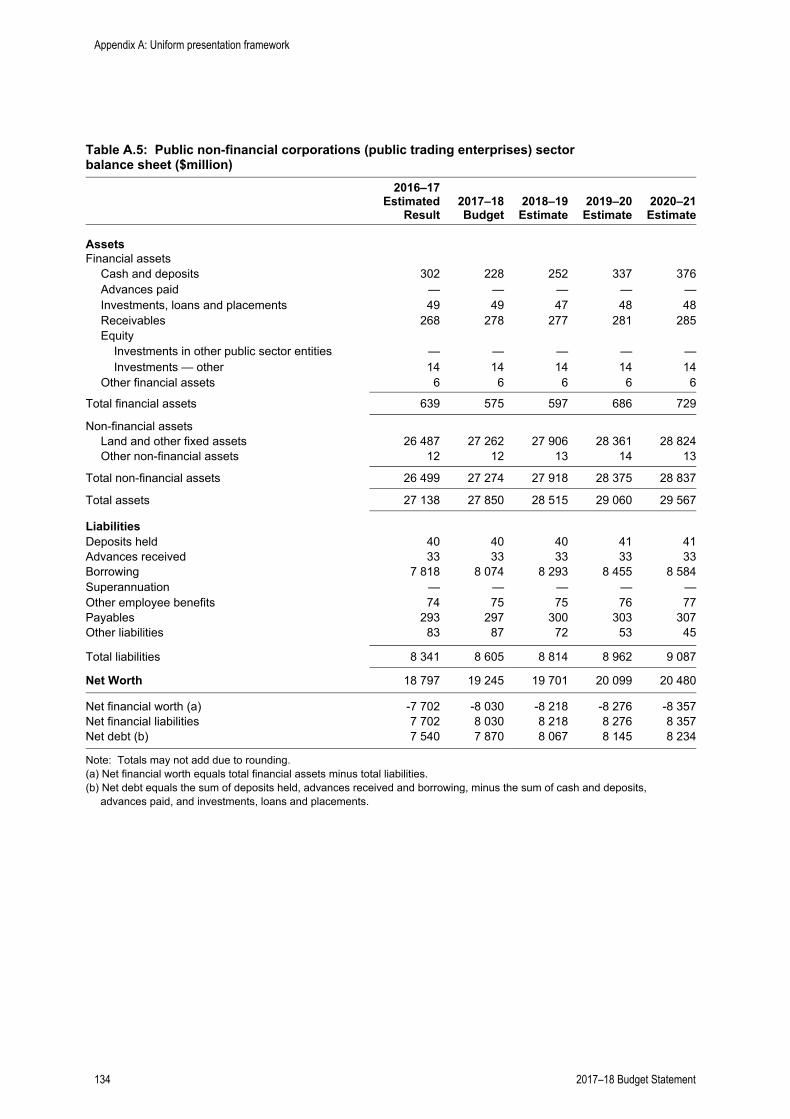
Table A.5: Public non-financial corporations (public trading enterprises) sector balance sheet ($million)
2016–17Estimated
Result
2017–18Budget
2018–19Estimate
2019–20Estimate
2020–21Estimate
AssetsFinancial assets
Cash and deposits 302 228 252 337 376Advances paid — — — — —Investments, loans and placements 49 49 47 48 48Receivables 268 278 277 281 285Equity
Investments in other public sector entities — — — — —Investments — other 14 14 14 14 14
Other financial assets 6 6 6 6 6
Total financial assets 639 575 597 686 729
Non-financial assetsLand and other fixed assets 26 487 27 262 27 906 28 361 28 824Other non-financial assets 12 12 13 14 13
Total non-financial assets 26 499 27 274 27 918 28 375 28 837
Total assets 27 138 27 850 28 515 29 060 29 567
LiabilitiesDeposits held 40 40 40 41 41Advances received 33 33 33 33 33Borrowing 7 818 8 074 8 293 8 455 8 584Superannuation — — — — —Other employee benefits 74 75 75 76 77Payables 293 297 300 303 307Other liabilities 83 87 72 53 45
Total liabilities 8 341 8 605 8 814 8 962 9 087
Net Worth 18 797 19 245 19 701 20 099 20 480
Net financial worth (a) -7 702 -8 030 -8 218 -8 276 -8 357Net financial liabilities 7 702 8 030 8 218 8 276 8 357Net debt (b) 7 540 7 870 8 067 8 145 8 234
Note: Totals may not add due to rounding.(a) Net financial worth equals total financial assets minus total liabilities.(b) Net debt equals the sum of deposits held, advances received and borrowing, minus the sum of cash and deposits,
advances paid, and investments, loans and placements.
Appendix A: Uniform presentation framework
134 2017–18 Budget Statement
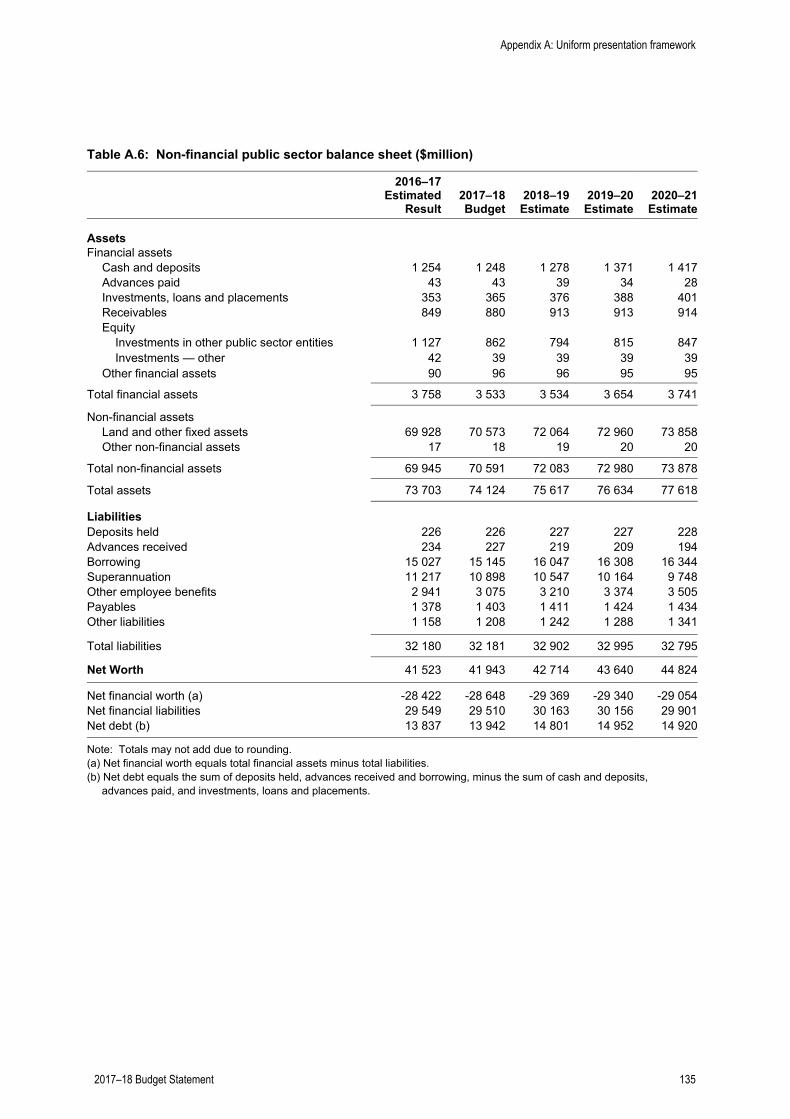
Table A.6: Non-financial public sector balance sheet ($million)
2016–17Estimated
Result
2017–18Budget
2018–19Estimate
2019–20Estimate
2020–21Estimate
AssetsFinancial assets
Cash and deposits 1 254 1 248 1 278 1 371 1 417Advances paid 43 43 39 34 28Investments, loans and placements 353 365 376 388 401Receivables 849 880 913 913 914Equity
Investments in other public sector entities 1 127 862 794 815 847Investments — other 42 39 39 39 39
Other financial assets 90 96 96 95 95
Total financial assets 3 758 3 533 3 534 3 654 3 741
Non-financial assetsLand and other fixed assets 69 928 70 573 72 064 72 960 73 858Other non-financial assets 17 18 19 20 20
Total non-financial assets 69 945 70 591 72 083 72 980 73 878
Total assets 73 703 74 124 75 617 76 634 77 618
LiabilitiesDeposits held 226 226 227 227 228Advances received 234 227 219 209 194Borrowing 15 027 15 145 16 047 16 308 16 344Superannuation 11 217 10 898 10 547 10 164 9 748Other employee benefits 2 941 3 075 3 210 3 374 3 505Payables 1 378 1 403 1 411 1 424 1 434Other liabilities 1 158 1 208 1 242 1 288 1 341
Total liabilities 32 180 32 181 32 902 32 995 32 795
Net Worth 41 523 41 943 42 714 43 640 44 824
Net financial worth (a) -28 422 -28 648 -29 369 -29 340 -29 054Net financial liabilities 29 549 29 510 30 163 30 156 29 901Net debt (b) 13 837 13 942 14 801 14 952 14 920
Note: Totals may not add due to rounding.(a) Net financial worth equals total financial assets minus total liabilities.(b) Net debt equals the sum of deposits held, advances received and borrowing, minus the sum of cash and deposits,
advances paid, and investments, loans and placements.
Appendix A: Uniform presentation framework
2017–18 Budget Statement 135

Table A.7: General government sector cash flow statement ($million)
2016–17Estimated
Result
2017–18Budget
2018–19Estimate
2019–20Estimate
2020–21Estimate
Cash receipts from operating activitiesTaxes received 4 639 4 601 4 782 4 996 5 223Receipts from sales of goods and services 2 512 2 552 2 618 2 682 2 725Grants and subsidies received 9 991 10 661 10 770 10 847 11 254Interest receipts 24 25 26 27 29Dividends and income tax equivalents 674 608 406 302 273Other receipts 674 662 676 710 697
Total operating receipts 18 515 19 108 19 278 19 564 20 202
Cash payments for operating activitiesPayments for employees -9 369 -9 531 -9 638 -9 781 -9 858Payments for goods and services -4 262 -4 766 -4 948 -4 936 -5 208Grants and subsidies paid -3 305 -3 131 -3 076 -3 059 -3 140Interest paid -191 -426 -364 -381 -392Other payments -118 -185 -144 -148 -146
Total operating payments -17 246 -18 039 -18 171 -18 305 -18 743
Net cash flows from operating activities 1 269 1 070 1 106 1 259 1 459
Net cash flows from investmentsin non-financial assetsSales of non-financial assets 697 1 299 48 39 12Purchases of non-financial assets (a) -1 683 -2 165 -1 899 -1 491 -1 491
Net cash flows from investment in non-financialassets -986 -866 -1 850 -1 452 -1 479
Net cash flows from investments in financialassets for policy purposes (b) 576 28 101 165 162
Net cash flows from investments in financialassets for liquidity purposes -12 -9 -12 -12 -12
Net cash flow from financing activities
Advances received (net) — -7 -8 -10 -15Borrowing (net) -667 -131 689 79 -85Deposits received (net) -168 -64 9 10 10Dividends paid — — — — —Other financing (net) 1 — 1 1 1
Net cash flows from financing activities -835 -201 692 80 -89
Net increase/(decrease) in cash held 12 22 36 41 42
Net cash flows from operating activities 1 269 1 070 1 106 1 259 1 459Net cash flows from investmentsin non-financial assets -986 -866 -1 850 -1 452 -1 479
Dividends paid — — — — —
Cash surplus / (deficit) 283 203 -744 -193 -20
Note: Totals may not add due to rounding.(a) The ABS disaggregates this item into new and secondhand non-financial assets.(b) Includes equity acquisitions and disposals.
Appendix A: Uniform presentation framework
136 2017–18 Budget Statement
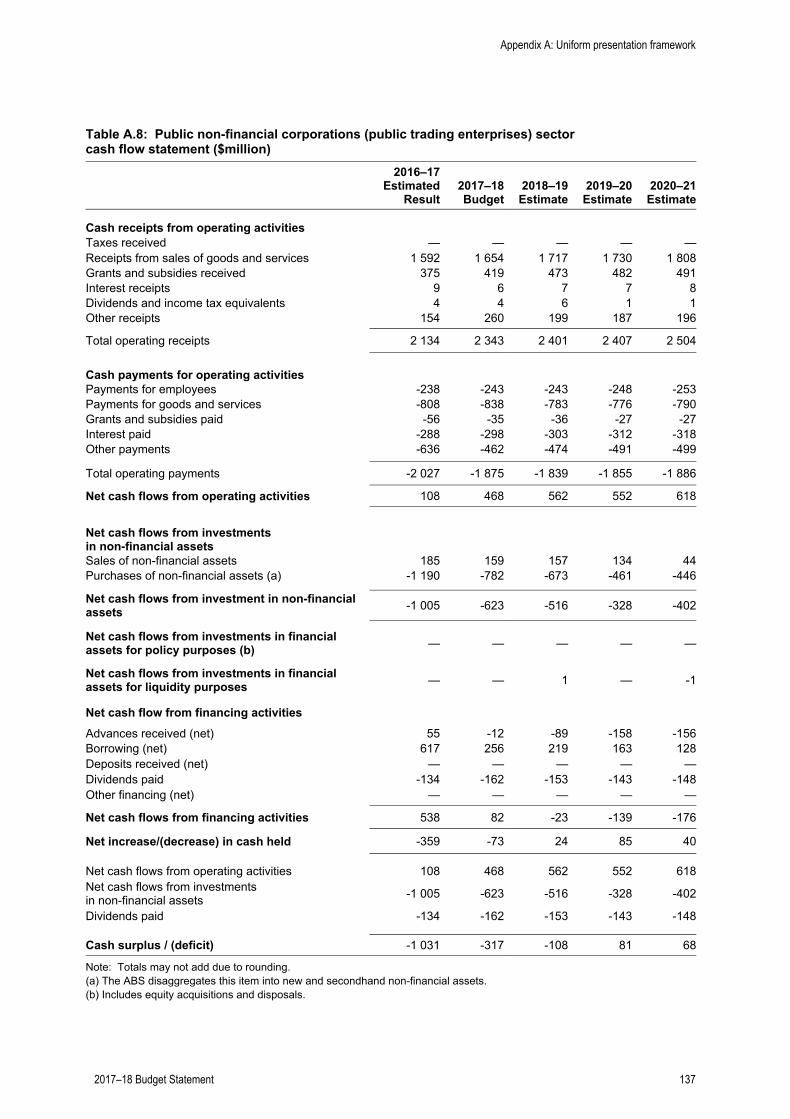
Table A.8: Public non-financial corporations (public trading enterprises) sector cash flow statement ($million)
2016–17Estimated
Result
2017–18Budget
2018–19Estimate
2019–20Estimate
2020–21Estimate
Cash receipts from operating activitiesTaxes received — — — — —Receipts from sales of goods and services 1 592 1 654 1 717 1 730 1 808Grants and subsidies received 375 419 473 482 491Interest receipts 9 6 7 7 8Dividends and income tax equivalents 4 4 6 1 1Other receipts 154 260 199 187 196
Total operating receipts 2 134 2 343 2 401 2 407 2 504
Cash payments for operating activitiesPayments for employees -238 -243 -243 -248 -253Payments for goods and services -808 -838 -783 -776 -790Grants and subsidies paid -56 -35 -36 -27 -27Interest paid -288 -298 -303 -312 -318Other payments -636 -462 -474 -491 -499
Total operating payments -2 027 -1 875 -1 839 -1 855 -1 886
Net cash flows from operating activities 108 468 562 552 618
Net cash flows from investmentsin non-financial assetsSales of non-financial assets 185 159 157 134 44Purchases of non-financial assets (a) -1 190 -782 -673 -461 -446
Net cash flows from investment in non-financialassets -1 005 -623 -516 -328 -402
Net cash flows from investments in financialassets for policy purposes (b) — — — — —
Net cash flows from investments in financialassets for liquidity purposes — — 1 — -1
Net cash flow from financing activities
Advances received (net) 55 -12 -89 -158 -156Borrowing (net) 617 256 219 163 128Deposits received (net) — — — — —Dividends paid -134 -162 -153 -143 -148Other financing (net) — — — — —
Net cash flows from financing activities 538 82 -23 -139 -176
Net increase/(decrease) in cash held -359 -73 24 85 40
Net cash flows from operating activities 108 468 562 552 618Net cash flows from investmentsin non-financial assets -1 005 -623 -516 -328 -402
Dividends paid -134 -162 -153 -143 -148
Cash surplus / (deficit) -1 031 -317 -108 81 68
Note: Totals may not add due to rounding.(a) The ABS disaggregates this item into new and secondhand non-financial assets.(b) Includes equity acquisitions and disposals.
Appendix A: Uniform presentation framework
2017–18 Budget Statement 137
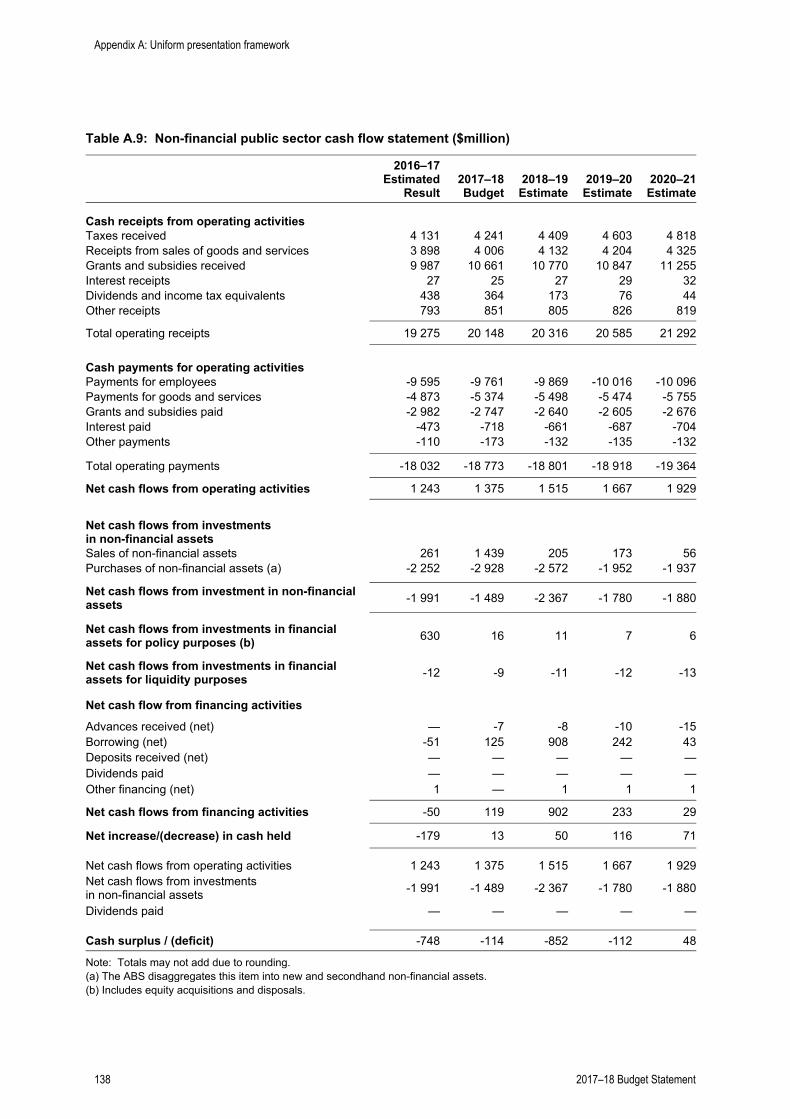
Table A.9: Non-financial public sector cash flow statement ($million)
2016–17Estimated
Result
2017–18Budget
2018–19Estimate
2019–20Estimate
2020–21Estimate
Cash receipts from operating activitiesTaxes received 4 131 4 241 4 409 4 603 4 818Receipts from sales of goods and services 3 898 4 006 4 132 4 204 4 325Grants and subsidies received 9 987 10 661 10 770 10 847 11 255Interest receipts 27 25 27 29 32Dividends and income tax equivalents 438 364 173 76 44Other receipts 793 851 805 826 819
Total operating receipts 19 275 20 148 20 316 20 585 21 292
Cash payments for operating activitiesPayments for employees -9 595 -9 761 -9 869 -10 016 -10 096Payments for goods and services -4 873 -5 374 -5 498 -5 474 -5 755Grants and subsidies paid -2 982 -2 747 -2 640 -2 605 -2 676Interest paid -473 -718 -661 -687 -704Other payments -110 -173 -132 -135 -132
Total operating payments -18 032 -18 773 -18 801 -18 918 -19 364
Net cash flows from operating activities 1 243 1 375 1 515 1 667 1 929
Net cash flows from investmentsin non-financial assetsSales of non-financial assets 261 1 439 205 173 56Purchases of non-financial assets (a) -2 252 -2 928 -2 572 -1 952 -1 937
Net cash flows from investment in non-financialassets -1 991 -1 489 -2 367 -1 780 -1 880
Net cash flows from investments in financialassets for policy purposes (b) 630 16 11 7 6
Net cash flows from investments in financialassets for liquidity purposes -12 -9 -11 -12 -13
Net cash flow from financing activities
Advances received (net) — -7 -8 -10 -15Borrowing (net) -51 125 908 242 43Deposits received (net) — — — — —Dividends paid — — — — —Other financing (net) 1 — 1 1 1
Net cash flows from financing activities -50 119 902 233 29
Net increase/(decrease) in cash held -179 13 50 116 71
Net cash flows from operating activities 1 243 1 375 1 515 1 667 1 929Net cash flows from investmentsin non-financial assets -1 991 -1 489 -2 367 -1 780 -1 880
Dividends paid — — — — —
Cash surplus / (deficit) -748 -114 -852 -112 48
Note: Totals may not add due to rounding.(a) The ABS disaggregates this item into new and secondhand non-financial assets.(b) Includes equity acquisitions and disposals.
Appendix A: Uniform presentation framework
138 2017–18 Budget Statement
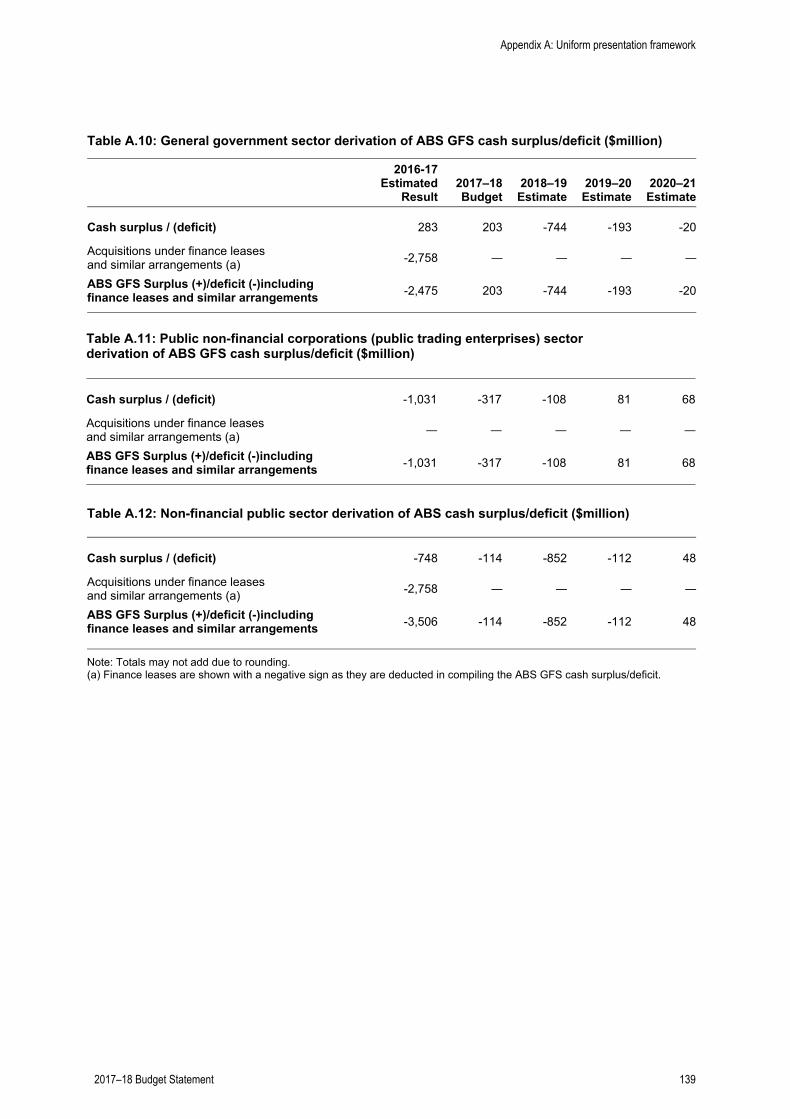
Table A.10: General government sector derivation of ABS GFS cash surplus/deficit ($million)
2016-17Estimated
Result
2017–18Budget
2018–19Estimate
2019–20Estimate
2020–21Estimate
Cash surplus / (deficit) 283 203 -744 -193 -20
Acquisitions under finance leasesand similar arrangements (a) -2,758 — — — —
ABS GFS Surplus (+)/deficit (-)including finance leases and similar arrangements -2,475 203 -744 -193 -20
Table A.11: Public non-financial corporations (public trading enterprises) sectorderivation of ABS GFS cash surplus/deficit ($million)
Cash surplus / (deficit) -1,031 -317 -108 81 68
Acquisitions under finance leasesand similar arrangements (a) — — — — —
ABS GFS Surplus (+)/deficit (-)including finance leases and similar arrangements -1,031 -317 -108 81 68
Table A.12: Non-financial public sector derivation of ABS cash surplus/deficit ($million)
Cash surplus / (deficit) -748 -114 -852 -112 48
Acquisitions under finance leasesand similar arrangements (a) -2,758 — — — —
ABS GFS Surplus (+)/deficit (-)including finance leases and similar arrangements -3,506 -114 -852 -112 48
Note: Totals may not add due to rounding.(a) Finance leases are shown with a negative sign as they are deducted in compiling the ABS GFS cash surplus/deficit.
Appendix A: Uniform presentation framework
2017–18 Budget Statement 139
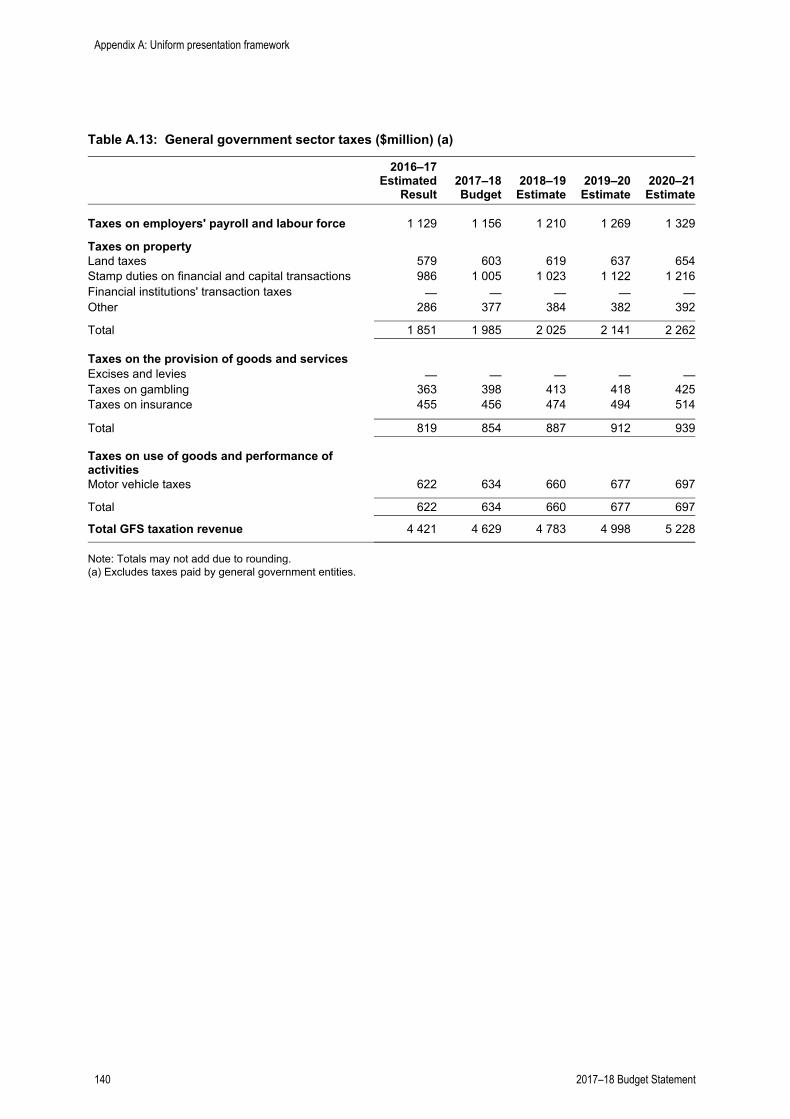
Table A.13: General government sector taxes ($million) (a)
2016–17Estimated
Result
2017–18Budget
2018–19Estimate
2019–20Estimate
2020–21Estimate
Taxes on employers' payroll and labour force 1 129 1 156 1 210 1 269 1 329
Taxes on propertyLand taxes 579 603 619 637 654Stamp duties on financial and capital transactions 986 1 005 1 023 1 122 1 216Financial institutions' transaction taxes — — — — —Other 286 377 384 382 392
Total 1 851 1 985 2 025 2 141 2 262
Taxes on the provision of goods and servicesExcises and levies — — — — —Taxes on gambling 363 398 413 418 425Taxes on insurance 455 456 474 494 514
Total 819 854 887 912 939
Taxes on use of goods and performance of activitiesMotor vehicle taxes 622 634 660 677 697
Total 622 634 660 677 697
Total GFS taxation revenue 4 421 4 629 4 783 4 998 5 228
Note: Totals may not add due to rounding.(a) Excludes taxes paid by general government entities.
Appendix A: Uniform presentation framework
140 2017–18 Budget Statement
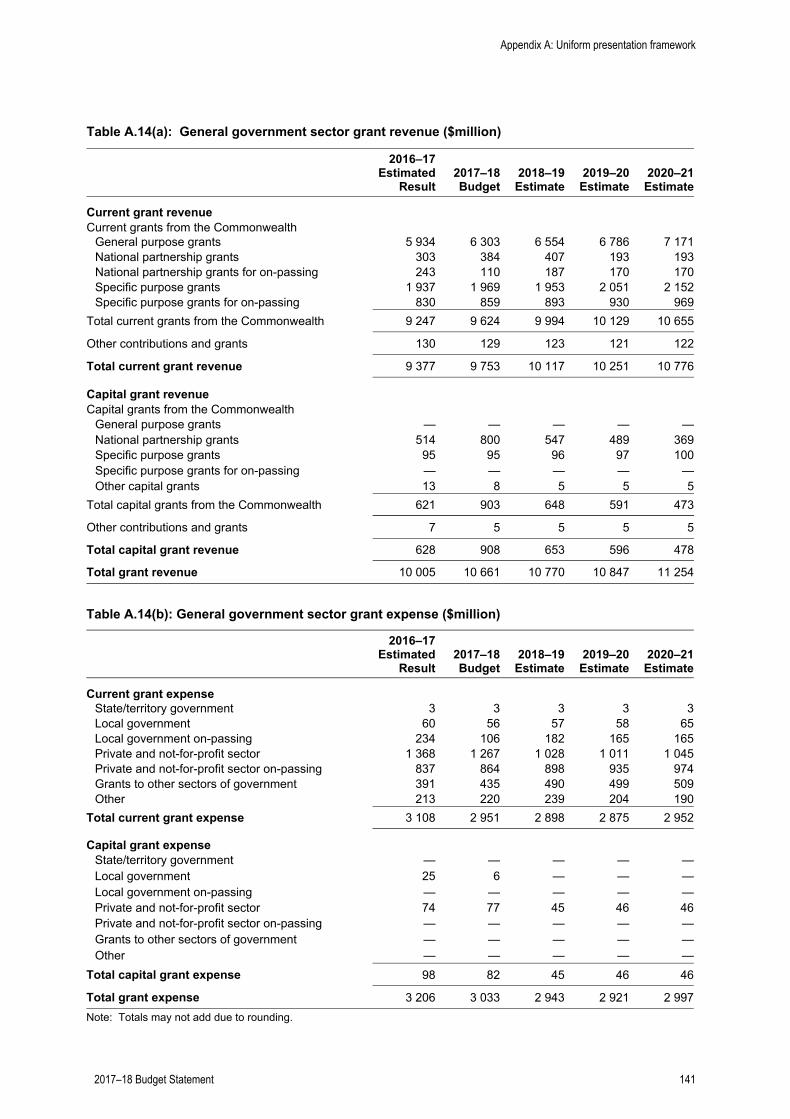
Table A.14(a): General government sector grant revenue ($million)
2016–17Estimated
Result
2017–18Budget
2018–19Estimate
2019–20Estimate
2020–21Estimate
Current grant revenueCurrent grants from the Commonwealth
General purpose grants 5 934 6 303 6 554 6 786 7 171National partnership grants 303 384 407 193 193National partnership grants for on-passing 243 110 187 170 170Specific purpose grants 1 937 1 969 1 953 2 051 2 152Specific purpose grants for on-passing 830 859 893 930 969
Total current grants from the Commonwealth 9 247 9 624 9 994 10 129 10 655
Other contributions and grants 130 129 123 121 122
Total current grant revenue 9 377 9 753 10 117 10 251 10 776
Capital grant revenueCapital grants from the Commonwealth
General purpose grants — — — — —National partnership grants 514 800 547 489 369Specific purpose grants 95 95 96 97 100Specific purpose grants for on-passing — — — — —Other capital grants 13 8 5 5 5
Total capital grants from the Commonwealth 621 903 648 591 473
Other contributions and grants 7 5 5 5 5
Total capital grant revenue 628 908 653 596 478
Total grant revenue 10 005 10 661 10 770 10 847 11 254
Table A.14(b): General government sector grant expense ($million)
2016–17Estimated
Result
2017–18Budget
2018–19Estimate
2019–20Estimate
2020–21Estimate
Current grant expenseState/territory government 3 3 3 3 3Local government 60 56 57 58 65Local government on-passing 234 106 182 165 165Private and not-for-profit sector 1 368 1 267 1 028 1 011 1 045Private and not-for-profit sector on-passing 837 864 898 935 974Grants to other sectors of government 391 435 490 499 509Other 213 220 239 204 190
Total current grant expense 3 108 2 951 2 898 2 875 2 952
Capital grant expenseState/territory government — — — — —Local government 25 6 — — —Local government on-passing — — — — —Private and not-for-profit sector 74 77 45 46 46Private and not-for-profit sector on-passing — — — — —Grants to other sectors of government — — — — —Other — — — — —
Total capital grant expense 98 82 45 46 46
Total grant expense 3 206 3 033 2 943 2 921 2 997Note: Totals may not add due to rounding.
Appendix A: Uniform presentation framework
2017–18 Budget Statement 141
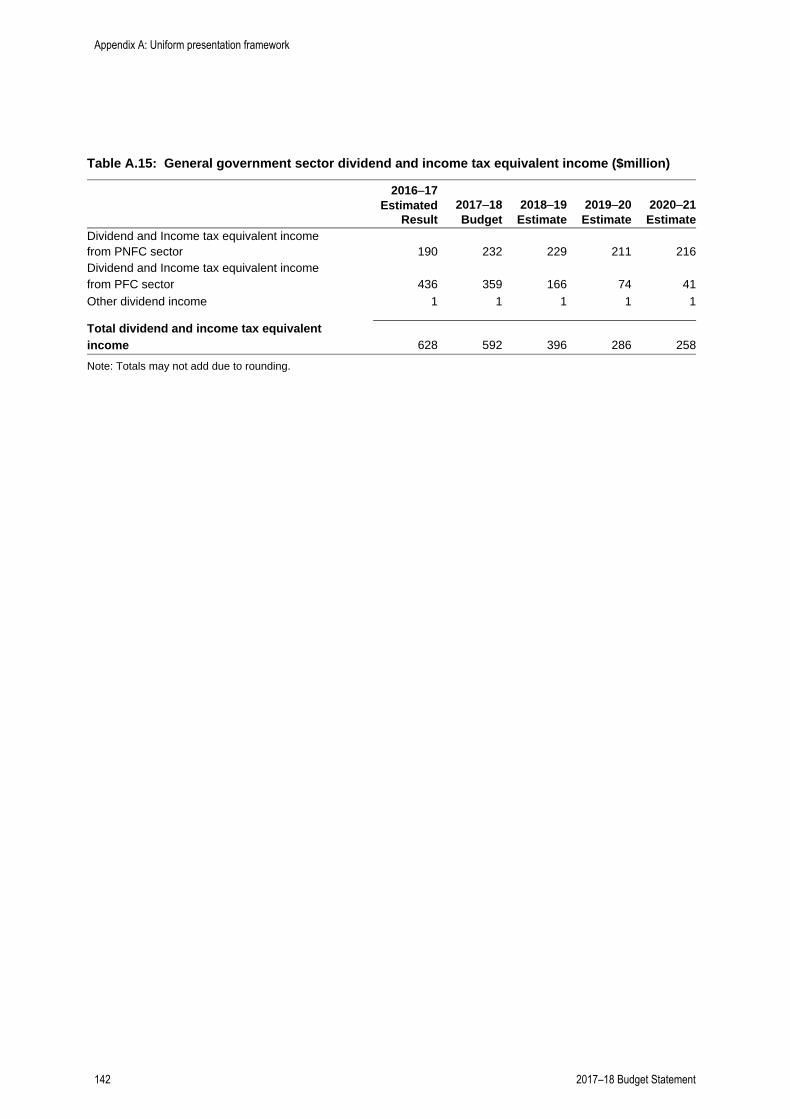
Table A.15: General government sector dividend and income tax equivalent income ($million)
2016–17Estimated
Result
2017–18Budget
2018–19Estimate
2019–20Estimate
2020–21Estimate
Dividend and Income tax equivalent incomefrom PNFC sector 190 232 229 211 216Dividend and Income tax equivalent incomefrom PFC sector 436 359 166 74 41Other dividend income 1 1 1 1 1
Total dividend and income tax equivalent income 628 592 396 286 258
Note: Totals may not add due to rounding.
Appendix A: Uniform presentation framework
142 2017–18 Budget Statement
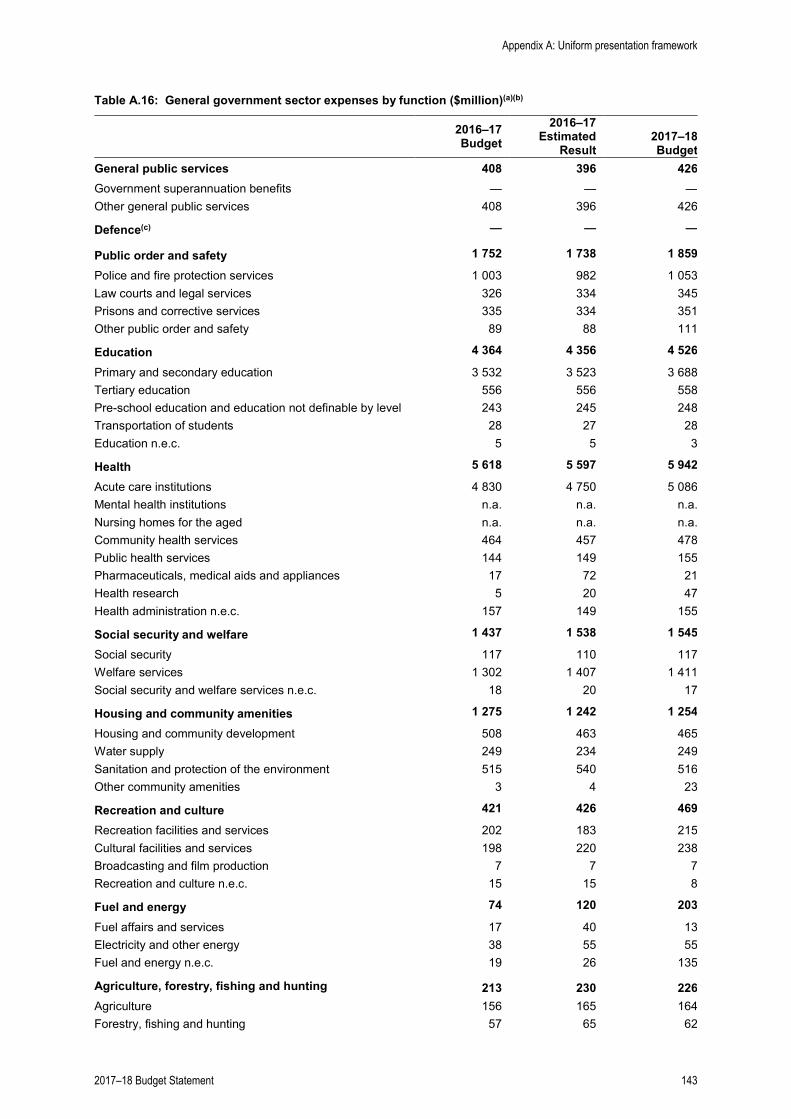
Table A.16: General government sector expenses by function ($million)(a)(b)
2016–17 Budget
2016–17 Estimated
Result
2017–18 Budget
General public services 408 396 426 Government superannuation benefits — — — Other general public services 408 396 426
Defence(c) — — —
Public order and safety 1 752 1 738 1 859
Police and fire protection services 1 003 982 1 053 Law courts and legal services 326 334 345 Prisons and corrective services 335 334 351 Other public order and safety 89 88 111
Education 4 364 4 356 4 526
Primary and secondary education 3 532 3 523 3 688 Tertiary education 556 556 558 Pre-school education and education not definable by level 243 245 248 Transportation of students 28 27 28 Education n.e.c. 5 5 3
Health 5 618 5 597 5 942
Acute care institutions 4 830 4 750 5 086 Mental health institutions n.a. n.a. n.a. Nursing homes for the aged n.a. n.a. n.a. Community health services 464 457 478 Public health services 144 149 155 Pharmaceuticals, medical aids and appliances 17 72 21 Health research 5 20 47 Health administration n.e.c. 157 149 155
Social security and welfare 1 437 1 538 1 545
Social security 117 110 117 Welfare services 1 302 1 407 1 411 Social security and welfare services n.e.c. 18 20 17
Housing and community amenities 1 275 1 242 1 254
Housing and community development 508 463 465 Water supply 249 234 249 Sanitation and protection of the environment 515 540 516 Other community amenities 3 4 23
Recreation and culture 421 426 469
Recreation facilities and services 202 183 215 Cultural facilities and services 198 220 238 Broadcasting and film production 7 7 7 Recreation and culture n.e.c. 15 15 8
Fuel and energy 74 120 203
Fuel affairs and services 17 40 13 Electricity and other energy 38 55 55 Fuel and energy n.e.c. 19 26 135
Agriculture, forestry, fishing and hunting 213 230 226 Agriculture 156 165 164 Forestry, fishing and hunting 57 65 62
Appendix A: Uniform presentation framework
2017–18 Budget Statement 143
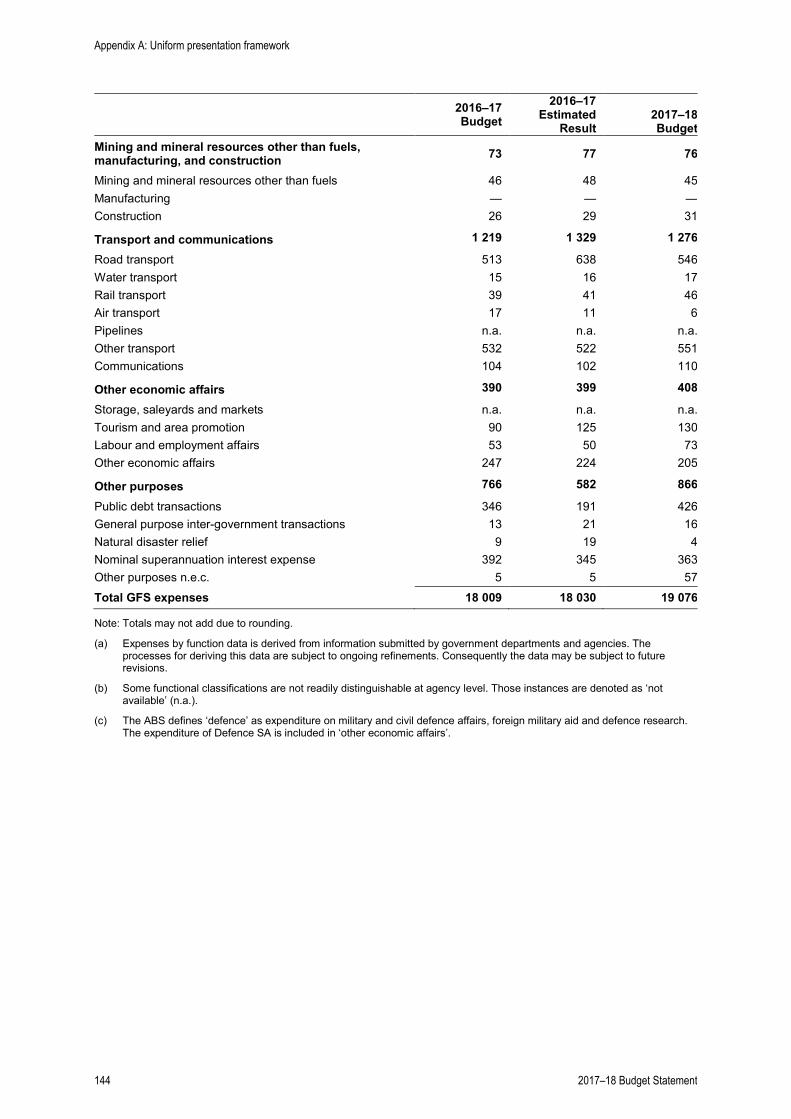
2016–17 Budget
2016–17 Estimated
Result
2017–18 Budget
Mining and mineral resources other than fuels, manufacturing, and construction 73 77 76
Mining and mineral resources other than fuels 46 48 45 Manufacturing — — — Construction 26 29 31
Transport and communications 1 219 1 329 1 276
Road transport 513 638 546 Water transport 15 16 17 Rail transport 39 41 46 Air transport 17 11 6 Pipelines n.a. n.a. n.a. Other transport 532 522 551 Communications 104 102 110
Other economic affairs 390 399 408
Storage, saleyards and markets n.a. n.a. n.a. Tourism and area promotion 90 125 130 Labour and employment affairs 53 50 73 Other economic affairs 247 224 205
Other purposes 766 582 866
Public debt transactions 346 191 426 General purpose inter-government transactions 13 21 16 Natural disaster relief 9 19 4 Nominal superannuation interest expense 392 345 363 Other purposes n.e.c. 5 5 57 Total GFS expenses 18 009 18 030 19 076
Note: Totals may not add due to rounding.
(a) Expenses by function data is derived from information submitted by government departments and agencies. The processes for deriving this data are subject to ongoing refinements. Consequently the data may be subject to future revisions.
(b) Some functional classifications are not readily distinguishable at agency level. Those instances are denoted as ‘not available’ (n.a.).
(c) The ABS defines ‘defence’ as expenditure on military and civil defence affairs, foreign military aid and defence research. The expenditure of Defence SA is included in ‘other economic affairs’.
Appendix A: Uniform presentation framework
144 2017–18 Budget Statement
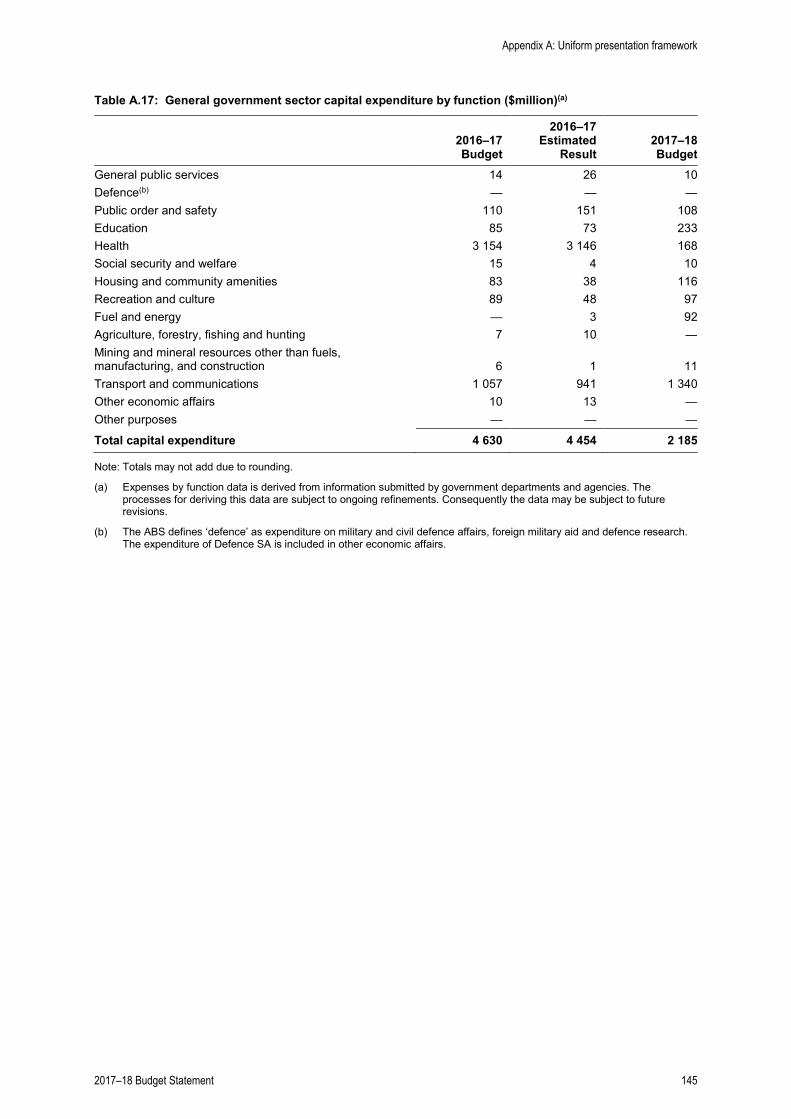
Table A.17: General government sector capital expenditure by function ($million)(a)
2016–17 Budget
2016–17 Estimated
Result 2017–18 Budget
General public services 14 26 10 Defence(b) — — — Public order and safety 110 151 108 Education 85 73 233 Health 3 154 3 146 168 Social security and welfare 15 4 10 Housing and community amenities 83 38 116 Recreation and culture 89 48 97 Fuel and energy — 3 92 Agriculture, forestry, fishing and hunting 7 10 — Mining and mineral resources other than fuels, manufacturing, and construction 6 1 11 Transport and communications 1 057 941 1 340 Other economic affairs 10 13 — Other purposes — — —
Total capital expenditure 4 630 4 454 2 185
Note: Totals may not add due to rounding.
(a) Expenses by function data is derived from information submitted by government departments and agencies. The processes for deriving this data are subject to ongoing refinements. Consequently the data may be subject to future revisions.
(b) The ABS defines ‘defence’ as expenditure on military and civil defence affairs, foreign military aid and defence research. The expenditure of Defence SA is included in other economic affairs.
Appendix A: Uniform presentation framework
2017–18 Budget Statement 145
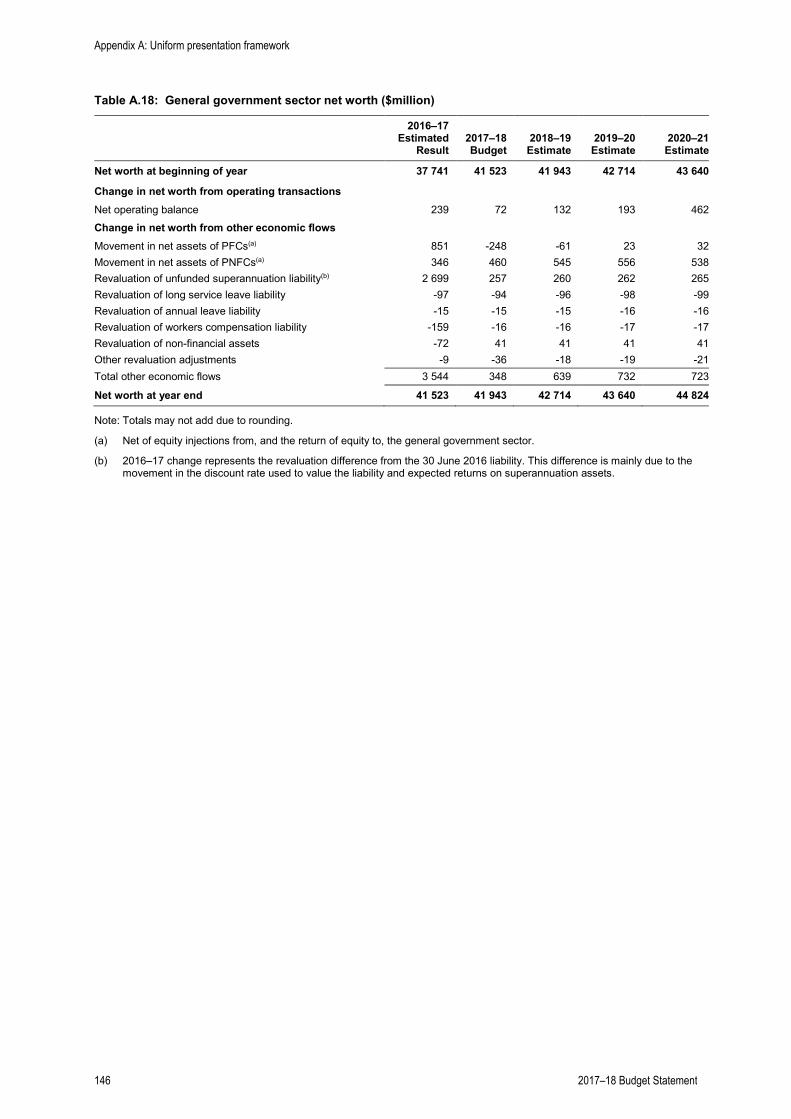
Table A.18: General government sector net worth ($million)
2016–17 Estimated
Result 2017–18 Budget
2018–19 Estimate
2019–20 Estimate
2020–21 Estimate
Net worth at beginning of year 37 741 41 523 41 943 42 714 43 640
Change in net worth from operating transactions Net operating balance 239 72 132 193 462 Change in net worth from other economic flows Movement in net assets of PFCs(a) 851 -248 -61 23 32 Movement in net assets of PNFCs(a) 346 460 545 556 538 Revaluation of unfunded superannuation liability(b) 2 699 257 260 262 265 Revaluation of long service leave liability -97 -94 -96 -98 -99 Revaluation of annual leave liability -15 -15 -15 -16 -16 Revaluation of workers compensation liability -159 -16 -16 -17 -17 Revaluation of non-financial assets -72 41 41 41 41 Other revaluation adjustments -9 -36 -18 -19 -21 Total other economic flows 3 544 348 639 732 723
Net worth at year end 41 523 41 943 42 714 43 640 44 824
Note: Totals may not add due to rounding.
(a) Net of equity injections from, and the return of equity to, the general government sector.
(b) 2016–17 change represents the revaluation difference from the 30 June 2016 liability. This difference is mainly due to the movement in the discount rate used to value the liability and expected returns on superannuation assets.
Appendix A: Uniform presentation framework
146 2017–18 Budget Statement
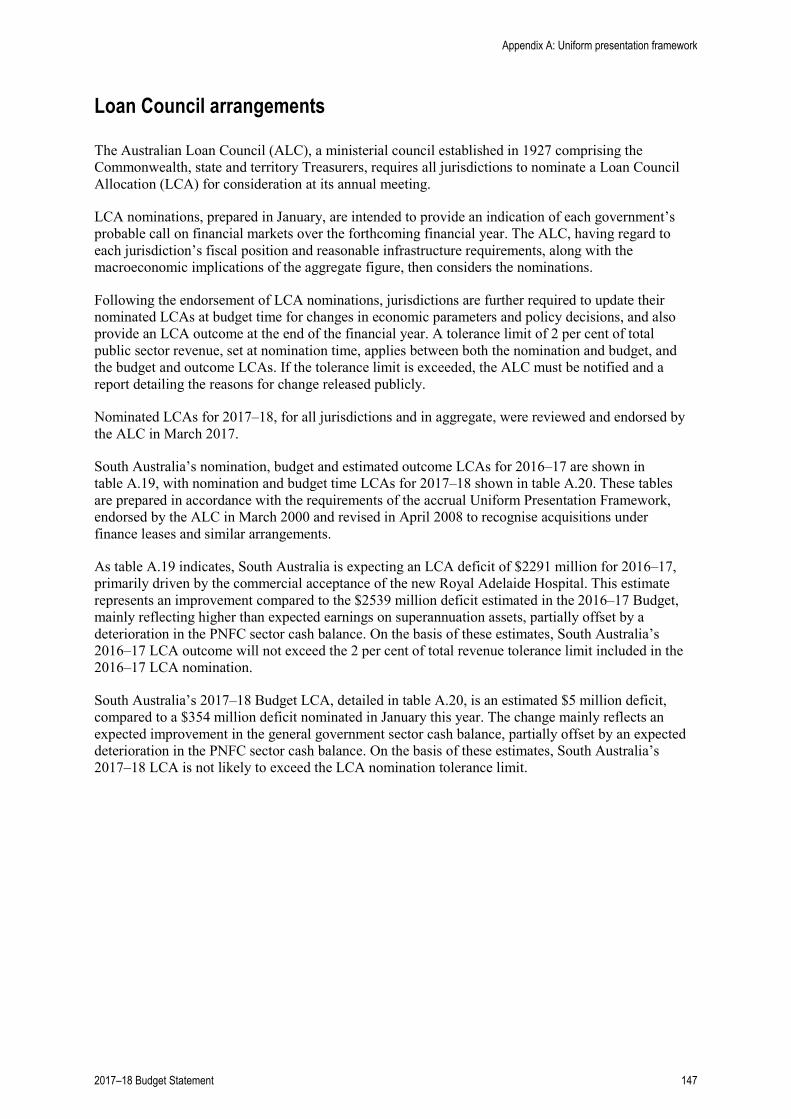
Loan Council arrangements
The Australian Loan Council (ALC), a ministerial council established in 1927 comprising the Commonwealth, state and territory Treasurers, requires all jurisdictions to nominate a Loan Council Allocation (LCA) for consideration at its annual meeting.
LCA nominations, prepared in January, are intended to provide an indication of each government’s probable call on financial markets over the forthcoming financial year. The ALC, having regard to each jurisdiction’s fiscal position and reasonable infrastructure requirements, along with the macroeconomic implications of the aggregate figure, then considers the nominations.
Following the endorsement of LCA nominations, jurisdictions are further required to update their nominated LCAs at budget time for changes in economic parameters and policy decisions, and also provide an LCA outcome at the end of the financial year. A tolerance limit of 2 per cent of total public sector revenue, set at nomination time, applies between both the nomination and budget, and the budget and outcome LCAs. If the tolerance limit is exceeded, the ALC must be notified and a report detailing the reasons for change released publicly.
Nominated LCAs for 2017–18, for all jurisdictions and in aggregate, were reviewed and endorsed by the ALC in March 2017.
South Australia’s nomination, budget and estimated outcome LCAs for 2016–17 are shown in table A.19, with nomination and budget time LCAs for 2017–18 shown in table A.20. These tables are prepared in accordance with the requirements of the accrual Uniform Presentation Framework, endorsed by the ALC in March 2000 and revised in April 2008 to recognise acquisitions under finance leases and similar arrangements.
As table A.19 indicates, South Australia is expecting an LCA deficit of $2291 million for 2016–17, primarily driven by the commercial acceptance of the new Royal Adelaide Hospital. This estimate represents an improvement compared to the $2539 million deficit estimated in the 2016–17 Budget, mainly reflecting higher than expected earnings on superannuation assets, partially offset by a deterioration in the PNFC sector cash balance. On the basis of these estimates, South Australia’s 2016–17 LCA outcome will not exceed the 2 per cent of total revenue tolerance limit included in the 2016–17 LCA nomination.
South Australia’s 2017–18 Budget LCA, detailed in table A.20, is an estimated $5 million deficit, compared to a $354 million deficit nominated in January this year. The change mainly reflects an expected improvement in the general government sector cash balance, partially offset by an expected deterioration in the PNFC sector cash balance. On the basis of these estimates, South Australia’s 2017–18 LCA is not likely to exceed the LCA nomination tolerance limit.
Appendix A: Uniform presentation framework
2017–18 Budget Statement 147
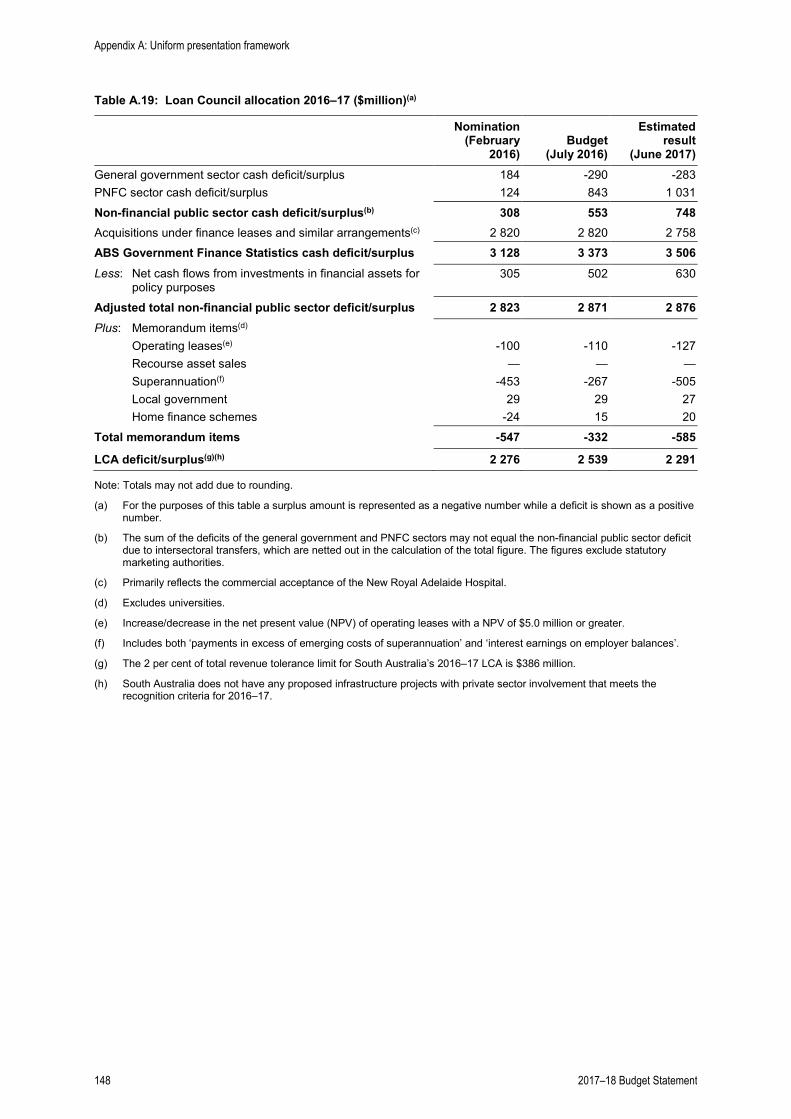
Table A.19: Loan Council allocation 2016–17 ($million)(a)
Nomination (February
2016) Budget
(July 2016)
Estimated result
(June 2017) General government sector cash deficit/surplus 184 -290 -283 PNFC sector cash deficit/surplus 124 843 1 031 Non-financial public sector cash deficit/surplus(b) 308 553 748 Acquisitions under finance leases and similar arrangements(c) 2 820 2 820 2 758 ABS Government Finance Statistics cash deficit/surplus 3 128 3 373 3 506 Less: Net cash flows from investments in financial assets for
policy purposes 305 502 630
Adjusted total non-financial public sector deficit/surplus 2 823 2 871 2 876 Plus: Memorandum items(d)
Operating leases(e) -100 -110 -127 Recourse asset sales — — — Superannuation(f) -453 -267 -505 Local government 29 29 27 Home finance schemes -24 15 20
Total memorandum items -547 -332 -585
LCA deficit/surplus(g)(h) 2 276 2 539 2 291
Note: Totals may not add due to rounding.
(a) For the purposes of this table a surplus amount is represented as a negative number while a deficit is shown as a positive number.
(b) The sum of the deficits of the general government and PNFC sectors may not equal the non-financial public sector deficit due to intersectoral transfers, which are netted out in the calculation of the total figure. The figures exclude statutory marketing authorities.
(c) Primarily reflects the commercial acceptance of the New Royal Adelaide Hospital.
(d) Excludes universities.
(e) Increase/decrease in the net present value (NPV) of operating leases with a NPV of $5.0 million or greater.
(f) Includes both ‘payments in excess of emerging costs of superannuation’ and ‘interest earnings on employer balances’.
(g) The 2 per cent of total revenue tolerance limit for South Australia’s 2016–17 LCA is $386 million.
(h) South Australia does not have any proposed infrastructure projects with private sector involvement that meets the recognition criteria for 2016–17.
Appendix A: Uniform presentation framework
148 2017–18 Budget Statement
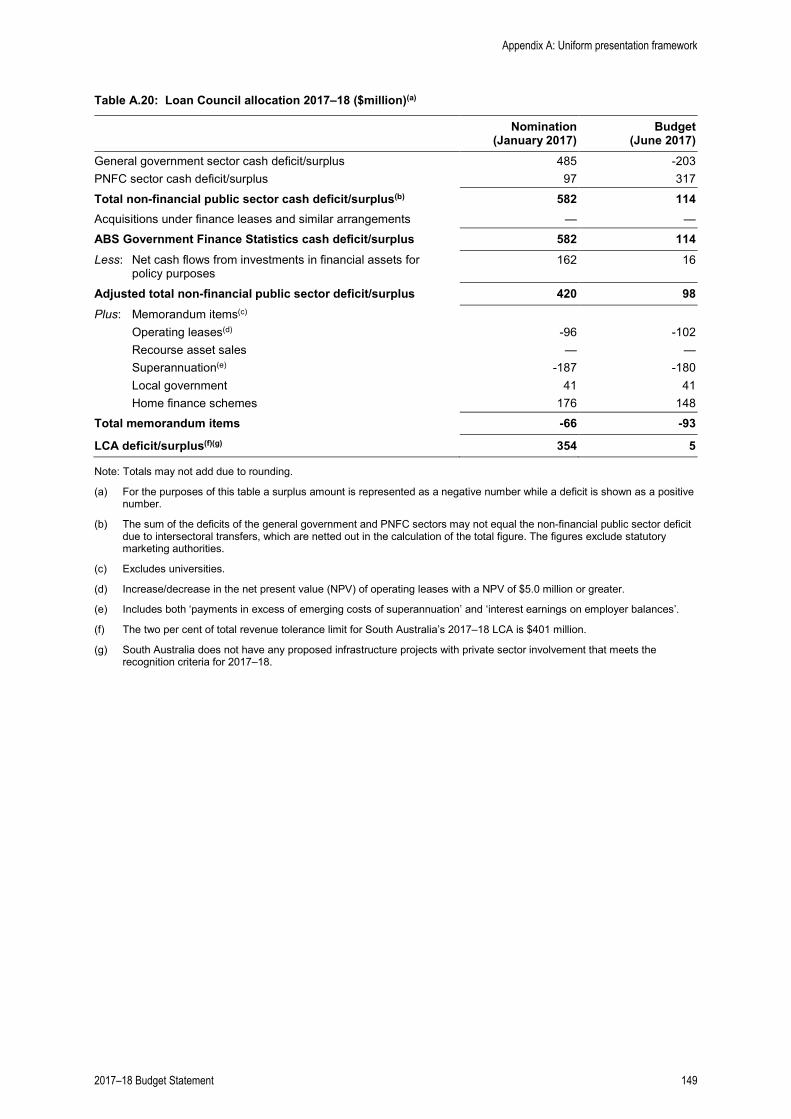
Table A.20: Loan Council allocation 2017–18 ($million)(a)
Nomination (January 2017)
Budget (June 2017)
General government sector cash deficit/surplus 485 -203 PNFC sector cash deficit/surplus 97 317 Total non-financial public sector cash deficit/surplus(b) 582 114 Acquisitions under finance leases and similar arrangements — — ABS Government Finance Statistics cash deficit/surplus 582 114 Less: Net cash flows from investments in financial assets for
policy purposes 162 16
Adjusted total non-financial public sector deficit/surplus 420 98 Plus: Memorandum items(c)
Operating leases(d) -96 -102 Recourse asset sales — — Superannuation(e) -187 -180 Local government 41 41 Home finance schemes 176 148
Total memorandum items -66 -93
LCA deficit/surplus(f)(g) 354 5
Note: Totals may not add due to rounding.
(a) For the purposes of this table a surplus amount is represented as a negative number while a deficit is shown as a positive number.
(b) The sum of the deficits of the general government and PNFC sectors may not equal the non-financial public sector deficit due to intersectoral transfers, which are netted out in the calculation of the total figure. The figures exclude statutory marketing authorities.
(c) Excludes universities.
(d) Increase/decrease in the net present value (NPV) of operating leases with a NPV of $5.0 million or greater.
(e) Includes both ‘payments in excess of emerging costs of superannuation’ and ‘interest earnings on employer balances’.
(f) The two per cent of total revenue tolerance limit for South Australia’s 2017–18 LCA is $401 million.
(g) South Australia does not have any proposed infrastructure projects with private sector involvement that meets the recognition criteria for 2017–18.
Appendix A: Uniform presentation framework
2017–18 Budget Statement 149

Appendix A: Uniform presentation framework
150 2017–18 Budget Statement
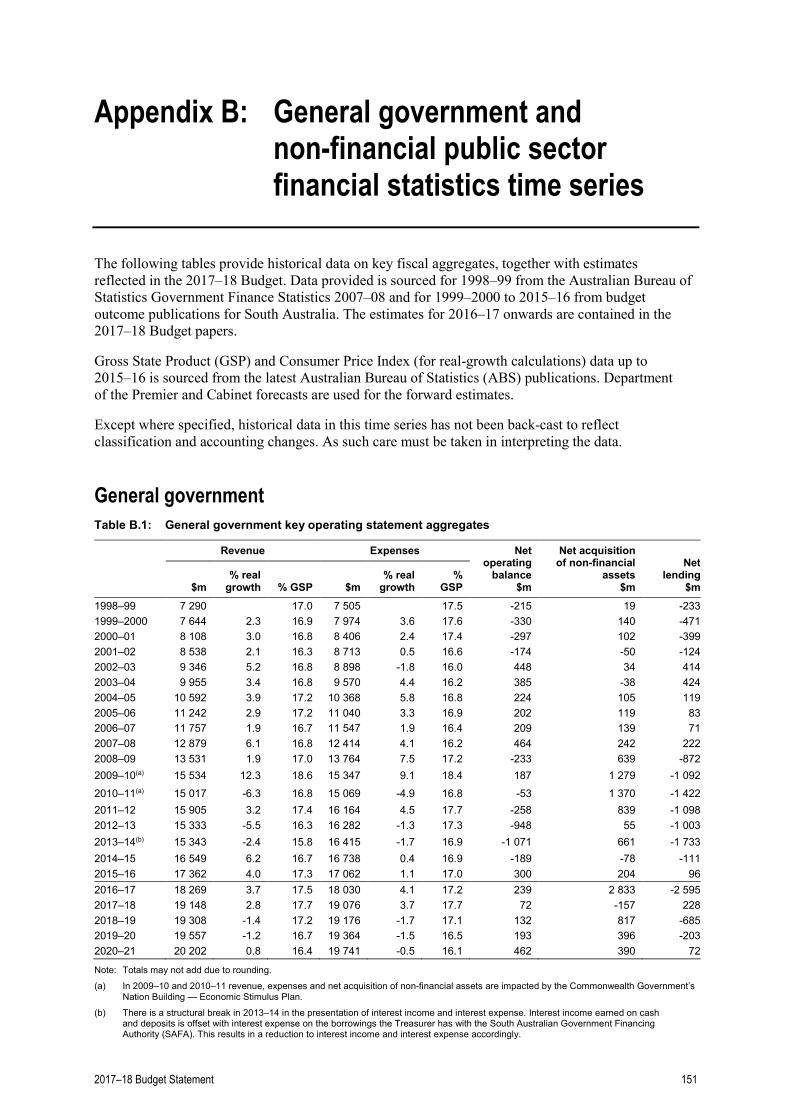
Appendix B: General government and non-financial public sector financial statistics time series
The following tables provide historical data on key fiscal aggregates, together with estimates reflected in the 2017–18 Budget. Data provided is sourced for 1998–99 from the Australian Bureau of Statistics Government Finance Statistics 2007–08 and for 1999–2000 to 2015–16 from budget outcome publications for South Australia. The estimates for 2016–17 onwards are contained in the 2017–18 Budget papers.
Gross State Product (GSP) and Consumer Price Index (for real-growth calculations) data up to 2015–16 is sourced from the latest Australian Bureau of Statistics (ABS) publications. Department of the Premier and Cabinet forecasts are used for the forward estimates.
Except where specified, historical data in this time series has not been back-cast to reflect classification and accounting changes. As such care must be taken in interpreting the data.
General government Table B.1: General government key operating statement aggregates
Revenue Expenses Net operating
balance $m
Net acquisition of non-financial
assets $m
Net lending
$m $m % real
growth % GSP $m % real
growth %
GSP 1998–99 7 290 17.0 7 505 17.5 -215 19 -233 1999–2000 7 644 2.3 16.9 7 974 3.6 17.6 -330 140 -471 2000–01 8 108 3.0 16.8 8 406 2.4 17.4 -297 102 -399 2001–02 8 538 2.1 16.3 8 713 0.5 16.6 -174 -50 -124 2002–03 9 346 5.2 16.8 8 898 -1.8 16.0 448 34 414 2003–04 9 955 3.4 16.8 9 570 4.4 16.2 385 -38 424 2004–05 10 592 3.9 17.2 10 368 5.8 16.8 224 105 119 2005–06 11 242 2.9 17.2 11 040 3.3 16.9 202 119 83 2006–07 11 757 1.9 16.7 11 547 1.9 16.4 209 139 71 2007–08 12 879 6.1 16.8 12 414 4.1 16.2 464 242 222 2008–09 13 531 1.9 17.0 13 764 7.5 17.2 -233 639 -872 2009–10(a) 15 534 12.3 18.6 15 347 9.1 18.4 187 1 279 -1 092 2010–11(a) 15 017 -6.3 16.8 15 069 -4.9 16.8 -53 1 370 -1 422 2011–12 15 905 3.2 17.4 16 164 4.5 17.7 -258 839 -1 098 2012–13 15 333 -5.5 16.3 16 282 -1.3 17.3 -948 55 -1 003 2013–14(b) 15 343 -2.4 15.8 16 415 -1.7 16.9 -1 071 661 -1 733 2014–15 16 549 6.2 16.7 16 738 0.4 16.9 -189 -78 -111 2015–16 17 362 4.0 17.3 17 062 1.1 17.0 300 204 96 2016–17 18 269 3.7 17.5 18 030 4.1 17.2 239 2 833 -2 595 2017–18 19 148 2.8 17.7 19 076 3.7 17.7 72 -157 228 2018–19 19 308 -1.4 17.2 19 176 -1.7 17.1 132 817 -685 2019–20 19 557 -1.2 16.7 19 364 -1.5 16.5 193 396 -203 2020–21 20 202 0.8 16.4 19 741 -0.5 16.1 462 390 72
Note: Totals may not add due to rounding.
(a) In 2009–10 and 2010–11 revenue, expenses and net acquisition of non-financial assets are impacted by the Commonwealth Government’s Nation Building — Economic Stimulus Plan.
(b) There is a structural break in 2013–14 in the presentation of interest income and interest expense. Interest income earned on cash and deposits is offset with interest expense on the borrowings the Treasurer has with the South Australian Government Financing Authority (SAFA). This results in a reduction to interest income and interest expense accordingly.
2017–18 Budget Statement 151
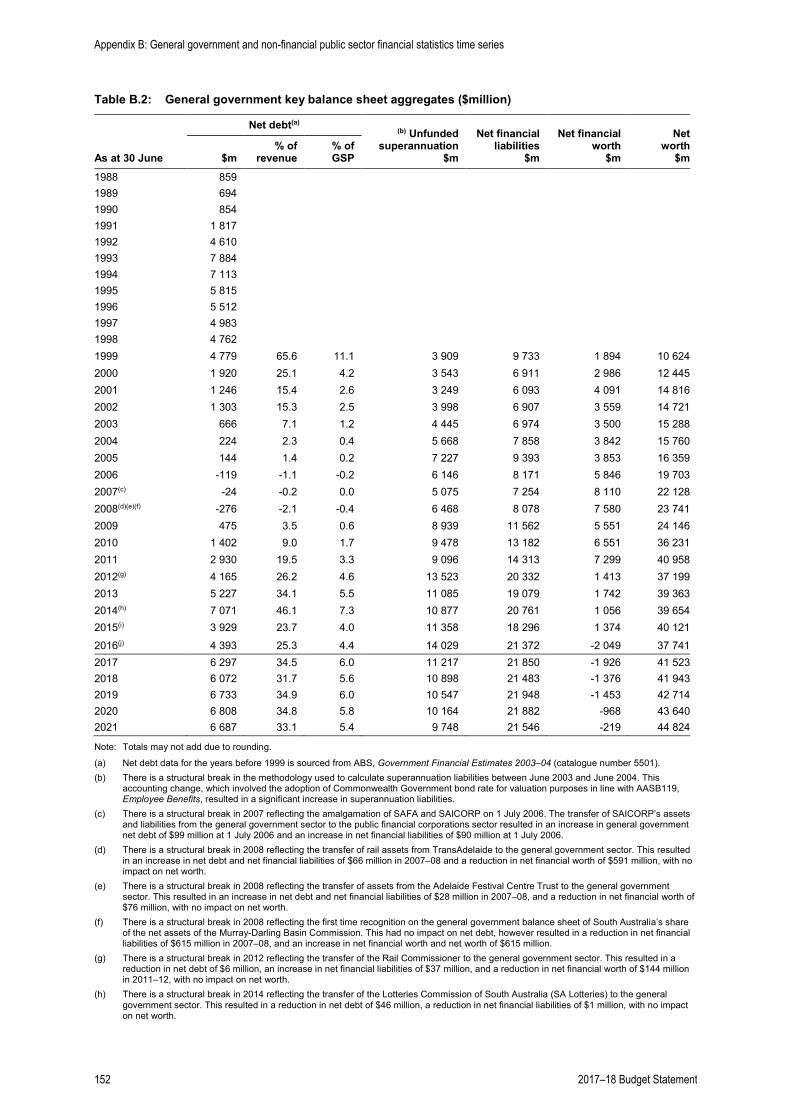
Table B.2: General government key balance sheet aggregates ($million)
Net debt(a) (b) Unfunded superannuation
$m
Net financial liabilities
$m
Net financial worth
$m
Net worth
$m As at 30 June $m % of
revenue % of GSP
1988 859 1989 694 1990 854 1991 1 817 1992 4 610 1993 7 884 1994 7 113 1995 5 815 1996 5 512 1997 4 983 1998 4 762 1999 4 779 65.6 11.1 3 909 9 733 1 894 10 624 2000 1 920 25.1 4.2 3 543 6 911 2 986 12 445 2001 1 246 15.4 2.6 3 249 6 093 4 091 14 816 2002 1 303 15.3 2.5 3 998 6 907 3 559 14 721 2003 666 7.1 1.2 4 445 6 974 3 500 15 288 2004 224 2.3 0.4 5 668 7 858 3 842 15 760 2005 144 1.4 0.2 7 227 9 393 3 853 16 359 2006 -119 -1.1 -0.2 6 146 8 171 5 846 19 703 2007(c) -24 -0.2 0.0 5 075 7 254 8 110 22 128 2008(d)(e)(f) -276 -2.1 -0.4 6 468 8 078 7 580 23 741 2009 475 3.5 0.6 8 939 11 562 5 551 24 146 2010 1 402 9.0 1.7 9 478 13 182 6 551 36 231 2011 2 930 19.5 3.3 9 096 14 313 7 299 40 958 2012(g) 4 165 26.2 4.6 13 523 20 332 1 413 37 199 2013 5 227 34.1 5.5 11 085 19 079 1 742 39 363 2014(h) 7 071 46.1 7.3 10 877 20 761 1 056 39 654 2015(i) 3 929 23.7 4.0 11 358 18 296 1 374 40 121 2016(j) 4 393 25.3 4.4 14 029 21 372 -2 049 37 741 2017 6 297 34.5 6.0 11 217 21 850 -1 926 41 523 2018 6 072 31.7 5.6 10 898 21 483 -1 376 41 943 2019 6 733 34.9 6.0 10 547 21 948 -1 453 42 714 2020 6 808 34.8 5.8 10 164 21 882 -968 43 640 2021 6 687 33.1 5.4 9 748 21 546 -219 44 824
Note: Totals may not add due to rounding.
(a) Net debt data for the years before 1999 is sourced from ABS, Government Financial Estimates 2003–04 (catalogue number 5501). (b) There is a structural break in the methodology used to calculate superannuation liabilities between June 2003 and June 2004. This
accounting change, which involved the adoption of Commonwealth Government bond rate for valuation purposes in line with AASB119, Employee Benefits, resulted in a significant increase in superannuation liabilities.
(c) There is a structural break in 2007 reflecting the amalgamation of SAFA and SAICORP on 1 July 2006. The transfer of SAICORP’s assets and liabilities from the general government sector to the public financial corporations sector resulted in an increase in general government net debt of $99 million at 1 July 2006 and an increase in net financial liabilities of $90 million at 1 July 2006.
(d) There is a structural break in 2008 reflecting the transfer of rail assets from TransAdelaide to the general government sector. This resulted in an increase in net debt and net financial liabilities of $66 million in 2007–08 and a reduction in net financial worth of $591 million, with no impact on net worth.
(e) There is a structural break in 2008 reflecting the transfer of assets from the Adelaide Festival Centre Trust to the general government sector. This resulted in an increase in net debt and net financial liabilities of $28 million in 2007–08, and a reduction in net financial worth of $76 million, with no impact on net worth.
(f) There is a structural break in 2008 reflecting the first time recognition on the general government balance sheet of South Australia’s share of the net assets of the Murray-Darling Basin Commission. This had no impact on net debt, however resulted in a reduction in net financial liabilities of $615 million in 2007–08, and an increase in net financial worth and net worth of $615 million.
(g) There is a structural break in 2012 reflecting the transfer of the Rail Commissioner to the general government sector. This resulted in a reduction in net debt of $6 million, an increase in net financial liabilities of $37 million, and a reduction in net financial worth of $144 million in 2011–12, with no impact on net worth.
(h) There is a structural break in 2014 reflecting the transfer of the Lotteries Commission of South Australia (SA Lotteries) to the general government sector. This resulted in a reduction in net debt of $46 million, a reduction in net financial liabilities of $1 million, with no impact on net worth.
Appendix B: General government and non-financial public sector financial statistics time series
152 2017–18 Budget Statement
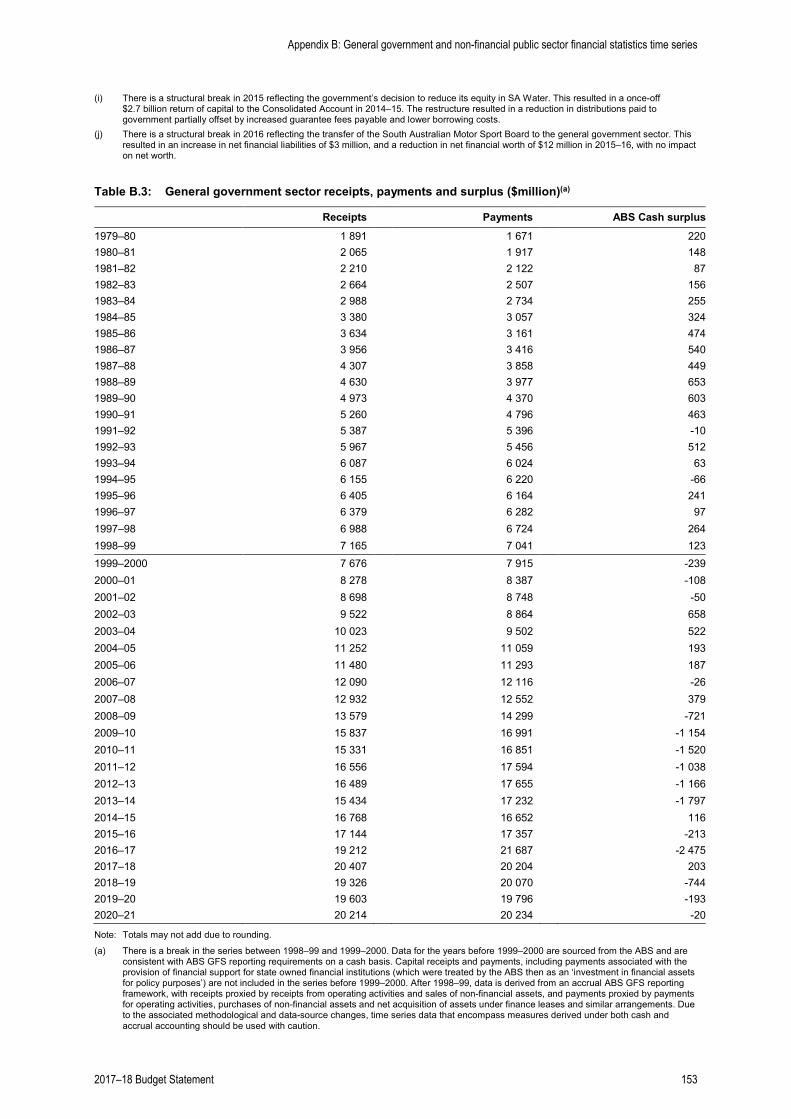
(i) There is a structural break in 2015 reflecting the government’s decision to reduce its equity in SA Water. This resulted in a once-off $2.7 billion return of capital to the Consolidated Account in 2014–15. The restructure resulted in a reduction in distributions paid to government partially offset by increased guarantee fees payable and lower borrowing costs.
(j) There is a structural break in 2016 reflecting the transfer of the South Australian Motor Sport Board to the general government sector. This resulted in an increase in net financial liabilities of $3 million, and a reduction in net financial worth of $12 million in 2015–16, with no impact on net worth.
Table B.3: General government sector receipts, payments and surplus ($million)(a)
Receipts Payments ABS Cash surplus 1979–80 1 891 1 671 220 1980–81 2 065 1 917 148 1981–82 2 210 2 122 87 1982–83 2 664 2 507 156 1983–84 2 988 2 734 255 1984–85 3 380 3 057 324 1985–86 3 634 3 161 474 1986–87 3 956 3 416 540 1987–88 4 307 3 858 449 1988–89 4 630 3 977 653 1989–90 4 973 4 370 603 1990–91 5 260 4 796 463 1991–92 5 387 5 396 -10 1992–93 5 967 5 456 512 1993–94 6 087 6 024 63 1994–95 6 155 6 220 -66 1995–96 6 405 6 164 241 1996–97 6 379 6 282 97 1997–98 6 988 6 724 264 1998–99 7 165 7 041 123 1999–2000 7 676 7 915 -239 2000–01 8 278 8 387 -108 2001–02 8 698 8 748 -50 2002–03 9 522 8 864 658 2003–04 10 023 9 502 522 2004–05 11 252 11 059 193 2005–06 11 480 11 293 187 2006–07 12 090 12 116 -26 2007–08 12 932 12 552 379 2008–09 13 579 14 299 -721 2009–10 15 837 16 991 -1 154 2010–11 15 331 16 851 -1 520 2011–12 16 556 17 594 -1 038 2012–13 16 489 17 655 -1 166 2013–14 15 434 17 232 -1 797 2014–15 16 768 16 652 116 2015–16 17 144 17 357 -213 2016–17 19 212 21 687 -2 475 2017–18 20 407 20 204 203 2018–19 19 326 20 070 -744 2019–20 19 603 19 796 -193 2020–21 20 214 20 234 -20
Note: Totals may not add due to rounding.
(a) There is a break in the series between 1998–99 and 1999–2000. Data for the years before 1999–2000 are sourced from the ABS and are consistent with ABS GFS reporting requirements on a cash basis. Capital receipts and payments, including payments associated with the provision of financial support for state owned financial institutions (which were treated by the ABS then as an ‘investment in financial assets for policy purposes’) are not included in the series before 1999–2000. After 1998–99, data is derived from an accrual ABS GFS reporting framework, with receipts proxied by receipts from operating activities and sales of non-financial assets, and payments proxied by payments for operating activities, purchases of non-financial assets and net acquisition of assets under finance leases and similar arrangements. Due to the associated methodological and data-source changes, time series data that encompass measures derived under both cash and accrual accounting should be used with caution.
Appendix B: General government and non-financial public sector financial statistics time series
2017–18 Budget Statement 153
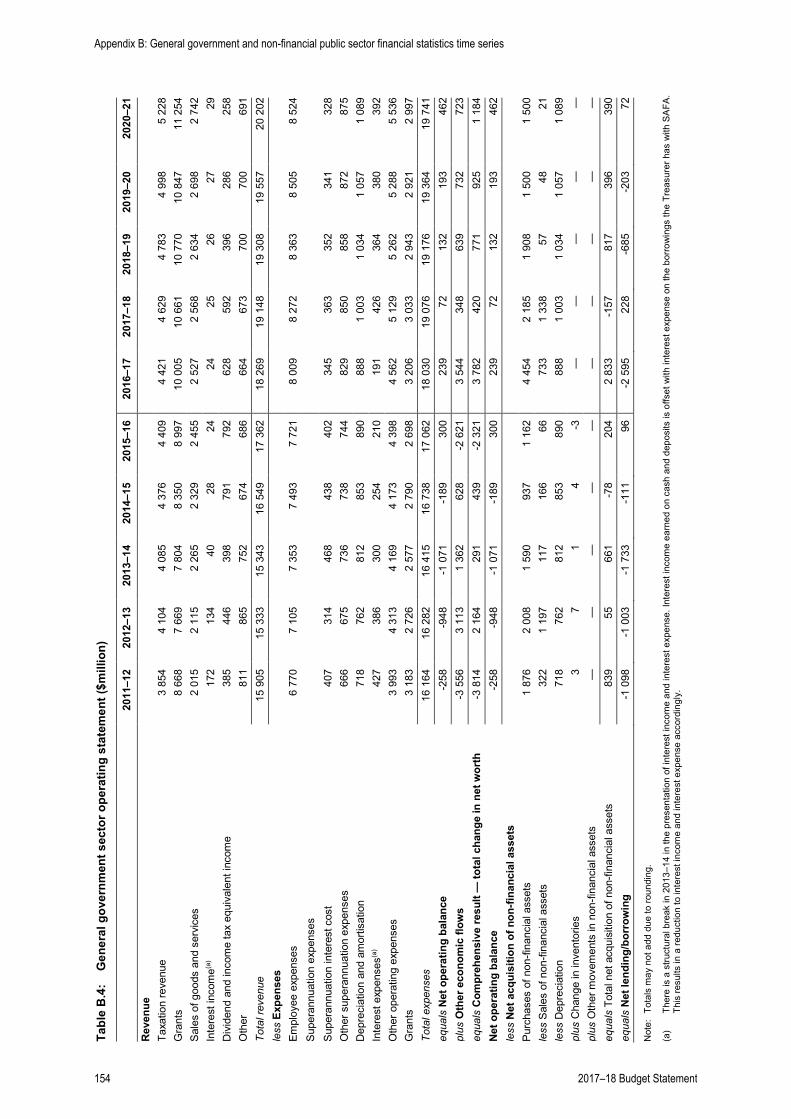
Tabl
e B
.4:
Gen
eral
gov
ernm
ent s
ecto
r ope
ratin
g st
atem
ent (
$mill
ion)
20
11–1
2 20
12–1
3 20
13–1
4 20
14–1
5 20
15–1
6 20
16–1
7 20
17–1
8 20
18–1
9 20
19–2
0 20
20–2
1 R
even
ue
Taxa
tion
reve
nue
3 85
4 4
104
4 08
5 4
376
4 40
9 4
421
4 62
9 4
783
4 99
8 5
228
Gra
nts
8 66
8 7
669
7 80
4 8
350
8 99
7 10
005
10
661
10
770
10
847
11
254
Sa
les
of g
oods
and
ser
vice
s 2
015
2 11
5 2
265
2 32
9 2
455
2 52
7 2
568
2 63
4 2
698
2 74
2 In
tere
st in
com
e(a)
172
1
34
40
28
24
24
25
26
27
29
Div
iden
d an
d in
com
e ta
x eq
uiva
lent
inco
me
385
4
46
398
7
91
792
6
28
592
3
96
286
2
58
Oth
er
811
8
65
752
6
74
686
6
64
673
7
00
700
6
91
Tota
l rev
enue
15
905
15
333
15
343
16
549
17
362
18
269
19
148
19
308
19
557
20
202
le
ss E
xpen
ses
Empl
oyee
exp
ense
s 6
770
7 10
5 7
353
7 49
3 7
721
8 00
9 8
272
8 36
3 8
505
8 52
4 Su
pera
nnua
tion
expe
nses
Su
pera
nnua
tion
inte
rest
cos
t 4
07
314
4
68
438
4
02
345
3
63
352
3
41
328
O
ther
sup
eran
nuat
ion
expe
nses
6
66
675
7
36
738
7
44
829
8
50
858
8
72
875
D
epre
ciat
ion
and
amor
tisat
ion
718
7
62
812
8
53
890
8
88
1 00
3 1
034
1 05
7 1
089
Inte
rest
exp
ense
s(a)
427
3
86
300
2
54
210
1
91
426
3
64
380
3
92
Oth
er o
pera
ting
expe
nses
3
993
4 31
3 4
169
4 17
3 4
398
4 56
2 5
129
5 26
2 5
288
5 53
6 G
rant
s 3
183
2 72
6 2
577
2 79
0 2
698
3 20
6 3
033
2 94
3 2
921
2 99
7 To
tal e
xpen
ses
16 1
64
16 2
82
16 4
15
16 7
38
17 0
62
18 0
30
19 0
76
19 1
76
19 3
64
19 7
41
equa
ls N
et o
pera
ting
bala
nce
-258
-9
48
-1 0
71
-189
3
00
239
7
2 1
32
193
4
62
plus
Oth
er e
cono
mic
flow
s -3
556
3
113
1 36
2 6
28
-2 6
21
3 54
4 3
48
639
7
32
723
eq
uals
Com
preh
ensi
ve re
sult
— to
tal c
hang
e in
net
wor
th
-3 8
14
2 16
4 2
91
439
-2
321
3
782
420
7
71
925
1
184
Net
ope
ratin
g ba
lanc
e -2
58
-948
-1
071
-1
89
300
2
39
72
132
1
93
462
le
ss N
et a
cqui
sitio
n of
non
-fina
ncia
l ass
ets
Purc
hase
s of
non
-fina
ncia
l ass
ets
1 87
6 2
008
1 59
0 9
37
1 16
2 4
454
2 18
5 1
908
1 50
0 1
500
less
Sal
es o
f non
-fina
ncia
l ass
ets
322
1
197
117
1
66
66
733
1
338
57
48
21
less
Dep
reci
atio
n 7
18
762
8
12
853
8
90
888
1
003
1 03
4 1
057
1 08
9 pl
us C
hang
e in
inve
ntor
ies
3
7
1
4
-3
—
—
—
—
—
plus
Oth
er m
ovem
ents
in n
on-fi
nanc
ial a
sset
s —
—
—
—
—
—
—
—
—
—
eq
uals
Tot
al n
et a
cqui
sitio
n of
non
-fina
ncia
l ass
ets
839
5
5 6
61
-78
204
2
833
-157
8
17
396
3
90
equa
ls N
et le
ndin
g/bo
rrow
ing
-1 0
98
-1 0
03
-1 7
33
-111
9
6 -2
595
2
28
-685
-2
03
72
Not
e: T
otal
s m
ay n
ot a
dd d
ue to
roun
ding
.
(a)
Ther
e is
a s
truct
ural
bre
ak in
201
3–14
in th
e pr
esen
tatio
n of
inte
rest
inco
me
and
inte
rest
exp
ense
. Int
eres
t inc
ome
earn
ed o
n ca
sh a
nd d
epos
its is
offs
et w
ith in
tere
st e
xpen
se o
n th
e bo
rrow
ings
the
Trea
sure
r has
with
SA
FA.
This
resu
lts in
a re
duct
ion
to in
tere
st in
com
e an
d in
tere
st e
xpen
se a
ccor
ding
ly.
Appendix B: General government and non-financial public sector financial statistics time series
154 2017–18 Budget Statement
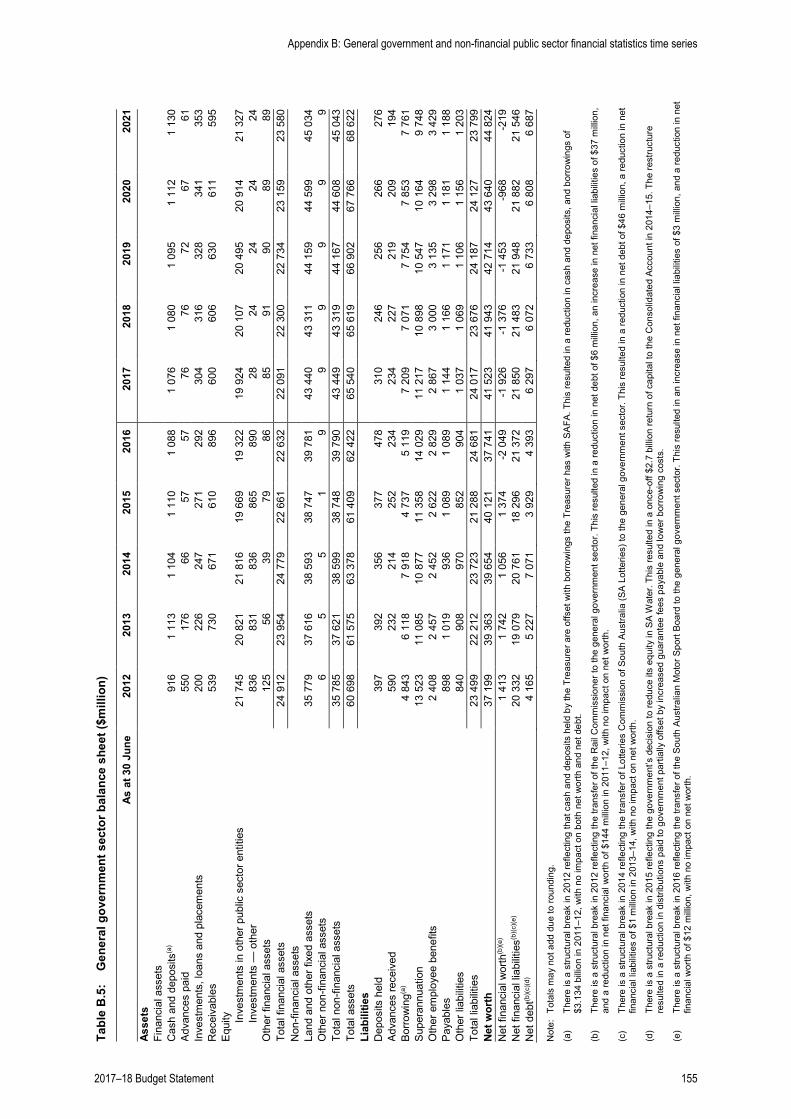
Tabl
e B
.5:
Gen
eral
gov
ernm
ent s
ecto
r bal
ance
she
et ($
mill
ion)
As a
t 30
June
20
12
2013
20
14
2015
20
16
2017
20
18
2019
20
20
2021
As
sets
Fi
nanc
ial a
sset
s
C
ash
and
depo
sits
(a)
916
1
113
1 10
4 1
110
1 08
8 1
076
1 08
0 1
095
1 11
2 1
130
Adva
nces
pai
d 5
50
176
6
6 5
7 5
7 7
6 7
6 7
2 6
7 6
1 In
vest
men
ts, l
oans
and
pla
cem
ents
2
00
226
2
47
271
2
92
304
3
16
328
3
41
353
R
ecei
vabl
es
539
7
30
671
6
10
896
6
00
606
6
30
611
5
95
Equi
ty
Inve
stm
ents
in o
ther
pub
lic s
ecto
r ent
ities
21
745
20
821
21
816
19
669
19
322
19
924
20
107
20
495
20
914
21
327
In
vest
men
ts —
oth
er
836
8
31
836
8
65
890
2
8 2
4 2
4 2
4 2
4 O
ther
fina
ncia
l ass
ets
125
5
6 3
9 7
9 8
6 8
5 9
1 9
0 8
9 8
9 To
tal f
inan
cial
ass
ets
24 9
12
23 9
54
24 7
79
22 6
61
22 6
32
22 0
91
22 3
00
22 7
34
23 1
59
23 5
80
Non
-fina
ncia
l ass
ets
Land
and
oth
er fi
xed
asse
ts
35 7
79
37 6
16
38 5
93
38 7
47
39 7
81
43 4
40
43 3
11
44 1
59
44 5
99
45 0
34
Oth
er n
on-fi
nanc
ial a
sset
s 6
5
5
1
9
9
9
9
9
9
To
tal n
on-fi
nanc
ial a
sset
s 35
785
37
621
38
599
38
748
39
790
43
449
43
319
44
167
44
608
45
043
To
tal a
sset
s 60
698
61
575
63
378
61
409
62
422
65
540
65
619
66
902
67
766
68
622
Li
abili
ties
Dep
osits
hel
d 3
97
392
3
56
377
4
78
310
2
46
256
2
66
276
Ad
vanc
es re
ceiv
ed
590
2
32
214
2
52
234
2
34
227
2
19
209
1
94
Borro
win
g(a)
4 84
3 6
118
7 91
8 4
737
5 11
9 7
209
7 07
1 7
754
7 85
3 7
761
Supe
rann
uatio
n 13
523
11
085
10
877
11
358
14
029
11
217
10
898
10
547
10
164
9
748
Oth
er e
mpl
oyee
ben
efits
2
408
2 45
7 2
452
2 62
2 2
829
2 86
7 3
000
3 13
5 3
298
3 42
9 Pa
yabl
es
898
1
019
936
1
089
1 08
9 1
144
1 16
6 1
171
1 18
1 1
188
Oth
er li
abilit
ies
840
9
08
970
8
52
904
1
037
1 06
9 1
106
1 15
6 1
203
Tota
l lia
bilit
ies
23 4
99
22 2
12
23 7
23
21 2
88
24 6
81
24 0
17
23 6
76
24 1
87
24 1
27
23 7
99
Net
wor
th
37 1
99
39 3
63
39 6
54
40 1
21
37 7
41
41 5
23
41 9
43
42 7
14
43 6
40
44 8
24
Net
fina
ncia
l wor
th(b
)(e)
1 41
3 1
742
1 05
6 1
374
-2 0
49
-1 9
26
-1 3
76
-1 4
53
-968
-2
19
Net
fina
ncia
l lia
bilit
ies(b
)(c)(e
) 20
332
19
079
20
761
18
296
21
372
21
850
21
483
21
948
21
882
21
546
N
et d
ebt(b
)(c)(d
) 4
165
5 22
7 7
071
3 92
9 4
393
6 29
7 6
072
6 73
3 6
808
6 68
7
Not
e: T
otal
s m
ay n
ot a
dd d
ue to
roun
ding
.
(a)
Ther
e is
a s
truct
ural
bre
ak in
201
2 re
flect
ing
that
cas
h an
d de
posi
ts h
eld
by th
e Tr
easu
rer a
re o
ffset
with
bor
row
ings
the
Trea
sure
r has
with
SA
FA. T
his
resu
lted
in a
redu
ctio
n in
cas
h an
d de
posi
ts, a
nd b
orro
win
gs o
f $3
.134
billi
on in
201
1–12
, with
no
impa
ct o
n bo
th n
et w
orth
and
net
deb
t.
(b)
Ther
e is
a s
truct
ural
bre
ak in
201
2 re
flect
ing
the
trans
fer o
f the
Rai
l Com
mis
sion
er to
the
gene
ral g
over
nmen
t sec
tor.
This
resu
lted
in a
redu
ctio
n in
net
deb
t of $
6 m
illion
, an
incr
ease
in n
et fi
nanc
ial l
iabi
litie
s of
$37
milli
on,
and
a re
duct
ion
in n
et fi
nanc
ial w
orth
of $
144
milli
on in
201
1–12
, with
no
impa
ct o
n ne
t wor
th.
(c)
Ther
e is
a s
truct
ural
bre
ak in
201
4 re
flect
ing
the
trans
fer o
f Lot
terie
s C
omm
issi
on o
f Sou
th A
ustra
lia (S
A Lo
tterie
s) to
the
gene
ral g
over
nmen
t sec
tor.
This
resu
lted
in a
redu
ctio
n in
net
deb
t of $
46 m
illion
, a re
duct
ion
in n
et
finan
cial
liab
ilitie
s of
$1
milli
on in
201
3–14
, with
no
impa
ct o
n ne
t wor
th.
(d)
Ther
e is
a s
truct
ural
bre
ak in
201
5 re
flect
ing
the
gove
rnm
ent’s
dec
isio
n to
redu
ce it
s eq
uity
in S
A W
ater
. Thi
s re
sulte
d in
a o
nce-
off $
2.7
billi
on re
turn
of c
apita
l to
the
Con
solid
ated
Acc
ount
in 2
014–
15. T
he re
stru
ctur
e re
sulte
d in
a re
duct
ion
in d
istri
butio
ns p
aid
to g
over
nmen
t par
tially
offs
et b
y in
crea
sed
guar
ante
e fe
es p
ayab
le a
nd lo
wer
bor
row
ing
cost
s.
(e)
Ther
e is
a s
truct
ural
bre
ak in
201
6 re
flect
ing
the
trans
fer o
f the
Sou
th A
ustra
lian
Mot
or S
port
Boar
d to
the
gene
ral g
over
nmen
t sec
tor.
This
resu
lted
in a
n in
crea
se in
net
fina
ncia
l lia
bilit
ies
of $
3 m
illion
, and
a re
duct
ion
in n
et
finan
cial
wor
th o
f $12
milli
on, w
ith n
o im
pact
on
net w
orth
.
Appendix B: General government and non-financial public sector financial statistics time series
2017–18 Budget Statement 155
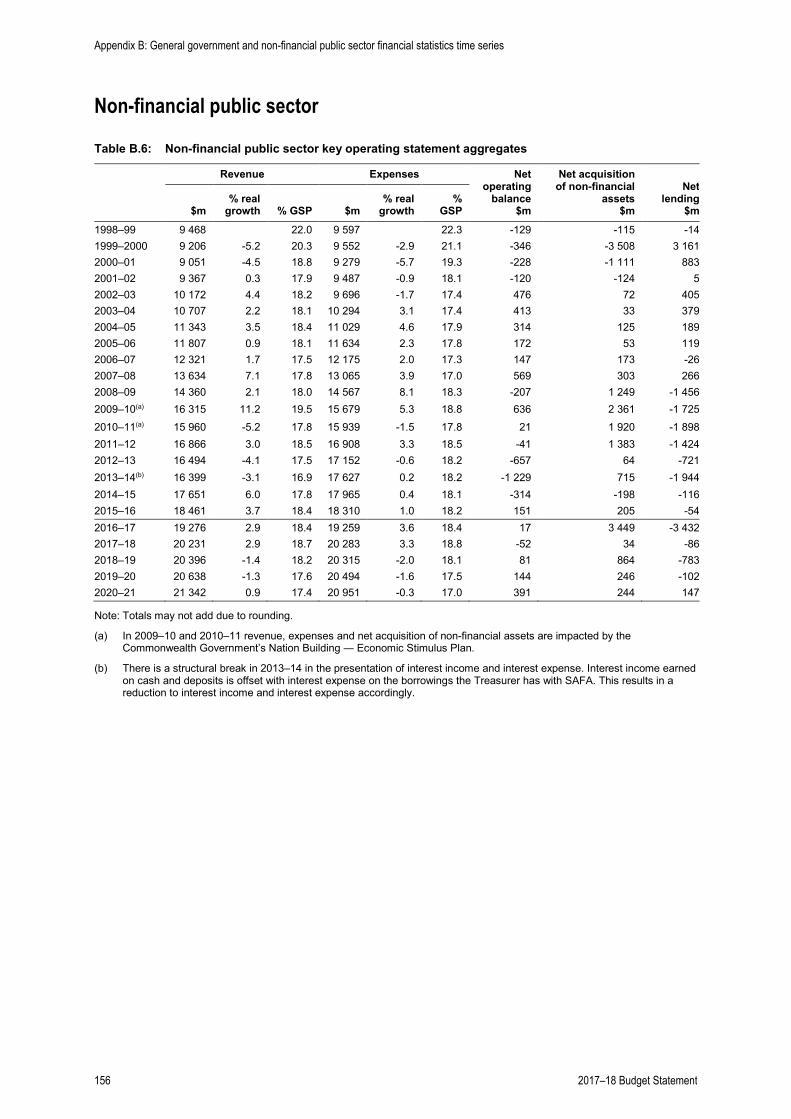
Non-financial public sector
Table B.6: Non-financial public sector key operating statement aggregates
Revenue Expenses Net operating
balance $m
Net acquisition of non-financial
assets $m
Net lending
$m
$m % real
growth % GSP $m % real
growth %
GSP 1998–99 9 468 22.0 9 597 22.3 -129 -115 -14 1999–2000 9 206 -5.2 20.3 9 552 -2.9 21.1 -346 -3 508 3 161 2000–01 9 051 -4.5 18.8 9 279 -5.7 19.3 -228 -1 111 883 2001–02 9 367 0.3 17.9 9 487 -0.9 18.1 -120 -124 5 2002–03 10 172 4.4 18.2 9 696 -1.7 17.4 476 72 405 2003–04 10 707 2.2 18.1 10 294 3.1 17.4 413 33 379 2004–05 11 343 3.5 18.4 11 029 4.6 17.9 314 125 189 2005–06 11 807 0.9 18.1 11 634 2.3 17.8 172 53 119 2006–07 12 321 1.7 17.5 12 175 2.0 17.3 147 173 -26 2007–08 13 634 7.1 17.8 13 065 3.9 17.0 569 303 266 2008–09 14 360 2.1 18.0 14 567 8.1 18.3 -207 1 249 -1 456 2009–10(a) 16 315 11.2 19.5 15 679 5.3 18.8 636 2 361 -1 725 2010–11(a) 15 960 -5.2 17.8 15 939 -1.5 17.8 21 1 920 -1 898 2011–12 16 866 3.0 18.5 16 908 3.3 18.5 -41 1 383 -1 424 2012–13 16 494 -4.1 17.5 17 152 -0.6 18.2 -657 64 -721 2013–14(b) 16 399 -3.1 16.9 17 627 0.2 18.2 -1 229 715 -1 944 2014–15 17 651 6.0 17.8 17 965 0.4 18.1 -314 -198 -116 2015–16 18 461 3.7 18.4 18 310 1.0 18.2 151 205 -54 2016–17 19 276 2.9 18.4 19 259 3.6 18.4 17 3 449 -3 432 2017–18 20 231 2.9 18.7 20 283 3.3 18.8 -52 34 -86 2018–19 20 396 -1.4 18.2 20 315 -2.0 18.1 81 864 -783 2019–20 20 638 -1.3 17.6 20 494 -1.6 17.5 144 246 -102 2020–21 21 342 0.9 17.4 20 951 -0.3 17.0 391 244 147
Note: Totals may not add due to rounding.
(a) In 2009–10 and 2010–11 revenue, expenses and net acquisition of non-financial assets are impacted by the Commonwealth Government’s Nation Building ― Economic Stimulus Plan.
(b) There is a structural break in 2013–14 in the presentation of interest income and interest expense. Interest income earned on cash and deposits is offset with interest expense on the borrowings the Treasurer has with SAFA. This results in a reduction to interest income and interest expense accordingly.
Appendix B: General government and non-financial public sector financial statistics time series
156 2017–18 Budget Statement
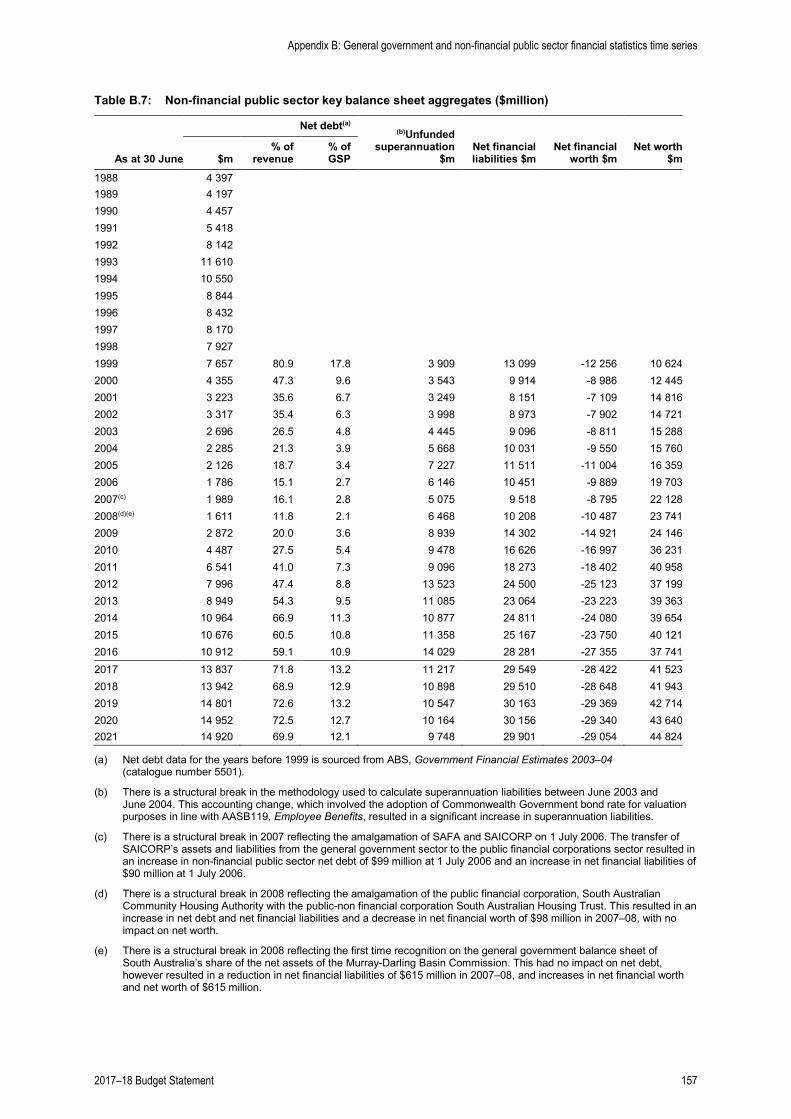
Table B.7: Non-financial public sector key balance sheet aggregates ($million)
Net debt(a) (b)Unfunded superannuation
$m Net financial liabilities $m
Net financial worth $m
Net worth $m As at 30 June $m
% of revenue
% of GSP
1988 4 397 1989 4 197 1990 4 457 1991 5 418 1992 8 142 1993 11 610 1994 10 550 1995 8 844 1996 8 432 1997 8 170 1998 7 927 1999 7 657 80.9 17.8 3 909 13 099 -12 256 10 624 2000 4 355 47.3 9.6 3 543 9 914 -8 986 12 445 2001 3 223 35.6 6.7 3 249 8 151 -7 109 14 816 2002 3 317 35.4 6.3 3 998 8 973 -7 902 14 721 2003 2 696 26.5 4.8 4 445 9 096 -8 811 15 288 2004 2 285 21.3 3.9 5 668 10 031 -9 550 15 760 2005 2 126 18.7 3.4 7 227 11 511 -11 004 16 359 2006 1 786 15.1 2.7 6 146 10 451 -9 889 19 703 2007(c) 1 989 16.1 2.8 5 075 9 518 -8 795 22 128 2008(d)(e) 1 611 11.8 2.1 6 468 10 208 -10 487 23 741 2009 2 872 20.0 3.6 8 939 14 302 -14 921 24 146 2010 4 487 27.5 5.4 9 478 16 626 -16 997 36 231 2011 6 541 41.0 7.3 9 096 18 273 -18 402 40 958 2012 7 996 47.4 8.8 13 523 24 500 -25 123 37 199 2013 8 949 54.3 9.5 11 085 23 064 -23 223 39 363 2014 10 964 66.9 11.3 10 877 24 811 -24 080 39 654 2015 10 676 60.5 10.8 11 358 25 167 -23 750 40 121 2016 10 912 59.1 10.9 14 029 28 281 -27 355 37 741 2017 13 837 71.8 13.2 11 217 29 549 -28 422 41 523 2018 13 942 68.9 12.9 10 898 29 510 -28 648 41 943 2019 14 801 72.6 13.2 10 547 30 163 -29 369 42 714 2020 14 952 72.5 12.7 10 164 30 156 -29 340 43 640 2021 14 920 69.9 12.1 9 748 29 901 -29 054 44 824
(a) Net debt data for the years before 1999 is sourced from ABS, Government Financial Estimates 2003–04 (catalogue number 5501).
(b) There is a structural break in the methodology used to calculate superannuation liabilities between June 2003 and June 2004. This accounting change, which involved the adoption of Commonwealth Government bond rate for valuation purposes in line with AASB119, Employee Benefits, resulted in a significant increase in superannuation liabilities.
(c) There is a structural break in 2007 reflecting the amalgamation of SAFA and SAICORP on 1 July 2006. The transfer of SAICORP’s assets and liabilities from the general government sector to the public financial corporations sector resulted in an increase in non-financial public sector net debt of $99 million at 1 July 2006 and an increase in net financial liabilities of $90 million at 1 July 2006.
(d) There is a structural break in 2008 reflecting the amalgamation of the public financial corporation, South Australian Community Housing Authority with the public-non financial corporation South Australian Housing Trust. This resulted in an increase in net debt and net financial liabilities and a decrease in net financial worth of $98 million in 2007–08, with no impact on net worth.
(e) There is a structural break in 2008 reflecting the first time recognition on the general government balance sheet of South Australia’s share of the net assets of the Murray-Darling Basin Commission. This had no impact on net debt, however resulted in a reduction in net financial liabilities of $615 million in 2007–08, and increases in net financial worth and net worth of $615 million.
Appendix B: General government and non-financial public sector financial statistics time series
2017–18 Budget Statement 157
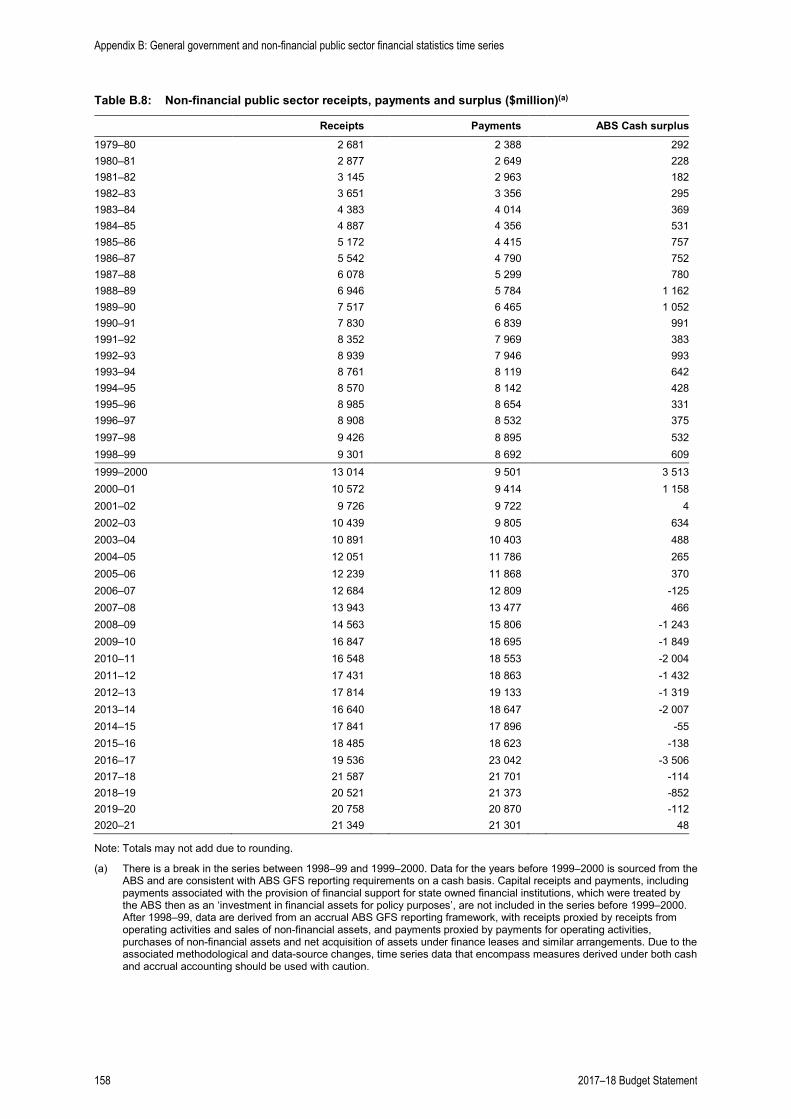
Table B.8: Non-financial public sector receipts, payments and surplus ($million)(a)
Receipts Payments ABS Cash surplus 1979–80 2 681 2 388 292 1980–81 2 877 2 649 228 1981–82 3 145 2 963 182 1982–83 3 651 3 356 295 1983–84 4 383 4 014 369 1984–85 4 887 4 356 531 1985–86 5 172 4 415 757 1986–87 5 542 4 790 752 1987–88 6 078 5 299 780 1988–89 6 946 5 784 1 162 1989–90 7 517 6 465 1 052 1990–91 7 830 6 839 991 1991–92 8 352 7 969 383 1992–93 8 939 7 946 993 1993–94 8 761 8 119 642 1994–95 8 570 8 142 428 1995–96 8 985 8 654 331 1996–97 8 908 8 532 375 1997–98 9 426 8 895 532 1998–99 9 301 8 692 609 1999–2000 13 014 9 501 3 513 2000–01 10 572 9 414 1 158 2001–02 9 726 9 722 4 2002–03 10 439 9 805 634 2003–04 10 891 10 403 488 2004–05 12 051 11 786 265 2005–06 12 239 11 868 370 2006–07 12 684 12 809 -125 2007–08 13 943 13 477 466 2008–09 14 563 15 806 -1 243 2009–10 16 847 18 695 -1 849 2010–11 16 548 18 553 -2 004 2011–12 17 431 18 863 -1 432 2012–13 17 814 19 133 -1 319 2013–14 16 640 18 647 -2 007 2014–15 17 841 17 896 -55 2015–16 18 485 18 623 -138 2016–17 19 536 23 042 -3 506 2017–18 21 587 21 701 -114 2018–19 20 521 21 373 -852 2019–20 20 758 20 870 -112 2020–21 21 349 21 301 48
Note: Totals may not add due to rounding.
(a) There is a break in the series between 1998–99 and 1999–2000. Data for the years before 1999–2000 is sourced from the ABS and are consistent with ABS GFS reporting requirements on a cash basis. Capital receipts and payments, including payments associated with the provision of financial support for state owned financial institutions, which were treated by the ABS then as an ‘investment in financial assets for policy purposes’, are not included in the series before 1999–2000. After 1998–99, data are derived from an accrual ABS GFS reporting framework, with receipts proxied by receipts from operating activities and sales of non-financial assets, and payments proxied by payments for operating activities, purchases of non-financial assets and net acquisition of assets under finance leases and similar arrangements. Due to the associated methodological and data-source changes, time series data that encompass measures derived under both cash and accrual accounting should be used with caution.
Appendix B: General government and non-financial public sector financial statistics time series
158 2017–18 Budget Statement
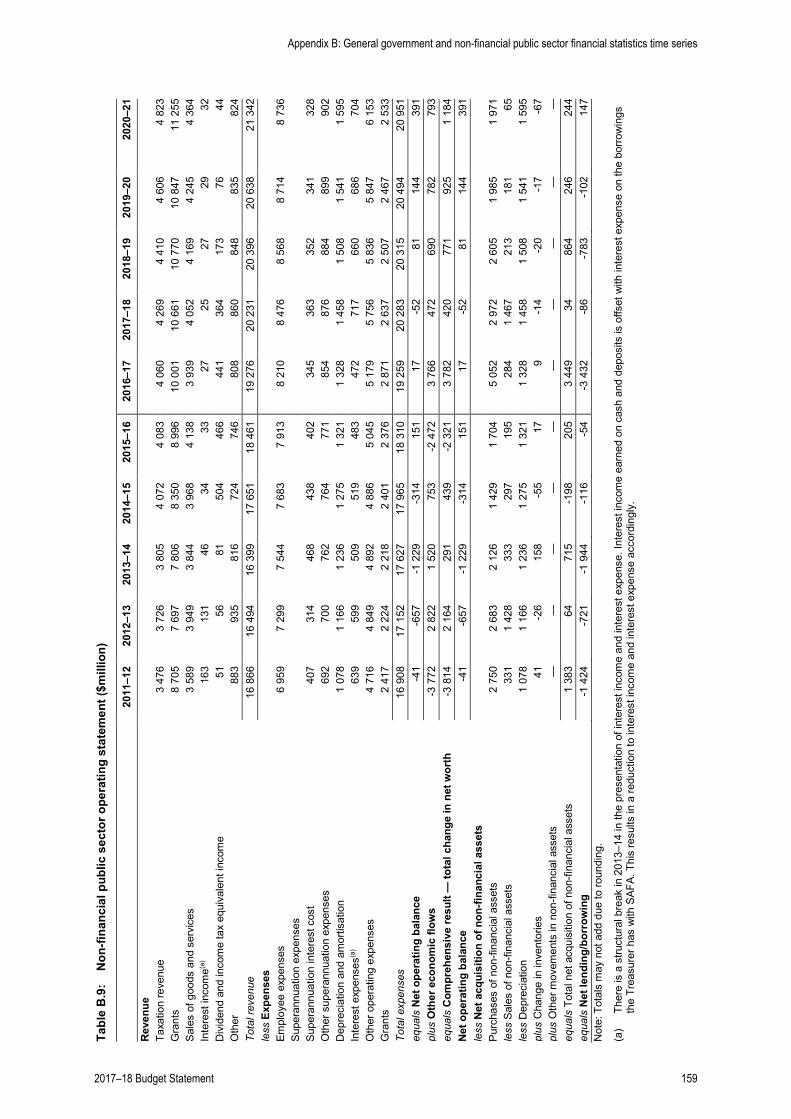
Tabl
e B
.9:
Non
-fina
ncia
l pub
lic s
ecto
r ope
ratin
g st
atem
ent (
$mill
ion)
20
11–1
2 20
12–1
3 20
13–1
4 20
14–1
5 20
15–1
6 20
16–1
7 20
17–1
8 20
18–1
9 20
19–2
0 20
20–2
1 R
even
ue
Taxa
tion
reve
nue
3 47
6 3
726
3 80
5 4
072
4 08
3 4
060
4 26
9 4
410
4 60
6 4
823
Gra
nts
8 70
5 7
697
7 80
6 8
350
8 99
6 10
001
10
661
10
770
10
847
11
255
Sa
les
of g
oods
and
ser
vice
s 3
589
3 94
9 3
844
3 96
8 4
138
3 93
9 4
052
4 16
9 4
245
4 36
4 In
tere
st in
com
e(a)
163
1
31
46
34
33
27
25
27
29
32
Div
iden
d an
d in
com
e ta
x eq
uiva
lent
inco
me
51
56
81
504
4
66
441
3
64
173
7
6 4
4 O
ther
8
83
935
8
16
724
7
46
808
8
60
848
8
35
824
To
tal r
even
ue
16 8
66
16 4
94
16 3
99
17 6
51
18 4
61
19 2
76
20 2
31
20 3
96
20 6
38
21 3
42
less
Exp
ense
s
Em
ploy
ee e
xpen
ses
6 95
9 7
299
7 54
4 7
683
7 91
3 8
210
8 47
6 8
568
8 71
4 8
736
Supe
rann
uatio
n ex
pens
es
Supe
rann
uatio
n in
tere
st c
ost
407
3
14
468
4
38
402
3
45
363
3
52
341
3
28
Oth
er s
uper
annu
atio
n ex
pens
es
692
7
00
762
7
64
771
8
54
876
8
84
899
9
02
Dep
reci
atio
n an
d am
ortis
atio
n 1
078
1 16
6 1
236
1 27
5 1
321
1 32
8 1
458
1 50
8 1
541
1 59
5 In
tere
st e
xpen
ses(a
) 6
39
599
5
09
519
4
83
472
7
17
660
6
86
704
O
ther
ope
ratin
g ex
pens
es
4 71
6 4
849
4 89
2 4
886
5 04
5 5
179
5 75
6 5
836
5 84
7 6
153
Gra
nts
2 41
7 2
224
2 21
8 2
401
2 37
6 2
871
2 63
7 2
507
2 46
7 2
533
Tota
l exp
ense
s 16
908
17
152
17
627
17
965
18
310
19
259
20
283
20
315
20
494
20
951
eq
uals
Net
ope
ratin
g ba
lanc
e -4
1 -6
57
-1 2
29
-314
1
51
17
-52
81
144
3
91
plus
Oth
er e
cono
mic
flow
s -3
772
2
822
1 52
0 7
53
-2 4
72
3 76
6 4
72
690
7
82
793
eq
uals
Com
preh
ensi
ve re
sult
— to
tal c
hang
e in
net
wor
th
-3 8
14
2 16
4 2
91
439
-2
321
3
782
420
7
71
925
1
184
Net
ope
ratin
g ba
lanc
e -4
1 -6
57
-1 2
29
-314
1
51
17
-52
81
144
3
91
less
Net
acq
uisi
tion
of n
on-fi
nanc
ial a
sset
s
Pu
rcha
ses
of n
on-fi
nanc
ial a
sset
s 2
750
2 68
3 2
126
1 42
9 1
704
5 05
2 2
972
2 60
5 1
985
1 97
1 le
ss S
ales
of n
on-fi
nanc
ial a
sset
s 3
31
1 42
8 3
33
297
1
95
284
1
467
213
1
81
65
less
Dep
reci
atio
n 1
078
1 16
6 1
236
1 27
5 1
321
1 32
8 1
458
1 50
8 1
541
1 59
5 pl
us C
hang
e in
inve
ntor
ies
41
-26
158
-5
5 1
7 9
-1
4 -2
0 -1
7 -6
7 pl
us O
ther
mov
emen
ts in
non
-fina
ncia
l ass
ets
—
—
—
—
—
—
—
—
—
—
equa
ls T
otal
net
acq
uisi
tion
of n
on-fi
nanc
ial a
sset
s 1
383
64
715
-1
98
205
3
449
34
864
2
46
244
eq
uals
Net
lend
ing/
borr
owin
g -1
424
-7
21
-1 9
44
-116
-5
4 -3
432
-8
6 -7
83
-102
1
47
Not
e: T
otal
s m
ay n
ot a
dd d
ue to
roun
ding
.
(a)
Ther
e is
a s
truct
ural
bre
ak in
201
3–14
in th
e pr
esen
tatio
n of
inte
rest
inco
me
and
inte
rest
exp
ense
. Int
eres
t inc
ome
earn
ed o
n ca
sh a
nd d
epos
its is
offs
et w
ith in
tere
st e
xpen
se o
n th
e bo
rrow
ings
th
e Tr
easu
rer h
as w
ith S
AFA.
Thi
s re
sults
in a
redu
ctio
n to
inte
rest
inco
me
and
inte
rest
exp
ense
acc
ordi
ngly
.
Appendix B: General government and non-financial public sector financial statistics time series
2017–18 Budget Statement 159
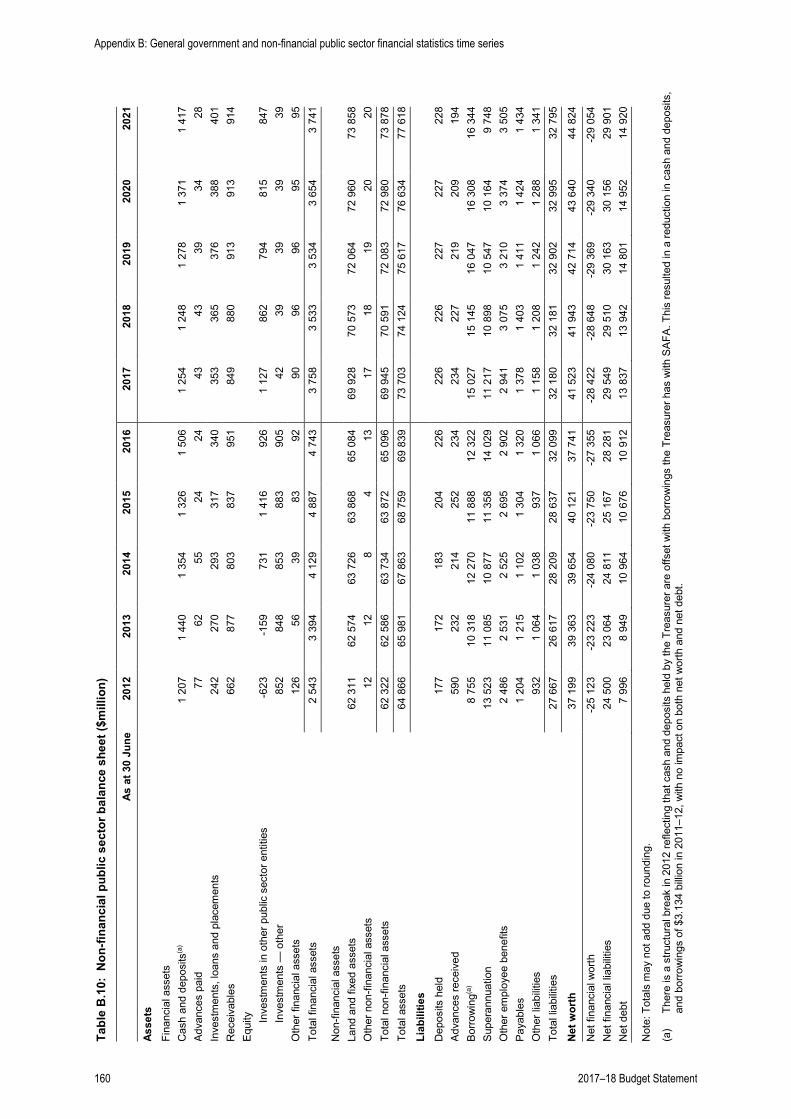
Tabl
e B
.10:
Non
-fina
ncia
l pub
lic s
ecto
r bal
ance
she
et ($
mill
ion)
As a
t 30
June
20
12
2013
20
14
2015
20
16
2017
20
18
2019
20
20
2021
Asse
ts
Fina
ncia
l ass
ets
Cas
h an
d de
posi
ts(a
) 1
207
1 44
0 1
354
1 32
6 1
506
1 25
4 1
248
1 27
8 1
371
1 41
7 Ad
vanc
es p
aid
77
62
55
24
24
43
43
39
34
28
Inve
stm
ents
, loa
ns a
nd p
lace
men
ts
242
2
70
293
3
17
340
3
53
365
3
76
388
4
01
Rec
eiva
bles
6
62
877
8
03
837
9
51
849
8
80
913
9
13
914
Eq
uity
In
vest
men
ts in
oth
er p
ublic
sec
tor e
ntiti
es
-623
-1
59
731
1
416
926
1
127
862
7
94
815
8
47
Inve
stm
ents
— o
ther
8
52
848
8
53
883
9
05
42
39
39
39
39
Oth
er fi
nanc
ial a
sset
s 1
26
56
39
83
92
90
96
96
95
95
Tota
l fin
anci
al a
sset
s 2
543
3 39
4 4
129
4 88
7 4
743
3 75
8 3
533
3 53
4 3
654
3 74
1
Non
-fina
ncia
l ass
ets
Land
and
fixe
d as
sets
62
311
62
574
63
726
63
868
65
084
69
928
70
573
72
064
72
960
73
858
O
ther
non
-fina
ncia
l ass
ets
12
12
8
4
13
17
18
19
20
20
Tota
l non
-fina
ncia
l ass
ets
62 3
22
62 5
86
63 7
34
63 8
72
65 0
96
69 9
45
70 5
91
72 0
83
72 9
80
73 8
78
Tota
l ass
ets
64 8
66
65 9
81
67 8
63
68 7
59
69 8
39
73 7
03
74 1
24
75 6
17
76 6
34
77 6
18
Liab
ilitie
s
Dep
osits
hel
d 1
77
172
1
83
204
2
26
226
2
26
227
2
27
228
Ad
vanc
es re
ceiv
ed
590
2
32
214
2
52
234
2
34
227
2
19
209
1
94
Borro
win
g(a)
8 75
5 10
318
12
270
11
888
12
322
15
027
15
145
16
047
16
308
16
344
Su
pera
nnua
tion
13 5
23
11 0
85
10 8
77
11 3
58
14 0
29
11 2
17
10 8
98
10 5
47
10 1
64
9 74
8 O
ther
em
ploy
ee b
enef
its
2 48
6 2
531
2 52
5 2
695
2 90
2 2
941
3 07
5 3
210
3 37
4 3
505
Paya
bles
1
204
1 21
5 1
102
1 30
4 1
320
1 37
8 1
403
1 41
1 1
424
1 43
4 O
ther
liab
ilitie
s 9
32
1 06
4 1
038
937
1
066
1 15
8 1
208
1 24
2 1
288
1 34
1 To
tal l
iabi
litie
s 27
667
26
617
28
209
28
637
32
099
32
180
32
181
32
902
32
995
32
795
Net
wor
th
37 1
99
39 3
63
39 6
54
40 1
21
37 7
41
41 5
23
41 9
43
42 7
14
43 6
40
44 8
24
Net
fina
ncia
l wor
th
-25
123
-23
223
-24
080
-23
750
-27
355
-28
422
-28
648
-29
369
-29
340
-29
054
Net
fina
ncia
l lia
bilit
ies
24 5
00
23 0
64
24 8
11
25 1
67
28 2
81
29 5
49
29 5
10
30 1
63
30 1
56
29 9
01
Net
deb
t 7
996
8 94
9 10
964
10
676
10
912
13
837
13
942
14
801
14
952
14
920
Not
e: T
otal
s m
ay n
ot a
dd d
ue to
roun
ding
.
(a)
Ther
e is
a s
truct
ural
bre
ak in
201
2 re
flect
ing
that
cas
h an
d de
posi
ts h
eld
by th
e Tr
easu
rer a
re o
ffset
with
bor
row
ings
the
Trea
sure
r has
with
SAF
A. T
his
resu
lted
in a
redu
ctio
n in
cas
h an
d de
posi
ts,
and
borro
win
gs o
f $3.
134
billio
n in
201
1–12
, with
no
impa
ct o
n bo
th n
et w
orth
and
net
deb
t.
Appendix B: General government and non-financial public sector financial statistics time series
160 2017–18 Budget Statement

2016–172017–18 Estimated 2016–17Budget Result Budget
$000 $000 $000
ReceiptsTaxation 3 984 773 4 046 260 3 918 396Commonwealth general purpose grants 6 302 600 5 920 200 6 100 500Commonwealth specific purpose grants 308 240 303 744 304 349Commonwealth National Partnership payments 60 835 22 041 58 661Contributions from state undertakings 298 098 385 537 249 911Fees and charges 553 896 501 073 545 137Recoveries 93 143 1 058 399 709 881Royalties 251 008 226 240 251 538Other receipts 477 503 204 163 152 566Total receipts 12 330 096 12 667 657 12 290 939
PaymentsAppropriation Act 13 942 460 12 732 239 13 163 633Specific appropriation authorised in various Acts 110 411 108 737 106 359Total payments 14 052 871 12 840 976 13 269 992
Consolidated Account financing requirement 1 722 775 173 319 979 053
Borrowing from (+) repayment to (-) South Australian GovernmentFinancing Authority 1 722 775 173 319 979 053
Appendix C: Consolidated Account
Table C.1: Summary of receipts and payments
2017–18 Budget Statement 161
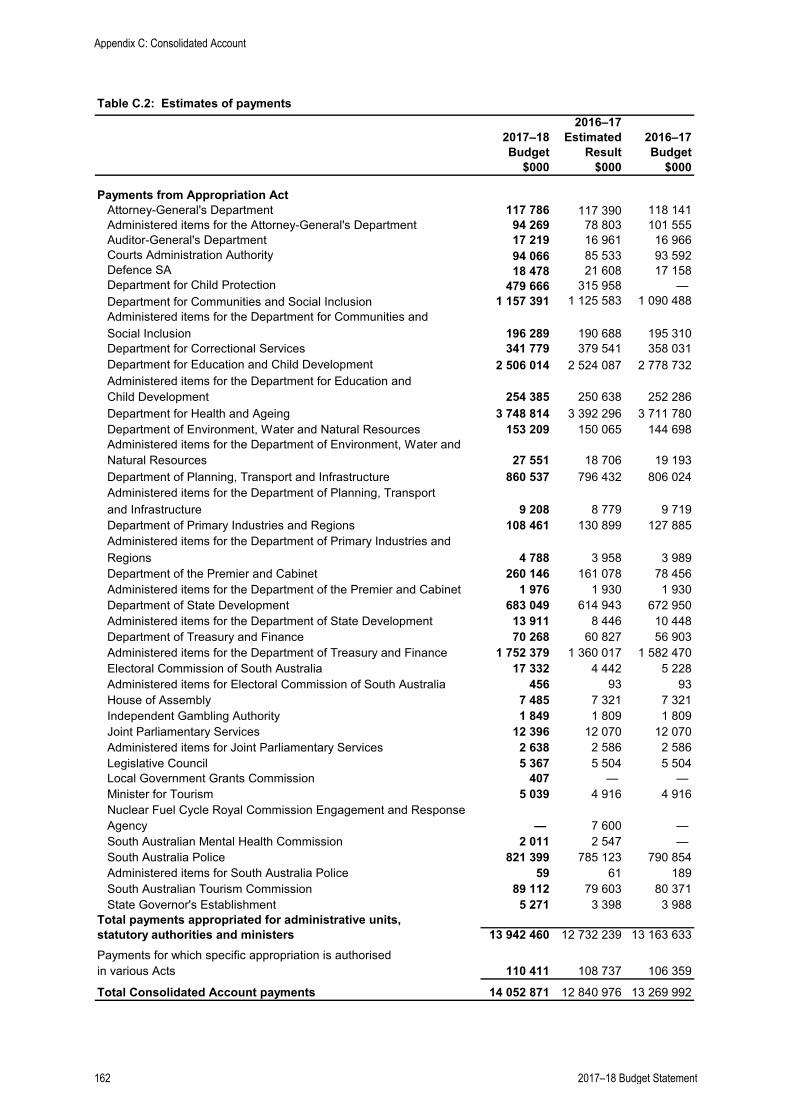
2016–172017–18 Estimated 2016–17Budget Result Budget
$000 $000 $000
Payments from Appropriation Act Attorney-General's Department 117 786 117 390 118 141 Administered items for the Attorney-General's Department 94 269 78 803 101 555 Auditor-General's Department 17 219 16 961 16 966 Courts Administration Authority 94 066 85 533 93 592 Defence SA 18 478 21 608 17 158 Department for Child Protection 479 666 315 958 — Department for Communities and Social Inclusion 1 157 391 1 125 583 1 090 488 Administered items for the Department for Communities and Social Inclusion 196 289 190 688 195 310 Department for Correctional Services 341 779 379 541 358 031 Department for Education and Child Development 2 506 014 2 524 087 2 778 732 Administered items for the Department for Education and Child Development 254 385 250 638 252 286 Department for Health and Ageing 3 748 814 3 392 296 3 711 780 Department of Environment, Water and Natural Resources 153 209 150 065 144 698 Administered items for the Department of Environment, Water and Natural Resources 27 551 18 706 19 193 Department of Planning, Transport and Infrastructure 860 537 796 432 806 024 Administered items for the Department of Planning, Transport and Infrastructure 9 208 8 779 9 719 Department of Primary Industries and Regions 108 461 130 899 127 885 Administered items for the Department of Primary Industries and Regions 4 788 3 958 3 989 Department of the Premier and Cabinet 260 146 161 078 78 456 Administered items for the Department of the Premier and Cabinet 1 976 1 930 1 930 Department of State Development 683 049 614 943 672 950 Administered items for the Department of State Development 13 911 8 446 10 448 Department of Treasury and Finance 70 268 60 827 56 903 Administered items for the Department of Treasury and Finance 1 752 379 1 360 017 1 582 470 Electoral Commission of South Australia 17 332 4 442 5 228 Administered items for Electoral Commission of South Australia 456 93 93 House of Assembly 7 485 7 321 7 321 Independent Gambling Authority 1 849 1 809 1 809 Joint Parliamentary Services 12 396 12 070 12 070 Administered items for Joint Parliamentary Services 2 638 2 586 2 586 Legislative Council 5 367 5 504 5 504 Local Government Grants Commission 407 — — Minister for Tourism 5 039 4 916 4 916 Nuclear Fuel Cycle Royal Commission Engagement and Response Agency — 7 600 — South Australian Mental Health Commission 2 011 2 547 — South Australia Police 821 399 785 123 790 854 Administered items for South Australia Police 59 61 189 South Australian Tourism Commission 89 112 79 603 80 371 State Governor's Establishment 5 271 3 398 3 988Total payments appropriated for administrative units, statutory authorities and ministers 13 942 460 12 732 239 13 163 633
Payments for which specific appropriation is authorised in various Acts 110 411 108 737 106 359
Total Consolidated Account payments 14 052 871 12 840 976 13 269 992
Table C.2: Estimates of payments
Appendix C: Consolidated Account
162 2017–18 Budget Statement
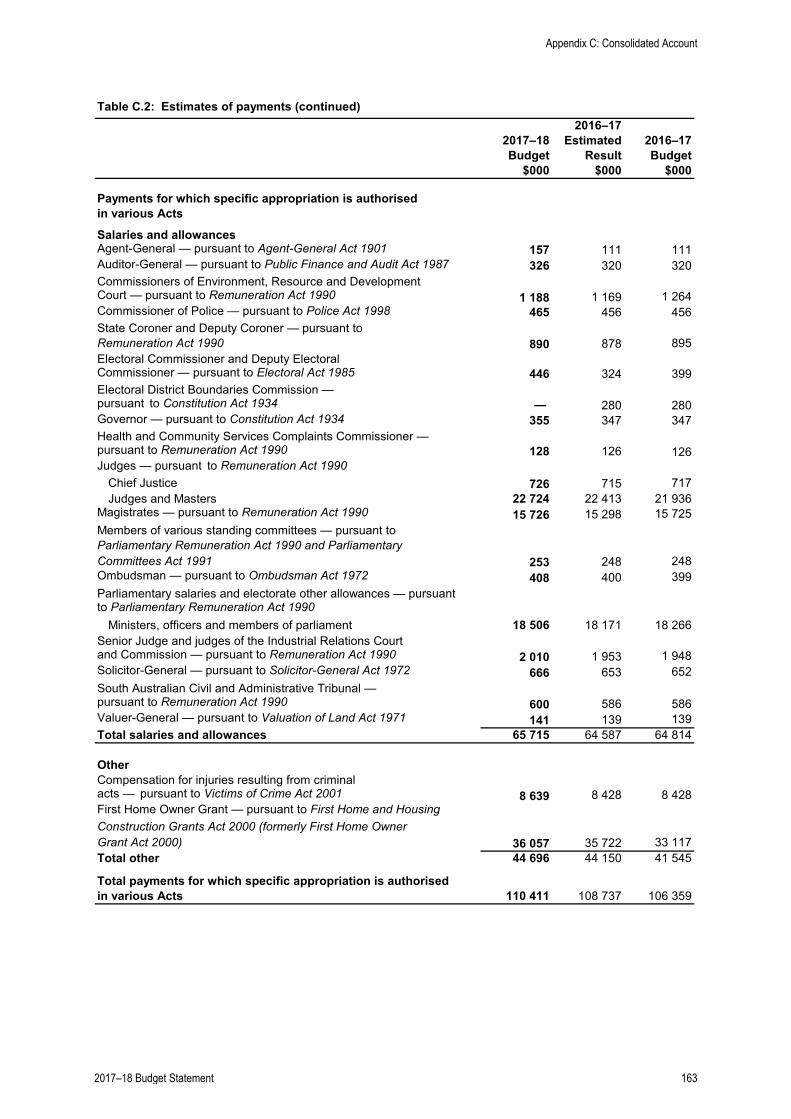
2016–172017–18 Estimated 2016–17Budget Result Budget
$000 $000 $000
Payments for which specific appropriation is authorised in various ActsSalaries and allowancesAgent-General — pursuant to Agent-General Act 1901 157 111 111Auditor-General — pursuant to Public Finance and Audit Act 1987 326 320 320Commissioners of Environment, Resource and DevelopmentCourt — pursuant to Remuneration Act 1990 1 188 1 169 1 264Commissioner of Police — pursuant to Police Act 1998 465 456 456State Coroner and Deputy Coroner — pursuant to Remuneration Act 1990 890 878 895Electoral Commissioner and Deputy Electoral Commissioner — pursuant to Electoral Act 1985 446 324 399Electoral District Boundaries Commission —pursuant to Constitution Act 1934 — 280 280Governor — pursuant to Constitution Act 1934 355 347 347Health and Community Services Complaints Commissioner —pursuant to Remuneration Act 1990 128 126 126Judges — pursuant to Remuneration Act 1990
Chief Justice 726 715 717Judges and Masters 22 724 22 413 21 936
Magistrates — pursuant to Remuneration Act 1990 15 726 15 298 15 725Members of various standing committees — pursuant toParliamentary Remuneration Act 1990 and Parliamentary Committees Act 1991 253 248 248Ombudsman — pursuant to Ombudsman Act 1972 408 400 399Parliamentary salaries and electorate other allowances — pursuant to Parliamentary Remuneration Act 1990
Ministers, officers and members of parliament 18 506 18 171 18 266Senior Judge and judges of the Industrial Relations Courtand Commission — pursuant to Remuneration Act 1990 2 010 1 953 1 948Solicitor-General — pursuant to Solicitor-General Act 1972 666 653 652South Australian Civil and Administrative Tribunal —pursuant to Remuneration Act 1990 600 586 586Valuer-General — pursuant to Valuation of Land Act 1971 141 139 139Total salaries and allowances 65 715 64 587 64 814
OtherCompensation for injuries resulting from criminalacts — pursuant to Victims of Crime Act 2001 8 639 8 428 8 428First Home Owner Grant — pursuant to First Home and Housing Construction Grants Act 2000 (formerly First Home Owner Grant Act 2000) 36 057 35 722 33 117Total other 44 696 44 150 41 545
Total payments for which specific appropriation is authorised in various Acts 110 411 108 737 106 359
Table C.2: Estimates of payments (continued)
Appendix C: Consolidated Account
2017–18 Budget Statement 163
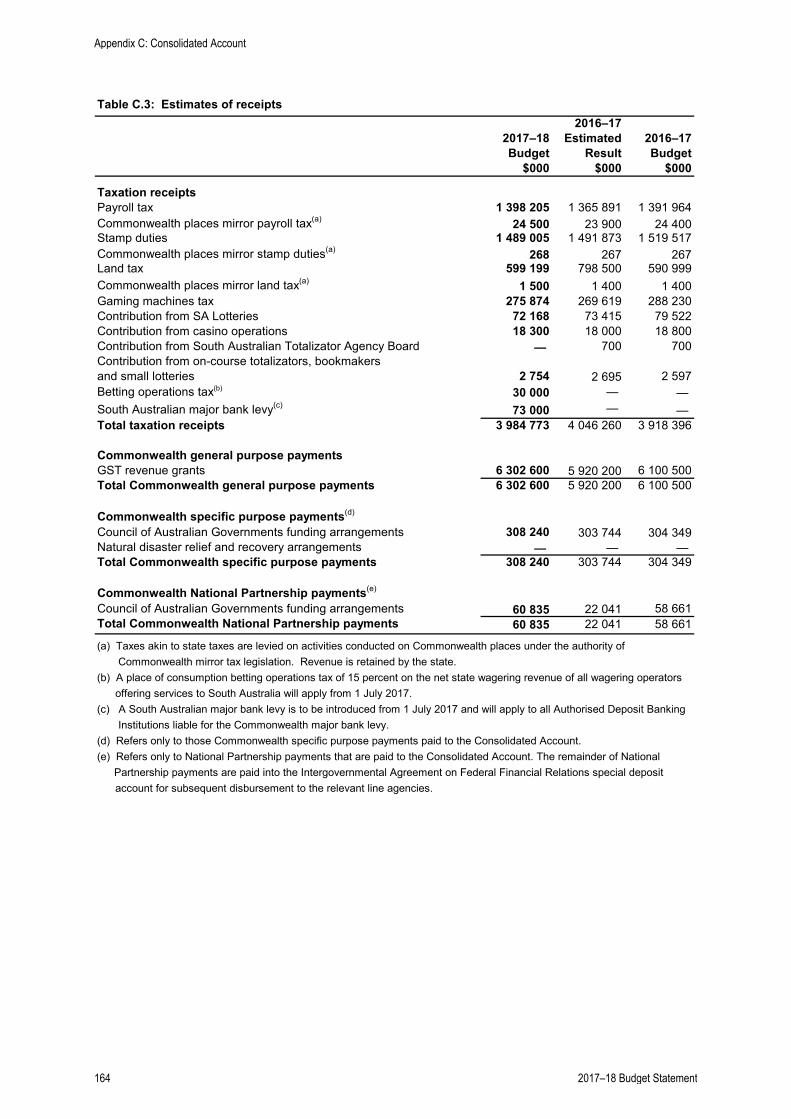
2016–172017–18 Estimated 2016–17Budget Result Budget
$000 $000 $000
Taxation receiptsPayroll tax 1 398 205 1 365 891 1 391 964Commonwealth places mirror payroll tax(a) 24 500 23 900 24 400Stamp duties 1 489 005 1 491 873 1 519 517Commonwealth places mirror stamp duties(a) 268 267 267Land tax 599 199 798 500 590 999Commonwealth places mirror land tax(a) 1 500 1 400 1 400Gaming machines tax 275 874 269 619 288 230Contribution from SA Lotteries 72 168 73 415 79 522Contribution from casino operations 18 300 18 000 18 800Contribution from South Australian Totalizator Agency Board — 700 700Contribution from on-course totalizators, bookmakers and small lotteries 2 754 2 695 2 597Betting operations tax(b) 30 000 — — South Australian major bank levy(c) 73 000 — — Total taxation receipts 3 984 773 4 046 260 3 918 396
Commonwealth general purpose paymentsGST revenue grants 6 302 600 5 920 200 6 100 500Total Commonwealth general purpose payments 6 302 600 5 920 200 6 100 500
Commonwealth specific purpose payments(d)
Council of Australian Governments funding arrangements 308 240 303 744 304 349Natural disaster relief and recovery arrangements — — — Total Commonwealth specific purpose payments 308 240 303 744 304 349
Commonwealth National Partnership payments(e)
Council of Australian Governments funding arrangements 60 835 22 041 58 661Total Commonwealth National Partnership payments 60 835 22 041 58 661
(a) Taxes akin to state taxes are levied on activities conducted on Commonwealth places under the authority of Commonwealth mirror tax legislation. Revenue is retained by the state.(b) A place of consumption betting operations tax of 15 percent on the net state wagering revenue of all wagering operators offering services to South Australia will apply from 1 July 2017.(c) A South Australian major bank levy is to be introduced from 1 July 2017 and will apply to all Authorised Deposit Banking Institutions liable for the Commonwealth major bank levy. (d) Refers only to those Commonwealth specific purpose payments paid to the Consolidated Account.(e) Refers only to National Partnership payments that are paid to the Consolidated Account. The remainder of National
Partnership payments are paid into the Intergovernmental Agreement on Federal Financial Relations special deposit account for subsequent disbursement to the relevant line agencies.
Table C.3: Estimates of receipts
Appendix C: Consolidated Account
164 2017–18 Budget Statement
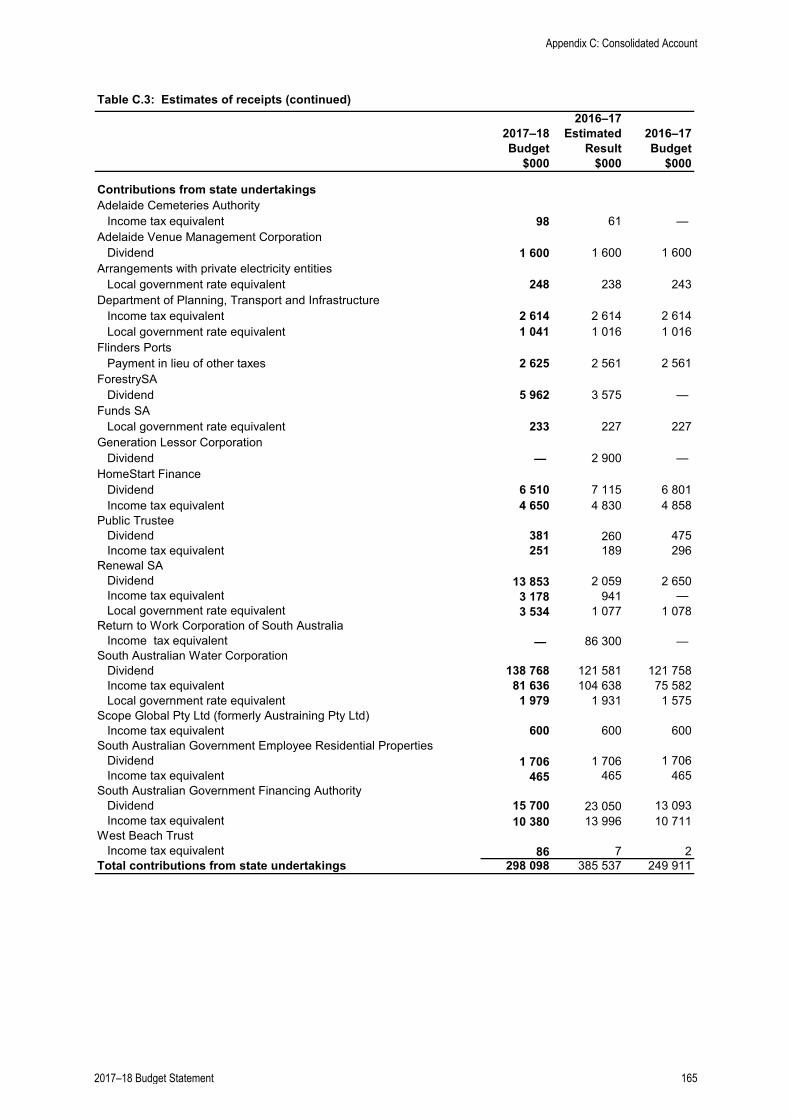
2016–172017–18 Estimated 2016–17Budget Result Budget
$000 $000 $000
Contributions from state undertakingsAdelaide Cemeteries Authority Income tax equivalent 98 61 — Adelaide Venue Management Corporation Dividend 1 600 1 600 1 600Arrangements with private electricity entities Local government rate equivalent 248 238 243Department of Planning, Transport and Infrastructure Income tax equivalent 2 614 2 614 2 614 Local government rate equivalent 1 041 1 016 1 016Flinders Ports Payment in lieu of other taxes 2 625 2 561 2 561ForestrySA Dividend 5 962 3 575 — Funds SA Local government rate equivalent 233 227 227Generation Lessor Corporation Dividend — 2 900 — HomeStart Finance Dividend 6 510 7 115 6 801 Income tax equivalent 4 650 4 830 4 858Public Trustee Dividend 381 260 475 Income tax equivalent 251 189 296Renewal SA Dividend 13 853 2 059 2 650 Income tax equivalent 3 178 941 — Local government rate equivalent 3 534 1 077 1 078Return to Work Corporation of South Australia Income tax equivalent — 86 300 — South Australian Water Corporation Dividend 138 768 121 581 121 758 Income tax equivalent 81 636 104 638 75 582 Local government rate equivalent 1 979 1 931 1 575Scope Global Pty Ltd (formerly Austraining Pty Ltd) Income tax equivalent 600 600 600South Australian Government Employee Residential Properties Dividend 1 706 1 706 1 706 Income tax equivalent 465 465 465South Australian Government Financing Authority Dividend 15 700 23 050 13 093 Income tax equivalent 10 380 13 996 10 711West Beach Trust Income tax equivalent 86 7 2Total contributions from state undertakings 298 098 385 537 249 911
Table C.3: Estimates of receipts (continued)
Appendix C: Consolidated Account
2017–18 Budget Statement 165

2016–172017–18 Estimated 2016–17Budget Result Budget
$000 $000 $000Fees and charges(f)
Auditor-General's Department — fees for audit and other sundry receipts 15 075 14 701 14 701Court fines 67 458 57 795 57 795Court regulatory fees 37 471 36 710 36 539Guarantee fees 155 224 133 182 139 158Infringement notice schemes — expiation fees 72 541 67 722 82 088Land and business regulations 1 789 4 291 4 291Land Services regulatory fees 204 120 186 459 210 364Small lotteries 181 177 165Sundry fees 37 36 36Total fees and charges 553 896 501 073 545 137
RecoveriesAdelaide Oval Sublease Fees 400 200 200Department of Planning, Transport and Infrastructure — indentured ports 10 621 10 432 10 432Department of Environment, Water and NaturalResources — Qualco Sunlands 250 — 250Essential Services Commission of South Australia 13 356 12 917 12 917Fire damage and insurance cost (SAICORP Fund 2) — 7 200 — Fortified Bank Guarantee — Building sale — 5 000 — Government Banking Contract Rebate 1 136 — — Helicopter service — recovery of costs and sponsorships 1 071 1 061 1 040Independent Gaming Corporation contribution to GamblersRehabilitation Fund 2 000 2 000 2 000Metropolitan Drainage Fund 7 7 7National Tax Equivalent Program 50 50 50NRM Levy — Treasurer's Water Licences 376 364 364Return of cash by Defence SA to Consolidated Account following thetransfer of the Techport Common User Facility to the Commonwealth 30 377 — — Purchase of key TAFE SA properties by Renewal SA from the Department of State Development — 610 973 650 000Return of cash to Consolidated Account — cash alignment policy — 373 945 — Return of deposit account balances — — — Return of deposit account balances — superannuation 30 000 30 000 30 000Return to public sector employment — ETSA employees — 1 629 — Sale of government publications and subscriptions 212 206 206Sundry recoupment 961 156 156Unclaimed monies and personal property 2 326 2 259 2 259Total recoveries 93 143 1 058 399 709 881
RoyaltiesDepartment of the Premier and Cabinet(g) 251 008 77 892 —Department of State Development(g) — 148 348 251 538
Total royalties 251 008 226 240 251 538(f) Refers to only those fees and charges paid to the Consolidated Account.(g) Refers to the transition of the Resources and Energy Group of the Department of State Development to the Department of the Premier and Cabinet, effective as of 1 April 2017.
Table C.3: Estimates of receipts (continued)
Appendix C: Consolidated Account
166 2017–18 Budget Statement
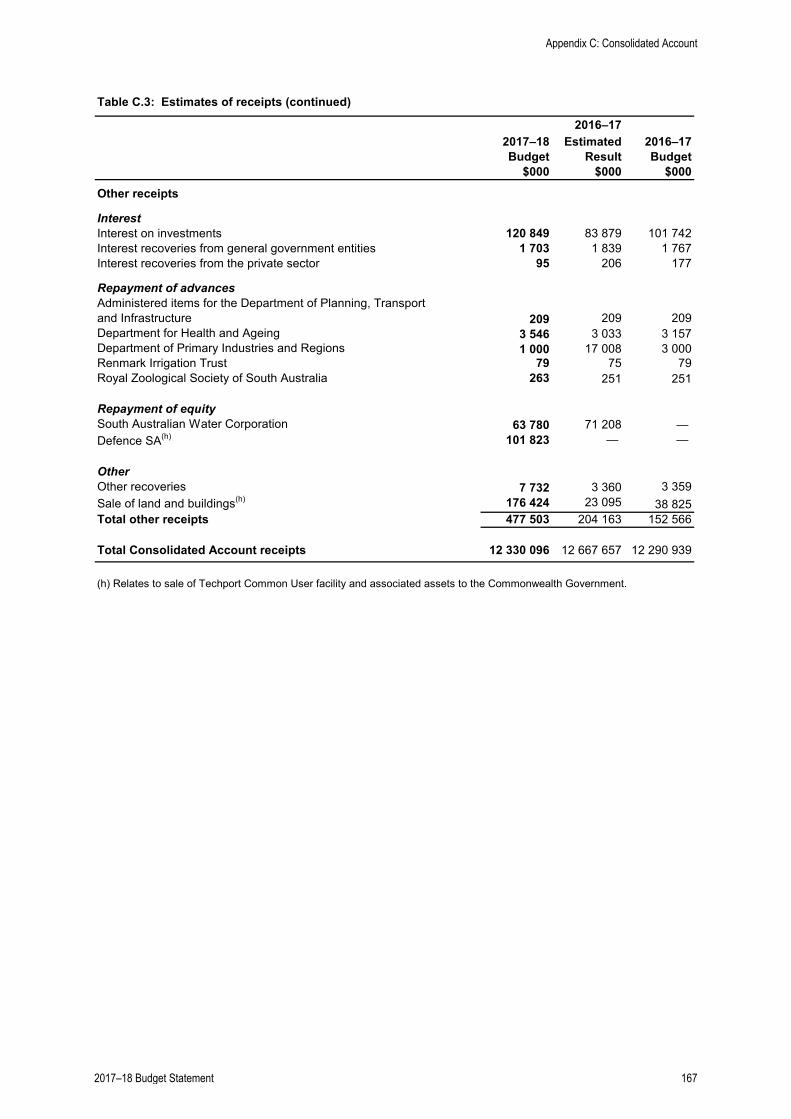
2016–172017–18 Estimated 2016–17Budget Result Budget
$000 $000 $000
Other receipts
InterestInterest on investments 120 849 83 879 101 742Interest recoveries from general government entities 1 703 1 839 1 767Interest recoveries from the private sector 95 206 177
Repayment of advancesAdministered items for the Department of Planning, Transportand Infrastructure 209 209 209Department for Health and Ageing 3 546 3 033 3 157Department of Primary Industries and Regions 1 000 17 008 3 000Renmark Irrigation Trust 79 75 79Royal Zoological Society of South Australia 263 251 251
Repayment of equitySouth Australian Water Corporation 63 780 71 208 — Defence SA(h) 101 823 — —
OtherOther recoveries 7 732 3 360 3 359Sale of land and buildings(h) 176 424 23 095 38 825Total other receipts 477 503 204 163 152 566
Total Consolidated Account receipts 12 330 096 12 667 657 12 290 939
(h) Relates to sale of Techport Common User facility and associated assets to the Commonwealth Government.
Table C.3: Estimates of receipts (continued)
Appendix C: Consolidated Account
2017–18 Budget Statement 167
Appendix C: Consolidated Account
168 2017–18 Budget Statement
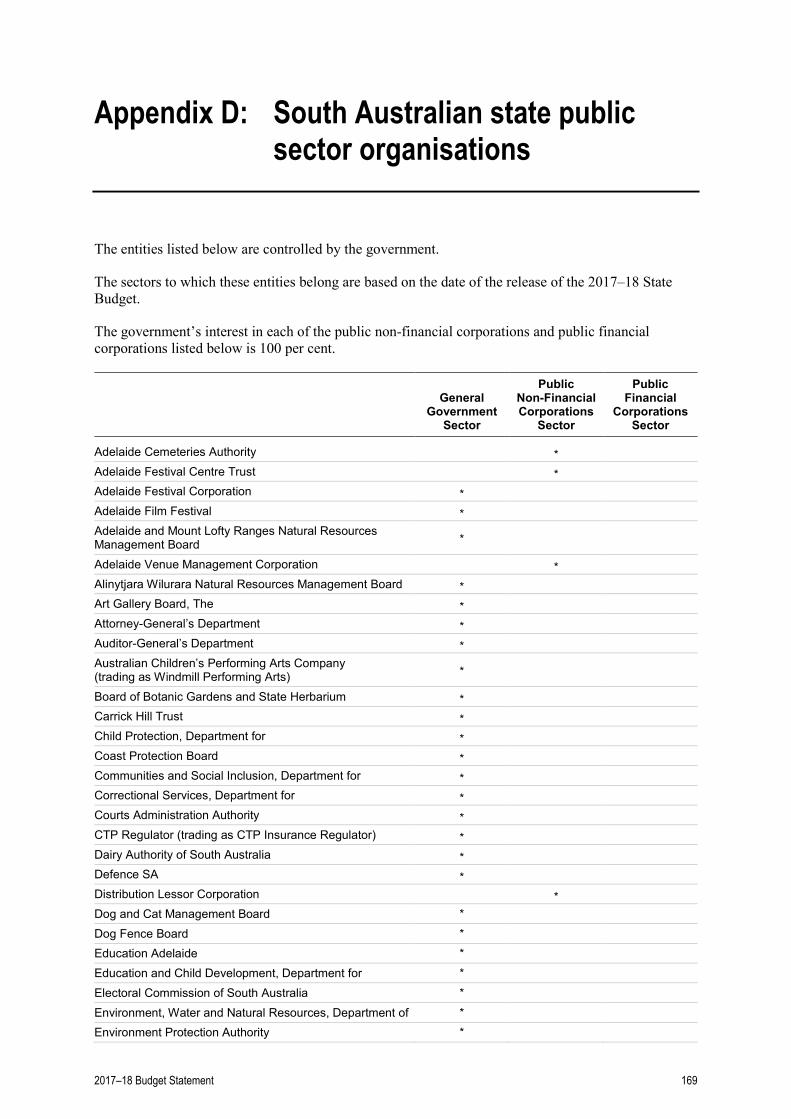
Appendix D: South Australian state public sector organisations
The entities listed below are controlled by the government.
The sectors to which these entities belong are based on the date of the release of the 2017–18 State Budget.
The government’s interest in each of the public non-financial corporations and public financial corporations listed below is 100 per cent.
General
Government Sector
Public Non-Financial Corporations
Sector
Public Financial
Corporations Sector
Adelaide Cemeteries Authority * Adelaide Festival Centre Trust * Adelaide Festival Corporation * Adelaide Film Festival * Adelaide and Mount Lofty Ranges Natural Resources Management Board *
Adelaide Venue Management Corporation * Alinytjara Wilurara Natural Resources Management Board * Art Gallery Board, The * Attorney-General’s Department * Auditor-General’s Department * Australian Children’s Performing Arts Company (trading as Windmill Performing Arts) *
Board of Botanic Gardens and State Herbarium * Carrick Hill Trust * Child Protection, Department for * Coast Protection Board * Communities and Social Inclusion, Department for * Correctional Services, Department for * Courts Administration Authority * CTP Regulator (trading as CTP Insurance Regulator) * Dairy Authority of South Australia * Defence SA * Distribution Lessor Corporation * Dog and Cat Management Board * Dog Fence Board * Education Adelaide * Education and Child Development, Department for * Electoral Commission of South Australia * Environment, Water and Natural Resources, Department of * Environment Protection Authority *
2017–18 Budget Statement 169
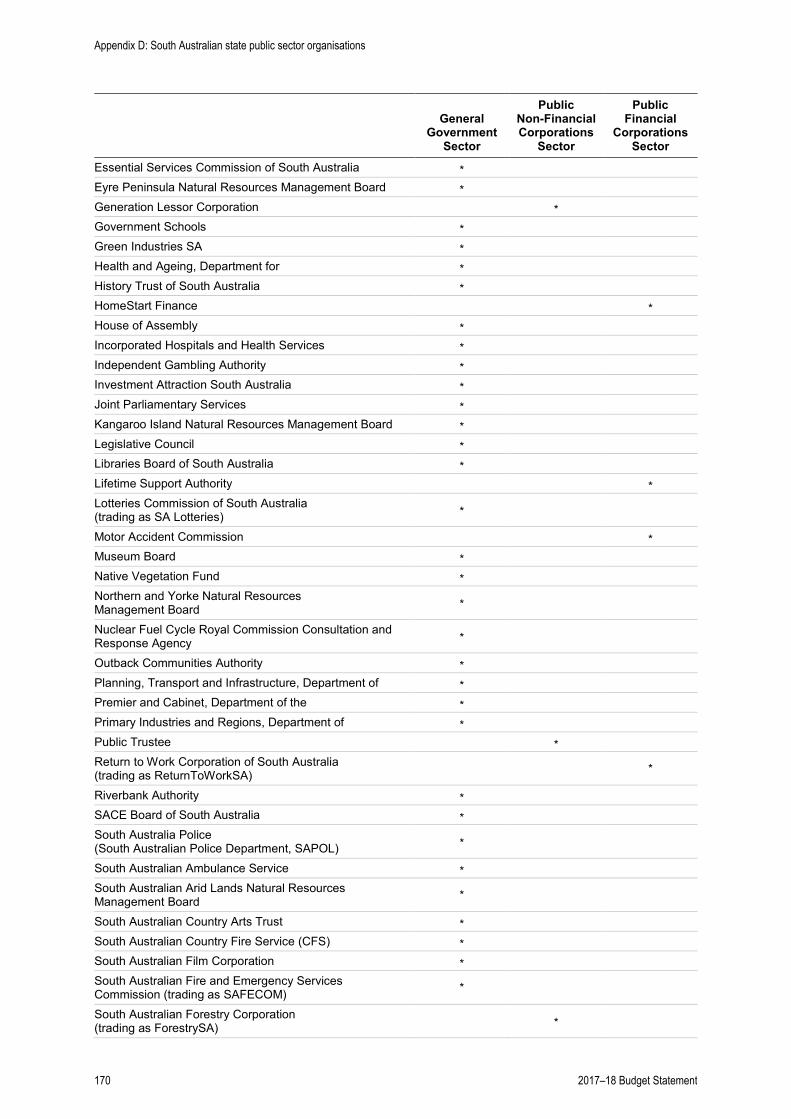
General
Government Sector
Public Non-Financial Corporations
Sector
Public Financial
Corporations Sector
Essential Services Commission of South Australia * Eyre Peninsula Natural Resources Management Board * Generation Lessor Corporation * Government Schools * Green Industries SA * Health and Ageing, Department for * History Trust of South Australia * HomeStart Finance * House of Assembly * Incorporated Hospitals and Health Services * Independent Gambling Authority * Investment Attraction South Australia * Joint Parliamentary Services * Kangaroo Island Natural Resources Management Board * Legislative Council * Libraries Board of South Australia * Lifetime Support Authority * Lotteries Commission of South Australia (trading as SA Lotteries) *
Motor Accident Commission * Museum Board * Native Vegetation Fund * Northern and Yorke Natural Resources Management Board *
Nuclear Fuel Cycle Royal Commission Consultation and Response Agency *
Outback Communities Authority * Planning, Transport and Infrastructure, Department of * Premier and Cabinet, Department of the * Primary Industries and Regions, Department of * Public Trustee * Return to Work Corporation of South Australia (trading as ReturnToWorkSA)
*
Riverbank Authority * SACE Board of South Australia * South Australia Police (South Australian Police Department, SAPOL) *
South Australian Ambulance Service * South Australian Arid Lands Natural Resources Management Board *
South Australian Country Arts Trust * South Australian Country Fire Service (CFS) * South Australian Film Corporation * South Australian Fire and Emergency Services Commission (trading as SAFECOM) *
South Australian Forestry Corporation (trading as ForestrySA) *
Appendix D: South Australian state public sector organisations
170 2017–18 Budget Statement
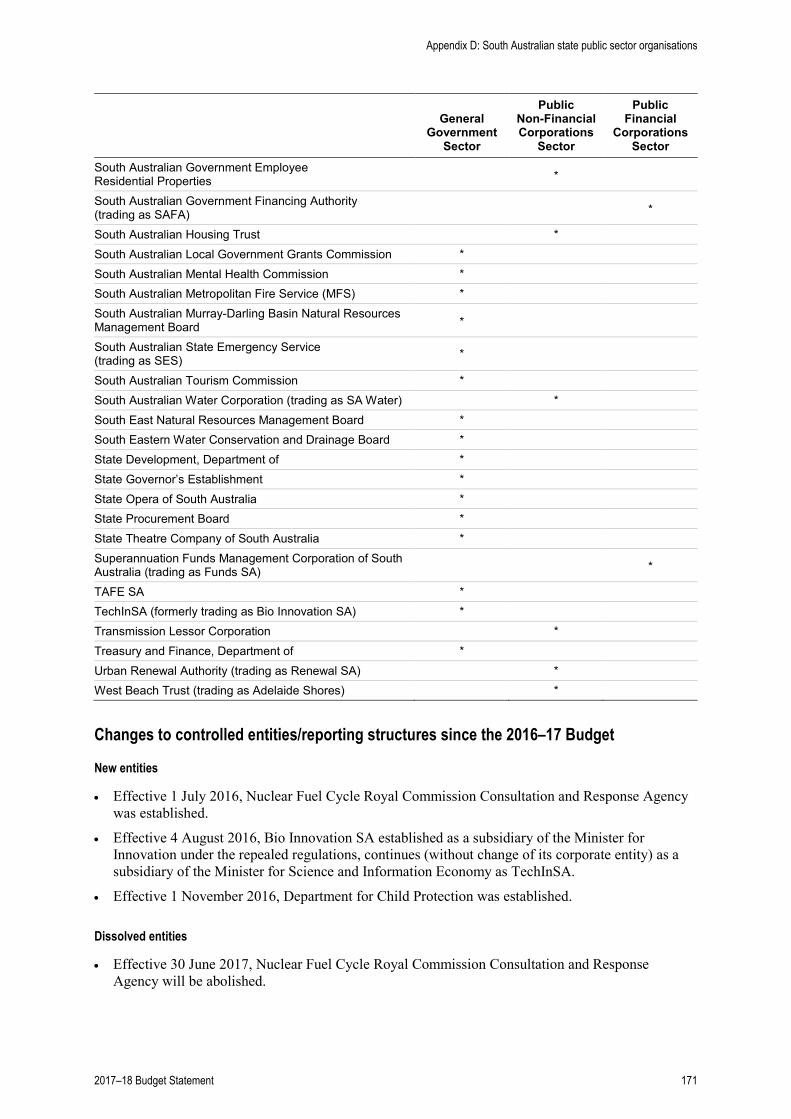
General
Government Sector
Public Non-Financial Corporations
Sector
Public Financial
Corporations Sector
South Australian Government Employee Residential Properties *
South Australian Government Financing Authority (trading as SAFA) *
South Australian Housing Trust * South Australian Local Government Grants Commission * South Australian Mental Health Commission * South Australian Metropolitan Fire Service (MFS) * South Australian Murray-Darling Basin Natural Resources Management Board *
South Australian State Emergency Service (trading as SES) *
South Australian Tourism Commission * South Australian Water Corporation (trading as SA Water) * South East Natural Resources Management Board * South Eastern Water Conservation and Drainage Board * State Development, Department of * State Governor’s Establishment * State Opera of South Australia * State Procurement Board * State Theatre Company of South Australia * Superannuation Funds Management Corporation of South Australia (trading as Funds SA) *
TAFE SA * TechInSA (formerly trading as Bio Innovation SA) * Transmission Lessor Corporation * Treasury and Finance, Department of * Urban Renewal Authority (trading as Renewal SA) * West Beach Trust (trading as Adelaide Shores) *
Changes to controlled entities/reporting structures since the 2016–17 Budget
New entities
• Effective 1 July 2016, Nuclear Fuel Cycle Royal Commission Consultation and Response Agency was established.
• Effective 4 August 2016, Bio Innovation SA established as a subsidiary of the Minister for Innovation under the repealed regulations, continues (without change of its corporate entity) as a subsidiary of the Minister for Science and Information Economy as TechInSA.
• Effective 1 November 2016, Department for Child Protection was established.
Dissolved entities
• Effective 30 June 2017, Nuclear Fuel Cycle Royal Commission Consultation and Response Agency will be abolished.
Appendix D: South Australian state public sector organisations
2017–18 Budget Statement 171
Name change
• Effective 12 May 2016, CTP Regulator was established under the Compulsory Insurance Regulation Act 2016. Operationally, the authority has also become known under its trading name, CTP Insurance Regulator.
Appendix D: South Australian state public sector organisations
172 2017–18 Budget Statement
Appendix E: Tax expenditure statement
Overview
This statement provides a summary of tax expenditures incurred by the Government of South Australia in 2015–16 and 2016−17.
What are tax expenditures?
The term ‘tax expenditure’ refers to differential tax treatment where the difference constitutes a departure from the tax standard or benchmark.
Examples of tax expenditures can include revenue forgone from:
• tax exemptions
• reduced rates of taxation
• tax rebates or deductions
• deferral of the payment of tax liabilities.
Thus a tax expenditure is a reduction in tax revenue resulting from ‘preferential’ tax treatment. In practice, differentiating preferential tax treatment from tax differences that are integral to efficient revenue raising design is not always straightforward.
In the design of expenditure and revenue policy, governments observe various principles of fairness and equity. Such principles apply to decisions on taxation policies as well as decisions that underpin the direction of public expenditure. As a result, a number of differential tax treatments across a broad spectrum of taxpayers and particular activities may arise. Differential treatment afforded to certain taxpayers to achieve social and political objectives rather than tax design objectives constitutes a tax expenditure.
Why measure tax expenditures?
The immediate and direct impact of preferential tax treatment is to reduce the revenue yield from a given tax. In the absence of concessions and exemptions, governments would be able to support a higher level of government spending, or reduce the severity of their tax rates or, if expenditures remain unchanged, reduce their borrowing requirements.
By explicitly publishing estimates of the magnitude of this preferential tax treatment, transparency is increased and the community is made more aware of the government’s fiscal priorities. The government should also be better placed to ensure that resources, in total, are committed to the areas that clearly reflect policy priorities.
2017–18 Budget Statement 173
Valuation of tax expenditures
Tax expenditures in this appendix are calculated according to the revenue forgone method, which involves applying the general structure of a tax to a tax base (that is, a group of people or activities) that is currently exempt from the tax or subject to concessional treatment.
This static approach does not take into account possible behavioural changes which may result from the removal of a tax concession, that is, the revenue forgone approach assumes that taxpayer behaviour will remain unchanged if concessions are removed. Therefore, tax expenditures measured using this approach are likely to be only a broad indication of actual revenue impacts and, more specifically, this approach is likely to overstate the actual revenue forgone as a result of an individual tax concession.
Aside from the absence of assumptions about behavioural responses, the estimates are in many cases approximations, reflecting data limitations and the use of proxy indicators to measure the size of revenue bases relevant to tax concessions.
Benchmark for measuring tax expenditures
Tax expenditures should be quantified by comparing the existing tax structure with a benchmark tax structure based entirely on taxation design principles. In practice, deciding on such a structure does involve some judgements. For example, the benchmark structure used for payroll tax is a flat tax at the current rate with no threshold. There is no particular merit in the current rate from the point of view of tax design but it has been adopted because it is the existing rate. Further, a zero threshold would probably not be desirable from a tax design point of view because the administrative costs of collecting revenue from very small employers might well exceed the revenue collected. However, for the sake of simplicity, a zero threshold has been adopted in this exercise.
Summary
The view has been taken that the extent of tax relief provided through the availability of exemptions, concessions, rebates and allowable deductions is sufficiently important to warrant documentation even if:
• the benchmark against which the tax expenditure is assessed could be argued to be imperfectly defined
• the measurement of those imperfectly defined expenditures is also subject to qualification
• the value of many tax expenditures cannot be quantified.
Many tax expenditures have not been able to be quantified. In particular, there are a large number of exemptions from stamp duties that are not reflected in the estimates due to a lack of information on the size of the affected tax bases. Similarly, a number of exemptions relating to payroll tax have not been quantified. As such, the aggregate total of the estimates contained in table E.1 does not represent the total value of assistance provided by tax expenditures.
The largest tax expenditures are the payroll tax threshold exemption and the land tax exemptions for primary production and the principal place of residence.
The following is a brief summary of the individual tax expenditures that have been quantified.
Appendix E: Tax expenditure statement
174 2017–18 Budget Statement
Payroll tax
Total quantified tax expenditures relating to payroll tax for 2016–17 of $817.9 million represents 72.4 per cent of payroll tax revenue collections (excluding general government collections). This is a $41.9 million increase on the estimated value of payroll tax expenditures in 2015–16 and mainly reflects growth in payrolls.
The largest payroll tax expenditure is the provision of a tax-free threshold. Payroll tax is levied on wages paid by employers and is applied at a rate of 4.95 per cent above an annual threshold of $600 000. The threshold exemption results in a large number of small businesses not being liable for payroll tax. In addition, those businesses that are liable for payroll tax do not have tax liabilities in respect of annual wages below the threshold.
It is estimated that the tax revenue forgone as a result of the existence of the threshold is $587.7 million in 2016–17 for private sector employers. This comprises $443.9 million in revenue forgone from small businesses that are not liable for payroll tax and $143.9 million in respect of employers who are liable for payroll tax but benefit from not paying tax on annual wages up to the threshold.
Several other groups of taxpayers are exempt from payroll tax liabilities, many of which have not been able to be quantified in terms of tax expenditures. Of those that have been calculated, the largest tax expenditure relates to the exemption for public hospitals, which is estimated to amount to $134.5 million in 2016–17. Other expenditures include local government councils ($37.4 million), not-for-profit schools ($19.4 million) and not-for-profit hospital and health providers ($15.0 million).
A payroll tax rebate scheme for small businesses has also been in place since 2013–14. The scheme had a cost of $11.2 million in 2015–16 and is estimated to cost $11.5 million in 2016–17.
Stamp duties
Stamp duties apply to a range of transactions including conveyances, insurance and motor vehicle registration. There are a large number of exemptions contained in stamp duty legislation, many of which cannot be quantified. The total quantifiable tax expenditure on stamp duties in 2016–17 of $197.6 million is equivalent to 13.3 per cent of stamp duty revenues. The total cost of stamp duty tax expenditures has decreased by $65.9 million in 2016–17, mainly due to a decline in the level of corporate reconstruction relief.
Conveyance duty expenditures are estimated to amount to $154.1 million in 2016–17. The stamp duty exemption for non-real property transfers is estimated to cost $34.7 million in 2016–17. The one-third reduction of stamp duty on non-residential real property is estimated to cost $64.9 million.
Eligibility for corporate reconstruction relief was expanded and legislated as part of the government’s tax reform package. Corporate reconstruction relief is estimated to cost $34.2 million in 2016–17 compared to $164.1 million in 2015–16. The level of corporate reconstruction relief can vary significantly between years reflecting the timing of large transactions. The stamp duty exemption for family farm transfers is estimated to cost $15.0 million in 2016–17.
The government introduced a stamp duty concession for eligible apartments purchased off-the-plan in the Adelaide City Council Area from 31 May 2012. A full stamp duty concession was available to 30 June 2014 for eligible apartments valued up to $500 000. A partial concession based on an apartment’s stage of completion was available from 1 July 2014 to 30 June 2016 and the eligible area extended to include the inner metropolitan area of Adelaide. For contracts entered into between 20 June 2016 and 30 June 2017 (inclusive), the concession applies to purchases of off-the-plan apartments located anywhere in South Australia. The exemption is recorded at the time of settlement of the new apartment so there can be substantial timing lags between the signing of eligible off-the-plan contracts and the cost of the exemption.
Appendix E: Tax expenditure statement
2017–18 Budget Statement 175
Approximately $43.5 million of stamp duty tax expenditures in 2016−17 relate to exemptions given in respect of the $60 stamp duty fee payable on the combined renewal certificate for vehicle registration and compulsory third party insurance. Of this, an estimated $14.9 million relates to concessions provided to pensioners and state concession cardholders. The remaining balance mainly relates to conditionally registered vehicles (for example historic and left hand drive vehicles, special purpose vehicles such as fork lifts, tractors, self-propelled farm implements and mobile cranes), government vehicles registered under the Continuous Government Registration Scheme and vehicles owned by local government councils.
Land tax
Total land tax expenditures are estimated to be $1134.6 million in 2016–17. This represents 195.9 per cent of land tax collections (including from government).
Land tax is calculated on the aggregate taxable value of all land held by a person as at 30 June preceding the assessment year. No tax is payable if the total taxable value of all land is less than the tax-free threshold level. The 2016–17 tax-free threshold was set to $332 000. A marginal tax rate structure applies above this threshold, with increasing marginal tax rates applied as the value of landholdings increase.
The major 2016–17 tax expenditures associated with land tax include:
• the primary production exemption (provided it meets certain criteria) — estimated to cost $452.6 million
• the principal place of residence exemption (provided the land is owned by a natural person as distinct from a corporate body) — estimated to cost $294.3 million
• the tax-free threshold — estimated to cost $227.6 million
• other specific exemptions provided in sections 4 and 5 of the Land Tax Act 1936. Exempt categories include caravan parks, residential parks, supported residential facilities, land used for religious purposes, state subsidised hospitals, libraries, parklands, conservation of native flora and fauna, sporting activities and so on. The cost of these exemptions amounts to approximately $160.0 million in 2016–17.
Total land tax expenditures in 2016–17 are higher than estimated in 2015–16. This is primarily a result of a higher cost of providing the land tax threshold, caused by a change in the value composition of ownerships and land value growth of properties under the threshold. The costs of providing the primary production and principal place of residence exemptions have also increased, due to land value growth in both primary production and residential land.
Gambling taxes
Tax expenditures for gambling taxes arise from the gambling tax-free threshold and the differential tax treatments that apply to gaming machine activity in not-for-profit venues and the Adelaide Casino compared with the tax rate structure applying to hotels.
In South Australia, for hotels, gambling tax is levied on net gambling revenue (NGR) above an annual threshold of $75 000. Lower tax structures apply to not-for-profit venues. For the Adelaide Casino the tax rate for non-premium gaming machines is set at the lower of 41 per cent and the average tax rate paid by for-profit venues. The rate of 10.91 per cent of NGR for premium gaming machines was set with regard to tax rates faced by interstate competitors. Total gambling tax expenditure is estimated to be $35.5 million in 2016–17, representing around 9.8 per cent of gambling tax collections.
In 2016–17, it is estimated that the revenue foregone as a result of the existence of the tax-free threshold is $10.2 million. The benefit to not-for-profit venues from lower tax rates is estimated to be
Appendix E: Tax expenditure statement
176 2017–18 Budget Statement
$7.8 million in 2016–17. The benefit to the Adelaide Casino of the tax differential is estimated to be $17.5 million in 2016–17.
Total gambling tax expenditures in 2016–17 are lower than estimated in 2015–16. This is primarily due to a fall in NGR in 2016–17 compared to 2015–16.
Emergency services levy
The emergency services levy (ESL) is intended to provide a comprehensive method of funding emergency services by raising sufficient funds from property holders to support aggregate expenditure on emergency services. The government makes contributions through remissions, pensioner concessions and the levy payable on the government’s own property. The tax expenditure costings measure the difference between standard levy rates and post-remission levy rates which vary depending on land use code and location (for fixed property) and class of vehicle (for mobile property).
The ESL is a structured tax with differential rates of levy on land use types and regions. The motivation for the differential levy rates lies in a desire to achieve some alignment with relative risk of property types, the value of the service provided (related to property value) and regional variation in service levels.
The cost of the fixed property remission is estimated to amount to $25.0 million in 2016–17 and the mobile remission is estimated to cost $3.3 million. Pensioner concessions on the ESL on fixed property are estimated to cost $6.5 million in 2016–17.
Table E.1: Summary of tax expenditures
Tax expenditures ($m) 2015–16(a) 2016–17
Payroll tax Threshold exemption(b) 555.2 587.7 of which:
benefit to existing taxpayers with payrolls above the threshold 140.7 143.9 benefit to employers with payrolls below the threshold 414.5 443.9
Public benevolent institutions 10.6 11.2 Public hospitals exemption 128.9 134.5 Non-profit schools or colleges at or below secondary level 18.6 19.4 Non-profit hospital and health providers exemption 14.4 15.0 Child care centres 0.6 0.6 Local government council exemption 35.3 37.4 Assistance for motion picture production companies 1.1 0.5 Small business payroll tax concession 11.2 11.5 Trainee rebates(c) 0.1 — Total for payroll tax 775.9 817.9
Stamp duties Conveyance duty
Family farm exemption 11.2 15.0 Corporate reconstructions 164.1 34.2 Off-the-plan stamp duty concession 9.3 5.3 Non-real property stamp duty exemption 21.3 34.7 Non-residential property stamp duty reduction 18.6 64.9
Stamp duty on renewal certificate for motor vehicle registration and compulsory third party insurance (CTP)
The Crown and vehicles registered under the 1.0 1.2 Continuous Government Registration Scheme
Appendix E: Tax expenditure statement
2017–18 Budget Statement 177
Tax expenditures ($m) 2015–16(a) 2016–17 Hire vehicles with more than 12 seats 0.1 0.1 Councils 0.2 0.2 Conditionally registered vehicles 23.9 26.9 Incapacitated ex-servicemen and other persons 0.2 0.2 Pensioners and eligible low-income earners 13.5 14.9
Stamp duty on motor vehicle registrations General remissions <0.1 <0.1
Total for stamp duties 263.5 197.6
Land tax Threshold exemption 223.6 227.6 Principal place of residence(d) 284.7 294.3 Primary production(d) 447.7 452.6 Caravan parks and residential parks(d) 1.5 1.5 Supported residential facilities(d) 0.5 0.5 For-profit aged care facilities(d) 3.0 3.1 Other exemptions(e) 150.6 154.9 Total for land tax 1 111.6 1 134.6
Gambling taxes Threshold exemption 10.4 10.2 Casino(f) 18.0 17.5 Differential treatment of non-profit businesses 8.0 7.8 General remissions <0.1 <0.1 Total for gambling taxes 36.4 35.5
Other taxes on property Emergency services levy
Pensioner concessions 6.4 6.5 General remissions
fixed property(g) 24.1 25.0 mobile property 3.1 3.3
Total for other taxes on property 33.6 34.8
Total expenditures 2 221.0 2 220.4
Note: Totals may not add due to rounding.
(a) Costings of specific exemptions for 2015–16 may differ from those published in the 2016–17 Budget reflecting new data.
(b) The value of the threshold exemption is based on total taxable wages in the relevant financial year.
(c) The trainee rebate was abolished from 1 July 2010. Amounts paid in 2015–16 relate to timing of rebate claims.
(d) Consistent with the approach taken for other taxes in this table, the cost of these land tax exemptions has been calculated assuming the current land tax rates and thresholds apply.
(e) Includes a wide range of exemptions provided to land used for a number of specific activities under section four of the Land Tax Act 1936. Some of these include land used for religious purposes, state subsidised hospitals, libraries, parklands, conservation of native flora and fauna as well as sporting activities.
(f) This has been estimated by applying the gaming machine tax rate structure applicable to for-profit venues.
(g) $2.4 million in remissions relating to 2014–15 ESL has been removed from the 2015–16 estimate.
Appendix E: Tax expenditure statement
178 2017–18 Budget Statement
Glossary of terms used in the budget statement
Assets: Resources controlled by the entity as a result of past events and from which future economic benefits are expected to flow to the entity.
Balance sheet: A statement showing the financial position (at a specific time) of a reporting entity in terms of its recognised assets, liabilities and equity at the end of a reporting period.
Cash flow statement: A statement showing the inflows and outflows of cash and cash equivalents of a reporting entity during the reporting period. Cash flows are classified as operating, investing and/or financing activities.
Consolidated Account: The government’s main operating account, from which appropriations are paid and revenues of the state are credited, created pursuant to the Public Finance and Audit Act 1987.
Consumer Price Index (CPI): A general indicator of the rate of change in prices paid by households for consumer goods and services published by the Australian Bureau of Statistics (ABS).
Contingent asset: A possible asset that arises from past events and whose existence will be confirmed by the occurrence or non-occurrence of uncertain future events not wholly within the control of the entity.
Contingent liability: A possible obligation that arises from past events and whose existence will be confirmed by the occurrence or non-occurrence of uncertain future events not wholly within the control of the entity; or a liability that does not meet the recognition criteria.
Financial reports: Financial reports for the various sectors of the public sector are also produced in accordance with the uniform presentation framework. These are the operating statement, balance sheet and cash flow statement.
General government: The sector of government that includes all government agencies that provide services free of charge or at prices significantly below the cost of production or provide regulatory services.
Government Finance Statistics (GFS): Statistics that measure the financial activities of governments and reflect the impact of those activities on other sectors of the economy. GFS is based on international statistical standards.
GFS transactions: Changes to assets, liabilities and equity that arise from mutually agreed interactions between entities.
Government Purpose Classification: A system used to classify expenses and net acquisition of non-financial assets of the public sector in terms of the purposes for which the transactions are made.
Gross Domestic Product (GDP): The total market value of all final goods and services produced within a country in a given period after deducting the cost of goods and services used up in the process of production, but before deducting allowances for the consumption of fixed capital. It is an indicator of the level of economic activity in the market sector, and percentages changes in it are used as a measure of a country’s rate of economic growth.
2017–18 Budget Statement 179
Gross State Product (GSP): The total market value of goods and services produced within a state in a given period after deducting the cost of goods and services used up in the process of production, but before deducting allowances for the consumption of fixed capital.
Horizontal fiscal equalisation (HFE): The principle underlying the Commonwealth Grants Commission’s assessment of per capita relativities, which are the basis for the interstate distribution of general revenue grants. Under this principle, grants are distributed so as to give each state and territory the capacity to provide public services at an average standard and level of efficiency, for comparable revenue effort.
Income (revenue): Increases in economic benefits during the accounting period in the form of inflows or enhancements of assets or decreases of liabilities that result in increases in equity, other than those relating to contribution by owners.
Income tax equivalent (ITE): Payments equivalent to income tax that certain public authorities or business units (if a legal entity) would be liable to pay under the Commonwealth Government’s Income Tax Assessment Act 1997, were that public authority or business unit (if a legal entity) not an instrumentality of the Crown in right of the State of South Australia.
Investment expenditure: Comprises projects and programs that result in the capitalisation of assets on the balance sheet. They include the acquisition and construction of, or addition to non-current assets, including property, plant and equipment and other productive assets. Examples include roads, hospitals, medical equipment and schools.
Liabilities: Present obligations arising from past events, the settlement of which is expected to result in an outflow from the entity of resources embodying economic benefits.
Net debt: The sum of deposits held, advances received and borrowing, minus the sum of cash and deposits, advances paid, and investments, loans and placements.
Net financial liabilities: Total liabilities less financial assets, other than equity in non-financial public corporations and in public financial corporations. This measure is broader than net debt as it includes significant liabilities other than borrowings, such as unfunded superannuation and long service leave entitlements.
Net financial worth: Net financial worth measures a government’s net holdings of financial assets. It is calculated from the balance sheet as financial assets minus liabilities. It differs from net financial liabilities in that equity in non-financial public corporations and public financial corporations are included as assets.
Net lending/borrowing position: A GFS measure of the net operating balance, less acquisition of non-financial assets, plus consumption of fixed capital (depreciation). Measures the extent to which accruing operating expenses (less depreciation) and investment expenditures are funded by revenues.
Net operating balance: A GFS measure of the operating result of a sector of government. It is the excess of GFS revenue over GFS expenses.
Net worth: Net worth is calculated as total assets (both financial and non-financial) minus total liabilities, shares and other contributed capital. Net worth incorporates a government’s non-financial assets, such as land and other fixed assets, as well as financial assets and liabilities not captured by the net debt measure, most notably accrued employee superannuation liabilities, debtors and creditors.
Non-financial public sector: The consolidation of the general government sector and public non-financial corporations sector.
Glossary of terms
180 2017–18 Budget Statement
Operating expenses: A decrease in economic benefits during the accounting period in the form of outflows or depletion of assets, or incurrence of liabilities that result in decreases of equity other than those relating to distributions to owners.
Operating statement: The financial statement disclosing all income and expenses (and their sources) of a reporting entity recognised in the reporting period unless an accounting standard requires otherwise.
Other economic flows: Changes to assets, liabilities and equity that are not the result of GFS transactions.
Public financial corporation (PFC): Government controlled entity that is mainly engaged in financial intermediation or the provision of auxiliary financial services.
Public non-financial corporation (PNFC): Government controlled entity that is mainly engaged in the production of market goods and/or non-financial services, which recovers a significant portion of its costs through user charges.
Real terms: Estimates of financial aggregates in real terms reflect adjustments made in order to take account of the impact of rising prices on the purchasing power of money. Throughout this budget paper, reference is made to real term aggregates and growth rates. All real terms calculations use the Adelaide CPI, unless specifically stated otherwise.
Sector: An ABS national accounting concept used to group entities with similar economic characteristics. Sectors comprising the public sector are general government, public non-financial corporations and public financial corporations.
State Final Demand (SFD): A measure of spending in a state economy. The estimate obtained by summing government final consumption expenditure, household final consumption expenditure, private gross fixed capital formation and the gross fixed capital formation of public corporations and general government.
Unfunded superannuation liability: The amount by which the liabilities of a superannuation scheme or schemes (measured as the present value of expected future superannuation benefits that have accrued to members) at the reporting date exceeds the value of assets held by the superannuation scheme or schemes to meet those benefits.
Uniform presentation framework (UPF): The reporting framework agreed by the Commonwealth Government and state and territory governments, to ensure all governments provide a common ‘core’ of financial information in their budget papers (refer to Appendix A).
Glossary of terms
2017–18 Budget Statement 181
Glossary of terms
182 2017–18 Budget Statement
Department of Treasury and Finance
State Administration Centre 200 Victoria Square, Adelaide South Australia, 5000
GPO Box 1045, Adelaide South Australia, 5001
Telephone: +61 (08) 8226 9500 www.treasury.sa.gov.au