Embed Size (px)
Citation preview

Budget Work Session
December 13, 2017
*Slides Updated as Marked

1. Recap for Board Directors2. SMART Goal 3 – Program
Summaries/Other Follow Up3. WSS Committee work update4. 2016-17 Year End 5. Current projection for 2018-19 and
beyond• Levies• Transportation
Agenda
Budget Work Session 12/13/2017 Presented by JoLynn Berge 2

• Final list of SMART Goal 3 – Program Summaries for 2017-18
• Understanding of 2016-17 Year End
• Understanding of current projection for 2018-19 and beyond
Outcomes
Budget Work Session 12/13/2017 Presented by JoLynn Berge 3

Budget Recap for Board Directors
Budget Work Session 12/13/2017 Presented by JoLynn Berge 4

General Fund – the operating budget
Associated Student Body (ASB) Fund – accounts for funds raised by students to support extracurricular activities
Debt Service Fund – used to pay the principal and interest on bonds we issue
Capital Projects Fund – used to fund construction, renovation of our facilities and improvements to our systems
Our Budget Has Four Funds
Budget Work Session 12/13/2017 Presented by JoLynn Berge 5

2017-18 Adopted Budget
Budget Work Session 12/13/2017 Presented by JoLynn Berge 6
TotalExpenditures
General Fund ASB Fund Debt Service Fund
Capital Projects Fund
$857,737,940 $6,707,000 $2,576,650 $279,592,533
Adopted Budget is only for Expenditures

Five Year Trend –Actual Expenditure/ Budget
7
$591.4
$639.3
$689.4
$753.1
$789.7
$857.7
$569.8
$611.7
$648.1
$710.6
$752.2
$500.0
$550.0
$600.0
$650.0
$700.0
$750.0
$800.0
$850.0
$900.0
2012-13 2013-14 2014-15 2015-16 2016-17 2017-18 (Adopted)
Total General FundAdopted Budget vs. Actual Expenditures
Total GF Adopted Total GF Expenditures
$807.7
Budget Work Session 12/13/2017 Presented by JoLynn Berge

Where does our money come from?
Budget Work Session 12/13/2017 Presented by JoLynn Berge 8
State57.3%
Local23.4%
Federal6.5%
Other Revenue5.8%
Other Resources7.0%
2017-18 Budgeted Resources by Typepercentages may not total to 100% due to rounding

Where does our money go by state activity?
Budget Work Session 12/13/2017 Presented by JoLynn Berge 9
Teaching Activities62.6%
Teaching Support9.7%
Other Support Activities15.7%
Principal's Office6.1%
Central Administration6.0%
2017-18 Budgeted Expenditure by State Activitypercentages may not total to 100% due to rounding
$857.7million
72.3 % of our budget is spent on the state activity for Teaching and Teaching Support.
This includes teachers, nurses, librarians, counselors, instructional assistants, textbooks and student supplies.

How much do we spend directly on our students compared to support services?
Budget Work Session 12/13/2017 Presented by JoLynn Berge 10
Direct Services in Schools
80.4%
Support Services19.6%
2017-18 Budget ComparisonDirect Services to Support Services
$857.7million
HOW DO WE CLASSIFY DIRECT SERVICES?Direct Services can be categorized in two groups, 1) the school allocation budget which is managed by the individual schools, and 2) centrally held budget that pays for staff and supplies that are exclusively in the schools, such as teachers, nurses, instructional assistants, custodians and food service workers. This also includes the utilities that heat our schools and the costs of transporting students to and from school.
HOW DO WE CLASSIFY SUPPORT SERVICES?Support Services include the staff that do not work directly in the schools with students, but rather support the staff in schools and are instrumental to running a district. Support Services include the costs of processing payroll, paying bills, administering programs, managing grants and hiring staff. It also includes the costs of our technology team, our delivery drivers, warehouse staff and insurance.
*Updated Slide

Program codes describe the direct expenses using state defined programs (e.g. basic education, special education, etc.). State defined Activity codes label expenses by the activities accomplished with the expense (e.g. teaching, counseling, maintenance and utilities, etc.). Certain Activity codes, such as teaching, may be used with many programs, while other activities are restricted to a limited number of programs.
Where does our money go by state program?
Budget Work Session 12/13/2017 Presented by JoLynn Berge 11
Regular Instruction49%
Special Education 17%
Vocational Education & Skills Center, 2%
Compensatory Education, 7%
Other Instructional Programs, 6%
Support Services19%
2017-18 Budgeted Expenditures by State Programpercentages may not total to 100% due to rounding

Where does our money go by state object?
Budget Work Session 12/13/2017 Presented by JoLynn Berge 12
Certificated Salaries46.1%
Classified Salaries18.3%
Employee Benefits21.8%
Supplies / Materials4.5%
Purchased Services9.2%
2017-18 Budgeted Expenditure by State Objectpercentages may not total to 100% due to rounding
Object codes represent expenses in a way that describes the item or service that was purchased or performed such as salaries and benefits, supplies and materials, contract services, etc. Objects may be used in combination with nearly all program and activity codes.
SMART Goal 3 – Program Summaries/Other Follow Up
Budget Work Session 12/13/2017 Presented by JoLynn Berge 13

SMART Goal 3 Update• BAR will come to the next A&F meeting to change language
from “Program Review” to “Program Summary”• Reformatted list• Added Decatur, Fairmont Park and Thurgood Marshall, but will
include them as part of Advanced Learning• Eliminated Athletic Directors• Combined Athletic Programs and Athletic Transportation into
Athletics• Retitled Nurses/Health Services to Health Services• Selection of final 10 Program Summaries
14Budget Work Session 12/13/2017 Presented by JoLynn Berge
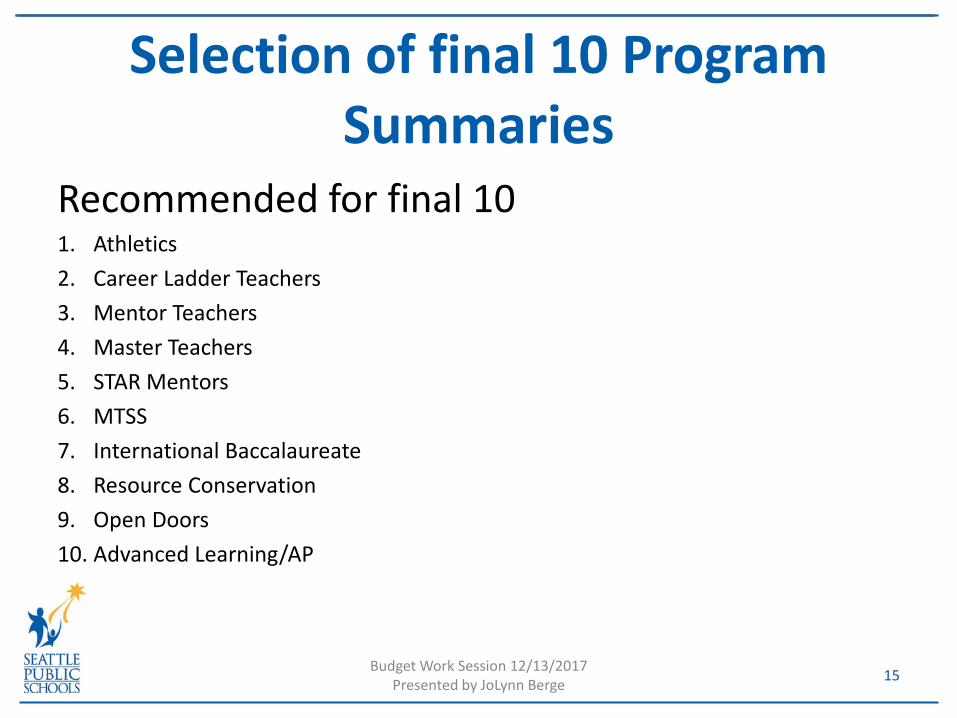
Recommended for final 101. Athletics2. Career Ladder Teachers3. Mentor Teachers4. Master Teachers5. STAR Mentors6. MTSS7. International Baccalaureate8. Resource Conservation9. Open Doors10. Advanced Learning/AP
Selection of final 10 Program Summaries
15Budget Work Session 12/13/2017 Presented by JoLynn Berge

Program Review: AnalysisCategory Examples Description
Student services
English Language LearnersHighly CapableSpecial EducationSpecial Education transportation
Services and supports that follow all students regardless of the school attended
Athletics Programs
Behavior Health Homeless transportation
Educational programs
Creative Advantage SchoolsK-8 ProgramsProyecto Saber Skills CenterSmall schools per 1997 Standard
Educational programs offered in some schools but not others
Advanced Learning/APInternational Baccalaureate
Arts on the ClassroomCreative Approach schoolsElementary instrumental musicInstructional TVInternational SchoolsNative American Summer SchoolKNHC radio station
Advanced Learners
Cascadia Education programs for advanced learnersDecatur
Fairmont ParkThurgood Marshall
16
Categorizationof Programs for Review
Budget Work Session 12/13/2017 Presented by JoLynn Berge

Program Review: Analysis
Categorizationof Programs for Review
Category Examples Description
Non-TraditionalPrograms
South LakeOpen Doors
Cascade K-12 Parent PartnershipInteragencyOriginal Van Asselt
Option schools
Cedar Park ElementaryCenter High SchoolF.A. McDonald International ElementaryGrover Cleveland STEM High SchoolHazel Wolf K-8John Stanford International ElementaryLicton Springs K-8Lousia Boren STEM K-8Orca K-8Pathfinder K-8Queen Anne ElementarySalmon Bay K-8Seattle World SchoolSouth Shore K-8TOPS K-8
Schools families can request during Open Enrollment and students apply to attend
Alternative schools
NovaMiddle College
Alternative Learning Experience (ALE) schools for students supervised by a student learning plan
17Budget Work Session 12/13/2017 Presented by JoLynn Berge

Program Review: AnalysisCategory Examples Description
School staffing
Career ladder teachersMaster TeachersMentor TeachersMulti-tiered system of Supports (MTSS)STAR Mentors
FTE positions and stipends for school-based educational staff
Elementary counselorsFamily support workersLibrarian servicesNurses/Health Services
Non-educational programs
Building rentalsCustodial overtime
Other investments not directly linked to educational services and programming
Resource conservation program
Two tier busingBreakfast After the Bell
18
Categorizationof Programs for Review
Budget Work Session 12/13/2017 Presented by JoLynn Berge

• These are in NO particular order. Meant to be limited to 2 pages.
• They do NOT indicate programs/operations considered for budget cuts or budget adds, its simply a gathering of information/facts.
• Programs/Operations listed are those which we have received questions about.
• Budget staff are drafting these and asking program staff for assistance.
• We list each option school separately at this point to gather history about each one.
Reminder – Program Summaries
Budget Work Session 12/13/2017 Presented by JoLynn Berge 19

Goal 3. Fiscal Integrity
Nbr Performance Measure2013-2014
Actual2014-2015
Actual2015-2016
Actual2016-2017
Actual
Change fromlast year
(up = improved, down = declined,
sidewa ys = less than 1 percent change)
Business Owner
16 Percent of budget spent on instruction (s) 77.2% (y) 78.0% 76.9% (y) 77.3% JoLynn Berge
17 Percent of Fund Balance - General Fund (t) 4.1% 4.3% 4.1% 3.0% (y) JoLynn Berge
18Central Office administration as a percent of totalexpenditures (d) (s) 5.8% 6.4% 6.2% 6.2%
(no change)JoLynn Berge
19 Percent of Prior Years' Audit issues resolved 81.0% 62.5% 68.9% 72.0% JoLynn Berge
20Audit findings resolved as determined by subsequent audits(w) (x)
86.0% 73.0% 78.3% 91.3% JoLynn Berge
21 Strategic sourcing as a percent of total spend 17.0% 21.6% 25.7% 17.1% JoLynn Berge
22Standard & Poor's non-tax vs tax; Moody's non-tax vs tax bondratings AA/Aaa (y) AA/Aaa (y) AA/Aaa (y) AA/Aaa
(no change)JoLynn Berge
23OSPI Financial Indicator Index - Below 1.5 is "FinancialWarning" 3.25 3.25 3.40 TBD by OSPI
in Mar 2018 TBD JoLynn Berge
Notes:(d): A lower number indicates better performance or result.(s): Source is F-196 Activity Expenditure Summary.(t): Funds and methodology changed: Economic Stabilization Account or “Committed FB” as a “percent of the total actual general fund expenditures of the most recently completed fiscal year.” (Policy No. 6022)(w): Metric 20: Minor change is to remove the word “state”. Original metric name: ‘Audit findings resolved as determined by subsequent state audits’. The new metric’s name: ‘Audit findings resolved as determined by subsequent audits’. The District’s new Audit Response Manager feels the consolidated measure address the core of the issue: How timely the district closes out audit issues.(x): Metric 20 definition: Audit issues include all Financial, Federal, Accountability, Performance, and Investigative findings as measured by Audit Reports issued by the State Auditor's Office (SAO) and by the Seattle Public Schools internal auditor. Per Audit Standards the District must report on the status of prior audit findings. The data comes from the Audit Log prepared by the Audit Response Manager.(y): Data revised from previously reported performance. 20

WSS Committee
Budget Work Session 12/13/2017 Presented by JoLynn Berge 21

1. Title I and LAP staffing used in Assistant Principal allocations - $1.05M
2. Rename Free and Reduced Lunch allocations to “Equity Dollars”- no cost
3. Inflate Equity Dollars based on inflation -$123k
4. Inflate Per Student Allocation based on inflation - $114k
Draft Proposals - Review
Budget Work Session 12/13/2017 Presented by JoLynn Berge 22

High School• More differentiation by enrollment in formula• Maintain flexibility
Middle School• Reduce class size• All schools receive .5 House Administrator for restorative
justice/MTSS
Elementary School• In process of completing survey• Focusing on use of K-3 staffing
Draft Proposals – New
Budget Work Session 12/13/2017 Presented by JoLynn Berge 23

K-3 Class Size • $14m-$15m and over 100 FTE• Increase staffing to non-high poverty schools• Increase staffing to other schools based on Equity Tiering that
already receive more staffing• Menu of choices
– Lack of physical space– Focus on gap closing strategies/MTSS– Increase flexibility to meet individual school needs
Draft Proposals – New
Budget Work Session 12/13/2017 Presented by JoLynn Berge 24

Budget Work Session 12/13/2017 Presented by JoLynn Berge 25
2016-17 Year End

Five Year Trend – Fund Balance
Budget Work Session 12/13/2017 Presented by JoLynn Berge 26
$1.4 M $1.3 M $1.4 M $1.6 M $3.5 M$2.7 M $3.7 M $4.7 M $5.1 M$7. M
$18.1 M $19.7 M$21.8 M $23.3 M
$22.6 M
$25.1 M$24.7 M
$33.8 M
$45. M
$56.6 M
$1.8 M$2.8 M
$3.4 M
$3.1 M
$4.2 M
Total Ending,$49. M
Total Ending, $52.1 M
Total Ending,$65. M
Total Ending, $78.1 M
Total Ending, $94. M
K
$10. M
$20. M
$30. M
$40. M
$50. M
$60. M
$70. M
$80. M
$90. M
$100. M
2012-13 2013-14 2014-15 2015-16 2016-17
Nonspendable Restricted Committed Assigned Unassigned Total Ending

Category of Fund Balance
Amount Description
Nonspendable $3,527,573 Inventory and Prepaid Items
Restricted $7,009,467 Grant carryforward
Committed $22,600,000 Economic Stabilization Fund (3%)
Assigned $56,630,212 Detail on next slide
Unassigned $4,233,508 Unassigned Fund Balance
2016-17 Ending Fund Balance
Budget Work Session 12/13/2017 Presented by JoLynn Berge 27

Description AmountSchool Non-Staff (WSS) Carry Forward $2,304,159School Self Help Carry Forward $3,895,906Central Baseline Carry Forward $2,442,423Central Self Help Carry Forward $1,609,018Carry Forward Advances $2,760,887Funds to Balance 2017-18 Budget $29,850,526Legal Settlements and Outside Counsel $3,767,2922016-17 Underspend to Balance 2018-19 / 2019-20 Budgets $10,000,000
Total Assigned Fund Balance $56,630,212
Assigned Fund Balance
Budget Work Session 12/13/17Presented by JoLynn Berge 28
Note: Amounts may not total due to rounding
Current Projections for 2018-19 Budget and Beyond
Budget Work Session 12/13/2017 Presented by JoLynn Berge 29

• October 25, 2017 - Budget Work Session• November 29, 2017 - Budget Work Session
– Review 2016-17 final numbers
• December 13, 2017 - Budget Work Session• January 10, 2018 - Budget Work Session to review recommendations
– Review WSS Changes– Review Overall major budget changes
• January 8 to March 8??? - State Legislative Session• January 24, 2018 - Budget Work Session
– Consensus on budget
• January 15 to February 16 - Central budgets developed• February 28, 2018 - Budget Allocations to Schools/ Budget Work Session• March 28, 2018 - Budget Work Session• May 2018 - Final General Fund Balancing, Budget Book development• May 2, 2018 - Budget Work Session• June 11, 2018 - Board Action Report and Budget Resolution to A&F• June 27, 2018 - Introduce Budget to Board• July 2018 – Required Public Hearing• July 11, 2018 - Board Action to adopt school year 2018-19 budget
FY 2018-19 Budget Development Calendar
30Budget Work Session 12/13/2017 Presented by JoLynn Berge

Transportation Revenues and ExpendituresSchool Year 2014-15 2015-16 2016-17 2017-18 budget Projected for 2018-19Total Revenue 34,865,962$ 32,005,244$ 33,405,497$ 35,557,207$ 35,557,207$ Revenue Other Districts 193,981$ 161,890$ 535,761$ 200,000$ 200,000$ City Two Tier -$ -$ -$ 2,300,000$ -$ Total Expenditures 30,937,085$ 33,228,957$ 34,850,267$ 37,478,479$ 38,602,833$ Suplus (Deficit) 4,122,858$ (1,061,823)$ (909,009)$ 578,728$ (2,845,626)$
Transportation Funding
Budget Work Session 12/13/2017 Presented by JoLynn Berge 31

0.00
1.00
2.00
3.00
4.00
$5.00
2017
$3.39
2018
$4.11
2019 2020
State Schools Status Quo
State Schools Increase
SPS M&O/ Enrichment Levy
Dolla
rs (R
ate
per $
1,00
0 AV
)
$4.16
F&E + Pre- School Levy
SPS M&O Levy
Authority Reduction
$4.15
d
Levy Change - Tax Impact on Seattle Voters
32
$3.55 $3.50Reduction
in SPS levy
authority
Source: David Hennes analysis “School Funding Impact Analysis Updated_11-14-2017.xls”
Tax Revenue per $1,000 of Assessed Home Value• By 2020, the total
property tax burden with HB2242 is expected to be $3.55, an increase of $.16 per $1,000 of assessed home value over 2017
• By 2019 SPS is restricted to raising the max of $2,500 per student or $1.50* per $1,000 of AV and as a result the SPS M&O levy declines by ($.61) per $1,000 of assessed home value ($4.16-$3.55)
2018 tax
increase to
$2.70 per
$1,000
In 2019, the SPS levy will decrease, however the total levy rate per $1,000 of assessed home value (AV) is still higher than 2017
Budget Work Session 12/13/2017 Presented by JoLynn Berge
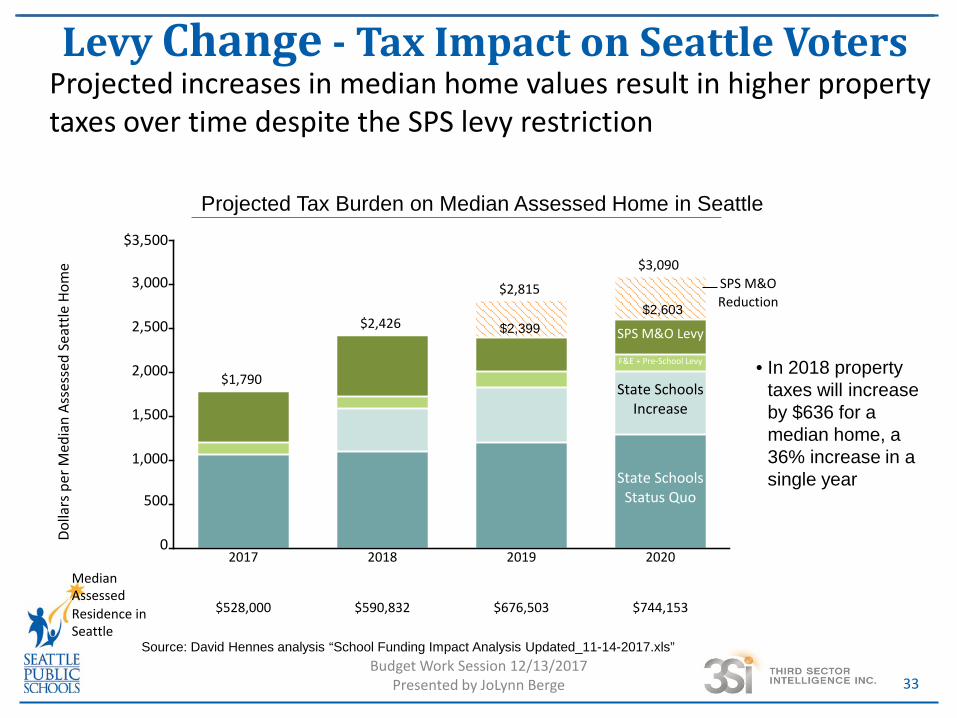
Projected increases in median home values result in higher property taxes over time despite the SPS levy restriction
Levy Change - Tax Impact on Seattle Voters
33
0
500
1,000
1,500
2,000
2,500
3,000
$3,500
2017 2018 2019 2020
State Schools Status Quo
State Schools Increase
F&E + Pre-School Levy
SPS M&O Levy
$528,000 $590,832 $676,503 $744,153
Median Assessed Residence in Seattle
Dolla
rs p
er M
edia
n As
sess
ed S
eatt
le H
ome
$1,790
$2,426
$2,815 SPS M&O Reduction
$3,090
• In 2018 property taxes will increase by $636 for a median home, a 36% increase in a single year
$2,399$2,603
Source: David Hennes analysis “School Funding Impact Analysis Updated_11-14-2017.xls”
Projected Tax Burden on Median Assessed Home in Seattle
Budget Work Session 12/13/2017 Presented by JoLynn Berge

0
25
50
75
100
$125K
Certificated Administrative Satff
63
93
116118
Certificated Instructional Staff
53
7078 80
Classified Staff
39
47
56 57
Dolla
rs
SY 17-18 SY 18-19 SY 19-20 SY 20-21
SPS will receive increases in state allocations per staff type over the next two biennium
SPS Impact: Salary Allocation Increases
34
*Allocations in the chart starting in SY 18-19 include Seattle’s regionalization factor. Total final salaries are normalized to 1 FTE. Source: SY 2017-18 - Seattle Public Schools October Apportionment Report, SY 18-19 – 19-20 - OPSI Multi-Year Tool, Average total final salary – Seattle Public Schools
$ 128,544 Average Total CAS Salary (SY 17-18)
$76,958 Average Total CIS Salary (SY 17-18)
$62,193 Average Total CLS Salary(SY 17-18)
State Salary Allocations* for SPS by Staff Type
• In SY 18-19 new allocations are a flat amount per staff type with a regionalization factor applied (SPS’ regionalization factor is 1.18)
• Estimated salaries by SY 20-21 - CAS $139,840- CIS $82,731- CLS $66,858
Budget Work Session 12/13/2017 Presented by JoLynn Berge

FY18-19 Projected Budget
35Budget Work Session 12/13/2017 Presented by JoLynn Berge
FY18-19 Major Budget Changes (Dollars in Millions) Surplus/(GAP)Items Required or Previously DecidedMaterials, Supplies, Operating Costs (MSOC) $1.20 State Salary Allocations $86.70 Operations Levy $21.70 Operations Levy $2,500/fte vs status quo ($60.50)Grades K-3 Student:Teacher ratio ($14.40)Grades K-3 Assistant Principals ($1.20)24 Credit Graduation ($9.00)Labor cost increases ($15.10)City of Seattle two-tier busing grant expires ($2.30)Onetime Funds to balance FY17-18 ($29.90)Items funded for FY17-18 only $6.00 Ongoing Legislative funding not planned for expenditures in 2017-18 $11.20 Items < $1.0M ($4.50)FY18-19 Current Budget GAP ($10.10)
Items that need a decisionInstructional Materials adoptions ($5.00)WSS ($4.00)SMART GOALS/Formula for Success ($3.00)Fall enrollment/Equity Funds ($2.00)Increase Economic Stabilization Fund above minimum 3% to 3.6% ($4.50)Non-Capital infrastructure ($4.00)Sub total ($22.50)Total Projected Deficit ($32.60)

FY18-19 Potential Solutions
36Budget Work Session 12/13/2017 Presented by JoLynn Berge
FY18-19 Current Budget Gap (Dollars in Millions) $(32.60)
Onetime use of FY17-18 Legislative resources carried forward $ 11.2
Onetime use of FY16-17 Assigned Fund Balance ($10m split over 2 years) $ 5.0
Onetime use of FY16-17 Unassigned Fund Balance $ 4.0
FY17-18 Projected underspend $ 12.4
FY18-19 Budget GAP balance after solutions $ -

FY19-20 Projected Budget
37Budget Work Session 12/13/2017 Presented by JoLynn Berge
FY19-20 Current Budget Gap (Dollars in Millions) Surplus/(Gap) Materials, Supplies, Operating Costs (MSOC) $1.30 State Salary Allocations $55.30 National Board Certified Teacher bonus ($3.60)Operations Levy $2,500/fte in 2019, $2,545/fte in 2020 ($43.20)Labor cost increases ($12.10)WSS Enrichment ($1.00)Core Staff and Operating Costs for opening Lincoln HS ($2.10)Onetime Funds to balance FY18-19 ($32.60)FY19-20 Current Budget GAP ($38.00)
*Updated Slide

FY20-21 Projected Budget
38Budget Work Session 12/13/2017 Presented by JoLynn Berge
FY20-21 Current Budget Gap (Dollars in Millions) Surplus/(Gap) Materials, Supplies, Operating Costs (MSOC) $1.40 State Salary Allocations $10.30 Operations Levy $2,545/fte in 2020, $2,593/fte in 2021 $4.50 Labor cost increases ($12.90)WSS Enrichment ($1.00)Onetime Funds to balance FY19-20 ($38.00)Items < $1.0M ($0.60)FY20-21 Current Budget GAP ($36.30)
*Updated Slide

• Final list of SMART Goal 3 – Program Summaries for 2017-18
• Understanding of 2016-17 Year End
• Understanding of current projection for 2018-19 and beyond
Outcomes
Budget Work Session 12/13/2017 Presented by JoLynn Berge 39